Embed Size (px)
Citation preview

http://www.diva-portal.org
This is the published version of a paper published in .
Citation for the original published paper (version of record):
Soares, R. (2018)An Experimental Setup with Alternating Current Capability for Evaluating LargeLithium-Ion Battery CellsBatterieshttps://doi.org/10.3390/batteries4030038
Access to the published version may require subscription.
N.B. When citing this work, cite the original published paper.
Permanent link to this version:http://urn.kb.se/resolve?urn=urn:nbn:se:kth:diva-233339
batteries
Article
An Experimental Setup with Alternating CurrentCapability for Evaluating Large Lithium-IonBattery Cells
Rudi Soares 1,* , Alexander Bessman 2 , Oskar Wallmark 1 , Göran Lindbergh 2 andPontus Svens 3
1 School of Electrical Engineering and Computer Science, KTH Royal Institute of Technology,SE-100 44 Stockholm, Sweden; [email protected]
2 School of Engineering Sciences in Chemistry, Biotechnology and Health, KTH Royal Institute of Technology,SE-100 44 Stockholm, Sweden; [email protected] (A.B.); [email protected] (G.L.)
3 Scania AB, SE-151 87 Södertälje, Sweden; [email protected]* Correspondence: [email protected]; Tel.:+46-72-9494-905
Received: 20 July 2018; Accepted: 6 August 2018; Published: 13 August 2018
Abstract: In the majority of applications using lithium-ion batteries, batteries are exposed to someharmonic content apart from the main charging/discharging current. The understanding of the effectsthat alternating currents have on batteries requires specific characterization methods and accuratemeasurement equipment. The lack of commercial battery testers with high alternating currentcapability simultaneously to the ability of operating at frequencies above 200 Hz, led to the design ofthe presented experimental setup. Additionally, the experimental setup expands the state-of-the-artof lithium-ion batteries testers by incorporating relevant lithium-ion battery cell characterizationroutines, namely hybrid pulse power current, incremental capacity analysis and galvanic intermittenttitration technique. In this paper the hardware and the measurement capabilities of the experimentalsetup are presented. Moreover, the measurements errors due to the setup’s instruments were analysedto ensure lithium-ion batteries cell characterization quality. Finally, this paper presents preliminaryresults of capacity fade tests where 28 Ah cells were cycled with and without the injection of 21 Aalternating at 1 kHz. Up to 300 cycles, no significant fade in cell capacity may be measured, meaningthat alternating currents may not be as harmful for lithium-ion batteries as considered so far.
Keywords: alternating current; aging; battery testing; electric vehicles; GITT; HPPC; life cycle;lithium-ion batteries; ripple; SOC
1. Introduction
Today, lithium-ion batteries (LIBs) are by far the most common energy storage solutions inmobile devices such as electric vehicles (EVs), drones, computers, and phones. Thanks to recentadvances in LIB technology the EV market is growing, a trend that is expected to continue [1]. With thegrowth of the LIB market, LIB testing instruments, LIB characterization and modeling methods,as well as, measuring techniques applied to LIBs may be improved. Specifically, techniques suchas hybrid pulse power current (HPPC), incremental capacity analysis (ICA), galvanic intermittenttitration technique (GITT), and electrochemical impedance spectroscopy (EIS) can advance LIB testers.Nonetheless, these techniques demand modern instrumentation and measurement accuracy.
LIBs are designed and operated under dc current principles [2], and for that reason traditionallyac currents have been recommended to be reduced by manufactures [3]. Therefore, the main LIBtechnological advances have been focusing essentially in dc current related features, like for instancelife cycle or charge acceptance. Probably for this reason, for large LIB cells intended for automotive
Batteries 2018, 4, 38; doi:10.3390/batteries4030038 www.mdpi.com/journal/batteries
Batteries 2018, 4, 38 2 of 14
applications, particularly for frequencies above 200 Hz, no LIB tester with ac current capability can befound among major manufactures [4–7], leading to tailor-made LIB testers like the one described in [8]and in this paper. However, in real applications LIBs unavoidably have to interact with switch-modepower converters (SMPC). Subsequently, this means that LIBs may be subjected to a wide variety ofharmonic currents. An example of this can be seen in [9] where it is reported that frequencies from150 Hz to up to several kHz, with magnitudes up to 17 A, were observed in a commercial hybrid bus.Even though off-the-shelf commercial testers with the above mentioned ac current capability cannot befound on the market, research requiring them has become popular in recent years. Different examplescan be found in the literature. For instance, in [10–12], the impact of ac currents on the life expectancyof LIBs is investigated. In [13–16], ac currents superimposed to the dc currents were used in anattempt to improve charging performance. In [17] it is reported that charge acceptance has increasedin lead-acid batteries by pre-commissioning them with ac current. In [18–21], ac current is used as aheating mechanism for subzero temperature battery applications. In this context, considering largeLIB cells intended to be used in the automotive sector, an experimental setup was designed to enableinvestigations related to the above mentioned topics.
This paper details the design and performance of an experimental setup with ac current capabilityfor evaluating large LIB cells. The evaluation of LIB cell performance depends on characterizationmethods which may be repetitive and often time consuming [22]. Additionally, for a fair cell performancecomparison, the characterization methods must be carried out with precise voltage and currentmeasurements. Thus, this paper focuses on the precision of such measurements and on their impact onthe different characterization methods. The experimental setup accommodates the most relevant LIBcell characterization methods: capacity and energy efficiency characterizations, HPPC, ICA, and GITT,experimental tests procedures which are shown in this paper.
The paper is organized as follows: In Section 2.1, the design of the power system is presented;in Section 2.2, the instruments used for the measurement system are presented, and measurement errorsof the setup are addressed; in Section 2.3, the coordination between the power and the measurementsystems required to ensure safe operation is explained. In Section 3, LIB cells at beginning of life (BOL) areused to test the setup’s performance when operated with the different characterization methods (capacitycycle, HPPC, ICA, and GITT). Finally, in Section 4, preliminary capacity fading results are presented.
2. Experimental Setup and Implemented Configuration
The setup was designed to test LIB cells intended for EV traction applications with large chargingrates (C-rate), i.e., 28 Ah. C-rate may be defined as the rate of discharge current from a full energycharge to an entire energy discharge in one hour. The experimental setup specifications can be foundin Table 1. To safely achieve the specifications of Table 1, the setup configuration depicted in Figure 1was constructed.
Table 1. Experimental setup specification summary.
Targeted Cell Capacity 28 Ah
Simultaneous cells 16
Controlled temperature Yes
Availability 24 h—7 days—during months
Operation modes Cycling, HPPC, ICA, GITT
dc current 60 A per channel
ac current 60 Apeak per channel
Ripple waveform shape Flexible up to 2 kHz, triangular up to 70 kHz
Batteries 2018, 4, 38 3 of 14
4x DCG
16x Channels
Climate
chamber16x R-shunt Multiplexer
. . .
Voltage senseCurrent senseTemperature senseCAN bus
Digital signalsHeartbeat
10x CRG
GSM
PXIe Safety Card
Safety system
100A
fuse Safety command
Power system
Measurements and instrumentations
10x LC filter
SCPI command
Prog.
power
supply
Power cables
Power
supply (24V)
Lead-acid
battery
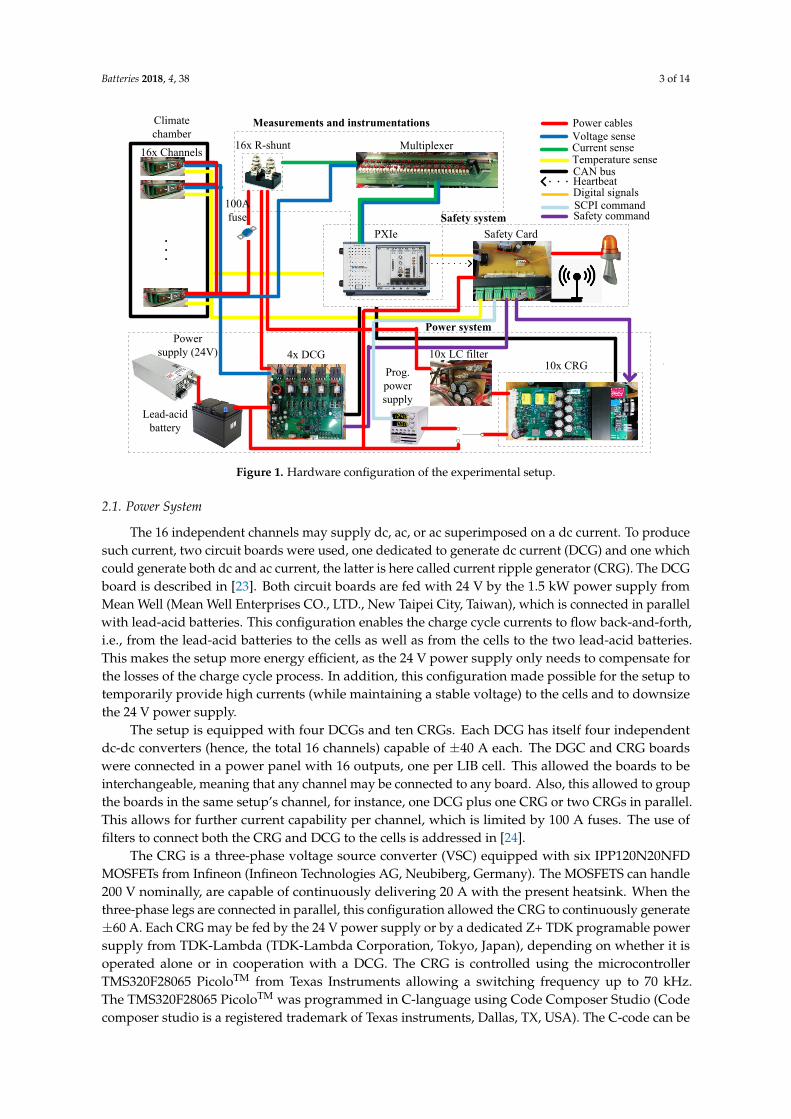
Figure 1. Hardware configuration of the experimental setup.
2.1. Power System
The 16 independent channels may supply dc, ac, or ac superimposed on a dc current. To producesuch current, two circuit boards were used, one dedicated to generate dc current (DCG) and one whichcould generate both dc and ac current, the latter is here called current ripple generator (CRG). The DCGboard is described in [23]. Both circuit boards are fed with 24 V by the 1.5 kW power supply fromMean Well (Mean Well Enterprises CO., LTD., New Taipei City, Taiwan), which is connected in parallelwith lead-acid batteries. This configuration enables the charge cycle currents to flow back-and-forth,i.e., from the lead-acid batteries to the cells as well as from the cells to the two lead-acid batteries.This makes the setup more energy efficient, as the 24 V power supply only needs to compensate forthe losses of the charge cycle process. In addition, this configuration made possible for the setup totemporarily provide high currents (while maintaining a stable voltage) to the cells and to downsizethe 24 V power supply.
The setup is equipped with four DCGs and ten CRGs. Each DCG has itself four independentdc-dc converters (hence, the total 16 channels) capable of ±40 A each. The DGC and CRG boardswere connected in a power panel with 16 outputs, one per LIB cell. This allowed the boards to beinterchangeable, meaning that any channel may be connected to any board. Also, this allowed to groupthe boards in the same setup’s channel, for instance, one DCG plus one CRG or two CRGs in parallel.This allows for further current capability per channel, which is limited by 100 A fuses. The use offilters to connect both the CRG and DCG to the cells is addressed in [24].
The CRG is a three-phase voltage source converter (VSC) equipped with six IPP120N20NFDMOSFETs from Infineon (Infineon Technologies AG, Neubiberg, Germany). The MOSFETS can handle200 V nominally, are capable of continuously delivering 20 A with the present heatsink. When thethree-phase legs are connected in parallel, this configuration allowed the CRG to continuously generate±60 A. Each CRG may be fed by the 24 V power supply or by a dedicated Z+ TDK programable powersupply from TDK-Lambda (TDK-Lambda Corporation, Tokyo, Japan), depending on whether it isoperated alone or in cooperation with a DCG. The CRG is controlled using the microcontrollerTMS320F28065 PicoloTM from Texas Instruments allowing a switching frequency up to 70 kHz.The TMS320F28065 PicoloTM was programmed in C-language using Code Composer Studio (Codecomposer studio is a registered trademark of Texas instruments, Dallas, TX, USA). The C-code can be
Batteries 2018, 4, 38 4 of 14
found in appendix C of [25]. The generated ac current is achieved using a proportional integral (PI)close-loop current control and pulse width modulation (PWM). The CRG’s output current is filtered bya low pass LC filter to minimize the current ripple due to switching action of the CRG. The differentcurrent shapes, namely sinusoidal, triangular, and square, were pre-programmed and may be selectedin the setup’s graphical user interface.
The DCGs and CRGs are both controlled via CAN by means of a National Instruments (NI)PXIe-8513 CAN card (National Instruments Corporation, Austin, TX, USA). This communicationprotocol was chosen because CAN is recommenced in EV traction applications [26]. Details of theCAN implementation can be found in [27].
2.2. Measurements and Instrumentations
The current and the cell voltage are measured at a sample rate of 4 MHz with the NI PXIe-6124data acquisition card. The card input voltage range is set to ±5 V. Considering that the bit resolution ofthe PXIe-6124 is 16 bits, the corresponding voltage resolution is 150 µV/bit. The current is measuredby measuring the voltage across a shunt resistor with a resistance of 500 µΩ (±0.25%) and a currentrating of 100 A. The reason for selecting shunt resistors is related with the fact that shunt resistorsallow the measured signals to be acquired with virtually infinite bandwidth, i.e., no magnitudeattenuation and no artificial phase shift displacement. This is an important feature when measuringhigh frequency signals (on this application on the range of 100 kHz) simultaneously with a dc signal.Additionally, in order to test very low impedance cells, accurate acquisition of the voltage/currentphase shift is crucial for EIS testing, a functionality that is planned in a future upgrade of the setup.To mitigate the noise and phase shift distortion in the current and voltage signals, each signal wastransmitted to the PXIe-6124 using a dedicated shielded cable with twisted pair wires and floatingground. However, this measurement method makes the amplitude of the signal low and thereforenoise permeable. Thus, the voltage across the shunt resistors is amplified 50 times and low-passfiltered (with a cut-off frequency at 2 MHz) using a LT1999-50 linear amplifier (from Linear TechnologyCorporation, Milpitas, CA, USA) with 0.5% gain accuracy. This signal is then measured differentiallysimultaneously with the cell voltage (also measured differentially) by the NI PXIe-6124.
Offset Analyses and Compensation
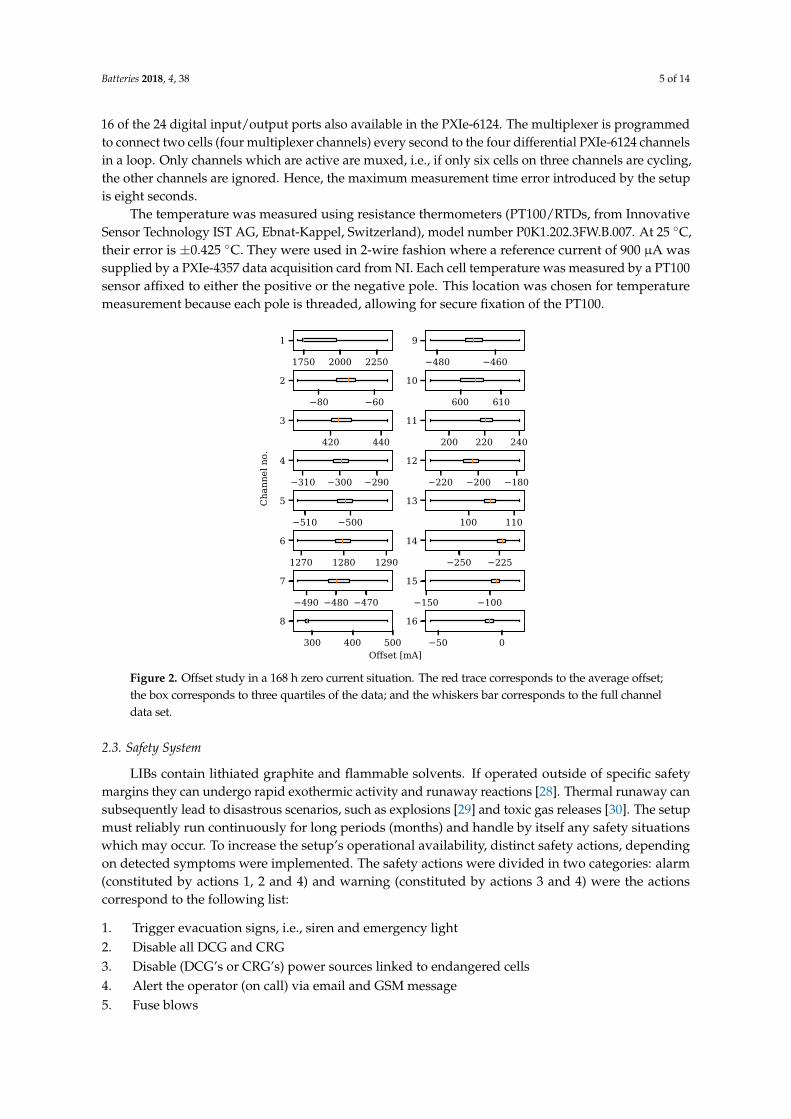
The LT-1499-50 revealed to have large variations in offset and amplification. As the temperaturechanged during the day the performance of the LT-1499-50 changed as well. Figure 2 is a box-and-whiskersplot illustrating the current offset and its variance during 168 h of data. The 168 h offset test was carriedout with no cells, meaning that the current measured through the shunt resistor was zero A. As it canbe seen in Figure 2, different offsets, some of them with hundreds of mA and considerable variances,were recorded for the several channels.
Without compensation for this error, the current measurement would jeopardize the state ofcharge control and subsequently all the characterization studies. For this reason, an hourly offsetmeasurement was implemented which automatically compensated for this error.
The maximum error of the current measurement was estimated by comparing the setup’s currentmeasurement with a reference ammeter. The reference ammeter had a specified error of up to ±1%currents up to 10 A (its maximum rated current). The largest deviation between the two measurementswas 50 mA, which means that the maximum error of the setup’s current measurement is 50 mA plusthe maximum error of the reference (0.01 × 10 A which is equal to 100 mA), i.e., 150 mA out of the10 A which is ±1.5%.
Considering that each pair of voltage/current must be measured simultaneously, and the setuphas 16 channels, the PXIe-6124’s four channels are insufficient for measuring the 32 measurementssimultaneously. For this reason, a multiplexer using IM06 relays from TE connectivity (TE connectivity,Schaffhausen, Switzerland) was designed. The multiplexer has 32 channels which are commanded inpairs (i.e., 16 voltage/current pairs, each pair corresponding to a single cell). They are controlled by
Batteries 2018, 4, 38 5 of 14
16 of the 24 digital input/output ports also available in the PXIe-6124. The multiplexer is programmedto connect two cells (four multiplexer channels) every second to the four differential PXIe-6124 channelsin a loop. Only channels which are active are muxed, i.e., if only six cells on three channels are cycling,the other channels are ignored. Hence, the maximum measurement time error introduced by the setupis eight seconds.
The temperature was measured using resistance thermometers (PT100/RTDs, from InnovativeSensor Technology IST AG, Ebnat-Kappel, Switzerland), model number P0K1.202.3FW.B.007. At 25 C,their error is ±0.425 C. They were used in 2-wire fashion where a reference current of 900 µA wassupplied by a PXIe-4357 data acquisition card from NI. Each cell temperature was measured by a PT100sensor affixed to either the positive or the negative pole. This location was chosen for temperaturemeasurement because each pole is threaded, allowing for secure fixation of the PT100.
1750 2000 2250
1
480 460
9
80 60
2
600 610
10
420 440
3
200 220 240
11
310 300 290
4
220 200 180
12
510 500
5
100 110
13
1270 1280 1290
6
250 225
14
490 480 470
7
150 100
15
300 400 500
8
50 0
16
Offset [mA]
Cha
nnel
no.
Figure 2. Offset study in a 168 h zero current situation. The red trace corresponds to the average offset;the box corresponds to three quartiles of the data; and the whiskers bar corresponds to the full channeldata set.
2.3. Safety System
LIBs contain lithiated graphite and flammable solvents. If operated outside of specific safetymargins they can undergo rapid exothermic activity and runaway reactions [28]. Thermal runaway cansubsequently lead to disastrous scenarios, such as explosions [29] and toxic gas releases [30]. The setupmust reliably run continuously for long periods (months) and handle by itself any safety situationswhich may occur. To increase the setup’s operational availability, distinct safety actions, dependingon detected symptoms were implemented. The safety actions were divided in two categories: alarm(constituted by actions 1, 2 and 4) and warning (constituted by actions 3 and 4) were the actionscorrespond to the following list:
1. Trigger evacuation signs, i.e., siren and emergency light2. Disable all DCG and CRG3. Disable (DCG’s or CRG’s) power sources linked to endangered cells4. Alert the operator (on call) via email and GSM message5. Fuse blows
Batteries 2018, 4, 38 6 of 14
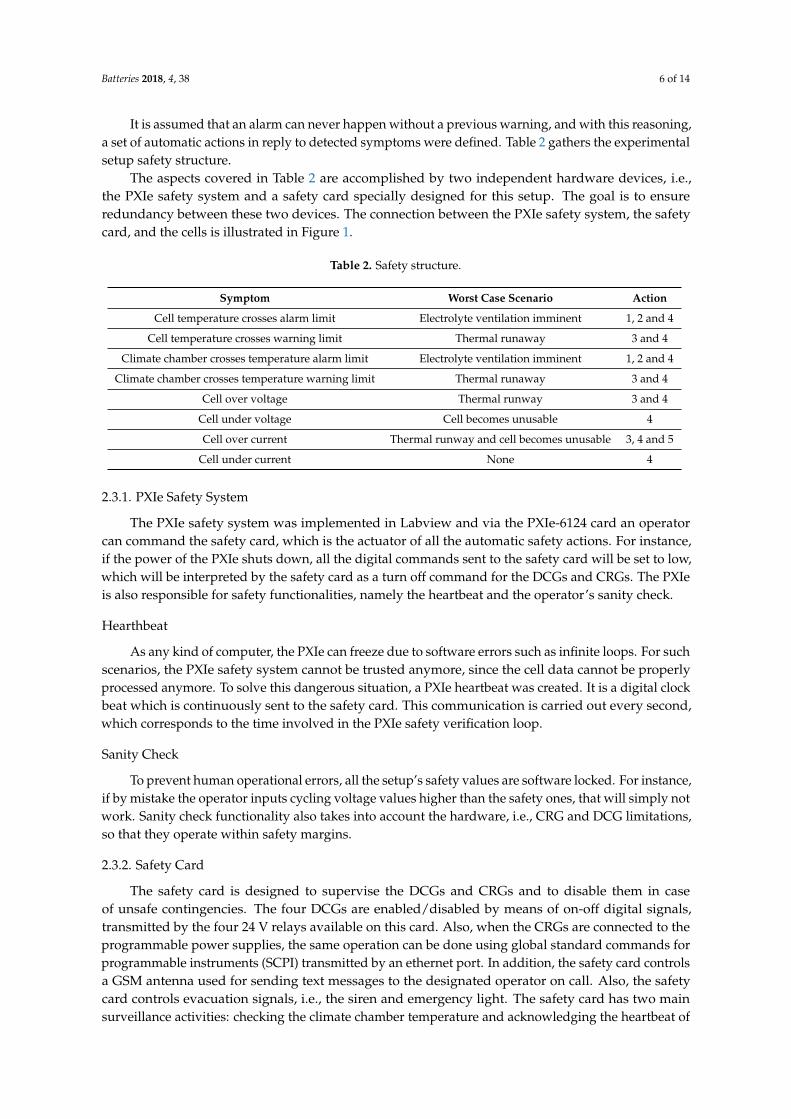
It is assumed that an alarm can never happen without a previous warning, and with this reasoning,a set of automatic actions in reply to detected symptoms were defined. Table 2 gathers the experimentalsetup safety structure.
The aspects covered in Table 2 are accomplished by two independent hardware devices, i.e.,the PXIe safety system and a safety card specially designed for this setup. The goal is to ensureredundancy between these two devices. The connection between the PXIe safety system, the safetycard, and the cells is illustrated in Figure 1.
Table 2. Safety structure.
Symptom Worst Case Scenario Action
Cell temperature crosses alarm limit Electrolyte ventilation imminent 1, 2 and 4
Cell temperature crosses warning limit Thermal runaway 3 and 4
Climate chamber crosses temperature alarm limit Electrolyte ventilation imminent 1, 2 and 4
Climate chamber crosses temperature warning limit Thermal runaway 3 and 4
Cell over voltage Thermal runway 3 and 4
Cell under voltage Cell becomes unusable 4
Cell over current Thermal runway and cell becomes unusable 3, 4 and 5
Cell under current None 4
2.3.1. PXIe Safety System
The PXIe safety system was implemented in Labview and via the PXIe-6124 card an operatorcan command the safety card, which is the actuator of all the automatic safety actions. For instance,if the power of the PXIe shuts down, all the digital commands sent to the safety card will be set to low,which will be interpreted by the safety card as a turn off command for the DCGs and CRGs. The PXIeis also responsible for safety functionalities, namely the heartbeat and the operator’s sanity check.
Hearthbeat
As any kind of computer, the PXIe can freeze due to software errors such as infinite loops. For suchscenarios, the PXIe safety system cannot be trusted anymore, since the cell data cannot be properlyprocessed anymore. To solve this dangerous situation, a PXIe heartbeat was created. It is a digital clockbeat which is continuously sent to the safety card. This communication is carried out every second,which corresponds to the time involved in the PXIe safety verification loop.
Sanity Check
To prevent human operational errors, all the setup’s safety values are software locked. For instance,if by mistake the operator inputs cycling voltage values higher than the safety ones, that will simply notwork. Sanity check functionality also takes into account the hardware, i.e., CRG and DCG limitations,so that they operate within safety margins.
2.3.2. Safety Card
The safety card is designed to supervise the DCGs and CRGs and to disable them in caseof unsafe contingencies. The four DCGs are enabled/disabled by means of on-off digital signals,transmitted by the four 24 V relays available on this card. Also, when the CRGs are connected to theprogrammable power supplies, the same operation can be done using global standard commands forprogrammable instruments (SCPI) transmitted by an ethernet port. In addition, the safety card controlsa GSM antenna used for sending text messages to the designated operator on call. Also, the safetycard controls evacuation signals, i.e., the siren and emergency light. The safety card has two mainsurveillance activities: checking the climate chamber temperature and acknowledging the heartbeat of
Batteries 2018, 4, 38 7 of 14
the PXIe safety system. The software of the safety card reflects Table 2 and it is implemented using Cprogramming language on a microcontroller. The safety card is powered by a 24 V power supply inparallel with two lead-acid batteries with a capacity of hundreds of Ah. This means that in case of anenergy failure, the safety card will be able to continue operating for a very long time.
3. Experimental Setup in Operation
For the purpose of demonstrating the experimental setup in the different operation modes,commercial LIB cells with 28 Ah are tested at their BOL. The LIB’s cell positive electrodes were made ofLiNi1/3Mn1/3Co1/3O2 (NMC), while the negative electrodes were graphite. The electrolyte was a dimethylcarbonate/ethyl-methyl carbonate/diethyl carbonate/ethylene carbonate (DMC/EMC/DEC/EC) mixturewith lithium hexafluorophosphate (LiPF6) salt.
3.1. State of Charge Control
To follow the progress of capacity loss over time, one should define the concept of capacity sothe state of charge (SOC) cycle is precisely controlled. The cell’s full capacity is the amount of chargeextracted from a 100% SOC (defined at a specific voltage) all the way down to 0% (also defined at aspecific voltage). However, besides of defining upper and lower voltages, also a specific current hasto be defined in order to properly assess capacity. This is due to the fact that the higher the current,the more losses will occur. Subsequently, the higher the losses, the lower the cell voltage will be duringdischarge (and vice versa during charge).
The SOC control was implemented using the following method: the cells are charged withconstant current until their voltage exceeds a specified voltage, for instance 4.1 V. When the uppervoltage limit is reached, the charging changes from galvanostatic (constant current) to potentiostatic(constant voltage). The constant voltage charging is achieved simply by decreasing the current by 20%every time the upper voltage limit is exceeded. This continues until the current falls below 10% of itsinitial value. This charging pattern is known as the constant current constant voltage charging (CC-CV)method. At this point the cell is considered to be fully charged, i.e., SOC 100% and the discharge ofthe cell starts. Then, the cells are discharged with a constant current (CC) until their voltage hits aspecified value, for instance 3.0 V. At this voltage the cells are considered fully discharged, i.e., 0% SOC.Unlike during charge, no constant voltage mode is used at the end of discharge.
3.2. Capacity and Energy Efficiency Characterizations
LIB cells commonly have Columbic efficiencies above 99.9% [31], and therefore cell capacity maybe defined as
C =∫ td−t0
t0
id(t) dt, (1)
where t0 is the discharge starting time at 100% SOC, and td is the time needed for the cell to reach0% SOC. For the case that td − t0 is exactly one hour, then capacity may be addressed as C-rate.However, in this paper, capacity and energy efficiency characterizations are not normalized for onehour time base. In practice, the capacity may be calculated simply by multiplying the averageddischarged current by the total discharge time. For this reason, the capacity error may be calculatedconsidering the propagation of the current and time errors a
∆C ≤ C
√(∆II
)2+
(∆ttd
)2, (2)
where ∆I is the absolute error of the current measurement, I is the averaged discharged current, ∆t isthe absolute error for the time measurement.
Batteries 2018, 4, 38 8 of 14
Contrary to capacity, the definition of energy must consider losses and should be expressed interms of charge and discharge. It can be expressed as
Wd =∫ t0+td
t0
vd(t)id(t) dt (3)
Wc =∫ t1+tc
t1
vc(t)ic(t) dt, (4)
where the subscripts “c” and “d” indicate charge and discharge, respectively t1 is the charging startingtime at 0% SOC, and tc is the time needed for the cell to reach 100% SOC. Unlike capacity, energy cannotbe computed simply by multiplying an averaged current by an averaged voltage and a total time.Instead, because the power is integrated to obtain the energy using the trapezoidal rule [32], the errorassociated with Equations (3) and (4) should be expressed accordingly as
∆Wd ≤ ± Wd − tdNd
[pd(t0)− pd(td + t0)
2+
Nd−1
∑k=1
pd
(t0 + k
tdNd
)](5)
∆Wc ≤ ± Wc −tc
Nc
[pc(t1)− pc(tc + t1)
2+
Nc−1
∑k=1
pc
(t1 + k
tc
Nc
)], (6)
where pd=vd(t)id(t), pc=vc(t)ic(t), and Nd and Nc are the total number of samples acquired in thedischarge and charge periods respectively.
Finally, the cell’s energy efficiency ηW is found by accounting for the energy balance of a fullcycle with respect to the cell’s input energy. It can be expressed as
ηW = 1 − lossesWc
, (7)
where the losses correspond to Wc − Wd. Similarly, the error associated with the energy efficiency maybe expressed with the propagation of ηW’s quantities as
∆ηW ≤ ηWc
√(∆losseslosses
)2+
(∆Wc
Wc
)2(8)
∆losses ≤√(∆Wc)2 + (∆Wd)2. (9)
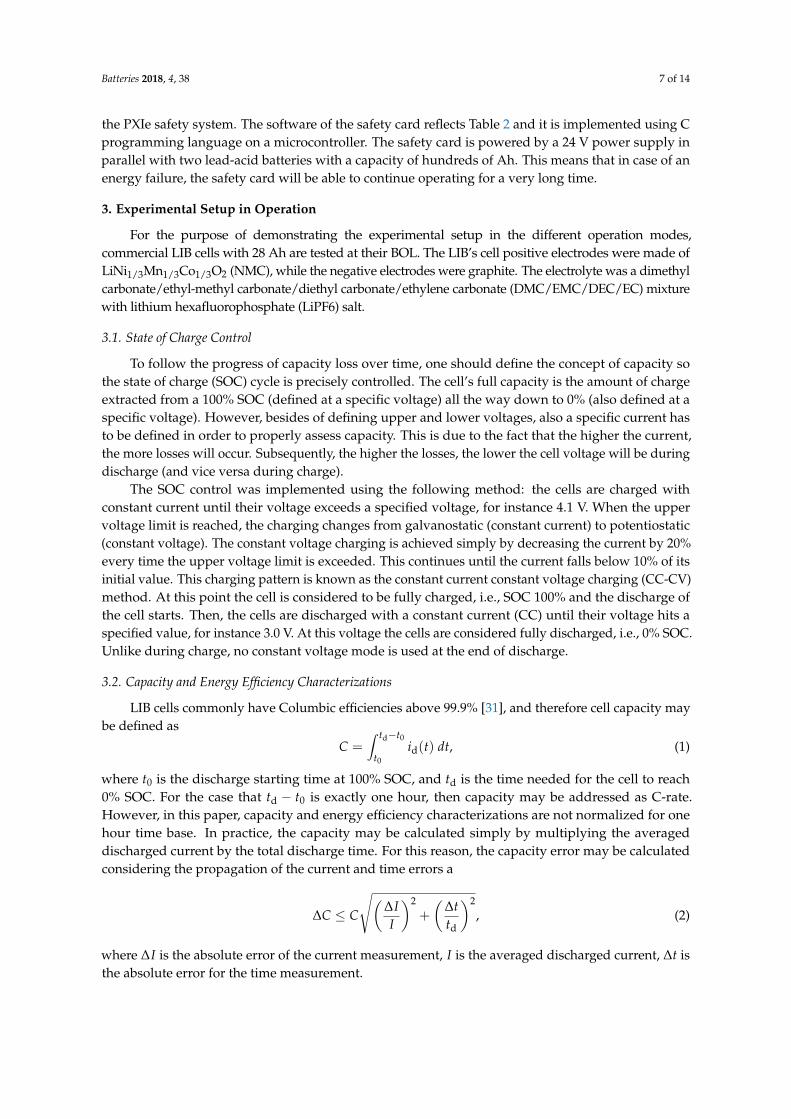
For a concrete idea of the experimental setup performance with regards to above mentionederrors, a full cycle as described in Section 3.2 was carried out to a LIB cell at its BOL. By measuring thevc, vd, ic, id, tc, td and applying the instrument errors of the experimental setup covered in Section 2.2,the results of the setup measurement errors for the 28 Ah cells may be summarized in Table 3.
Table 3. Experimental setup measurement errors.
Quantity Value Error
Averaged voltage during discharge 3.65 V ±150 µV
Average charging current 28.27 A ±0.42 A
Discharge time 3439 s ±8 s
Capacity 27.01 Ah ±0.41 Ah
Charge energy 101.23 Wh ±0.027 Wh
Discharge energy 98.68 Wh ±0.026 Wh
Energy efficiency 97.48% ±0.04%
Batteries 2018, 4, 38 9 of 14
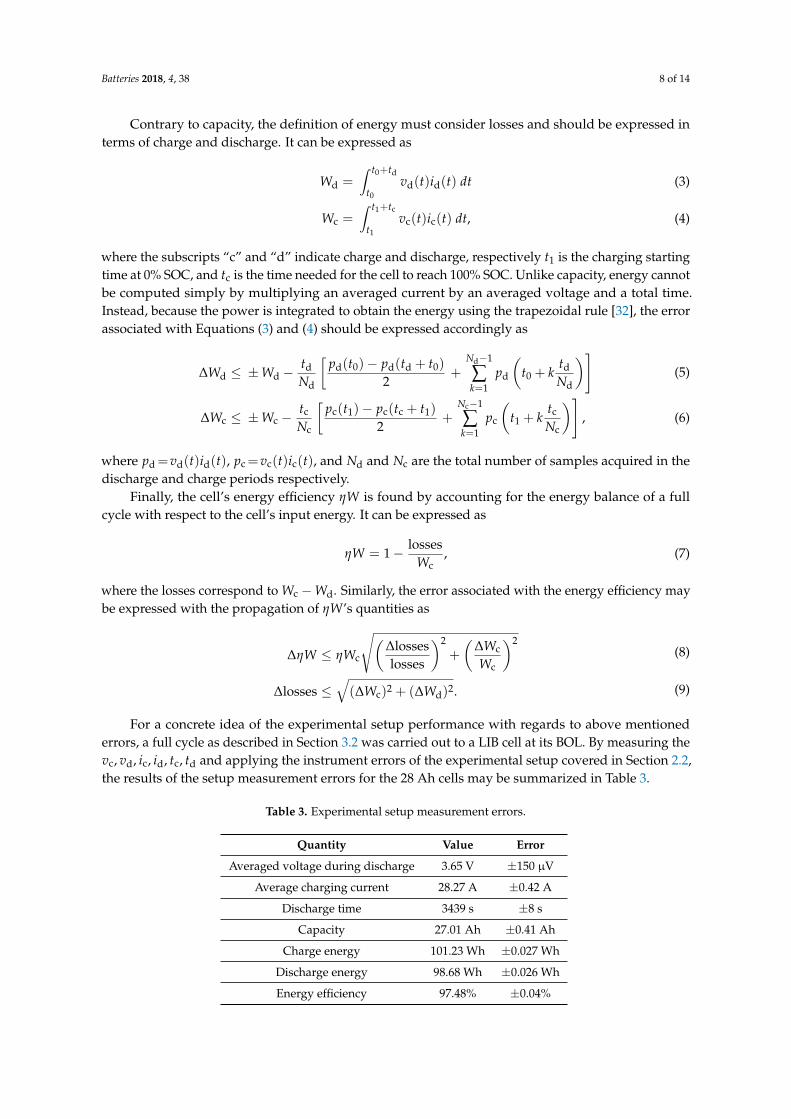
3.3. Hybrid Pulse Power Current
A hybrid pulse power characterization test (HPPC) is used to characterize the power capabilityand, specifically, to obtain the equivalent dc resistance of a cell [33]. In this operating mode, a large dccurrent (for the selected case corresponding to 2 C-rate, i.e., 56 A) is injected during two ten-secondpulses separated by one minute rest before, between, and after the pulses. The first pulse has positivecurrent while the second pulse is negative. The charging and discharging equivalent dc resistances(here called R0c and R0d ) are then defined by the ratio between the pulsed voltage (here called Vc(1) andVd(1)) and the measured current (here called Ic(1) and Id(1)) after one or ten seconds from the pulse start.For demonstrating the HPPC test, one second data is chosen. Hence, R0c and R0d may be expressed as
R0c = Vc(1)/Ic(1) ± R0c
√(∆VVc(1)
)2+
(∆IIc(1)
)2(10)
R0d = Vd(1)/Id(1) ± R0d
√(∆V
Vd(1)
)2+
(∆I
Id(1)
)2. (11)
Figure 3 shows the HPPC test carried out at 90% SOC.
0 50 100 150 200 250Time [s]
3.86
3.88
3.90
3.92
3.94
3.96
Volta
ge [V
]
60
40
20
0
20
40
60
Cur
rent
[A]
Figure 3. HPPC test carried out at 28 Ah NMC LIB cell at BOL.
Considering the data collected in the HPPC test, as well as the setup measurement precisions,one may calculate R0c and R0d as 0.779 mΩ ± 12.01 µΩ and 0.762 mΩ ± 11.73 µΩ respectively.
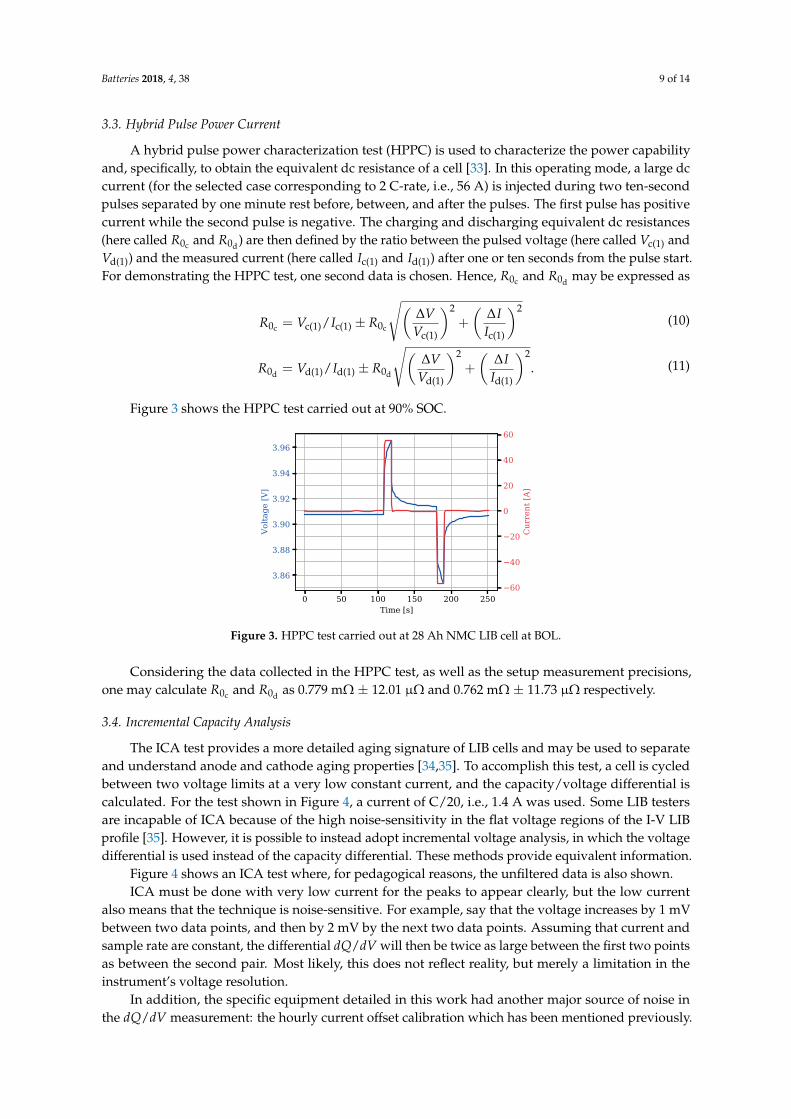
3.4. Incremental Capacity Analysis
The ICA test provides a more detailed aging signature of LIB cells and may be used to separateand understand anode and cathode aging properties [34,35]. To accomplish this test, a cell is cycledbetween two voltage limits at a very low constant current, and the capacity/voltage differential iscalculated. For the test shown in Figure 4, a current of C/20, i.e., 1.4 A was used. Some LIB testersare incapable of ICA because of the high noise-sensitivity in the flat voltage regions of the I-V LIBprofile [35]. However, it is possible to instead adopt incremental voltage analysis, in which the voltagedifferential is used instead of the capacity differential. These methods provide equivalent information.
Figure 4 shows an ICA test where, for pedagogical reasons, the unfiltered data is also shown.ICA must be done with very low current for the peaks to appear clearly, but the low current
also means that the technique is noise-sensitive. For example, say that the voltage increases by 1 mVbetween two data points, and then by 2 mV by the next two data points. Assuming that current andsample rate are constant, the differential dQ/dV will then be twice as large between the first two pointsas between the second pair. Most likely, this does not reflect reality, but merely a limitation in theinstrument’s voltage resolution.
In addition, the specific equipment detailed in this work had another major source of noise inthe dQ/dV measurement: the hourly current offset calibration which has been mentioned previously.
Batteries 2018, 4, 38 10 of 14
Although the setup was only shut off for calibration for approximately ten seconds per hour, that smallamount of time was enough for the cells under test to relax toward equilibrium ever so slightly.When the setup came back online, the voltage difference between each sample was momentarily muchhigher than normal as the cell returned to a polarized state. Fortunately, since this particular source ofnoise had a known frequency of 1/3600 Hz it was easy to filter out in post-processing of the data.
3.0 3.2 3.4 3.6 3.8 4.0Cell voltage [V]
100
75
50
25
0
25
50
75
100dQ
/dV
[Ah/
V]
Figure 4. ICA test carried out at 28 Ah NMC LIB cell at BOL.
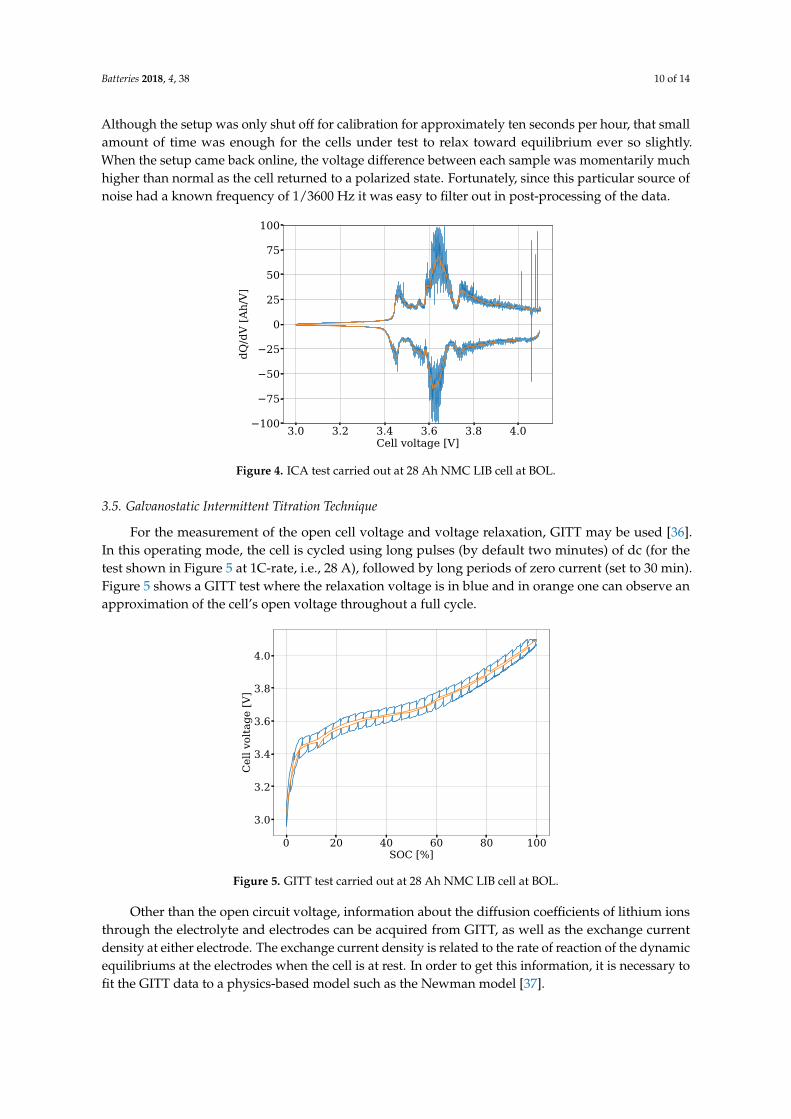
3.5. Galvanostatic Intermittent Titration Technique
For the measurement of the open cell voltage and voltage relaxation, GITT may be used [36].In this operating mode, the cell is cycled using long pulses (by default two minutes) of dc (for thetest shown in Figure 5 at 1C-rate, i.e., 28 A), followed by long periods of zero current (set to 30 min).Figure 5 shows a GITT test where the relaxation voltage is in blue and in orange one can observe anapproximation of the cell’s open voltage throughout a full cycle.
0 20 40 60 80 100SOC [%]
3.0
3.2
3.4
3.6
3.8
4.0
Cel
l vol
tage
[V]
Figure 5. GITT test carried out at 28 Ah NMC LIB cell at BOL.
Other than the open circuit voltage, information about the diffusion coefficients of lithium ionsthrough the electrolyte and electrodes can be acquired from GITT, as well as the exchange currentdensity at either electrode. The exchange current density is related to the rate of reaction of the dynamicequilibriums at the electrodes when the cell is at rest. In order to get this information, it is necessary tofit the GITT data to a physics-based model such as the Newman model [37].
Batteries 2018, 4, 38 11 of 14
4. Preliminary Capacity Fade Measurements
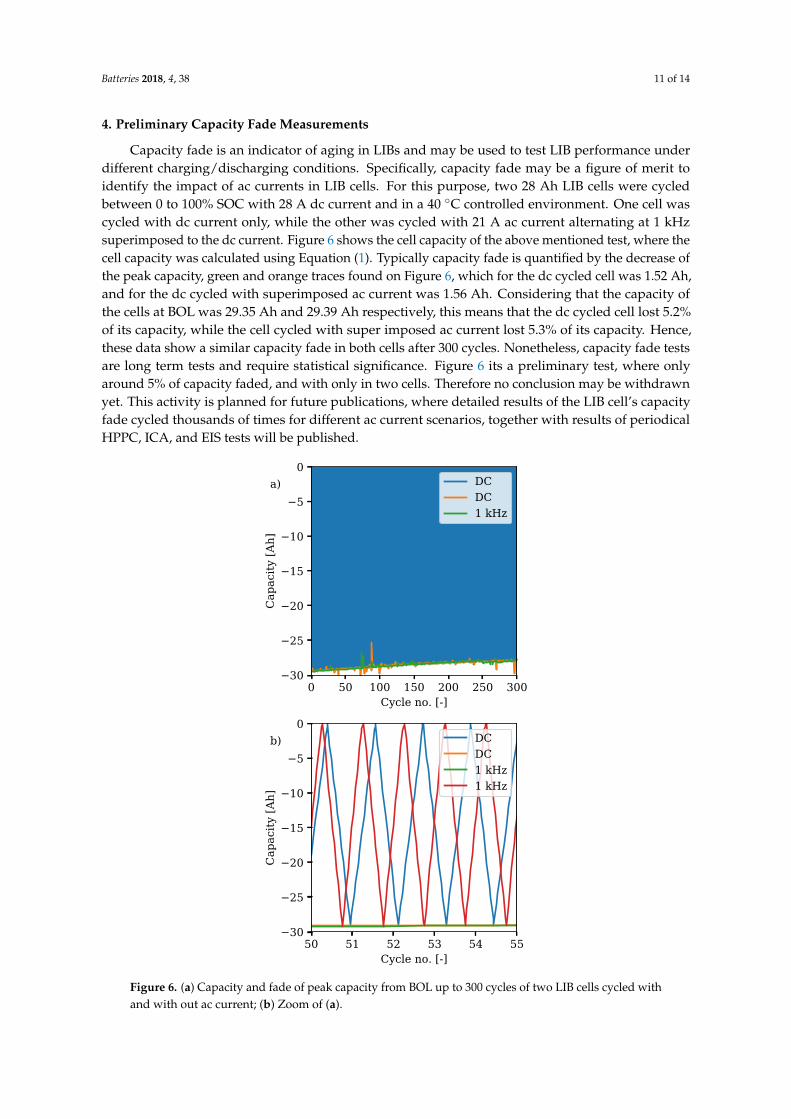
Capacity fade is an indicator of aging in LIBs and may be used to test LIB performance underdifferent charging/discharging conditions. Specifically, capacity fade may be a figure of merit toidentify the impact of ac currents in LIB cells. For this purpose, two 28 Ah LIB cells were cycledbetween 0 to 100% SOC with 28 A dc current and in a 40 C controlled environment. One cell wascycled with dc current only, while the other was cycled with 21 A ac current alternating at 1 kHzsuperimposed to the dc current. Figure 6 shows the cell capacity of the above mentioned test, where thecell capacity was calculated using Equation (1). Typically capacity fade is quantified by the decrease ofthe peak capacity, green and orange traces found on Figure 6, which for the dc cycled cell was 1.52 Ah,and for the dc cycled with superimposed ac current was 1.56 Ah. Considering that the capacity ofthe cells at BOL was 29.35 Ah and 29.39 Ah respectively, this means that the dc cycled cell lost 5.2%of its capacity, while the cell cycled with super imposed ac current lost 5.3% of its capacity. Hence,these data show a similar capacity fade in both cells after 300 cycles. Nonetheless, capacity fade testsare long term tests and require statistical significance. Figure 6 its a preliminary test, where onlyaround 5% of capacity faded, and with only in two cells. Therefore no conclusion may be withdrawnyet. This activity is planned for future publications, where detailed results of the LIB cell’s capacityfade cycled thousands of times for different ac current scenarios, together with results of periodicalHPPC, ICA, and EIS tests will be published.
0 50 100 150 200 250 300Cycle no. [-]
30
25
20
15
10
5
0
Cap
acity
[Ah]
a) DCDC1 kHz
50 51 52 53 54 55Cycle no. [-]
30
25
20
15
10
5
0
Cap
acity
[Ah]
b) DCDC1 kHz1 kHz
Figure 6. (a) Capacity and fade of peak capacity from BOL up to 300 cycles of two LIB cells cycled withand with out ac current; (b) Zoom of (a).
Batteries 2018, 4, 38 12 of 14
5. Conclusions and Future Work
In this paper, an experimental setup with alternating current capability for evaluating large LIB cellswas presented. The experimental setup showed marginal measurement errors at its incorporated LIB cellcharacterization routines, namely, cell capacity, cell charge and discharge energies, cell efficiency, HPPC,ICA, and GITT.
Twenty-eight-Ah NMC LIB cells are currently being cycled with and without the injection of 21 Aalternating at 1 kHz. From BOL up to 300 cycles, no significant cell capacity fade could be detectedbetween the tested cells, meaning that alternating currents may not have the harmful impact in LIB ascommonly assumed by the LIB manufactures. Upcoming publications will analyse in detail the dataresulting of different tests operating the presented experimental setup.
As an improvement, an in-built EIS functionality per channel may be an interesting up-grade,since it would allow online EIS measuring which would improve operationality.
Author Contributions: Conceptualization, R.S., A.B. and O.W.; Methodology, R.S. and A.B.; Software, R.S. andA.B.; Validation, O.W, G.L. and P.S.; Data Curation, R.S. and A.B.; Writing-Original Draft Preparation, R.S.;Writing-Review and Editing, R.S., A.B., O.W, G.L. and P.S.; Supervision, O.W, G.L. and P.S.; Funding Acquisition,O.W, G.L. and P.S.
Funding: This research was funded by the Swedish Energy Agency and Scania AB.
Conflicts of Interest: The authors declare no conflict of interest.
Abbreviations
The following abbreviations are used in this manuscript:
ac alternating currentBOL beginning of lifeCAN controller area networkCC constant currentCC-CV constant current constant voltageCRG current ripple generatordc direct currentDCG direct current generatorEIS electrochemical impedance spectroscopyEOL end of lifeEV electric vehiclesGITT galvanic intermittent titration techniqueGSM global system for mobileHPPC hybrid pulse power currentICA incremental capacity analysisLIB lithium-ion batteryMOSFET metal-oxide-semiconductor field-effect transistorNI national instrumentsNMC nickel manganese cobalt oxidePI proportional integral (control)PWM pulse width modulationRTD resistance temperature detectorSCPI standard commands for programmable instrumentsSMPC switch-mode power convertersSOC state of charge
Batteries 2018, 4, 38 13 of 14
References
1. Internatial Energy Agency (IEA). Technical Report: Global EV Outlook; IEA: Paris, France, 2017.2. Reddy, T. Linden’s Handbook of Batteries, 4th ed.; McGraw Hill Professional: New York, NY, USA, 2010.3. Nguyen, V.S.; Tran, V.L.; Choi, W.; Kim, D.W. Analysis of the output ripple of the DC-DC boost charger for
Li-ion batteries. J. Power Electron. 2014, 14, 135–142. [CrossRef]4. Digatron. Available online: http://www.digatron.com/en/automotive-battery/ (accessed on 16 July 2018).5. Arbin. Available online: http://www.arbin.com/products/battery-testing/cell-testing/ (accessed on
16 July 2018).6. Peccorp. Available online: http://www.peccorp.com/battery-testing-solutions/cell-testing/ (accessed on
16 July 2018).7. Maccor. Available online: http://www.maccor.com/Products/HevPhevEvTester.aspx (accessed on 16 July 2018).8. Weßkamp, P.; Haußmann, P.; Melbert, J. 600-A Test System for Aging Analysis of Automotive Li-Ion Cells
With High Resolution and Wide Bandwidth. IEEE Trans. Instrum. Meas. 2016, 65, 1651–1660. [CrossRef]9. Soares, R.; Bessman, A.; Wallmark, O.; Lindbergh, G.; Svens, P. Measurements and analysis of battery
harmonic currents in a commercial hybrid vehicle. In Proceedings of the 2017 IEEE TransportationElectrification Conference and Expo (ITEC), Chicago, IL, USA, 22–24 June 2017; pp. 45–50.
10. Marracci, M.; Tellini, B.; Liebfried, O.; Brommer, V. Experimental tests for Lithium batteries dischargedby high power pulses. In Proceedings of the 2015 IEEE International Instrumentation and MeasurementTechnology Conference (I2MTC), Pisa, Italy, 11–14 May 2015; pp. 1063–1067.
11. Uddin, K.; Moore, A.D.; Barai, A.; Marco, J. The effects of high frequency current ripple on electric vehiclebattery performance. Appl. Energy 2016, 178, 142–154. [CrossRef]
12. Juang, L.W.; Kollmeyer, P.J.; Anders, A.E.; Jahns, T.M.; Lorenz, R.D.; Gao, D. Investigation of theinfluence of superimposed AC current on lithium-ion battery aging using statistical design of experiments.J. Energy Storage 2017, 11, 93–103. [CrossRef]
13. Chen, L.R.; Wu, S.L.; Shieh, D.T.; Chen, T.R. Sinusoidal-Ripple-Current Charging Strategy and OptimalCharging Frequency Study for Li-Ion Batteries. IEEE Trans. Ind. Electron. 2013, 60, 88–97. [CrossRef]
14. Lee, Y.D.; Park, S.Y. Electrochemical State-Based Sinusoidal Ripple Current Charging Control. IEEE Trans.Power Electron. 2015, 30, 4232–4243. [CrossRef]
15. Cho, S.Y.; Lee, I.O.; Baek, J.I.; Moon, G.W. Battery Impedance Analysis Considering DC Component inSinusoidal Ripple-Current Charging. IEEE Trans. Ind. Electron. 2016, 63, 1561–1573. [CrossRef]
16. Bessman, A.; Soares, R.; Vadivelu, S.; Wallmark, O.; Svens, P.; Ekström, H.; Lindbergh, G. Challengingsinusoidal ripple-current charging of lithium-ion batteries. IEEE Trans. Ind. Electron. 2017, 65, 4750–4757.[CrossRef]
17. Smith, M.J.; Gladwin, D.T.; Stone, D.A. Experimental analysis of the influence of high-frequency ripplecurrents on dynamic charge acceptance in lead-acid batteries. In Proceedings of the IECON 2017—43rdAnnual Conference of the IEEE Industrial Electronics Society, Beijing, China, 29 October–1 November 2017;pp. 7140–7145.
18. Zhang, J.; Ge, H.; Li, Z.; Ding, Z. Internal heating of lithium-ion batteries using alternating current based onthe heat generation model in frequency domain. J. Power Source 2015, 273, 1030–1037. [CrossRef]
19. Zhu, J.; Sun, Z.; Wei, X.; Dai, H. An alternating current heating method for lithium-ion batteries from subzerotemperatures. Int. J. Energy Res. 2016, 40, 1869–1883. [CrossRef]
20. Mohan, S.; Kim, Y.; Stefanopoulou, A.G. Energy-Conscious Warm-Up of Li-Ion Cells From SubzeroTemperatures. IEEE Trans. Ind. Electron. 2016, 63, 2954–2964. [CrossRef]
21. Zhu, J.; Sun, Z.; Wei, X.; Dai, H.; Gu, W. Experimental investigations of an AC pulse heating method forvehicular high power lithium-ion batteries at subzero temperatures. J. Power Source 2017, 367, 145–157.[CrossRef]
22. Grubmüller, M.; Schweighofer, B.; Wegleiter, H. Fast, high accuracy, freely programmable single cell batterymeasurement system. In Proceedings of the 2015 IEEE International Instrumentation and MeasurementTechnology Conference (I2MTC), Pisa, Italy, 11–14 May 2015; pp. 133–137.
23. Svens, P.; Lindström, J.; Gelin, O.; Behm, M.; Lindbergh, G. Novel field test equipment for lithium-ionbatteries in hybrid electrical vehicle applications. Energies 2011, 4, 741–757. [CrossRef]
Batteries 2018, 4, 38 14 of 14
24. Soares, R.; Bessman, A.; Wallmark, O.; Leksell, M.; Behm, M.; Svens, P. Design aspects of an experimentalsetup for investigating current ripple effects in lithium-ion battery cells. In Proceedings of the 2015 17thEuropean Conference on Power Electronics and Applications (EPE’15 ECCE-Europe), Geneva, Switzerland,8–10 September 2015; pp. 1–8.
25. Vadivelu, S. Investigation of Sinusoidal Ripple Current Charging Techniques for Li-Ion Cells; Diva & at KTH:Stockholm, Sweden, 2016.
26. Society of Automotive Engineers. J-1939 Standart from the Society of Automotive Engineers: RecommendedPractice for a Serial Control and Communications Vehicle Network; Society of Automotive Engineers: Warrendale,PA, USA, 2009.
27. Bessman, A.; Soares, R. Software Documentation for Current-Ripple Equipment; Diva & at KTH: Stockholm,Sweden, 2018.
28. Dubaniewicz, T.; DuCarme, J. Are Lithium Ion Cells Intrinsically Safe? IEEE Trans. Ind. Appl. 2013,49, 2451–2460. [CrossRef] [PubMed]
29. Jhu, C.Y.; Wang, Y.W.; Shu, C.M.; Chang, J.C.; Wu, H.C. Thermal explosion hazards on 18650 lithium ionbatteries with a VSP2 adiabatic calorimeter. J. Hazard. Mater. 2011, 192, 99–107. [CrossRef] [PubMed]
30. Lisbona, D.; Snee, T. A review of hazards associated with primary lithium and lithium-ion batteries.Process. Saf. Environ. Prot. 2011, 89, 434–442. [CrossRef]
31. Smith, A.J.; Burns, J.C.; Dahn, J.R. A High Precision Study of the Coulombic Efficiency of Li-Ion Batteries.Electrochem. Solid-State Lett. 2010, 13, A177–A179. [CrossRef]
32. Atkinson, K.E. An Introduction to Numerical Analysis, 2nd ed.; Wiley: New York, NY, USA, 1989.33. Schweighofer, B.; Raab, K.M.; Brasseur, G. Modeling of high power automotive batteries by the use of an
automated test system. IEEE Trans. Instrum. Meas. 2003, 52, 1087–1091. [CrossRef]34. Bloom, I.; Walker, L.K.; Basco, J.K.; Abraham, D.P.; Christophersen, J.P.; Ho, C.D. Differential voltage analyses
of high-power lithium-ion cells. 4. Cells containing NMC. J. Power Source 2010, 195, 877–882. [CrossRef]35. Smith, A.J.; Dahn, J.R. Delta Differential Capacity Analysis. J. Electrochem. Soc. 2012, 159, A290–A293.
[CrossRef]36. Yang, X.G.; Liaw, B.Y. In situ electrochemical investigations of the kinetic and thermodynamic properties of
nickel-metal hydride traction batteries. J. Power Source 2001, 102, 186–197. [CrossRef]37. Doyle, M.; Fuller, T.F.; Newman, J. Modeling of Galvanostatic Charge and Discharge of the Lithium/
Polymer/Insertion Cell. J. Electrochem. Soc. 1993, 140, 1526–1533. [CrossRef]
c© 2018 by the authors. Licensee MDPI, Basel, Switzerland. This article is an open accessarticle distributed under the terms and conditions of the Creative Commons Attribution(CC BY) license (http://creativecommons.org/licenses/by/4.0/).