Embed Size (px)
Citation preview
Literacy Rates I N - DEPT H A N A LYS IS OF JOGULA M BA GA DWA L D I ST R IC T
Source: District Census Handbook for Mahabubnagar – Census 2011 (2807 PART-A DCHB MAHABUBNAGAR )

Purpose of the Analysis
District wise analysis revealed that the literacy rate is below state average in 26 out of 31 districts.
Jogulamba Gadwal is the lowest performing district with 49.87 literacy rate.
In-depth analysis of the district is required to understand actual location of the low literacy rate at the desegregated levels of mandal and village.
Therefore an in-depth analysis has been taken up at mandal and village levels based on the Census 2011 data available.
Also laid out certain insights / observations / recommendations and proposed a study to identify the ‘why-factor’ i.e., reasons for the low literacy rates in the district.
Lastly, factors to be taken into consideration for the proposed study is also described.

83
.25
82
.49
76
.17
71
.95
69
.16
66
.54
66
.4
65
.95
65
.53
65
.52
64
.35
64
.25
64
.11
64
.08
63
.75
63
.46
62
.71
61
.61
61
.44
61
.26
60
.33
60
.26
57
.91
57
.77
57
.13
56
.78
56
.72
56
.51
56
.12
55
.67
54
.38
49
.87
0
10
20
30
40
50
60
70
80
90
Lite
racy
Rat
es
District Level Literacy Rates In Telangana State STATEAvg.
LOW
HIGH

69.48
76.06
72.93
70.62
52.26
36.51
29.46
24.00
19.04
16.34
13.39
12.15
9.08
8.81
6.84
8.24
9.98
75.7
84.5
82.6
81.2
74.3
62.4
54.9
50.2
43.0
39.4
34.9
36.0
29.4
29.4
25.1
29.5
31.0
150 100 50 50 100
07-10
11-13
14-15
16-17
18-24
25-29
30-34
35-39
40-44
45-49
50-54
55-59
60-64
65-69
70-74
75-79
80+
Jogulamba Gadwal
Male Female
Patterns of Literacy rates by Age / Gender in TS Well performing and not so well Performing Districts…
87.10
91.84
91.98
91.46
87.55
83.02
78.74
74.73
71.70
69.44
67.25
66.53
60.16
57.71
53.72
54.59
56.55
89.0
93.0
92.8
92.4
90.9
89.1
86.9
84.5
82.2
81.7
81.5
83.5
80.8
81.2
79.3
81.1
80.1
150 100 50 50 100 150
07-10
11-13
14-15
16-17
18-24
25-29
30-34
35-39
40-44
45-49
50-54
55-59
60-64
65-69
70-74
75-79
80+
Hyderabad
Male Female

72
.13
68
.93
68
.20
65
.19
64
.82
63
.36
61
.94
60
.05
56
.80
52
.51
51
.88
46
.35
44
.65
50
.71
51
.30
45
.74
44
.12
43
.52
41
.57
39
.28
39
.48
35
.95
30
.85
30
.28
28
.96
23
.08
0.00
10.00
20.00
30.00
40.00
50.00
60.00
70.00
80.00
90.00
Ala
mp
ur
Gad
wal
Un
dav
elli
Man
op
ad
Wad
dep
alle
Itik
yal
Raj
oli
Jogu
lam
ba
Gad
wal
Dis
tric
t
Aiz
a
Mal
dak
al
Dh
aru
r
Gh
attu
Kal
oo
r_Ti
mm
anad
od
di
Male
Mandal wise literacy rates by Gender - Jogulamba
District Average (Male)
District Average (Female)

0.00
10.00
20.00
30.00
40.00
50.00
60.00
70.00
80.00
90.00
Total Male Female
Mandal Wise Literacy Rates by Gender - Jogulamba
Note: Only few mandals showing literacy rates above State and District averages with respect to ‘Total’ and ‘Male’; it is further less in ‘Female’ literacy rate.
State Average (66.5%)
District Average (49.87%)

Literacy Rates in Top & Bottom Five Mandals - Jogulamba
61.79 60.23
57.16 54.73 54.33
46.45
41.80 41.09
37.59
33.77
0.00
10.00
20.00
30.00
40.00
50.00
60.00
70.00
Ala
mp
ur
Gad
wal
Un
dav
elli
Man
op
ad
Wad
dep
alle
Aiz
a
Mal
dak
al
Dh
aru
r
Gh
attu
Kal
oo
r_Ti
mm
anad
od
di

Urban Rural Parity in Literacy Rates - Jogulamba
• The average literacy rate in Rural area (from all 12 mandals) is only 47.30 • The average literacy rate in Urban area (only from 1 mandals) is 71.57
12
47.30
1
71.57
Mandals
Literacy Rate
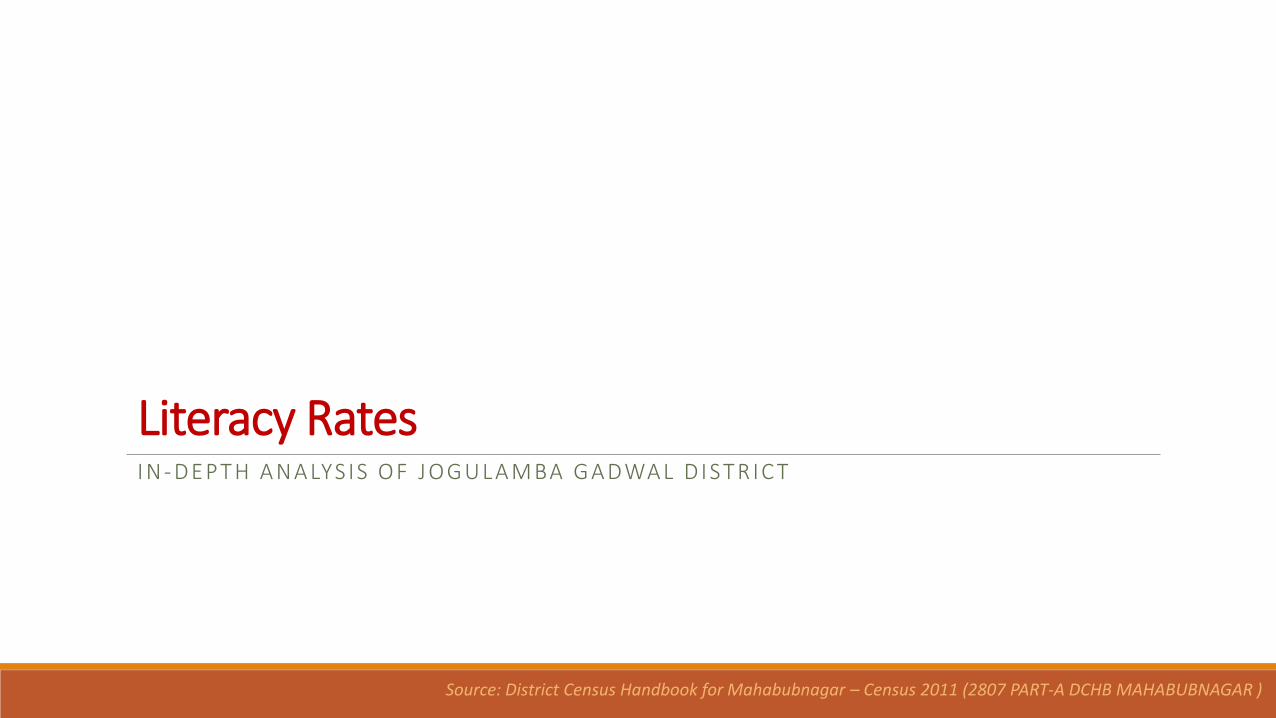
Insights Total Mandals - 12
Urban Mandals - 1 (8.3%)
District Average Literacy Rate (>6 age group) - 49.87
Mandals Above District Average - 7 (58%)
Mandals Below District Average - 5 (42%)
1 urban mandal is above district average. (Gadwal).
6 rural mandals are above district average.

Insights... The proportion of literates to total population (excluding the age group of 0-6) for
the district total is 49.87, Rural 47.30 and urban 71.57 percentages respectively.
The literacy rate of males 60.05% in the district is higher than the females 39.48%. Gadwal mandal reported the highest literacy rate of 71.57% for total and also reported the highest literacy rate of 71.57% for urban and Alampur mandal reported the highest literacy rate with 61.79% for rural.
Gadwal mandal shows the highest male and female literacy rate for total and urban with 79.67% and 63.30%.
Kaloor - Timmanadoddi mandal reported the lowest literacy rates for total with 33.77%, males with 44.65% and females with 23.08% in the district.
The average gap between male and female literacy rate in the district is 20.57% and for rural it is 21.07% but in urban area the gap is 16.37%.
Mandal Wise Village Level Literacy Rates

Mandal Wise Literacy Rates [Click on Mandal Name to open Village Rates]
S.No Mandal Name Total Male Female
1 Alampur 61.79 72.13 50.71
2 Gadwal 60.23 68.93 51.30
3 Undavelli 57.16 68.20 45.74
4 Manopad 54.73 65.19 44.12
5 Waddepalle 54.33 64.82 43.52
6 Itikyal 52.77 63.36 41.57
7 Rajoli 50.78 61.94 39.28
Jogulamba Gadwal District
49.87 60.05 39.48
8 Aiza 46.45 56.80 35.95
9 Maldakal 41.80 52.51 30.85
10 Dharur 41.09 51.88 30.28
11 Ghattu 37.59 46.35 28.96
12 Kaloor -Timmanadoddi 33.77 44.65 23.08

Aiza
Back to Mandal List
Villages

Alampur
Back to Mandal List
Villages

Dharur
Back to Mandal List
Villages

Gadwal
Back to Mandal List
Villages/Wards

Ghattu
Back to Mandal List
Villages
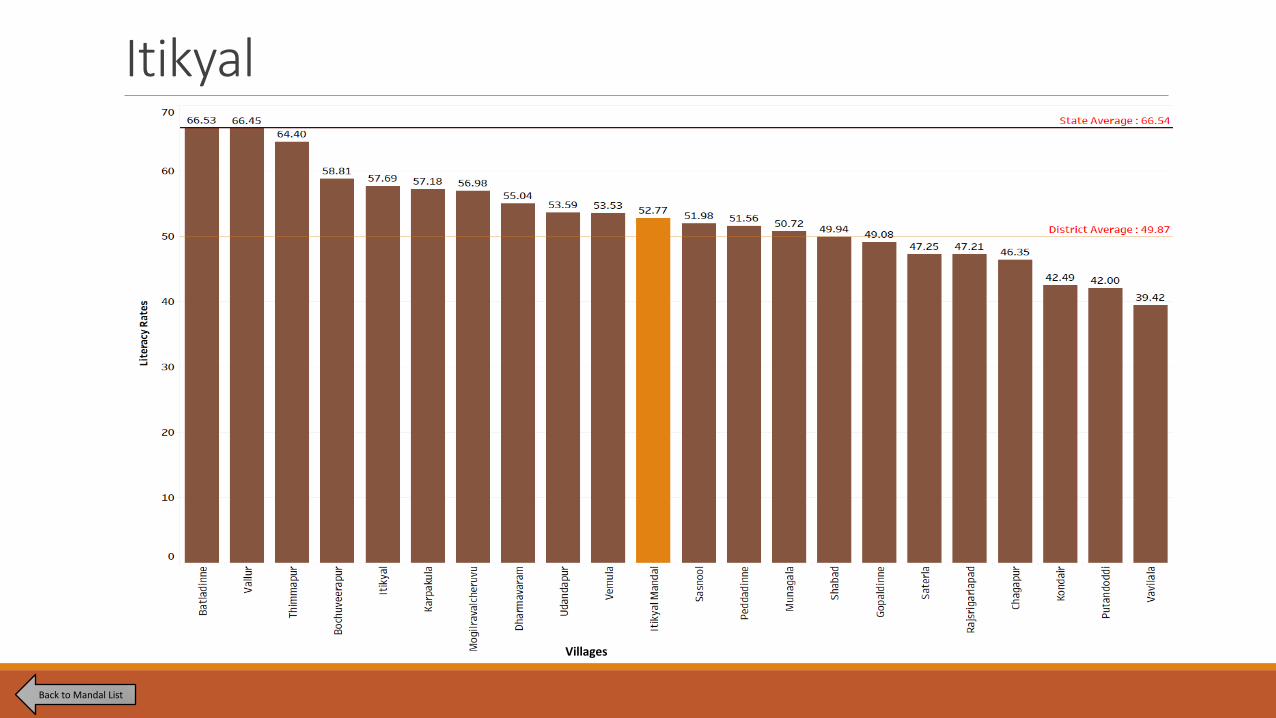
Itikyal
Back to Mandal List
Villages

Kaloor - Timmanadodi
Back to Mandal List
Villages

Maldakal
Back to Mandal List
Villages

Manopad
Back to Mandal List
Villages

Rajoli
Back to Mandal List
Villages

Undavelli
Back to Mandal List
Villages

Waddepalle
Back to Mandal List
Villages

DISTRIBUTION OF VILLAGES BY LITERACY RATE RANGE
Range of literacy rate for villages
Number of inhabited villages
Percentage distribution of villages
Population Percentage distribution
of population
0 0 0.00 0 0.00 1-10 0 0.00 0 0.00
11-20 1 0.5 2146 0.4 21-30 11 5.5 23569 3.9 31-40 35 17.6 102893 16.9 41-50 66 33.2 197454 32.4 51-60 58 29.1 166934 27.4 61-70 20 10.1 60728 10.0 71-80 7 3.5 53082 8.7 81-90 1 0.5 3184 0.5 91-99 0 0.00 0 0.00 100 0 0.00 0 0.00
199 100.0 609990 100.0
• 66 villages are recorded in the range of 41-50 literacy rate with 32.4% of the total district population.
• 58 villages are recorded in the range of 51-60 literacy rate with a population of 27.4%;
• 11 villages are shown in range of 21-30 literacy rate with a population of 3.9%.
• 1 village is there in the range of 11-20 and 81-90 literacy rate.
• No villages report above 90% literacy rate and there are no villages without literacy.

Recommendations The district authorities may take remedial measures to improve the literacy rate in the mandals /
villages where the literacy rates are below district / state average.
The district authorities have to identify the reasons for the low literacy rates in rural areas and initiate necessary action to improve the literacy rate.
Female literacy to be given top priority as there is huge gap of about 21% between male and female literacy rates.
Focus to be given in two mandals viz., Kaloor_Timmanadoddi and Ghattu where literacy rates are below district average despite urban area.
Best practices, success stories of the best performing mandals to be shared with the low performing mandals.
Training needs of teachers to be assessed and organize trainings / orientation programmes
Community mobilization programmes to be organized for enhanced enrolment of the out of the school children into schools.
Student-Teacher (S/T) ratio is to be improved
Necessary initiatives to be taken to improve infrastructure in remote areas of the district.
It may be desirable to have a study to assess the reasons contributing for less literacy in low performing mandals / villages.

Factors to be taken into consideration for the study suggested Poverty
Institutional support systems SSA
Residential Schools
Bridge Schools
Infrastructure
Migratory issues
Imbalances in the social structure
Teachers Vs Vidya Volunteers
Variation of literacy rates in different age groups at mandal & Village level
A N A LY S I S D O N E B Y P L A N N I N G D E PA R T M E N T, T E L A N G A N A S TAT E : : C E S S : : U N I C E F