Embed Size (px)
Citation preview
Oklahoma Technical Assistance Center123 E. BroadwayCushing, OK 74023www.otac.info
Literacy First
Professional Development
December 2, 2011
Evaluation of the Literacy First Professional Development Institute
Background
The 2010-11 Literacy First program was a state funded, K-6 elementary readingProfessional Development Institute (PDI) awarded by a bid from the Oklahoma Commission forTeacher Preparation (OCTP). The Oklahoma Technical Assistance Center (OTAC) in Cushingwas contracted by OCTP to conduct an evaluation of the Literacy First PDI.
The goal of the Literacy First PDI was to build an infrastructure and culture to supportimproved reading achievement within each participating school. The PDI accomplished thisthrough full-faculty professional development in the Literacy First (LF) process and thedevelopment of leadership teams. Each building’s leadership team comprised an administratorand a Literacy Resource Specialist (LRS). An LRS functions much like a reading coach,working with teachers to monitor and improve instruction. During the three-year program, eachschool was supported by a visiting Literacy Consultant, assigned to the school by LF. Theleadership team, with the guidance of the LF consultant, directed teachers in the effectiveimplementation of Literacy First and developed plans to sustain the process after the three-yearfunding cycle.
All teachers completed a total of eight days of Literacy First training. Administrators andLRSs completed additional training focused on data-driven instruction and directing theirschools’ reading programs. The LF consultant visited each school site a minimum of four timesper year.
Implementation and Program Quality
Oklahoma’s Literacy First PDI was developed as a four-phase process:• Phase I - Initial training (5 days),• Phase II - Advanced training (3 days),• Phase III - Information about the Literacy First process provided to administrators
(2 days), and• Phase IV - A three-year commitment to implementing the Literacy First process
within an entire school or district. Literacy Resource Specialists (LRSs) are hired towork in each Phase IV school site. LF consultants1 work with each school site,visiting four to six times per year.
Phases I and II may be completed by individual teachers and administrators withinmonths of each other. Phase III (a two-day workshop) is designed more as an informationalsession for those wanting to learn more about the Literacy First process; it is a part of thenational program but not the Oklahoma Literacy First program. Oklahoma administrators
1 Literacy First refers to its consultants as “Literacy First Coaches.” In most schools, a “reading coach” isan employee of the school, who works in one (occasionally two) schools on a full-time basis. This is the role of theLiteracy Resource Specialist in the LF model. To avoid confusion, the term “coach” is not used in this report.
Oklahoma Technical Assistance Center Page 1
participated in Phase I and Phase II sessions to gain the initial knowledge and information theyneeded to begin working the Literacy First process in their schools. To receive funding as aPhase IV program, districts must apply for a grant award, commit to participation in the fullthree-year process, and develop plans to sustain the program after the end of OCTP funding.
Literacy First Phase I, II, and IV sessions took place from July 1, 2010 to June 30, 2011.Phase I and II sessions took place during the summer as well as during the school year. Phase IVLeadership sessions for Year 1, 2, and 3 school sites took place during the 2010-11 school yearon September 8th and 9th, November 3rd and 4th, December 8th and 9th, and January 25th and 26th.
The Literacy First Process is designed to train teachers to provide systematic, explicitinstruction in reading at the PK- 6th grade levels that includes the five essential elements ofreading (phonemic awareness, phonics, fluency, vocabulary, and comprehension) as well asspelling. The five essential elements were identified in the 2000 National Reading Panel Report2
and supported by a research report released by Learning Points Associates.3 Additionally, thesefive reading elements were written into the No Child Left Behind Act, the Reading FirstInitiative, and the Oklahoma Reading Sufficiency Act of 2005 as required content for thosereceiving reading instruction supported by federal and state funding sources. The Literacy Firstprocess utilizes the research-based practices and instructional elements of effectivecomprehension instruction suggested in the US Department of Education’s and Institute ofEducation Sciences (IES) What Works Clearninghouse report, Improving Comprehension inKindergarten Through 3rd Grade: A Practice Guide.4
Educators completing training in the Literacy First process were required to completetwo training sessions, Phase I and Phase II. The training sessions are structured to providegrade-level appropriate training by grouping PK through 3rd grade teachers (Primary) and 4th
through 6th grade teachers (Intermediate) together in groups.
The Literacy First instructional process comprised two main components: AcademicLearning Time (ALT) and Anatomy of a Lesson (AOL). Academic Learning Time requiresteachers to determine if students know and understand their reading objectives, can manipulatethe content of the lesson, and experience a 75-95 percent success rate. Anatomy of a Lesson(AOL) is a lesson plan template, designed to address each of the five essential elements, thatrequires teachers to assess, instruct, and monitor student learning. The Literacy First Process
2National Institute of Child Health and Human Development. (2000). Report of the National ReadingPanel. Teaching children to read: An evidence-based assessment of the scientific research literature on reading andits implications for reading instruction: Reports of the subgroups (NIH Publication No. 00-4754). Washington, DC:U.S. Government Printing Office.
3Learning Points Associates. (2004). Five Essential Components of Effective Reading Instruction. (#Ed-01-CO-0046/00001). Report provided for the U.S. Department of Education. Downloaded fromhttp://www.learningpt.org/pdfs/literacy/components.pdf
4Shanahan, T., Callison, K., Carriere, C., Duke, N. K., Pearson, P. D., Schatschneider, C., & Torgesen, J.(2010). Improving reading comprehension in kindergarten through 3rd grade: A practice guide (NCEE 2010-4038).Washington, DC: National Center for Education Evaluation and Regional Assistance, Institute of EducationSciences, U.S. Department of Education. Retrieved from whatworks.ed.gov/publications/practiceguides.
Oklahoma Technical Assistance Center Page 2
also developed Reading Comprehension Demonstration Lessons using different instructionalstrategies. Although each lesson involved a different comprehension reading strategy (e.g.retelling or QAR), all lessons included the following eight components: Lesson Objective,Activate Prior Knowledge, Assess Prior Knowledge, Student Active Participation/Teacher InputThink Aloud 1 and Think Aloud 2, Guided Practice, Independent Practice, and Identify StudentSuccess (ISS). Each student is monitored and assessed in each of the strategies until the studenthas achieved a minimum achievement of 75 percent.
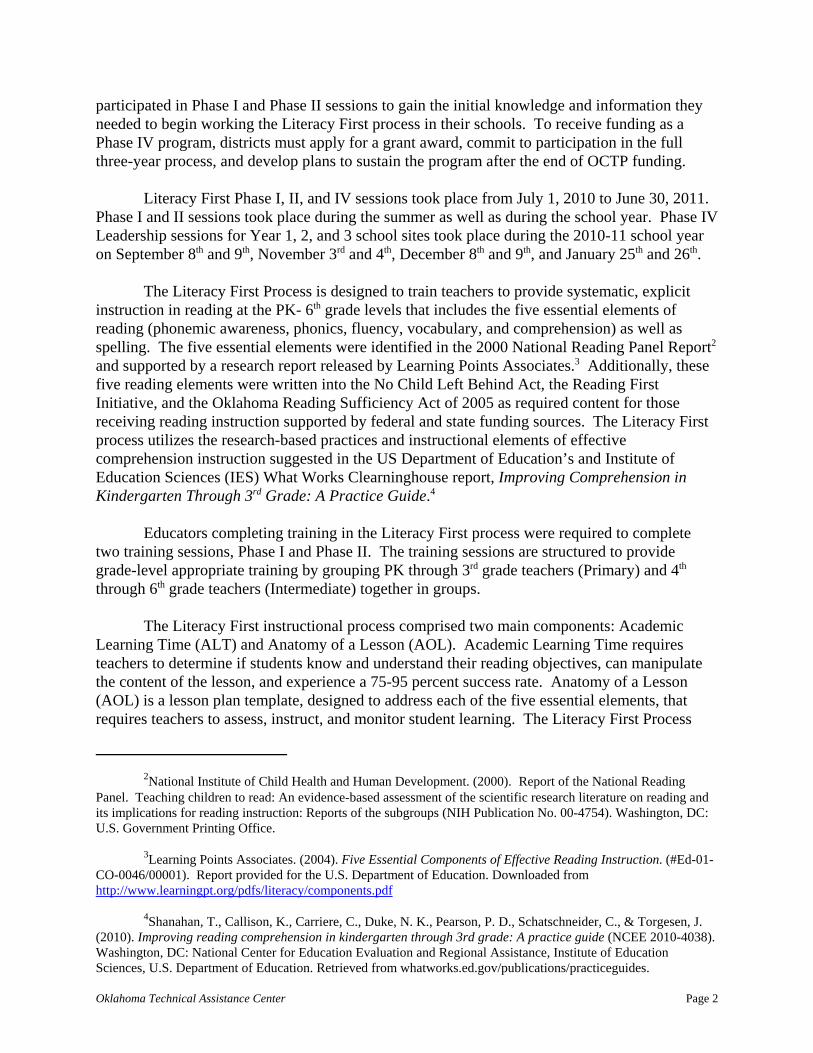
To determine quality of the training provided by the Literacy First PDI, evaluatorsreviewed Literacy First materials and conducted one or more observations in each of the Phase I,II, and IV training sessions. As depicted in Table 1, evaluators made a total of ten observationsof the Literacy First professional development process.
Table 1. Number of observations made of each Literacy First training phase.
Literacy First Phase Session Level Number of observations
Phase I K-2 grade teachers 2
Phase I 3-6 grade teachers 2
Phase II K-2 grade teachers 1
Phase II 3-6 grade teachers 1
Phase IV Year 1 Administrators/LRS 2
Phase IV Year 2 and 3 Administrators/LRS 2
Based on a review of Literacy First materials and observations of Phase I, II, and IVsessions, evaluators determined the Literacy First professional development sessions metnational standards of the National Staff Development Council (NSCD).
Participants. A total of 57 Phase I and II training sessions took place. As reported bythe Literacy First project director, 1,183 Oklahoma educators participated in Phase I sessionsduring 2010-11. A total of 782 participants participated in Phase II sessions. A total of 222 pre-kindergarten teachers participated in the seven PK sessions offered. The Literacy Firstprofessional development institute provided training to a total of 2,187 PK-6 grade teachers in2010-11.
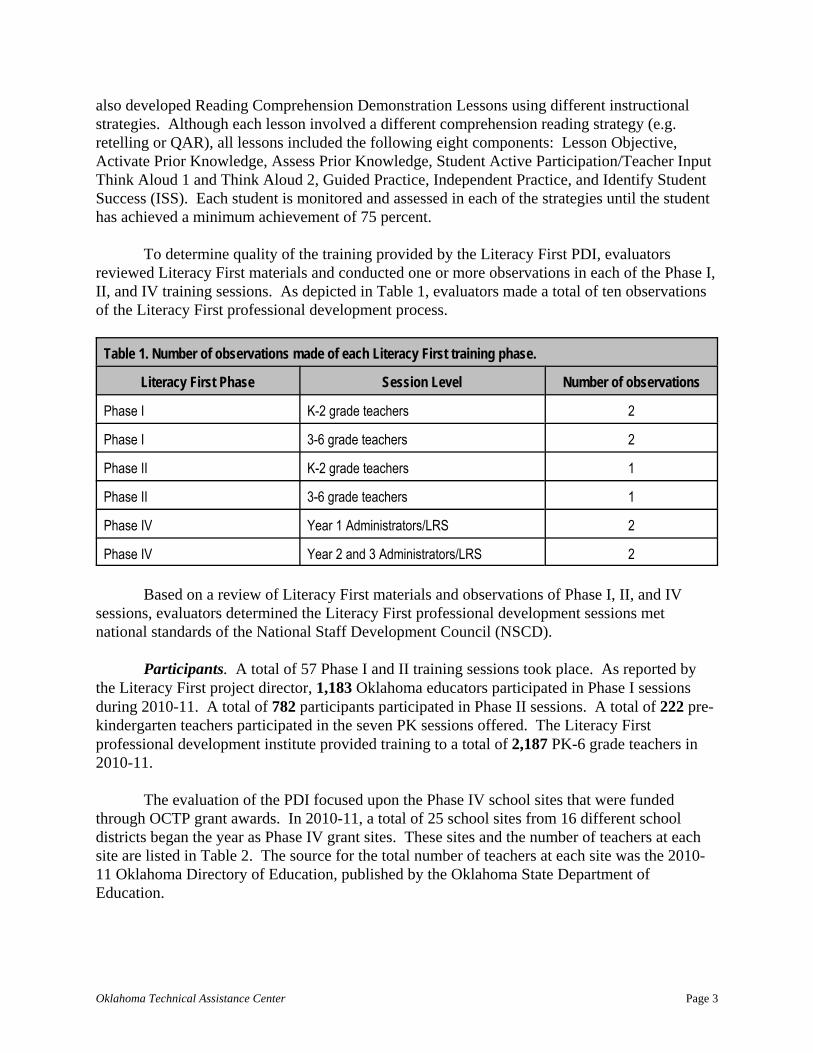
The evaluation of the PDI focused upon the Phase IV school sites that were fundedthrough OCTP grant awards. In 2010-11, a total of 25 school sites from 16 different schooldistricts began the year as Phase IV grant sites. These sites and the number of teachers at eachsite are listed in Table 2. The source for the total number of teachers at each site was the 2010-11 Oklahoma Directory of Education, published by the Oklahoma State Department ofEducation.
Oklahoma Technical Assistance Center Page 3
Table 2. Year of participation and total number of teachers at Phase IV grant school sites, 2010-11.
Year in Phase IV District Phase IV school site Number of teachers
3 Anadarko Mission Elementary 30
3 Bartlesville Ranch Heights Elementary 26
3 Bartlesville Wayside Elementary 28
3 Blanchard Blanchard Elementary 34
3 Clinton Nance Elementary 34
3 Clinton Southwest Elementary 36
3 Muskogee Harris-Jobe Elementary 19
3 Tulsa Addams Elementary 20
2 Bartlesville Richard Kane Elementary 29
2 Enid Monroe Elementary 32
2 Lawton Eisenhower Elementary 18
2 Muskogee Benjamin Franklin Science Academy 25
2 Muskogee Irving Elementary 25
2 Panama Panama Elementary 29
2 Ponca City Lincoln Elementary 30
2 Purcell Purcell Intermediate 19
2 Sand Springs Central Fine Arts Academy 33
2 Sand Springs Early Childhood Education Center 19
1 Apache Apache Elementary 21
1 Muskogee Cherokee Elementary 31
1 Muskogee Tony Goetz Elementary 26
1 Muskogee Whittier Elementary 27
1 Norman Adams Elementary 37
1 Norman Madison Elementary 41
1 Yukon Myers Elementary 30Note: Panama is listed in this table, even though it did not complete the year as a Phase IV grantee. Panamastudents’ outcomes were not included in the data analyses report later in this document.
Oklahoma Technical Assistance Center Page 4
Evidence of Effectiveness
Changes in Teacher Knowledge
The purpose of the concept map assessment was to examine pre-post changes inparticipants’ knowledge and understanding of teaching reading. The evaluation looked atchanges in teachers’ knowledge and understanding of teaching reading as measured by a pre-program map administered on the first day of summer training and a post-program mapadministered on the final summer training day. Educators attending 2010-11 Phase I LiteracyFirst training sessions were the focus of the pre-post concept map assessment. The centralconcept for both maps was “Teaching Reading.”
A total of 296 matched pairs of pre-post maps were collected. Concept maps used in theanalysis were scored quantitatively for their structure; in addition, a content analysis wasconducted to determine pre-post changes in the relevance, importance, understanding, andorganization of the content. The quantitative analysis consisted of assessing differences in themeasures listed below.5 A t-test was conducted to determine the significance of the differencesbetween paired means on these measures:
(1) Number of Concepts, which measures the raw number of terms that the teacherchains together on the map;
(2) Width, which is the number of concepts in the largest level on the map; it measuresbreadth of knowledge;
(3) Depth, which is the number of items in the longest concept chain and measures depthof knowledge;
(4) Hierarchical Structure Score (HSS), which is the sum (width + depth) and measures the complexity of the map structure;(5) Number of Chunks, Chains, and Crosslinks, which measures the degree to which
concepts are interconnected. A chunk is defined as any node that has at least twosubordinate concepts or “children.” A chunk measures to what extent concepts andthoughts are interconnected. A chain is a set of linked concepts that reaches a depthfo three. A crosslink is a connection made between two chunks.
Overall, participants showed statistically significant growth in all areas. The greatestgains were made in the overall number of concepts that teachers displayed on their maps and inthe breadth of knowledge displayed. They did not merely add concepts that connected to thecentral concept, as many professional development participants do. Instead, they drew mapswith more structures (levels, chunks, and chains).
5Hough, S., O’Rode, N., Terman, N., and Weissglass, J. (February 2007). “Using Concept Maps toMeasure Changes in Teachers Understandings of Algebra.” Journal of Mathematics Teacher Education. 10(1): 23-41.
Oklahoma Technical Assistance Center Page 5
Table 3 . Structural analysis of pre-post concept maps, Literacy First 2009-10. (N=108 )
Structural Component Pre-Program Mean Post-Program Significant
Total Number of Concepts 15.92 23.38 Yes
Width 11.63 16.33 Yes
Depth 1.99 2.43 Yes
Hierarchical Structure Score (H Score 13.61 18.76 Yes
Number of Chunks 1.77 3.32 Yes
Number of Chains .73 2.06 Yes
Number of Crosslinks .00 .01 No
* If this column is marked Yes, the difference between means was significant (α = .05).
In addition to the quantitative scoring of the pre-post maps, a content analysis wasconducted. Most of the pre-maps included at least two of the five essential reading elements(phonological awareness, phonics, fluency, comprehension, and vocabulary) identified by theNational Reading Panel. They tended to identify more of these components on the post-programmaps.
The growth demonstrated by the post-maps mainly was in the knowledge they gainedabout the elements of reading instruction – not necessarily the five essential elements named bythe National Reading Panel, but components of those elements. Additional growth was noted inthe identification of instructional strategies they learned to use in helping students to succeed inall aspects of reading.
Although the pre-post change in knowledge teachers demonstrated was similar across allparticipants, differences were noted in how the concept of Teaching Reading was approachedacross grades levels taught (PK-2 vs. 3-5). Teachers in grades 3-5 tended not to includephonological awareness (which is a skill usually mastered in grades PK-1) on either their pre- orpost-program maps. They identified more aspects of reading comprehension and theirapplication to content area reading, and included spelling and/or writing more often. Assessmentwas a prevalent theme on both pre- and post-maps for teachers of grades 3-5.
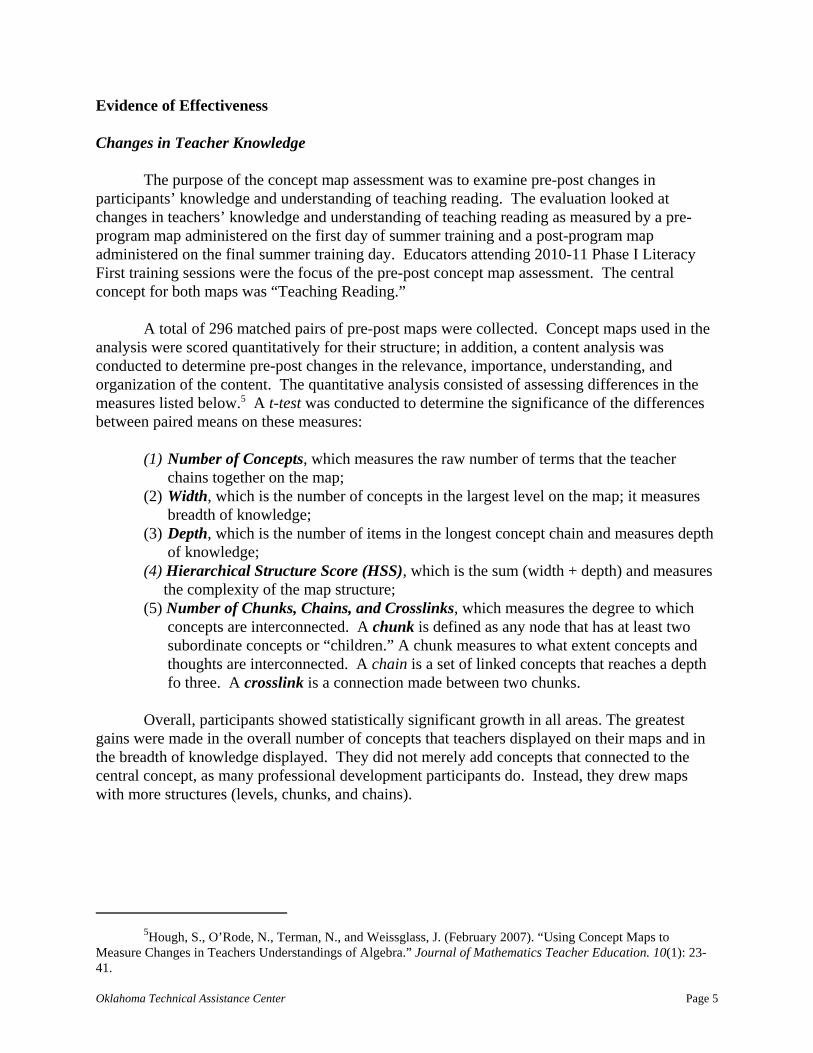
The pre-post changes could be best illustrated by these examples:
• On Participant 112's pre-map (Figure 1), one of the five essential elements ofreading or similar concepts were identified. The post-map (Figure 2) had greatercontent and identified three of the five essential elements of reading.
• Participant 105 identified a number of reading concepts on the pre-map (Figure 3),but only one of the five essential elements of reading was included. However, thepost-map (Figure 4) identified four of the five essential elements of reading. Thecomponents were organized into instructional strategies and both spelling andwriting were included.
Oklahoma Technical Assistance Center Page 6
• Participant 101 (Figure 5 pre-map) identified four of the five essential elements ofreading. The participant reconfigured the map (Figure 6 post-map) using four of thefive reading elements in such a way as to indicate different instructional approachesand strategies. For example, on the pre-map phonological awareness had noadditional concepts listed under it. However, on the post-map, the participantincorporated Literacy First’s Anatomy of a Lesson and expanded the concept toinclude APK (Activate and Apply Prior Knowledge) and TIP (Teacher Input), twoinstructional strategies relevant to teaching phonological awareness.
Oklahoma Technical Assistance Center Page 7
Figure 1. Participant #112 Pre-Map.
Oklahoma Technical Assistance Center Page 8
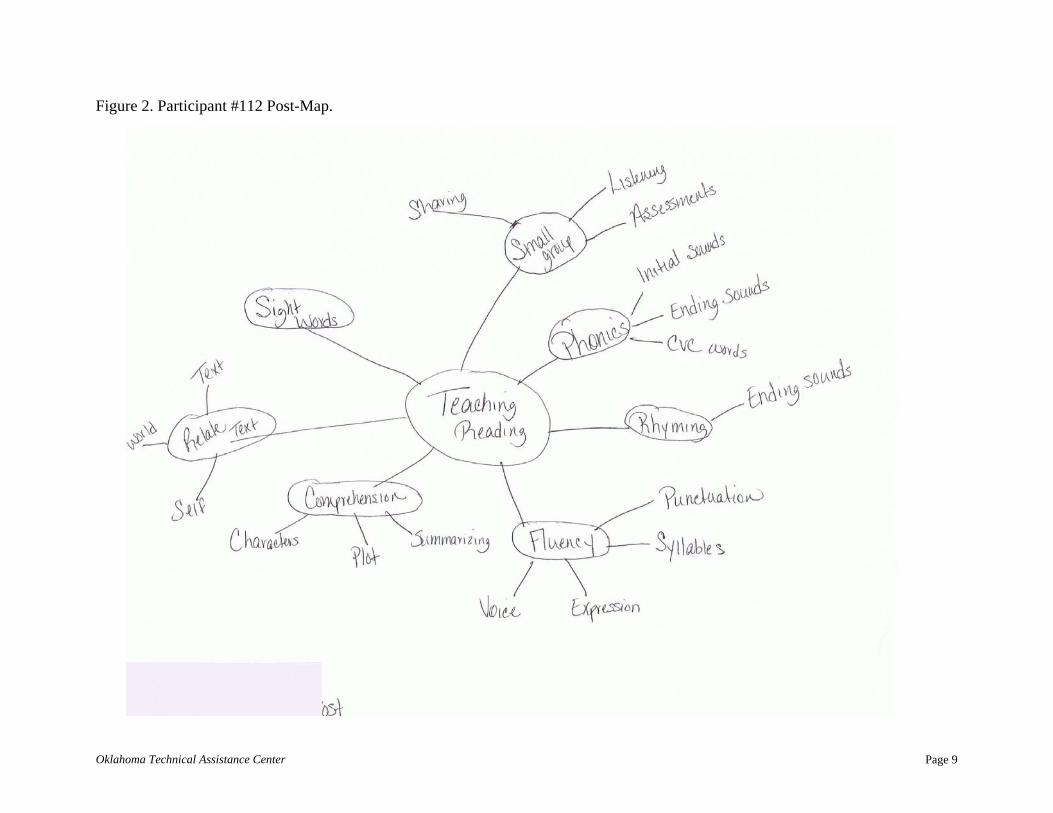
Figure 2. Participant #112 Post-Map.
Oklahoma Technical Assistance Center Page 9
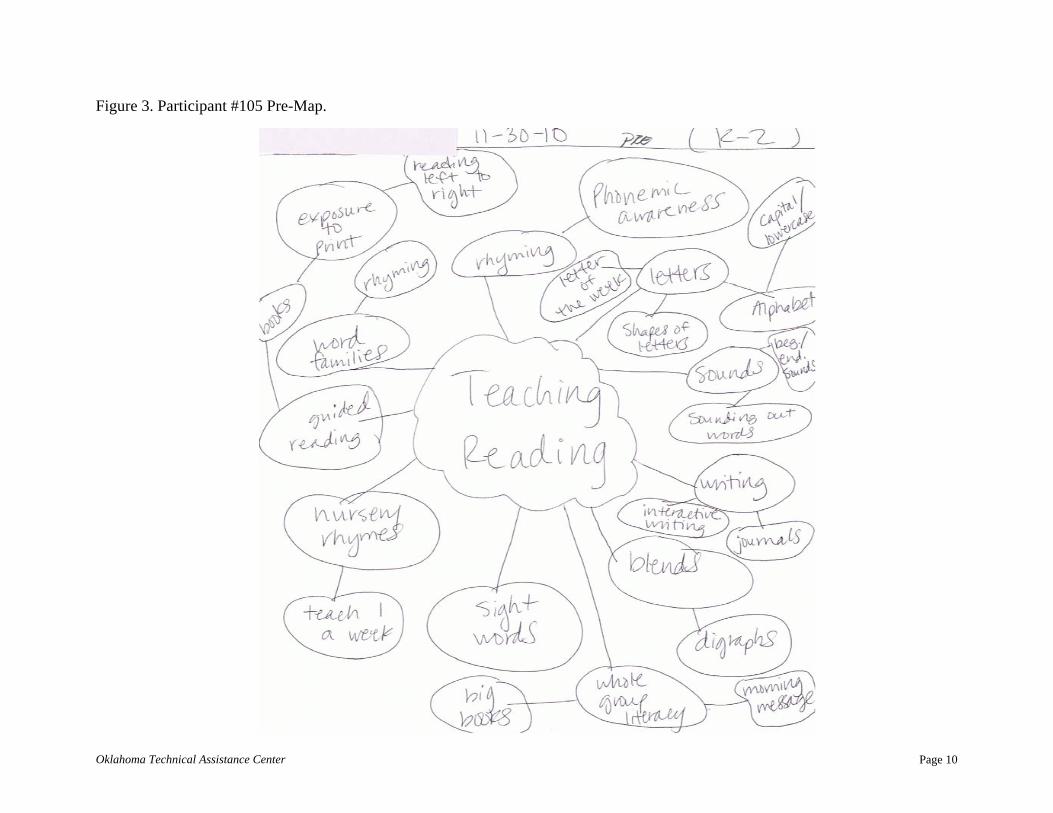
Figure 3. Participant #105 Pre-Map.
Oklahoma Technical Assistance Center Page 10
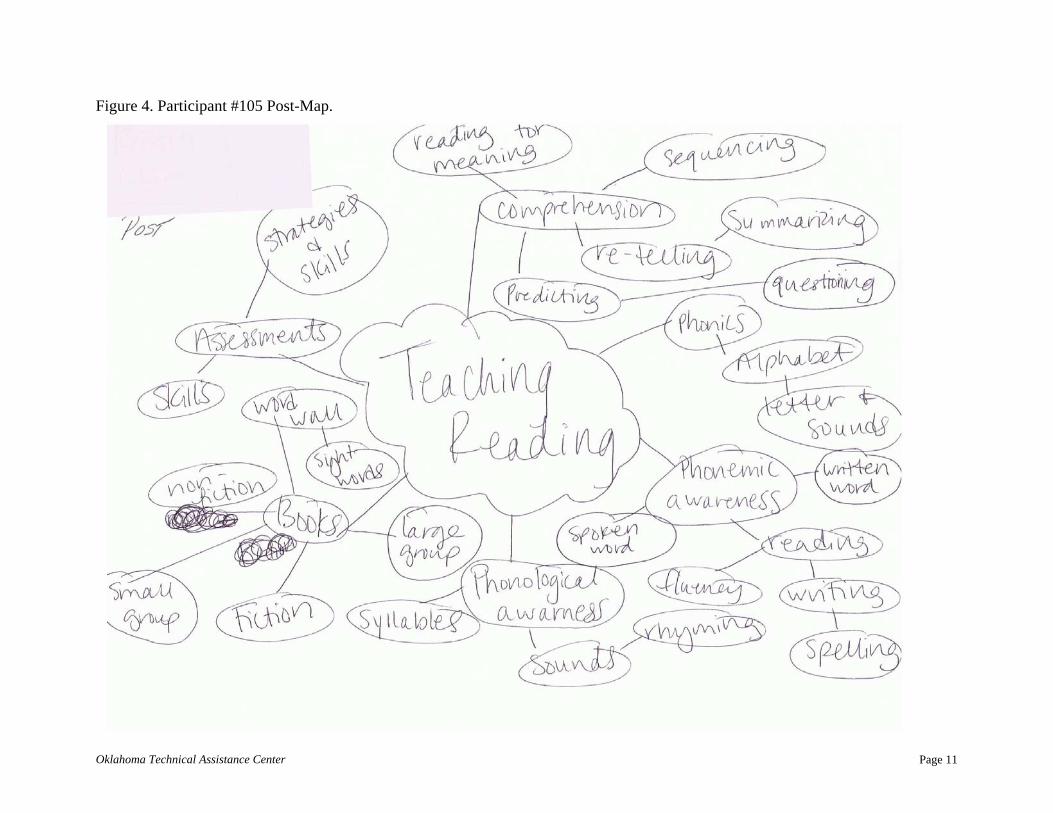
Figure 4. Participant #105 Post-Map.
Oklahoma Technical Assistance Center Page 11
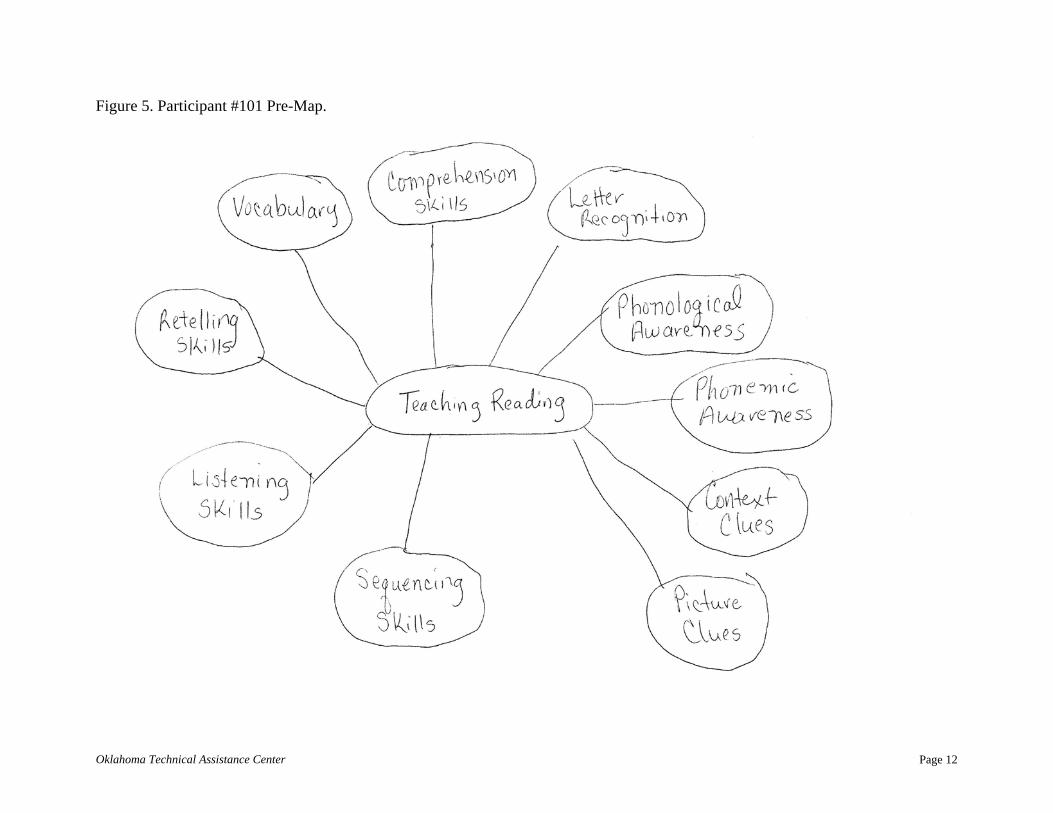
Figure 5. Participant #101 Pre-Map.
Oklahoma Technical Assistance Center Page 12
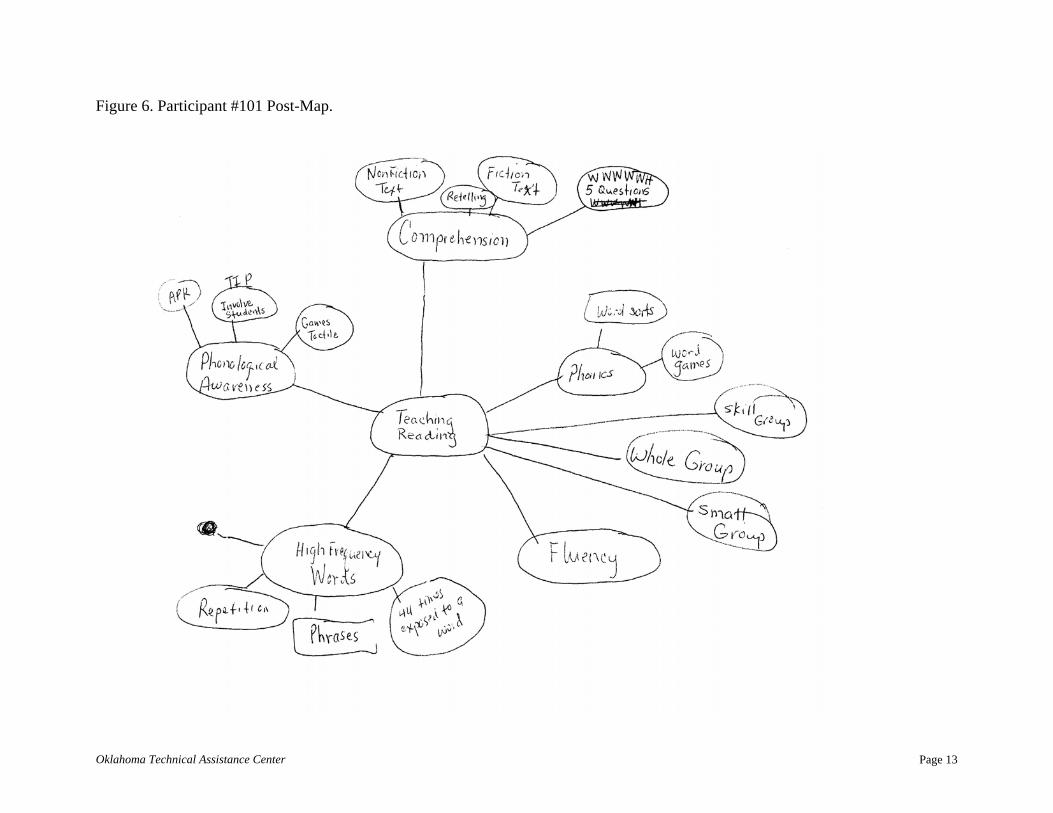
Figure 6. Participant #101 Post-Map.
Oklahoma Technical Assistance Center Page 13
Effects on Student Learning: Phase IV Schools
A system called My Data First was used by the Literacy First projects to collect programdata. All data for the My Data First system (MDF) was collected at the individual school sitesand input using the web-based MDF interface. Because that information is collectedcontinuously throughout the school year, it provides a more comprehensive picture than the“snapshot” of student performance provided by state accountability test data.
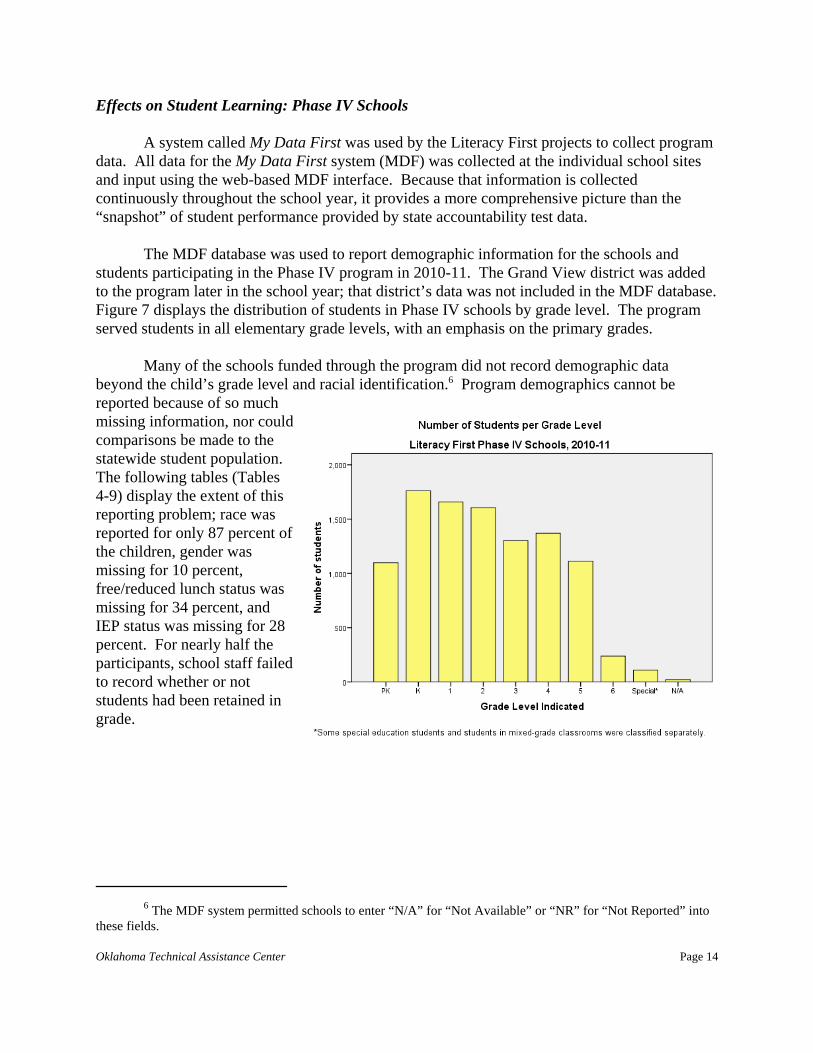
The MDF database was used to report demographic information for the schools andstudents participating in the Phase IV program in 2010-11. The Grand View district was addedto the program later in the school year; that district’s data was not included in the MDF database. Figure 7 displays the distribution of students in Phase IV schools by grade level. The programserved students in all elementary grade levels, with an emphasis on the primary grades.
Many of the schools funded through the program did not record demographic databeyond the child’s grade level and racial identification.6 Program demographics cannot bereported because of so muchmissing information, nor couldcomparisons be made to thestatewide student population. The following tables (Tables4-9) display the extent of thisreporting problem; race wasreported for only 87 percent ofthe children, gender wasmissing for 10 percent,free/reduced lunch status wasmissing for 34 percent, andIEP status was missing for 28percent. For nearly half theparticipants, school staff failedto record whether or notstudents had been retained ingrade.
6 The MDF system permitted schools to enter “N/A” for “Not Available” or “NR” for “Not Reported” intothese fields.
Oklahoma Technical Assistance Center Page 14
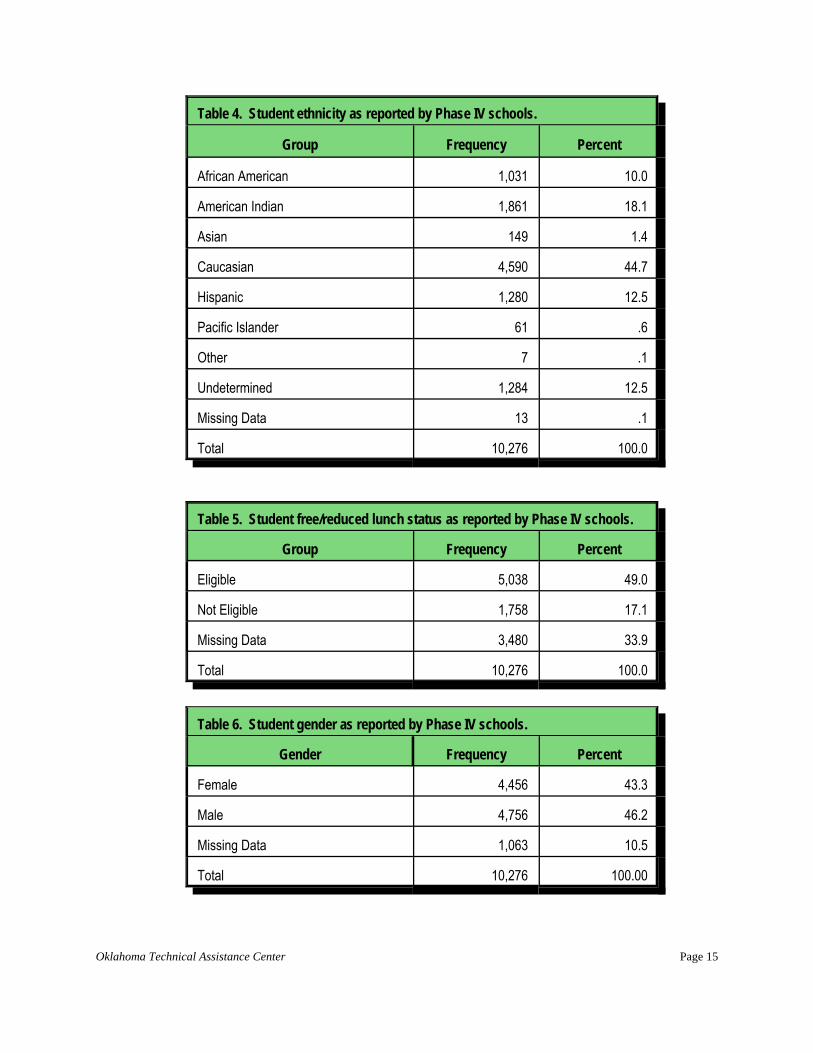
Table 4. Student ethnicity as reported by Phase IV schools.
Group Frequency Percent
African American 1,031 10.0
American Indian 1,861 18.1
Asian 149 1.4
Caucasian 4,590 44.7
Hispanic 1,280 12.5
Pacific Islander 61 .6
Other 7 .1
Undetermined 1,284 12.5
Missing Data 13 .1
Total 10,276 100.0
Table 5. Student free/reduced lunch status as reported by Phase IV schools.
Group Frequency Percent
Eligible 5,038 49.0
Not Eligible 1,758 17.1
Missing Data 3,480 33.9
Total 10,276 100.0
Table 6. Student gender as reported by Phase IV schools.
Gender Frequency Percent
Female 4,456 43.3
Male 4,756 46.2
Missing Data 1,063 10.5
Total 10,276 100.00
Oklahoma Technical Assistance Center Page 15
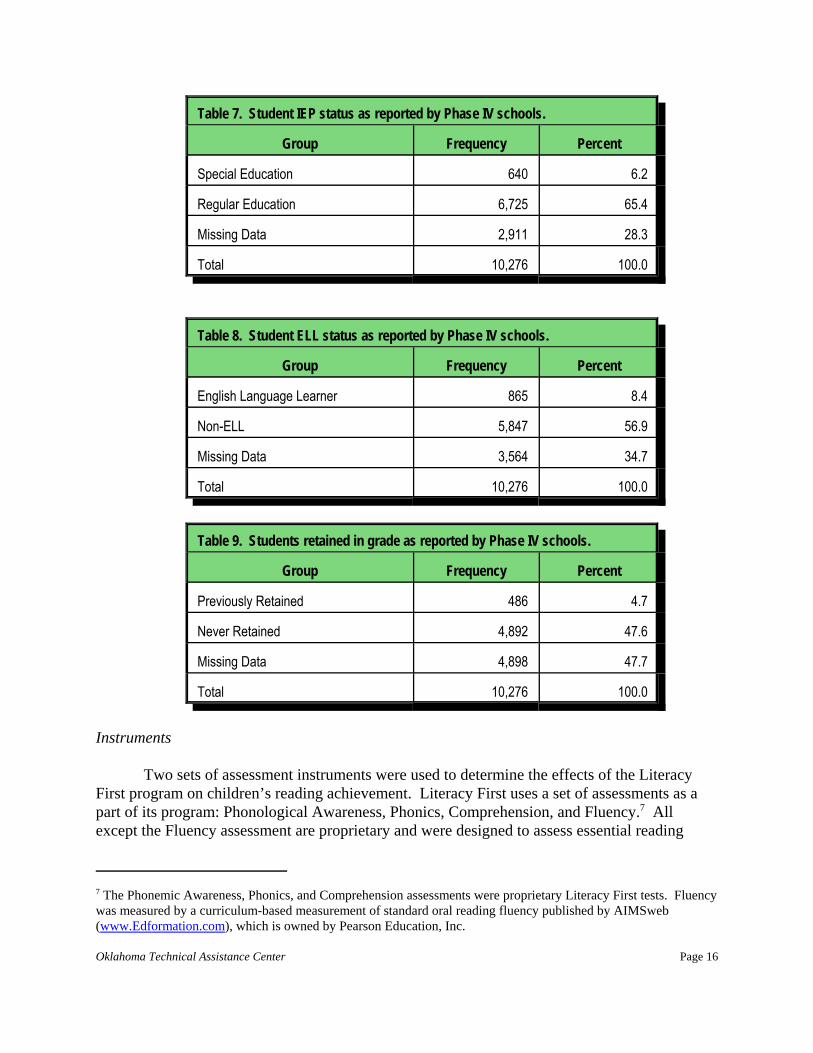
Table 7. Student IEP status as reported by Phase IV schools.
Group Frequency Percent
Special Education 640 6.2
Regular Education 6,725 65.4
Missing Data 2,911 28.3
Total 10,276 100.0
Table 8. Student ELL status as reported by Phase IV schools.
Group Frequency Percent
English Language Learner 865 8.4
Non-ELL 5,847 56.9
Missing Data 3,564 34.7
Total 10,276 100.0
Table 9. Students retained in grade as reported by Phase IV schools.
Group Frequency Percent
Previously Retained 486 4.7
Never Retained 4,892 47.6
Missing Data 4,898 47.7
Total 10,276 100.0
Instruments
Two sets of assessment instruments were used to determine the effects of the LiteracyFirst program on children’s reading achievement. Literacy First uses a set of assessments as apart of its program: Phonological Awareness, Phonics, Comprehension, and Fluency.7 Allexcept the Fluency assessment are proprietary and were designed to assess essential reading
7 The Phonemic Awareness, Phonics, and Comprehension assessments were proprietary Literacy First tests. Fluencywas measured by a curriculum-based measurement of standard oral reading fluency published by AIMSweb(www.Edformation.com), which is owned by Pearson Education, Inc.
Oklahoma Technical Assistance Center Page 16
skills for children in grades K-5. The Literacy First assessments were the only source of data forstudents in grades PK, K, 1, and 2. The reliability and validity information for these assessmentshas been reviewed in prior evaluation reports.8
The second set of assessments was the Oklahoma Core Curriculum Tests (OCCT),administered to all children in grades 3-8. These standards-based tests are designed to measureall aspects of reading as defined in the Oklahoma state curriculum for each grade level. TheState Department of Education provided OTAC evaluators with OCCT site-level summary data.
The lack of individual student OCCT data has been an impediment to the evaluation ofthe program. Current law states that the Oklahoma State Department of Education will providethis data through its student information system; however, Oklahoma’s Student InformationSystem is not yet operational. In the spring of 2008, the evaluation team met withrepresentatives of Literacy First and its data collector, My Data First (MDF). MDF provided asystem through which student data was collected from each participating school. My Data Firstrepresentatives agreed to include fields to their student data system so that schools could recordOCCT test data along with Literacy First assessment scores. OTAC continued to meet withLF/MDF representatives during the 2008-09, 2009-10, and 2010-11 school years to help themresolve data gathering and recording issues. Despite these efforts, Literacy First has not yetdeveloped a system to routinely collect student-level OCCT data and incorporate that data intoits MDF record-keeping system.
Findings: Literacy First Assessments
The Literacy First assessments database included 10,276 students – all students who wereassessed in Phase IV schools. The data provided to OTAC was in the form of the followingsummary scores:
OGL On Grade Level Students who received instruction in the skill of interest andscored on grade level.
OC Off ContinuumStudents who have mastered all the skills on a test and arethus assumed to be On Grade Level for that particular skillset.
Not OGL Not On Grade Level Students who received instruction in the skill of interest butscored below grade level.
NFAY Not Full Academic Year Students who were not present for the full academic year. No“on grade level” status was recorded for these students.
8 Prior reports are available from OCTP or OTAC.
Oklahoma Technical Assistance Center Page 17
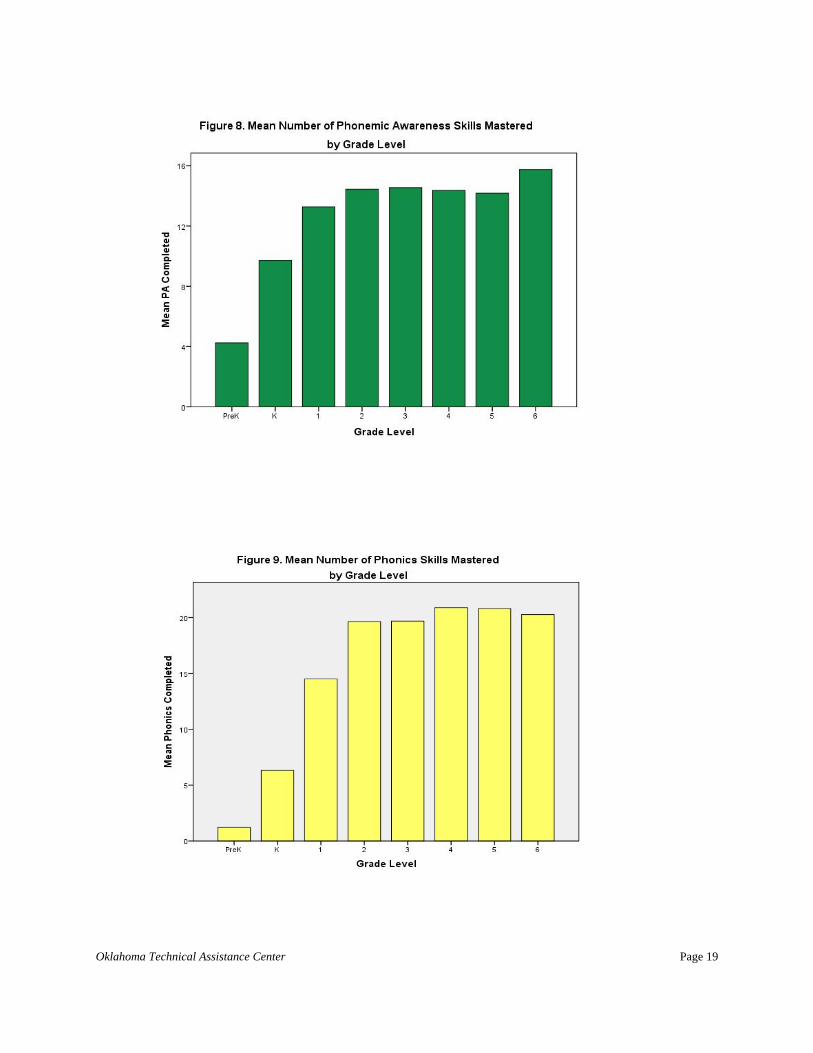
In addition, raw scores were provided for one administration of the Phonemic Awarenessand Phonics tests; these scores recorded the number of skills students had mastered. (The timeof year that the data were recorded was not specified.) The Phonemic Awareness scale had apossible score of 16; the Phonics scale had a possible score of 22.
Tables 10-12 summarize the data by grade level. The tables list, for each skill set(Phonemic Awareness, Phonics, and Fluency), the number of children in each grade level whowere designated as Transient, as Receiving Instruction, and Off Continuum. As noted earlier,Off Continuum students were those who had attained On Grade Level (OGL) status at thebeginning of the school year. The table then displays the number and percentage of studentswho attained OGL status at each of the three assessment points – fall, winter, and spring. By theend of the 2010-11 school year, 80 percent of the students in Phase IV schools were on gradelevel in Phonemic Awareness, 80 percent were OGL in Phonics, and 56 percent were OGL inFluency.
Figure 8 displays growth in Phonemic Awareness assessed by the number of skillsmastered by the students. The highest number of skills reported was 16. As Figure 8 illustrates,the majority of students had mastered these skills by the 2nd grade. There were 22 skills tomaster in Phonics instruction. Figure 9 displays the mean number of skills mastered by gradelevel. In this area, 4th grade represents the grade level in which most students had mastered thecontent.
Oklahoma Technical Assistance Center Page 18
Oklahoma Technical Assistance Center Page 19
Students who were not enrolled in school for a full academicyear (transients) were identified and excluded from all LF analyses.The percentage of transient students identified by LF has fluctuatedover the last three years. The rate reported by LF for 2010-11 washighest rate reported over the past three years (14.2%). The numberof students identified as “transient” was higher than the statewidepercentage of students identified as transient (10%, according to theState Office of Accountability) and three times as high as thepercentage of students excluded from state testing results because they were not present for thefull academic year (4%).
In previous years, OTAC conducted analyses to determine whether students identified astransient were randomly distributed across achievement categories, as would be expected, orwhether the over-identification of “transient” students inflated Literacy First’s achievementstatistics. The results of these analyses indicated that the children identified as “transient” werenot randomly distributed across achievement levels; thus, removing such a large of number ofstudents from statistical analyses had the effect of inflating the number of students rated as ongrade level.
The same analyses were conducted in 2010-11 when OTAC evaluators reviewed the dataon the number of skills mastered in the Phonological Awareness and Phonics, by grade level, todetermine whether “transient” children were, in fact, low achievers. The results suggested someimprovement with similar means across years on the Phonemic Awareness skills mastered. Theanalysis of the Phonics skills data suggested more of a discrepancy. It is recommended thatLiteracy First improve its efforts to provide accurate data by:
C reviewing the criteria and procedures used in identifying transient students;C monitoring data recording procedures by participating school personnel; andC recording the “on grade level” status of each child identified as transient.
The percentage of children identified as transient remained far too high and no OGLstatus was recorded for the 14 percent of students in Phase IV schools identified as “transient.” If no reasonable rationale can be provided for over-identifying children as “transient,” OTACrecommends that the Commission require LF to employ the same criteria as is used by schoolsfor the state OCCT assessments.
The information presented in Tables 10-12 suggests that the Phase IV schools made goodprogress in improving the phonological awareness and phonics skills of students (once transientstudents were excluded). At the end of the school year, 80 percent of students in Grades 1-2were on grade level in Phonological Awareness and 80 percent of 1-4 grade students were ongrade level in phonics. As in prior years, the Fluency data, showed a much lower percentage ofchildren on grade level. This year, 56 percent of the students in Phase IV schools were OGL inFluency at the end of the school year compared to 41 percent in 2009-10.
Transient Students
2008-09 13.2%2009-10 11.8%2010-11 14.2%
Oklahoma Technical Assistance Center Page 20
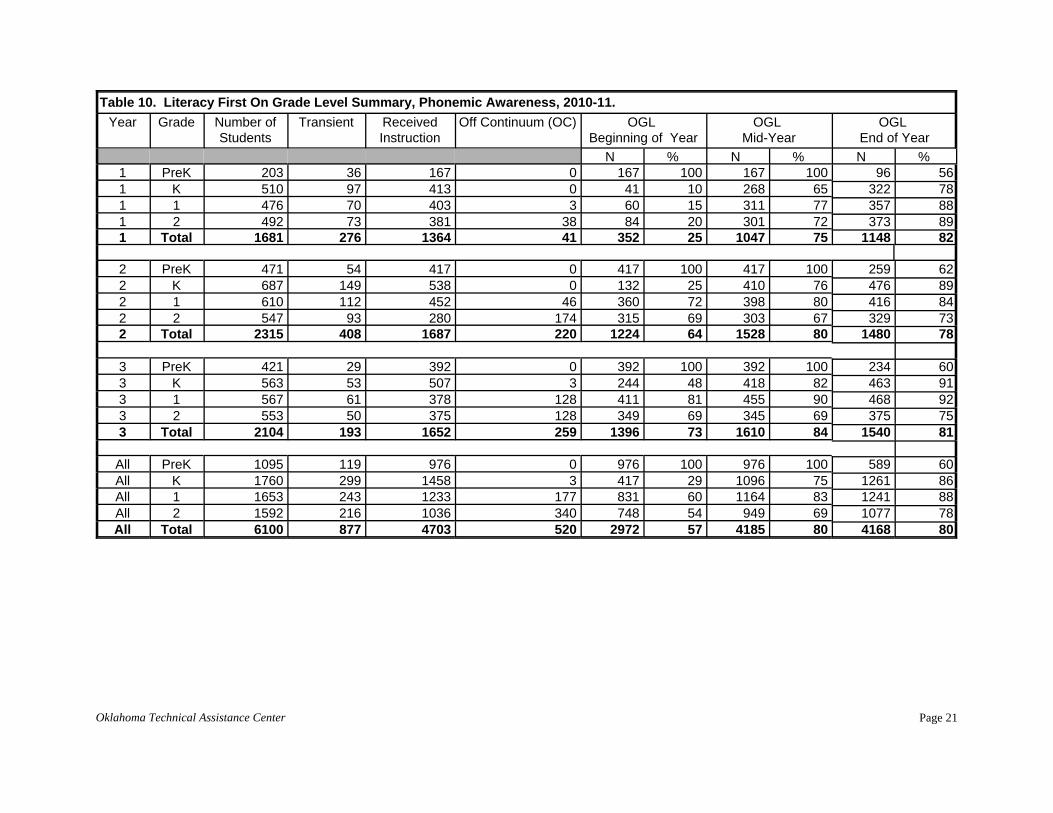
Table 10. Literacy First On Grade Level Summary, Phonemic Awareness, 2010-11.Year Grade Number of
StudentsTransient Received
InstructionOff Continuum (OC) OGL
Beginning of YearOGL
Mid-YearOGL
End of YearN % N % N %
1 PreK 203 36 167 0 167 100 167 100 96 561 K 510 97 413 0 41 10 268 65 322 781 1 476 70 403 3 60 15 311 77 357 881 2 492 73 381 38 84 20 301 72 373 891 Total 1681 276 1364 41 352 25 1047 75 1148 82
2 PreK 471 54 417 0 417 100 417 100 259 622 K 687 149 538 0 132 25 410 76 476 892 1 610 112 452 46 360 72 398 80 416 842 2 547 93 280 174 315 69 303 67 329 732 Total 2315 408 1687 220 1224 64 1528 80 1480 78
3 PreK 421 29 392 0 392 100 392 100 234 603 K 563 53 507 3 244 48 418 82 463 913 1 567 61 378 128 411 81 455 90 468 923 2 553 50 375 128 349 69 345 69 375 753 Total 2104 193 1652 259 1396 73 1610 84 1540 81
All PreK 1095 119 976 0 976 100 976 100 589 60All K 1760 299 1458 3 417 29 1096 75 1261 86All 1 1653 243 1233 177 831 60 1164 83 1241 88All 2 1592 216 1036 340 748 54 949 69 1077 78All Total 6100 877 4703 520 2972 57 4185 80 4168 80
Oklahoma Technical Assistance Center Page 21
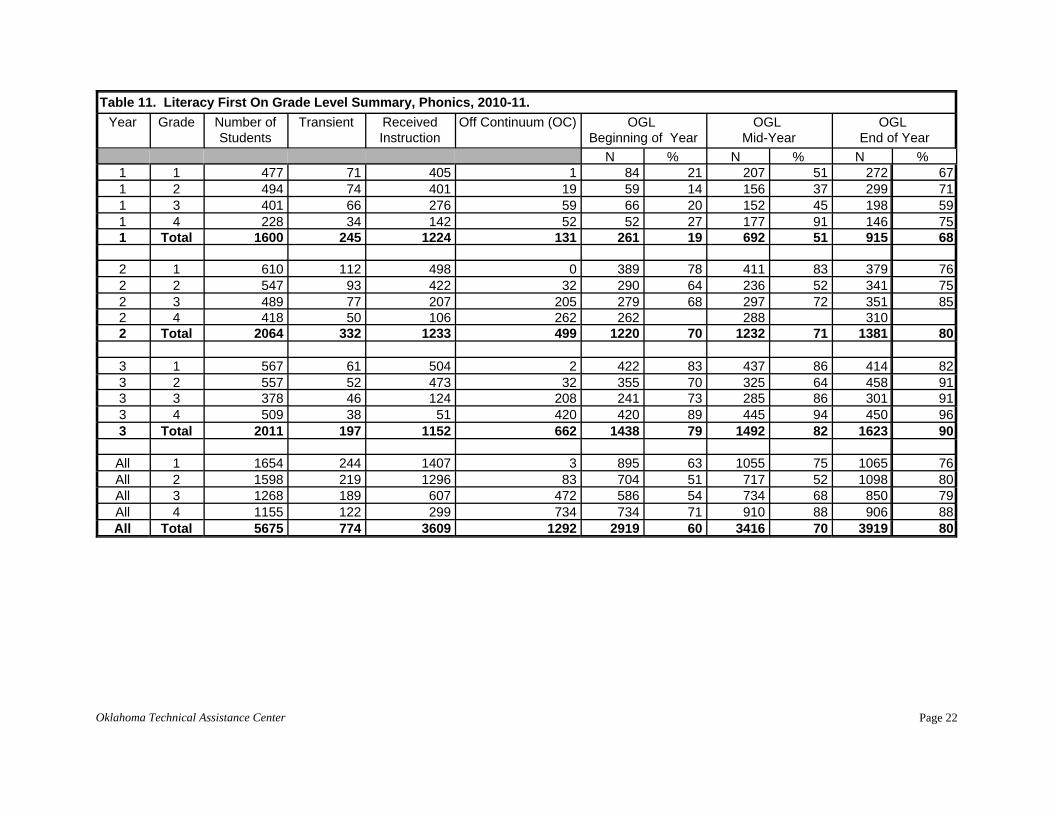
Table 11. Literacy First On Grade Level Summary, Phonics, 2010-11.Year Grade Number of
StudentsTransient Received
InstructionOff Continuum (OC) OGL
Beginning of YearOGL
Mid-YearOGL
End of YearN % N % N %
1 1 477 71 405 1 84 21 207 51 272 671 2 494 74 401 19 59 14 156 37 299 711 3 401 66 276 59 66 20 152 45 198 591 4 228 34 142 52 52 27 177 91 146 751 Total 1600 245 1224 131 261 19 692 51 915 68
2 1 610 112 498 0 389 78 411 83 379 762 2 547 93 422 32 290 64 236 52 341 752 3 489 77 207 205 279 68 297 72 351 852 4 418 50 106 262 262 288 3102 Total 2064 332 1233 499 1220 70 1232 71 1381 80
3 1 567 61 504 2 422 83 437 86 414 823 2 557 52 473 32 355 70 325 64 458 913 3 378 46 124 208 241 73 285 86 301 913 4 509 38 51 420 420 89 445 94 450 963 Total 2011 197 1152 662 1438 79 1492 82 1623 90
All 1 1654 244 1407 3 895 63 1055 75 1065 76All 2 1598 219 1296 83 704 51 717 52 1098 80All 3 1268 189 607 472 586 54 734 68 850 79All 4 1155 122 299 734 734 71 910 88 906 88All Total 5675 774 3609 1292 2919 60 3416 70 3919 80
Oklahoma Technical Assistance Center Page 22
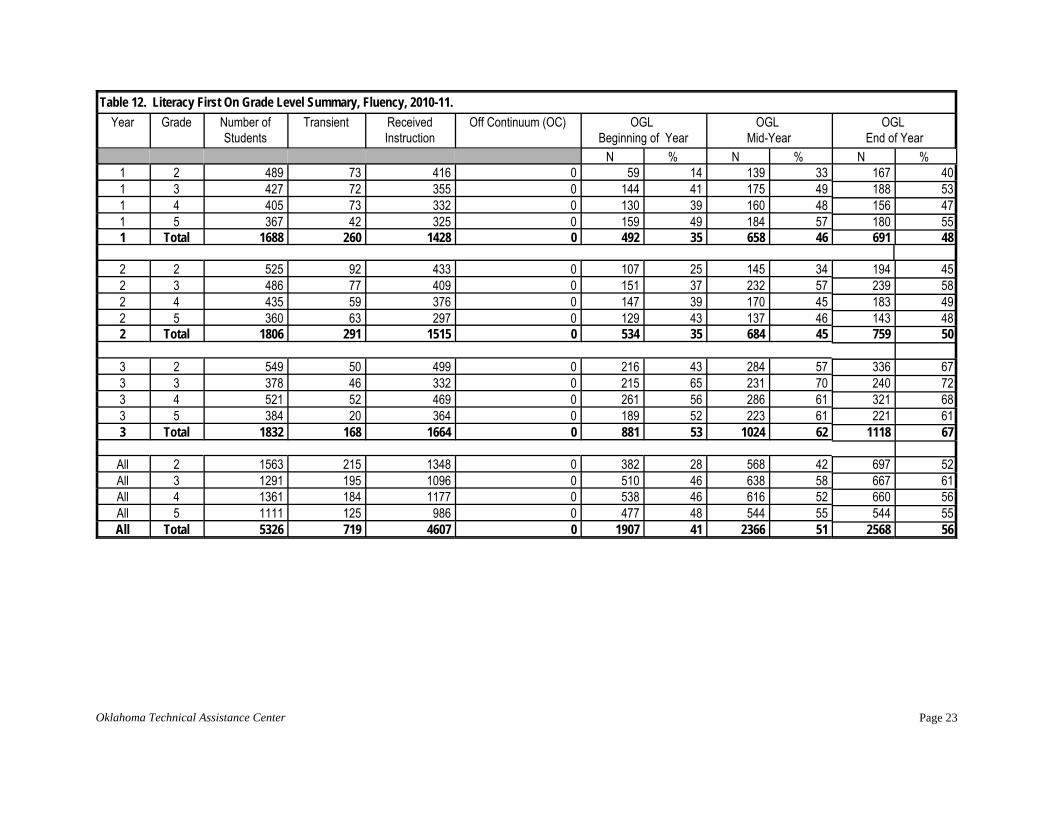
Table 12. Literacy First On Grade Level Summary, Fluency, 2010-11.Year Grade Number of
StudentsTransient Received
InstructionOff Continuum (OC) OGL
Beginning of YearOGL
Mid-YearOGL
End of YearN % N % N %
1 2 489 73 416 0 59 14 139 33 167 401 3 427 72 355 0 144 41 175 49 188 531 4 405 73 332 0 130 39 160 48 156 471 5 367 42 325 0 159 49 184 57 180 551 Total 1688 260 1428 0 492 35 658 46 691 48
2 2 525 92 433 0 107 25 145 34 194 452 3 486 77 409 0 151 37 232 57 239 582 4 435 59 376 0 147 39 170 45 183 492 5 360 63 297 0 129 43 137 46 143 482 Total 1806 291 1515 0 534 35 684 45 759 50
3 2 549 50 499 0 216 43 284 57 336 673 3 378 46 332 0 215 65 231 70 240 723 4 521 52 469 0 261 56 286 61 321 683 5 384 20 364 0 189 52 223 61 221 613 Total 1832 168 1664 0 881 53 1024 62 1118 67
All 2 1563 215 1348 0 382 28 568 42 697 52All 3 1291 195 1096 0 510 46 638 58 667 61All 4 1361 184 1177 0 538 46 616 52 660 56All 5 1111 125 986 0 477 48 544 55 544 55All Total 5326 719 4607 0 1907 41 2366 51 2568 56
Oklahoma Technical Assistance Center Page 23
There did appear to be a difference on the Phonics and Fluency assessment among thecohorts. On the Phonics assessment, schools in their first year of LF implementation had 68percent of their students OGL at the end of the year compared to 80 percent for the second yearschools and 90 percent for the third year schools. On the Fluency assessment, first year schoolshad 48 percent of their student OGL compared to 50 percent the second year and 67 percent forthe third year cohort.
My Data First also provided information for two comprehension assessments. One forstudents in grades K-2 and one for intermediate grades. Numerous discrepancies were noted inthe comprehension data. For example, more than a quarter of the students who took the K-2assessment were in grades 3-5. On the intermediate assessment, no students were coded as OGLsuggesting there may have been some confusion regarding the setting of grade levels by LiteracyFirst. Finally, MDF reported that some classes were deleted by the campus users for reasonsunknown. For these reasons, analyses were not conducted on this information.
Longitudinal study. Since the Literacy First assessments are proprietary, criterion-referenced tests, no normative data were available, and there was no basis for comparing theresults from Phase IV schools to those of schools that did not employ LF methods. If data fromnon-LF schools in Oklahoma are available to LF, it would be helpful to know whether studentsin non-Phase IV schools learned and mastered the phonics skills at the same rate.
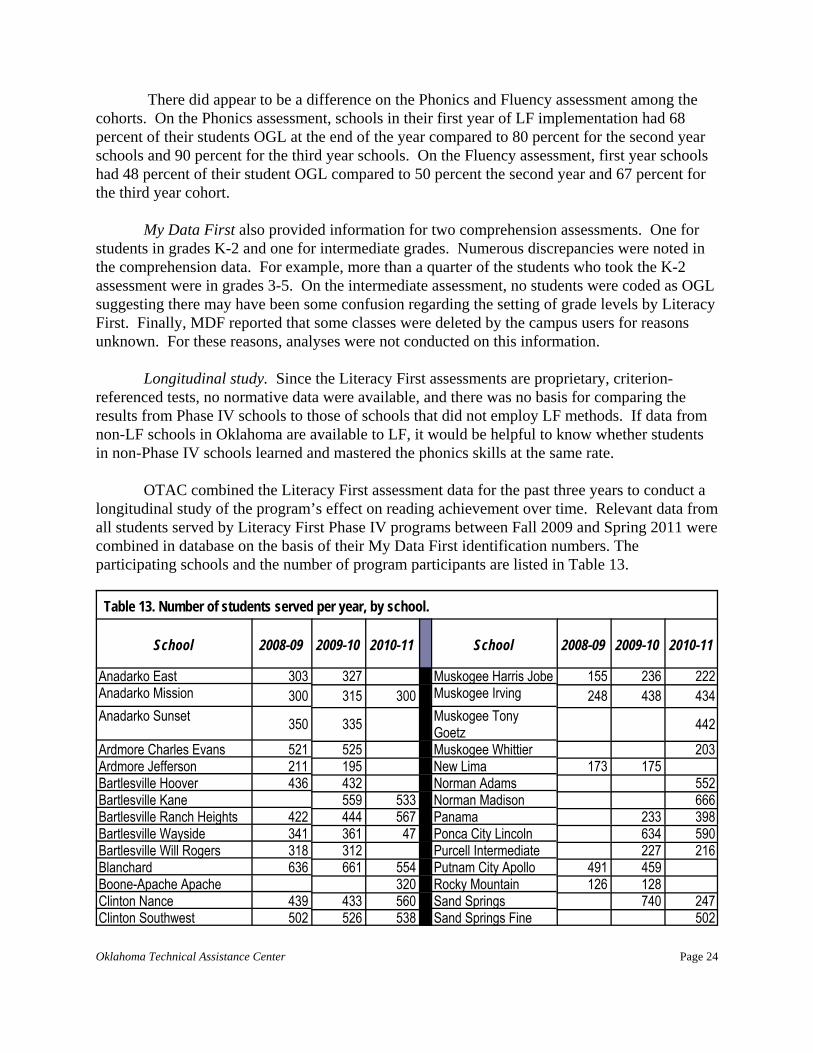
OTAC combined the Literacy First assessment data for the past three years to conduct alongitudinal study of the program’s effect on reading achievement over time. Relevant data fromall students served by Literacy First Phase IV programs between Fall 2009 and Spring 2011 werecombined in database on the basis of their My Data First identification numbers. Theparticipating schools and the number of program participants are listed in Table 13.
Table 13. Number of students served per year, by school.
School 2008-09 2009-10 2010-11 School 2008-09 2009-10 2010-11
Anadarko East 303 327 Muskogee Harris Jobe 155 236 222Anadarko Mission 300 315 300 Muskogee Irving 248 438 434Anadarko Sunset 350 335 Muskogee Tony
Goetz 442Ardmore Charles Evans 521 525 Muskogee Whittier 203Ardmore Jefferson 211 195 New Lima 173 175Bartlesville Hoover 436 432 Norman Adams 552Bartlesville Kane 559 533 Norman Madison 666Bartlesville Ranch Heights 422 444 567 Panama 233 398Bartlesville Wayside 341 361 47 Ponca City Lincoln 634 590Bartlesville Will Rogers 318 312 Purcell Intermediate 227 216Blanchard 636 661 554 Putnam City Apollo 491 459Boone-Apache Apache 320 Rocky Mountain 126 128Clinton Nance 439 433 560 Sand Springs 740 247Clinton Southwest 502 526 538 Sand Springs Fine 502
Oklahoma Technical Assistance Center Page 24
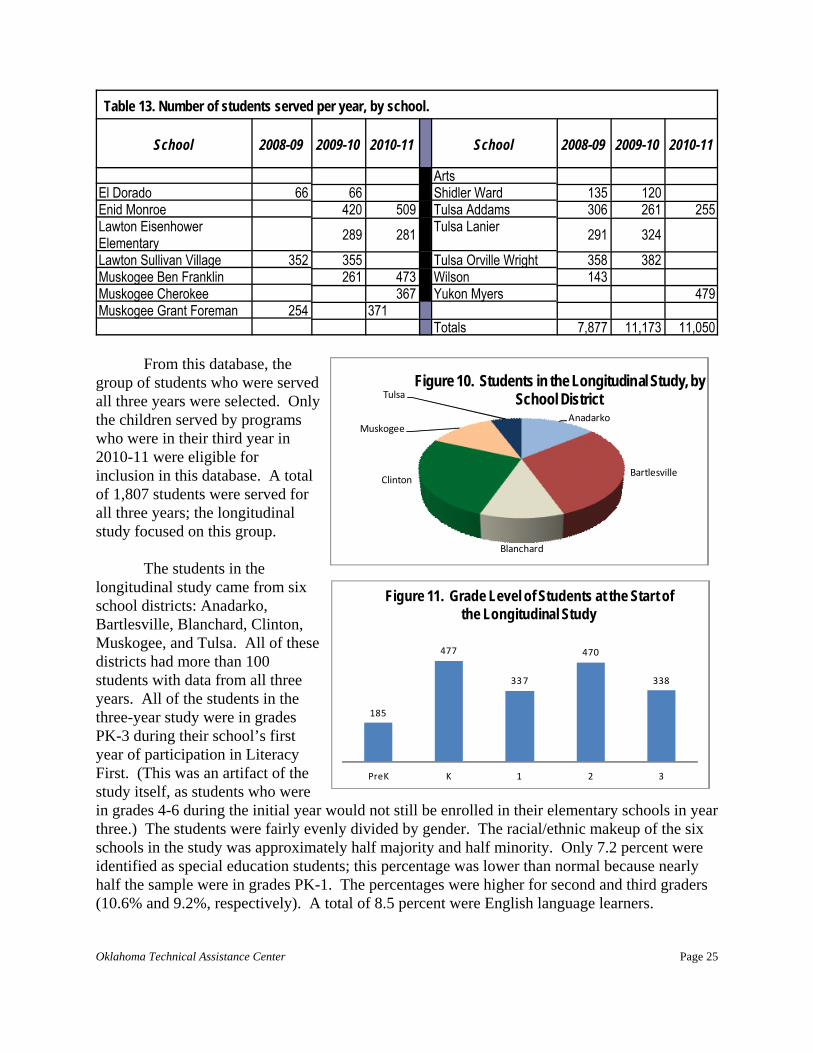
Table 13. Number of students served per year, by school.
School 2008-09 2009-10 2010-11 School 2008-09 2009-10 2010-11
ArtsEl Dorado 66 66 Shidler Ward 135 120Enid Monroe 420 509 Tulsa Addams 306 261 255Lawton EisenhowerElementary 289 281 Tulsa Lanier 291 324Lawton Sullivan Village 352 355 Tulsa Orville Wright 358 382Muskogee Ben Franklin 261 473 Wilson 143Muskogee Cherokee 367 Yukon Myers 479Muskogee Grant Foreman 254 371
Totals 7,877 11,173 11,050
From this database, thegroup of students who were servedall three years were selected. Onlythe children served by programswho were in their third year in2010-11 were eligible forinclusion in this database. A totalof 1,807 students were served forall three years; the longitudinalstudy focused on this group.
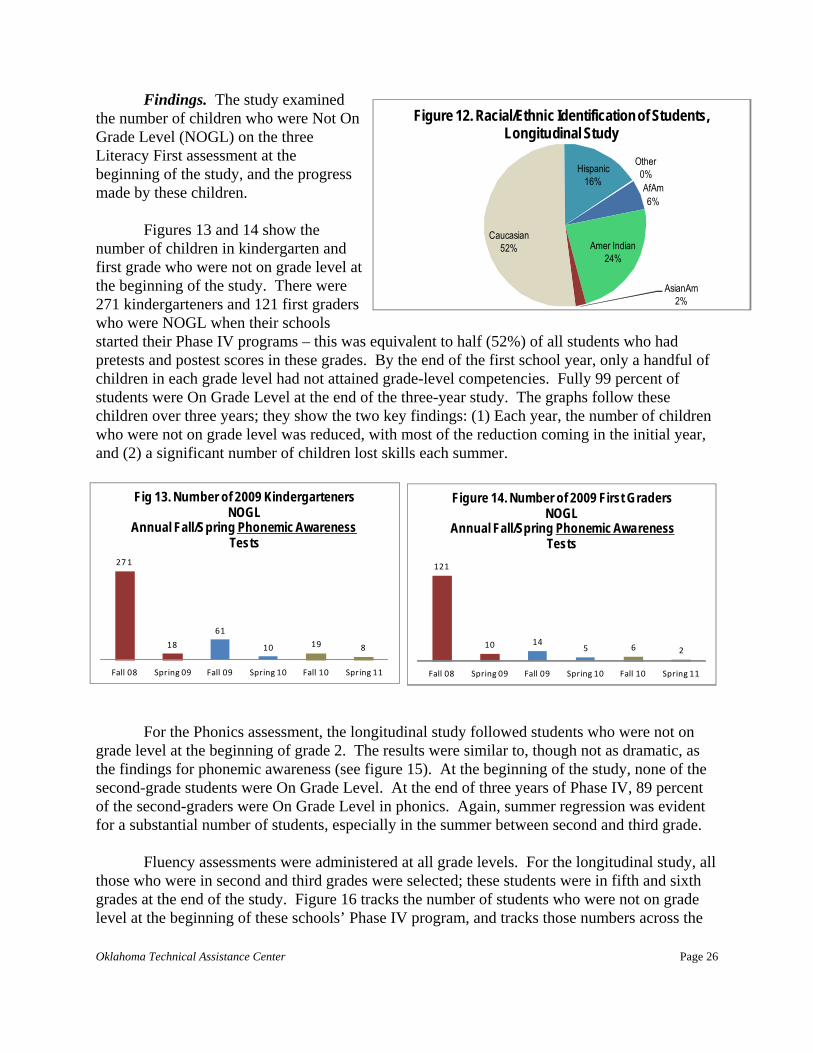
The students in thelongitudinal study came from sixschool districts: Anadarko,Bartlesville, Blanchard, Clinton,Muskogee, and Tulsa. All of thesedistricts had more than 100students with data from all threeyears. All of the students in thethree-year study were in gradesPK-3 during their school’s firstyear of participation in LiteracyFirst. (This was an artifact of thestudy itself, as students who werein grades 4-6 during the initial year would not still be enrolled in their elementary schools in yearthree.) The students were fairly evenly divided by gender. The racial/ethnic makeup of the sixschools in the study was approximately half majority and half minority. Only 7.2 percent wereidentified as special education students; this percentage was lower than normal because nearlyhalf the sample were in grades PK-1. The percentages were higher for second and third graders(10.6% and 9.2%, respectively). A total of 8.5 percent were English language learners.
Anadarko
Bartlesville
Blanchard
Clinton
Muskogee
TulsaFigure 10. Students in the Longitudinal Study, by
School District
185
477
337
470
338
PreK K 1 2 3
Figure 11. Grade Level of Students at the Start of the Longitudinal Study
Oklahoma Technical Assistance Center Page 25
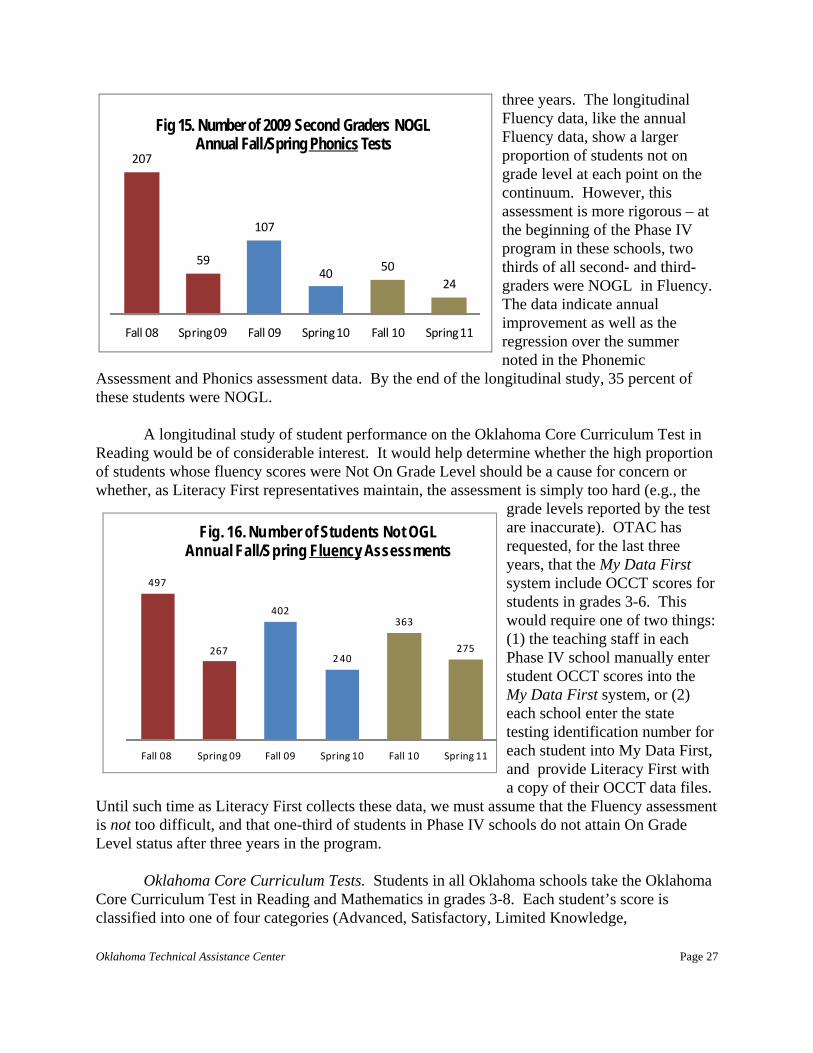
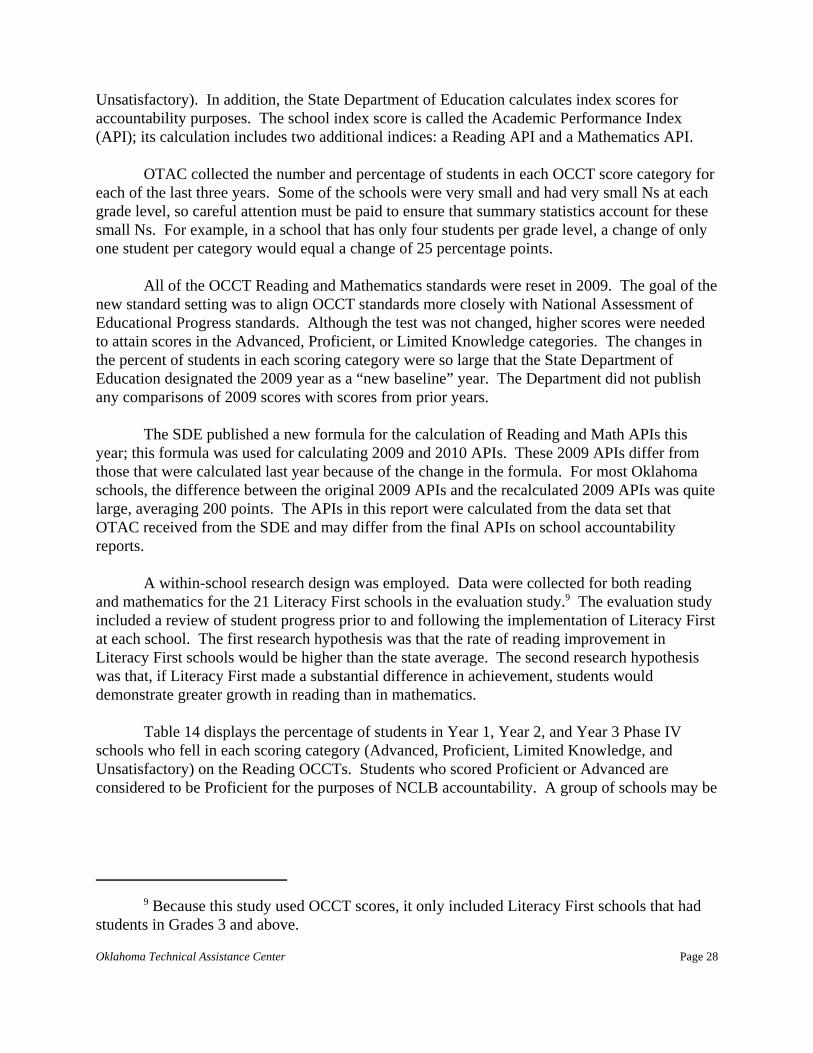
Findings. The study examinedthe number of children who were Not OnGrade Level (NOGL) on the threeLiteracy First assessment at thebeginning of the study, and the progressmade by these children.
Figures 13 and 14 show thenumber of children in kindergarten andfirst grade who were not on grade level atthe beginning of the study. There were271 kindergarteners and 121 first graderswho were NOGL when their schoolsstarted their Phase IV programs – this was equivalent to half (52%) of all students who hadpretests and postest scores in these grades. By the end of the first school year, only a handful ofchildren in each grade level had not attained grade-level competencies. Fully 99 percent ofstudents were On Grade Level at the end of the three-year study. The graphs follow thesechildren over three years; they show the two key findings: (1) Each year, the number of childrenwho were not on grade level was reduced, with most of the reduction coming in the initial year,and (2) a significant number of children lost skills each summer.
For the Phonics assessment, the longitudinal study followed students who were not ongrade level at the beginning of grade 2. The results were similar to, though not as dramatic, asthe findings for phonemic awareness (see figure 15). At the beginning of the study, none of thesecond-grade students were On Grade Level. At the end of three years of Phase IV, 89 percentof the second-graders were On Grade Level in phonics. Again, summer regression was evidentfor a substantial number of students, especially in the summer between second and third grade.
Fluency assessments were administered at all grade levels. For the longitudinal study, allthose who were in second and third grades were selected; these students were in fifth and sixthgrades at the end of the study. Figure 16 tracks the number of students who were not on gradelevel at the beginning of these schools’ Phase IV program, and tracks those numbers across the
271
18
61
10 19 8
Fall 08 Spring 09 Fall 09 Spring 10 Fall 10 Spring 11
Fig 13. Number of 2009 Kindergarteners NOGL
Annual Fall/Spring Phonemic Awareness Tests
121
10 145 6 2
Fall 08 Spring 09 Fall 09 Spring 10 Fall 10 Spring 11
Figure 14. Number of 2009 First Graders NOGL
Annual Fall/Spring Phonemic Awareness Tests
AfAm6%
Amer Indian24%
AsianAm2%
Caucasian52%
Hispanic16%
Other0%
Figure 12. Racial/Ethnic Identification of Students, Longitudinal Study
Oklahoma Technical Assistance Center Page 26
three years. The longitudinalFluency data, like the annualFluency data, show a largerproportion of students not ongrade level at each point on thecontinuum. However, thisassessment is more rigorous – atthe beginning of the Phase IVprogram in these schools, twothirds of all second- and third-graders were NOGL in Fluency. The data indicate annualimprovement as well as theregression over the summernoted in the Phonemic
Assessment and Phonics assessment data. By the end of the longitudinal study, 35 percent ofthese students were NOGL.
A longitudinal study of student performance on the Oklahoma Core Curriculum Test inReading would be of considerable interest. It would help determine whether the high proportionof students whose fluency scores were Not On Grade Level should be a cause for concern orwhether, as Literacy First representatives maintain, the assessment is simply too hard (e.g., the
grade levels reported by the testare inaccurate). OTAC hasrequested, for the last threeyears, that the My Data Firstsystem include OCCT scores forstudents in grades 3-6. Thiswould require one of two things:(1) the teaching staff in eachPhase IV school manually enterstudent OCCT scores into theMy Data First system, or (2)each school enter the statetesting identification number foreach student into My Data First,and provide Literacy First witha copy of their OCCT data files.
Until such time as Literacy First collects these data, we must assume that the Fluency assessmentis not too difficult, and that one-third of students in Phase IV schools do not attain On GradeLevel status after three years in the program.
Oklahoma Core Curriculum Tests. Students in all Oklahoma schools take the OklahomaCore Curriculum Test in Reading and Mathematics in grades 3-8. Each student’s score isclassified into one of four categories (Advanced, Satisfactory, Limited Knowledge,
207
59
107
40 5024
Fall 08 Spring 09 Fall 09 Spring 10 Fall 10 Spring 11
Fig 15. Number of 2009 Second Graders NOGLAnnual Fall/Spring Phonics Tests
497
267
402
240
363
275
Fall 08 Spring 09 Fall 09 Spring 10 Fall 10 Spring 11
Fig. 16. Number of Students Not OGL Annual Fall/Spring Fluency Assessments
Oklahoma Technical Assistance Center Page 27
Unsatisfactory). In addition, the State Department of Education calculates index scores foraccountability purposes. The school index score is called the Academic Performance Index(API); its calculation includes two additional indices: a Reading API and a Mathematics API.
OTAC collected the number and percentage of students in each OCCT score category foreach of the last three years. Some of the schools were very small and had very small Ns at eachgrade level, so careful attention must be paid to ensure that summary statistics account for thesesmall Ns. For example, in a school that has only four students per grade level, a change of onlyone student per category would equal a change of 25 percentage points.
All of the OCCT Reading and Mathematics standards were reset in 2009. The goal of thenew standard setting was to align OCCT standards more closely with National Assessment ofEducational Progress standards. Although the test was not changed, higher scores were neededto attain scores in the Advanced, Proficient, or Limited Knowledge categories. The changes inthe percent of students in each scoring category were so large that the State Department ofEducation designated the 2009 year as a “new baseline” year. The Department did not publishany comparisons of 2009 scores with scores from prior years.
The SDE published a new formula for the calculation of Reading and Math APIs thisyear; this formula was used for calculating 2009 and 2010 APIs. These 2009 APIs differ fromthose that were calculated last year because of the change in the formula. For most Oklahomaschools, the difference between the original 2009 APIs and the recalculated 2009 APIs was quitelarge, averaging 200 points. The APIs in this report were calculated from the data set thatOTAC received from the SDE and may differ from the final APIs on school accountabilityreports.
A within-school research design was employed. Data were collected for both readingand mathematics for the 21 Literacy First schools in the evaluation study.9 The evaluation studyincluded a review of student progress prior to and following the implementation of Literacy Firstat each school. The first research hypothesis was that the rate of reading improvement in Literacy First schools would be higher than the state average. The second research hypothesiswas that, if Literacy First made a substantial difference in achievement, students woulddemonstrate greater growth in reading than in mathematics.
Table 14 displays the percentage of students in Year 1, Year 2, and Year 3 Phase IVschools who fell in each scoring category (Advanced, Proficient, Limited Knowledge, andUnsatisfactory) on the Reading OCCTs. Students who scored Proficient or Advanced areconsidered to be Proficient for the purposes of NCLB accountability. A group of schools may be
9 Because this study used OCCT scores, it only included Literacy First schools that hadstudents in Grades 3 and above.
Oklahoma Technical Assistance Center Page 28
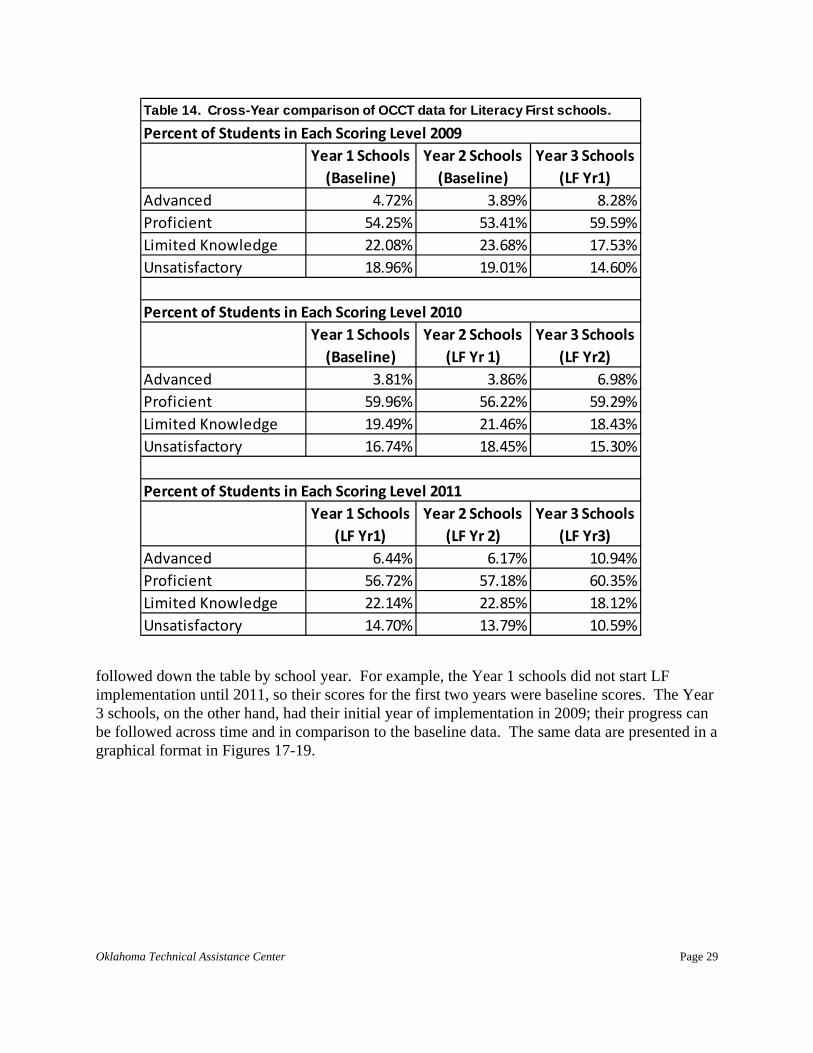
followed down the table by school year. For example, the Year 1 schools did not start LFimplementation until 2011, so their scores for the first two years were baseline scores. The Year3 schools, on the other hand, had their initial year of implementation in 2009; their progress canbe followed across time and in comparison to the baseline data. The same data are presented in agraphical format in Figures 17-19.
Year 1 Schools (Baseline)
Year 2 Schools (Baseline)
Year 3 Schools (LF Yr1)
Advanced 4.72% 3.89% 8.28%Proficient 54.25% 53.41% 59.59%Limited Knowledge 22.08% 23.68% 17.53%Unsatisfactory 18.96% 19.01% 14.60%
Year 1 Schools (Baseline)
Year 2 Schools (LF Yr 1)
Year 3 Schools (LF Yr2)
Advanced 3.81% 3.86% 6.98%Proficient 59.96% 56.22% 59.29%Limited Knowledge 19.49% 21.46% 18.43%Unsatisfactory 16.74% 18.45% 15.30%
Year 1 Schools (LF Yr1)
Year 2 Schools (LF Yr 2)
Year 3 Schools (LF Yr3)
Advanced 6.44% 6.17% 10.94%Proficient 56.72% 57.18% 60.35%Limited Knowledge 22.14% 22.85% 18.12%Unsatisfactory 14.70% 13.79% 10.59%
Table 14. Cross-Year comparison of OCCT data for Literacy First schools.
Percent of Students in Each Scoring Level 2009
Percent of Students in Each Scoring Level 2010
Percent of Students in Each Scoring Level 2011
Oklahoma Technical Assistance Center Page 29
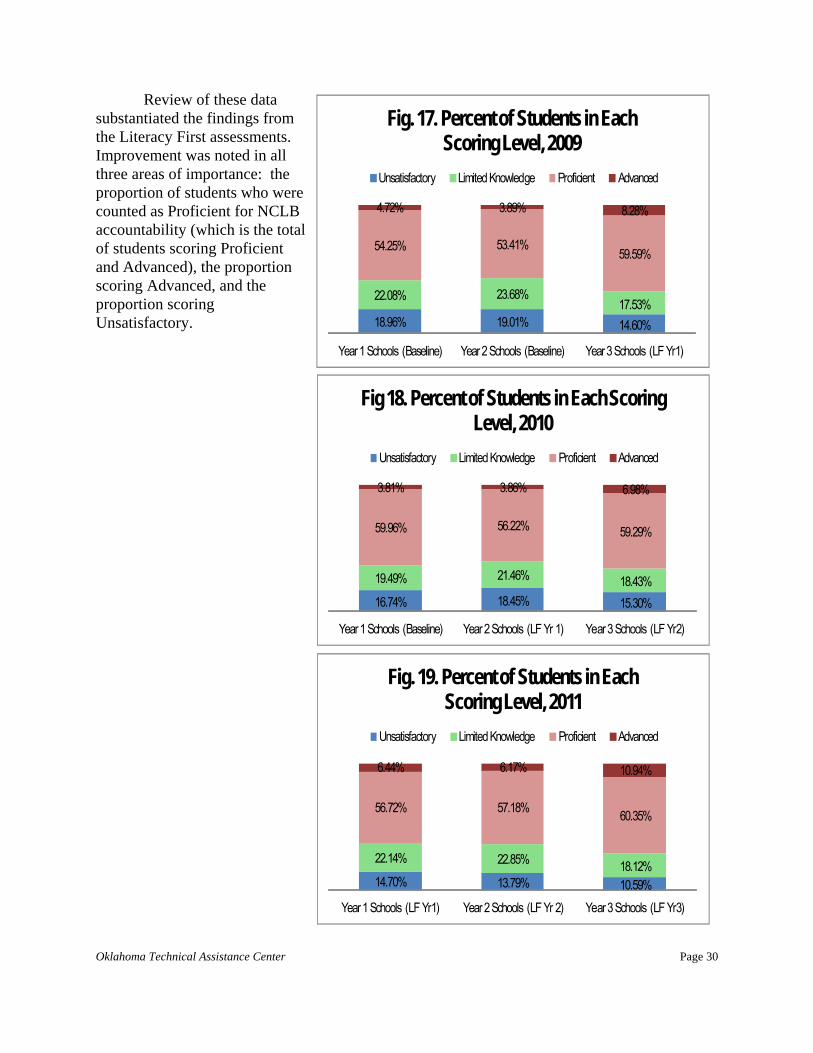
Review of these datasubstantiated the findings fromthe Literacy First assessments.Improvement was noted in allthree areas of importance: theproportion of students who werecounted as Proficient for NCLBaccountability (which is the totalof students scoring Proficientand Advanced), the proportionscoring Advanced, and theproportion scoringUnsatisfactory. 18.96% 19.01% 14.60%
22.08% 23.68%17.53%
54.25% 53.41%59.59%
4.72% 3.89% 8.28%
Year 1 Schools (Baseline) Year 2 Schools (Baseline) Year 3 Schools (LF Yr1)
Fig. 17. Percent of Students in Each Scoring Level, 2009
Unsatisfactory Limited Knowledge Proficient Advanced
16.74% 18.45% 15.30%
19.49% 21.46% 18.43%
59.96% 56.22% 59.29%
3.81% 3.86% 6.98%
Year 1 Schools (Baseline) Year 2 Schools (LF Yr 1) Year 3 Schools (LF Yr2)
Fig 18. Percent of Students in Each Scoring Level, 2010
Unsatisfactory Limited Knowledge Proficient Advanced
14.70% 13.79% 10.59%
22.14% 22.85% 18.12%
56.72% 57.18% 60.35%
6.44% 6.17% 10.94%
Year 1 Schools (LF Yr1) Year 2 Schools (LF Yr 2) Year 3 Schools (LF Yr3)
Fig. 19. Percent of Students in Each Scoring Level, 2011
Unsatisfactory Limited Knowledge Proficient Advanced
Oklahoma Technical Assistance Center Page 30
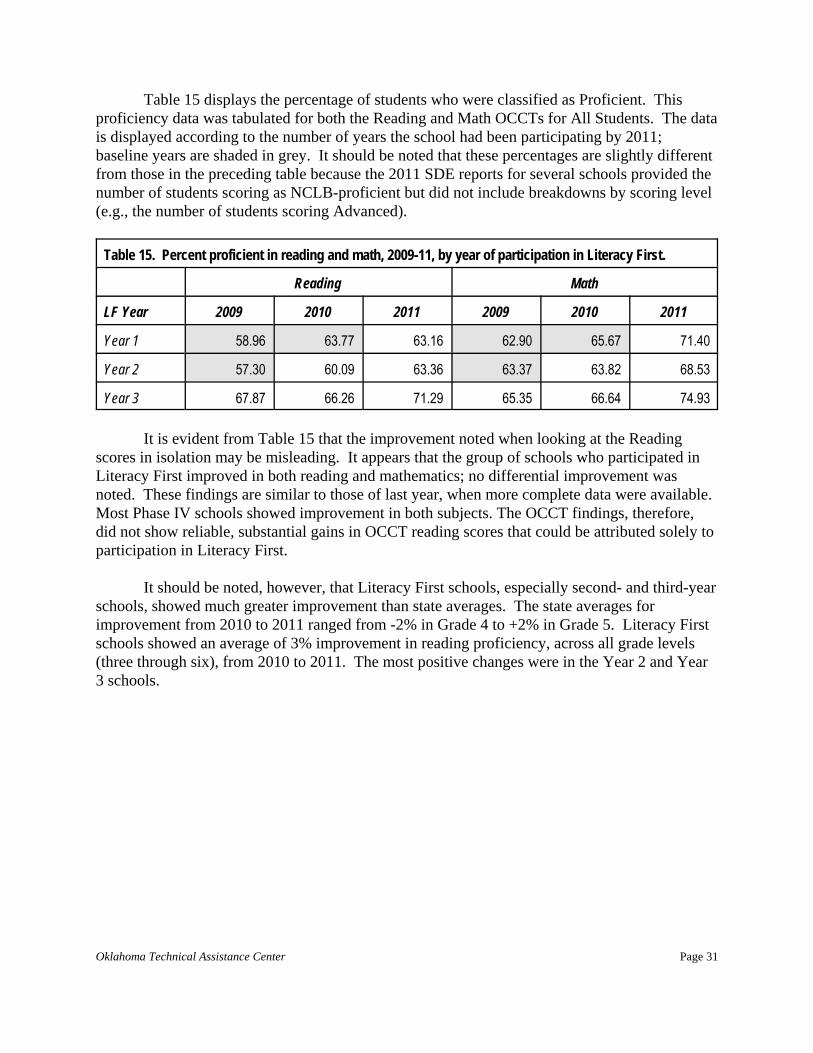
Table 15 displays the percentage of students who were classified as Proficient. Thisproficiency data was tabulated for both the Reading and Math OCCTs for All Students. The datais displayed according to the number of years the school had been participating by 2011;baseline years are shaded in grey. It should be noted that these percentages are slightly differentfrom those in the preceding table because the 2011 SDE reports for several schools provided thenumber of students scoring as NCLB-proficient but did not include breakdowns by scoring level(e.g., the number of students scoring Advanced).
Table 15. Percent proficient in reading and math, 2009-11, by year of participation in Literacy First.
Reading Math
LF Year 2009 2010 2011 2009 2010 2011
Year 1 58.96 63.77 63.16 62.90 65.67 71.40
Year 2 57.30 60.09 63.36 63.37 63.82 68.53
Year 3 67.87 66.26 71.29 65.35 66.64 74.93
It is evident from Table 15 that the improvement noted when looking at the Readingscores in isolation may be misleading. It appears that the group of schools who participated inLiteracy First improved in both reading and mathematics; no differential improvement wasnoted. These findings are similar to those of last year, when more complete data were available. Most Phase IV schools showed improvement in both subjects. The OCCT findings, therefore,did not show reliable, substantial gains in OCCT reading scores that could be attributed solely toparticipation in Literacy First.
It should be noted, however, that Literacy First schools, especially second- and third-yearschools, showed much greater improvement than state averages. The state averages forimprovement from 2010 to 2011 ranged from -2% in Grade 4 to +2% in Grade 5. Literacy Firstschools showed an average of 3% improvement in reading proficiency, across all grade levels(three through six), from 2010 to 2011. The most positive changes were in the Year 2 and Year3 schools.
Oklahoma Technical Assistance Center Page 31