Embed Size (px)
Citation preview
Litchi,Banana Industry in Litchi,Banana Industry in ChinaChina
By:By:
Yi Yi GanjunGanjunFruit Tree Research InstituteFruit Tree Research InstituteGuangdong Academy of Agricultural SciencesGuangdong Academy of Agricultural SciencesGuangzhou, 510640Guangzhou, 510640P.R. ChinaP.R. China
Litchi Industry in the WorldLitchi Industry in the World
LitchLitch((LitchiLitchi chinensischinensis SonnSonn..)) originated from southern China, originated from southern China,
north of Vietnam and north of Vietnam and malayislandmalayisland
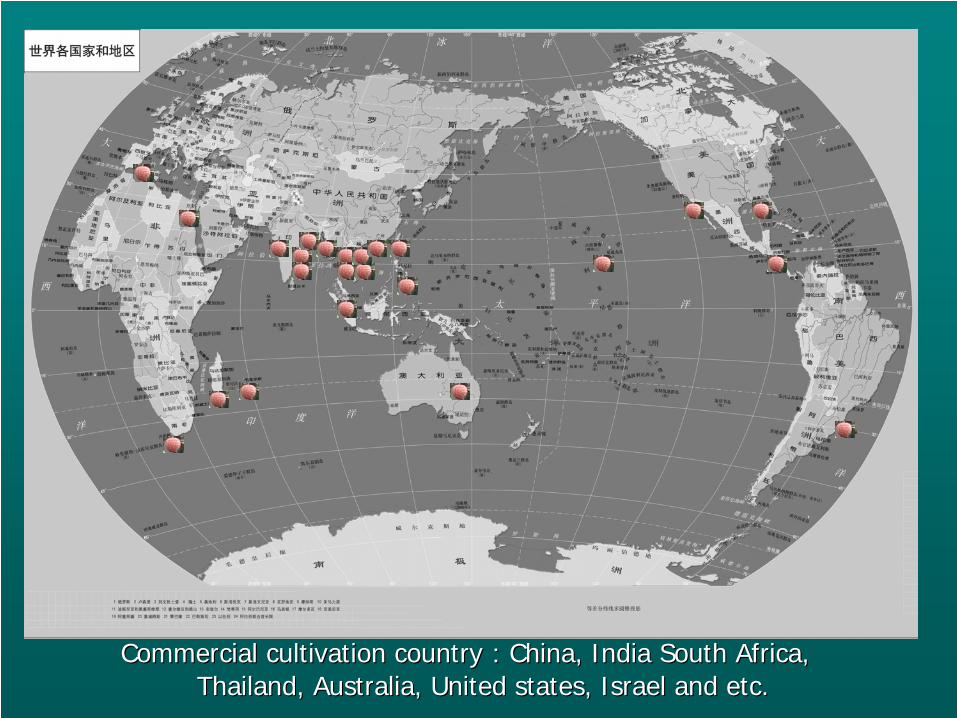
Commercial cultivation countryCommercial cultivation country::China, India South Africa, China, India South Africa, Thailand, Australia, United states, Israel and etc.Thailand, Australia, United states, Israel and etc.
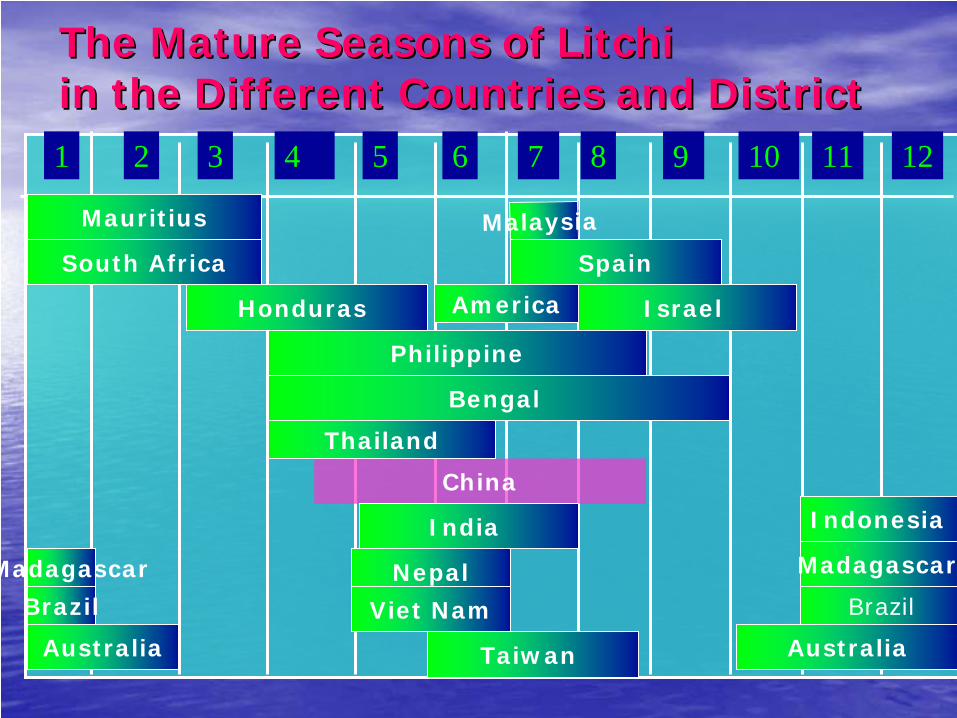
The Mature Seasons of Litchi The Mature Seasons of Litchi in the Different Countries and Districtin the Different Countries and District
123 4 5 6 7 8 9 10 111 2
Australia
China
Honduras
Indonesia
Malaysia
South Africa
Nepal
Bengal
Brazil
Philippine
India
Israel
Madagascar
Mauritius
Spain
Taiwan
Thailand
America
Australia
Viet NamBrazil
Madagascar
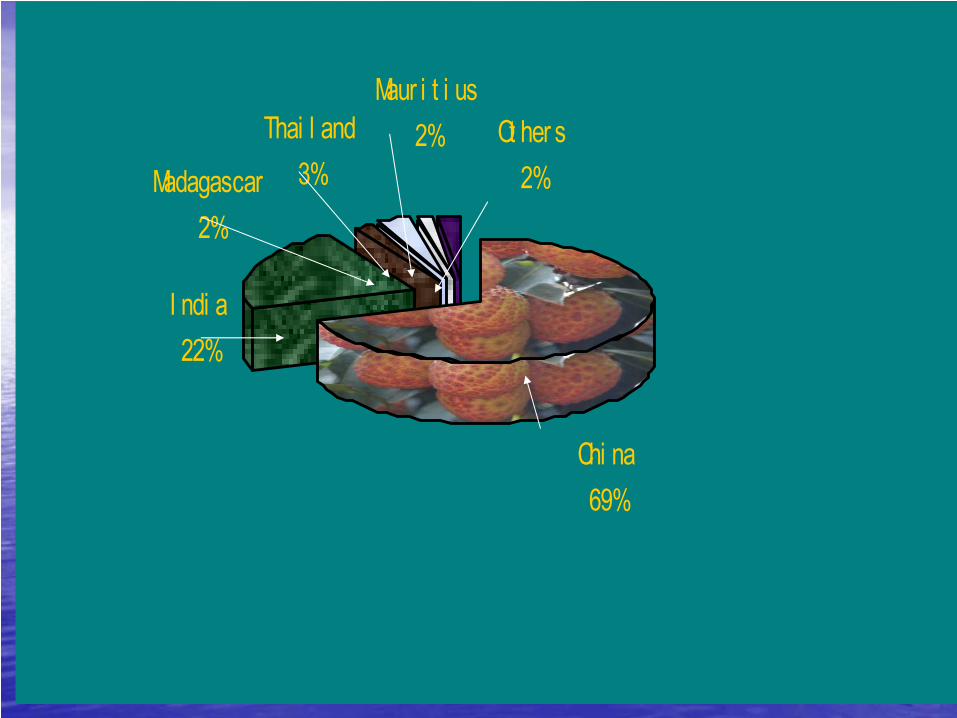
The Main Producers of Litchi in the World, 1999Ot her s
2%
I ndi a22%
Chi na69%
Madagascar2%
Thai l and3%
Maur i t i us2%

Litchi industry in ChinaLitchi industry in China
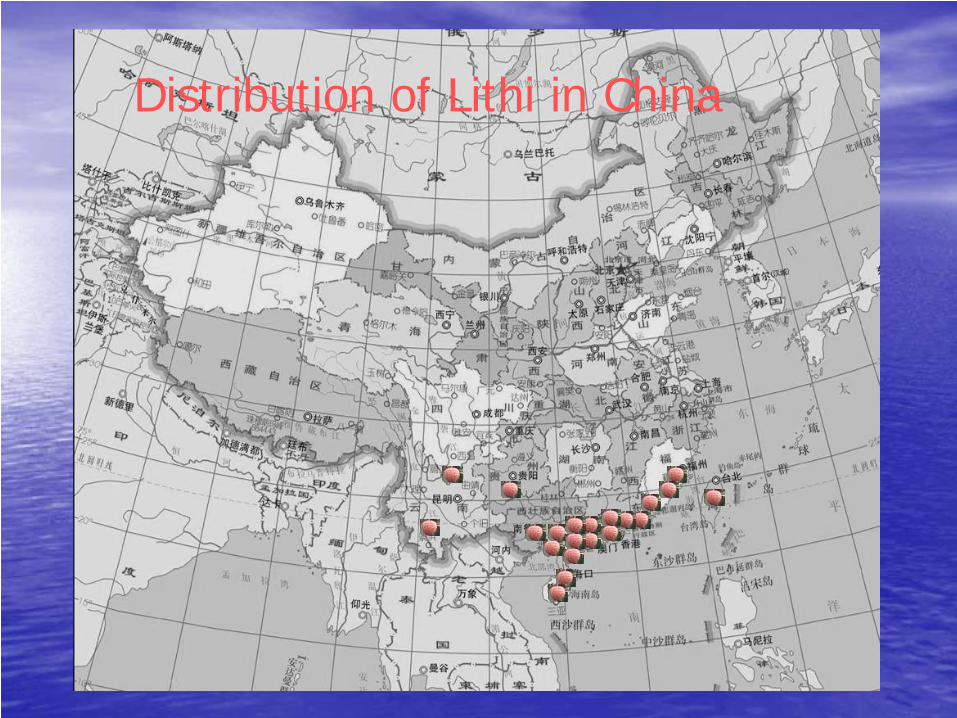
Distribution of Lithi in China
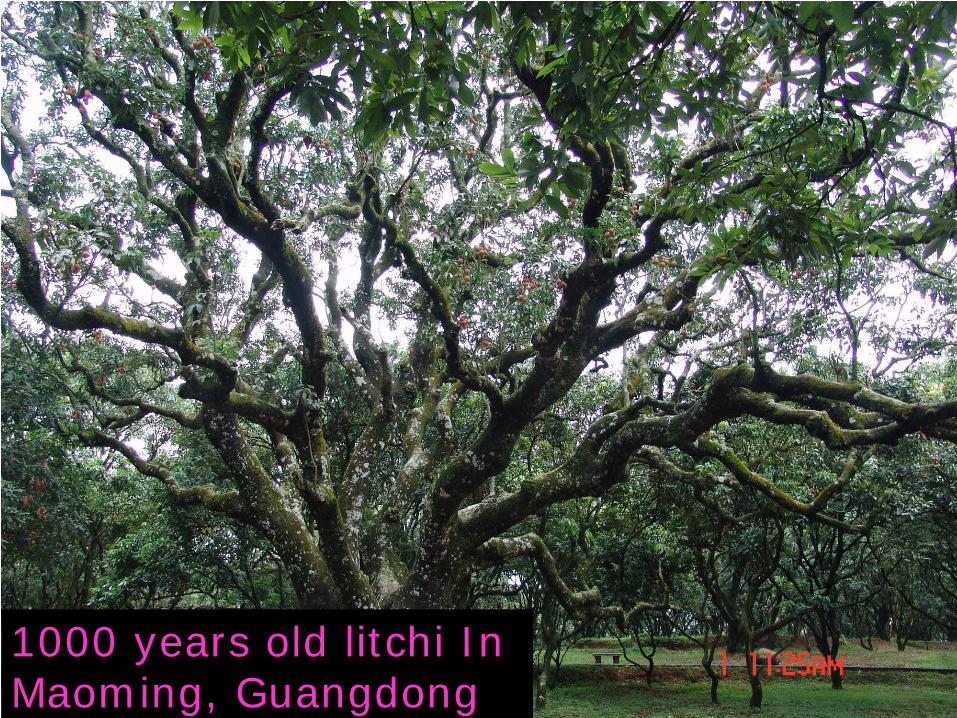
1000 years old litchi In Maoming, Guangdong
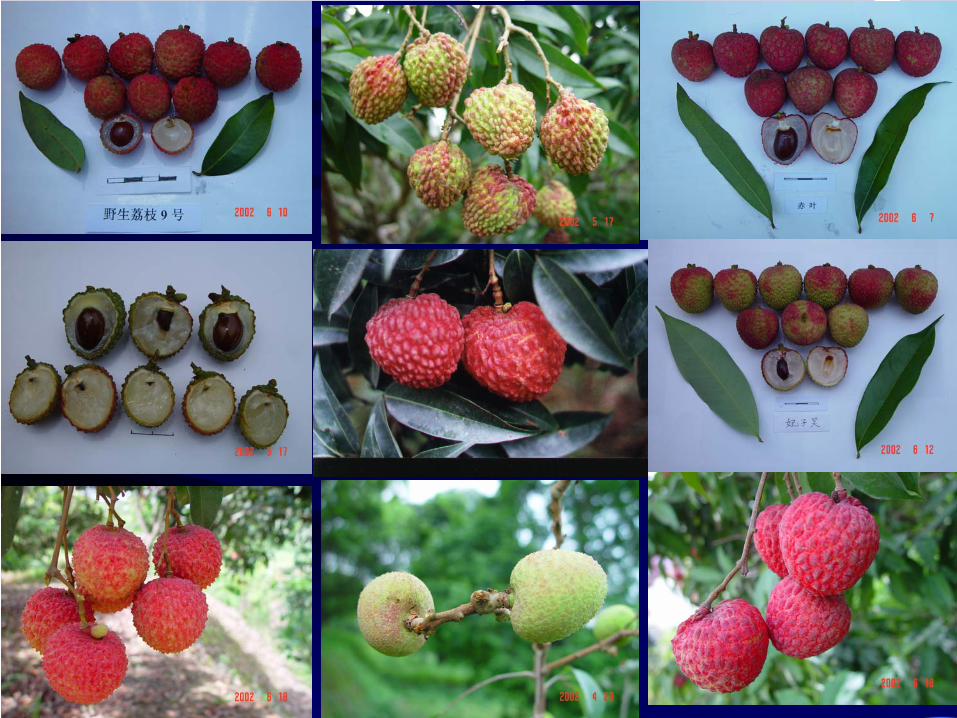
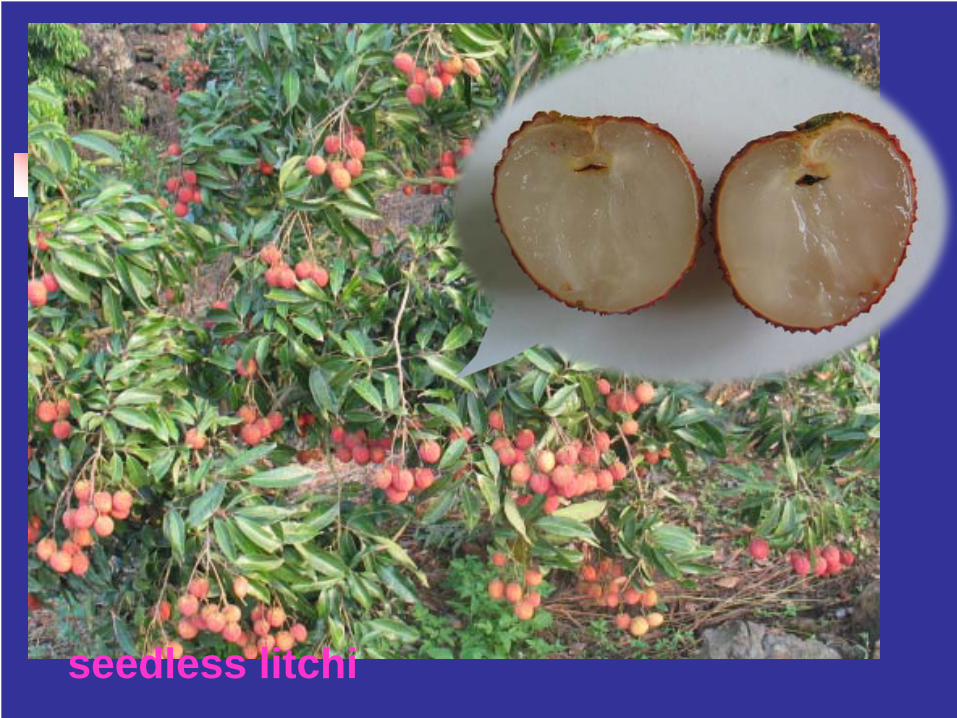
seedless litchi
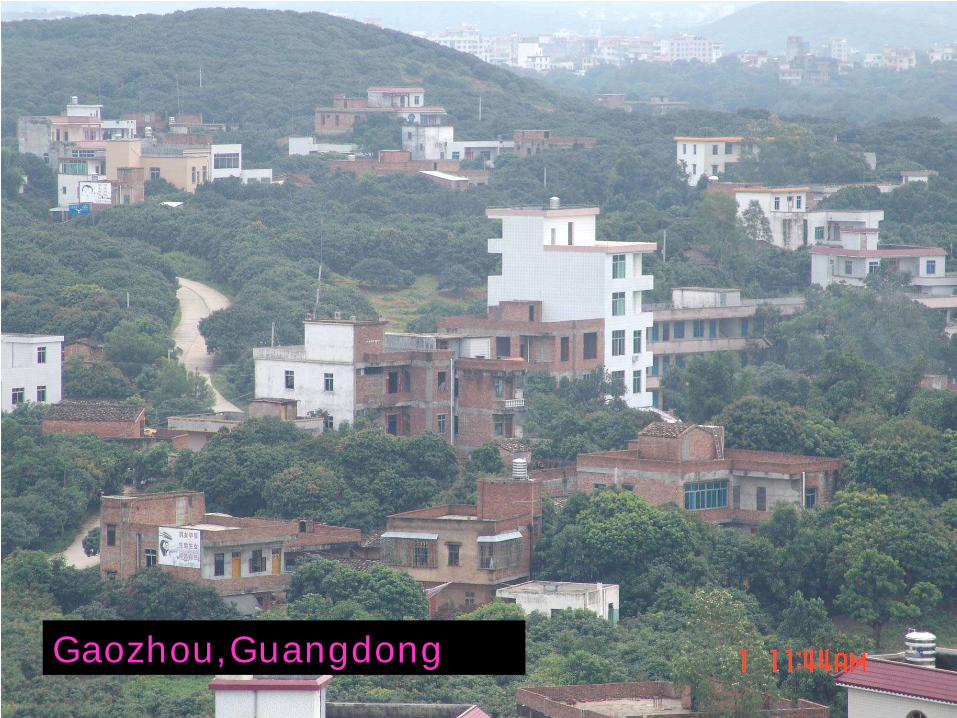
Gaozhou,Guangdong
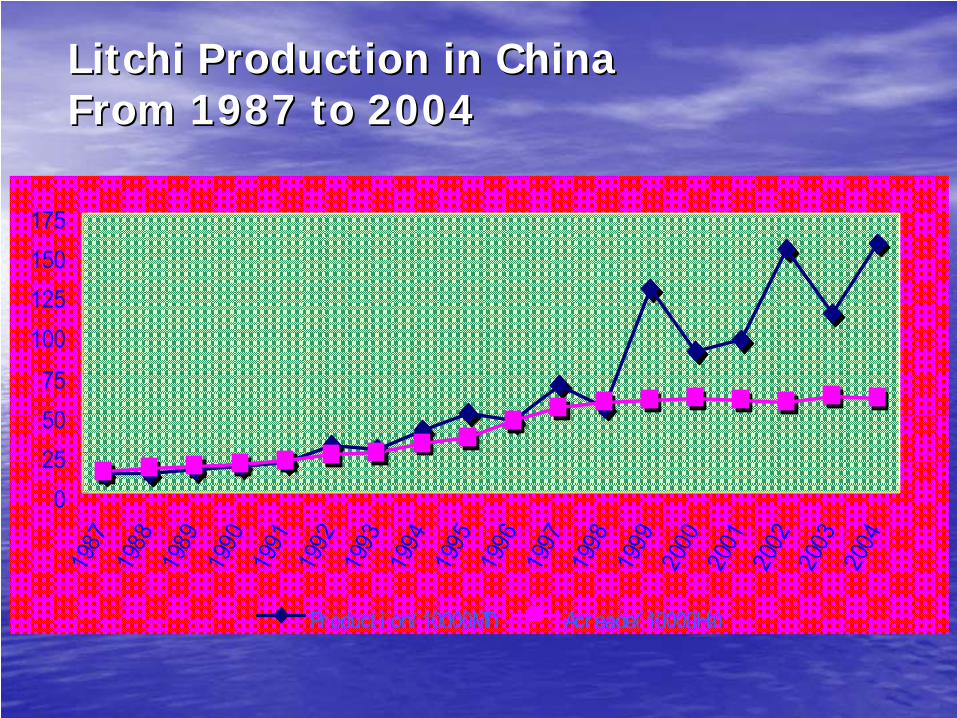
Litchi Production in China Litchi Production in China From 1987 to 2004 From 1987 to 2004
0255075
100125150175
1987
1988
1989
1990
1991
1992
1993
1994
1995
1996
1997
1998
1999
2000
2001
2002
2003
2004
Pr oduct i on( 10000MT) Acr eage( 10000Ha)
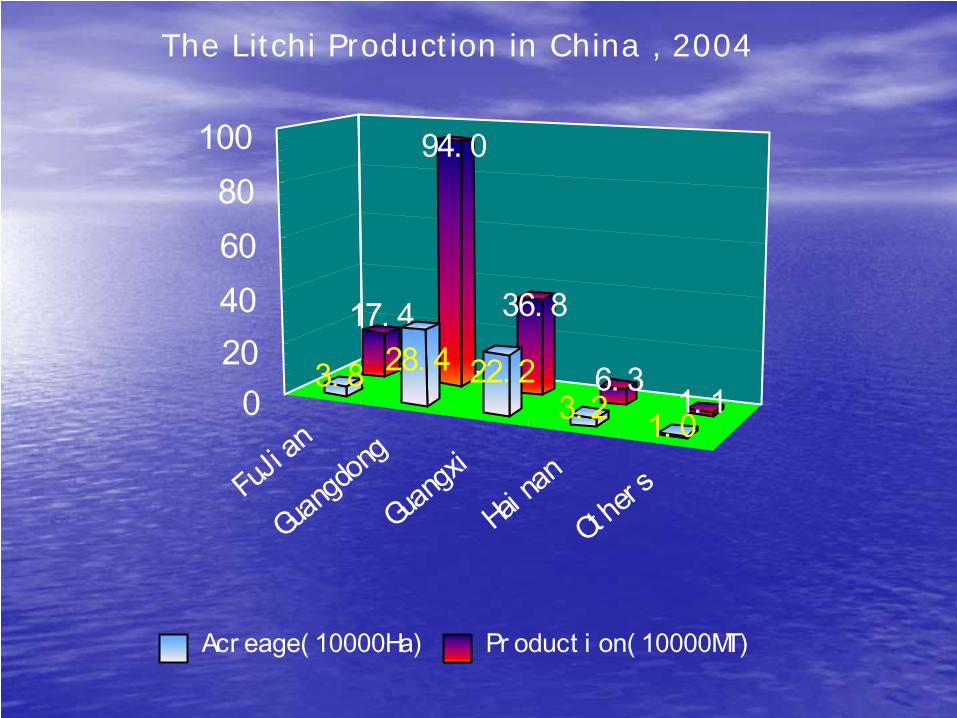
FuJi an
Guangd
ong
Guangx
i
Hainan
Ot her s
17. 4
94. 0
36. 8
6. 3 1. 13. 8 28. 4 22. 2
3. 2 1. 0020406080
100
Acr eage( 10000Ha) Pr oduct i on( 10000MT)
The Litchi Production in China,2004
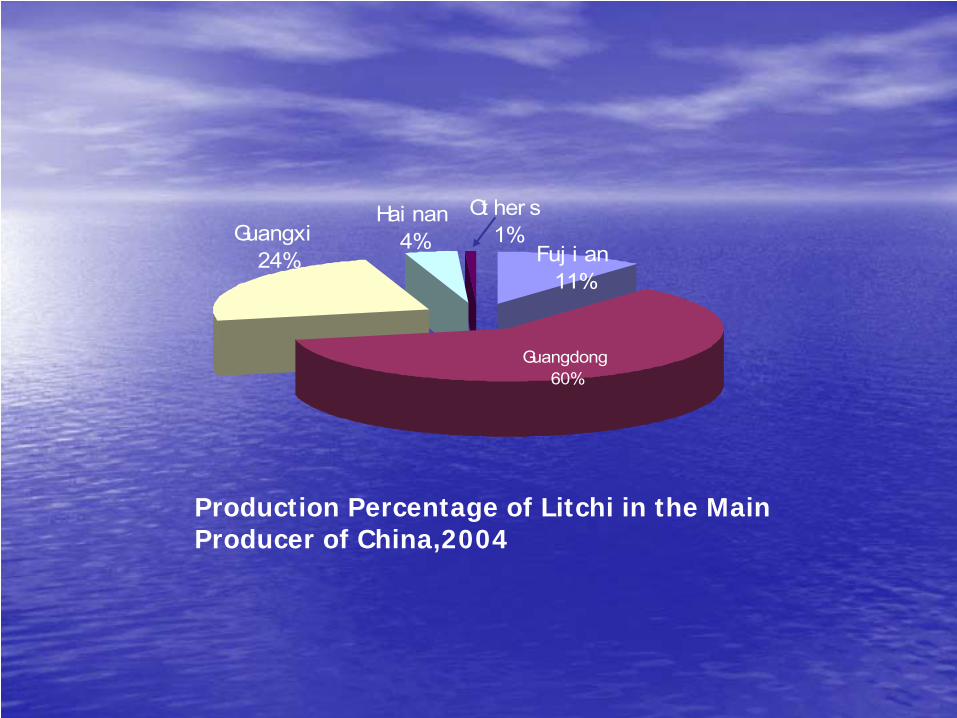
Hai nan4%
Ot her s1%Guangxi
24% Fuj i an11%
Guangdong60%
Production Percentage of Litchi in the Main Producer of China,2004
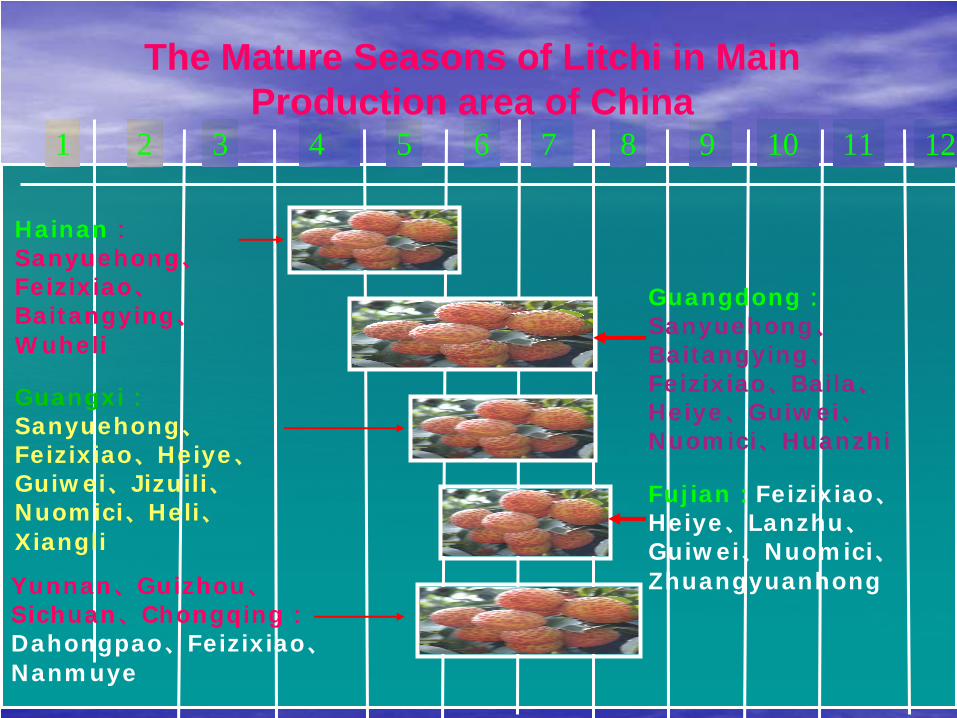
The Mature Seasons of Litchi in Main Production area of China
123 4 5 6 7 8 9 10 111 2
Hainan:
Sanyuehong、
Feizixiao、
Baitangying、
Wuheli
Guangdong:
Sanyuehong、
Baitangying、
Feizixiao、Baila、
Heiye、Guiwei、
Nuomici、Huanzhi
Guangxi:
Sanyuehong、
Feizixiao、Heiye、
Guiwei、Jizuili、
Nuomici、Heli、
Xiangli
Fujian:Feizixiao、
Heiye、Lanzhu、
Guiwei、Nuomici、
ZhuangyuanhongYunnan、Guizhou、
Sichuan、Chongqing:
Dahongpao、Feizixiao、
Nanmuye
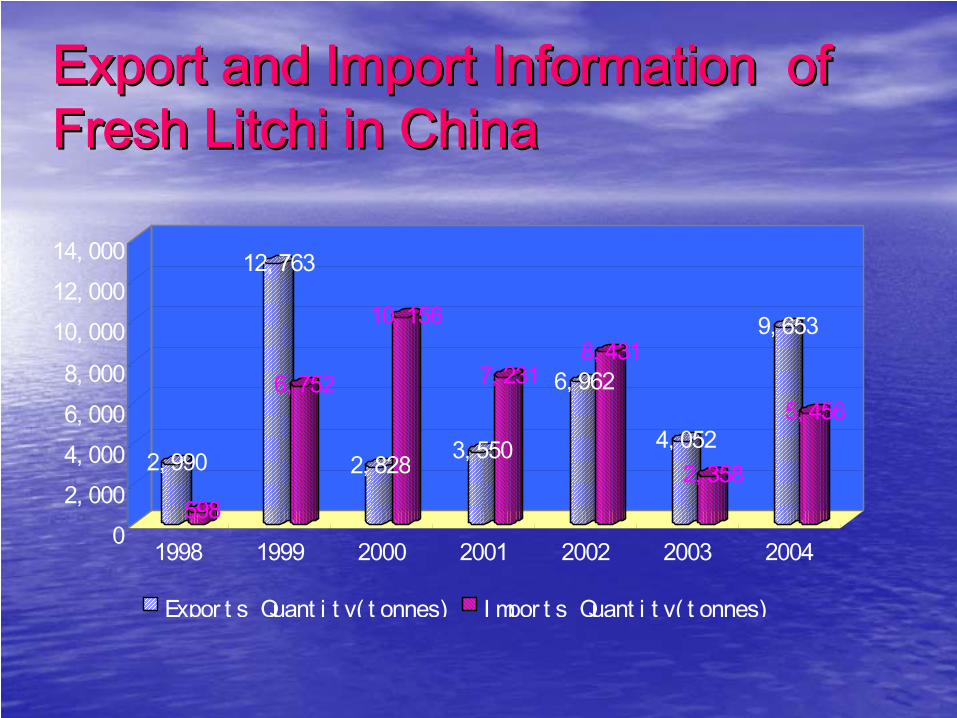
Export and Import Information of Export and Import Information of Fresh Litchi in ChinaFresh Litchi in China
2, 990
598
12, 763
6, 752
2, 828
10, 156
3, 550
7, 231 6, 9628, 431
4, 0522, 358
9, 653
5, 456
02, 0004, 0006, 0008, 000
10, 00012, 00014, 000
1998 1999 2000 2001 2002 2003 2004
Expor t s Quant i t y( t onnes) I mpor t s Quant i t y( t onnes)
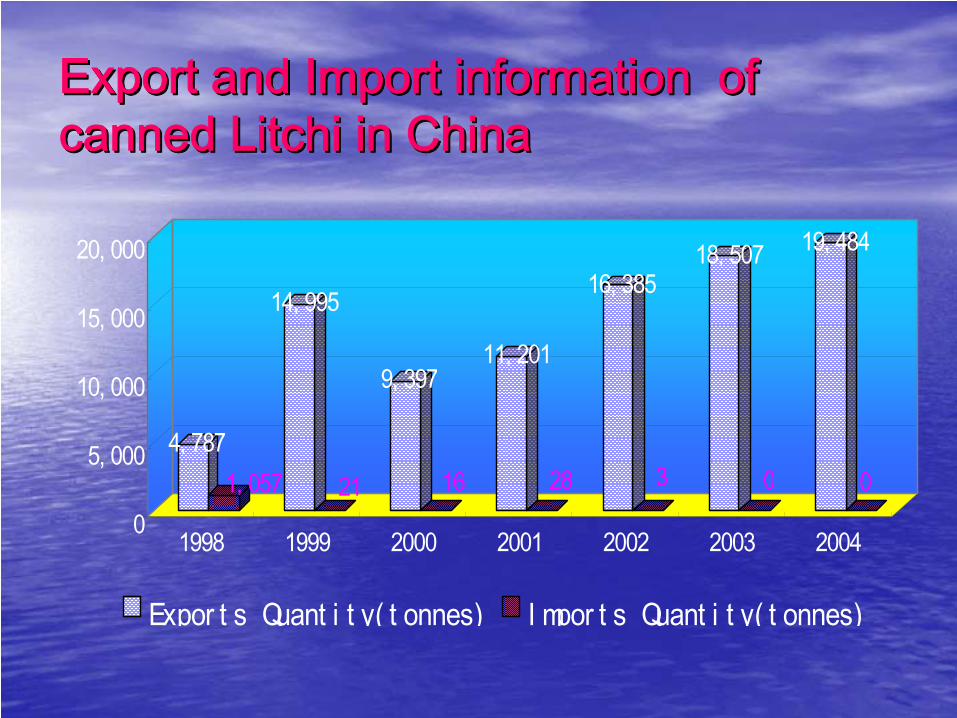
Export and Import information of Export and Import information of canned Litchi in Chinacanned Litchi in China
4, 7871, 057
14, 995
21
9, 397
16
11, 201
28
16, 385
3
18, 507
0
19, 484
00
5, 000
10, 000
15, 000
20, 000
1998 1999 2000 2001 2002 2003 2004
Expor t s Quant i t y( t onnes) I mpor t s Quant i t y( t onnes)
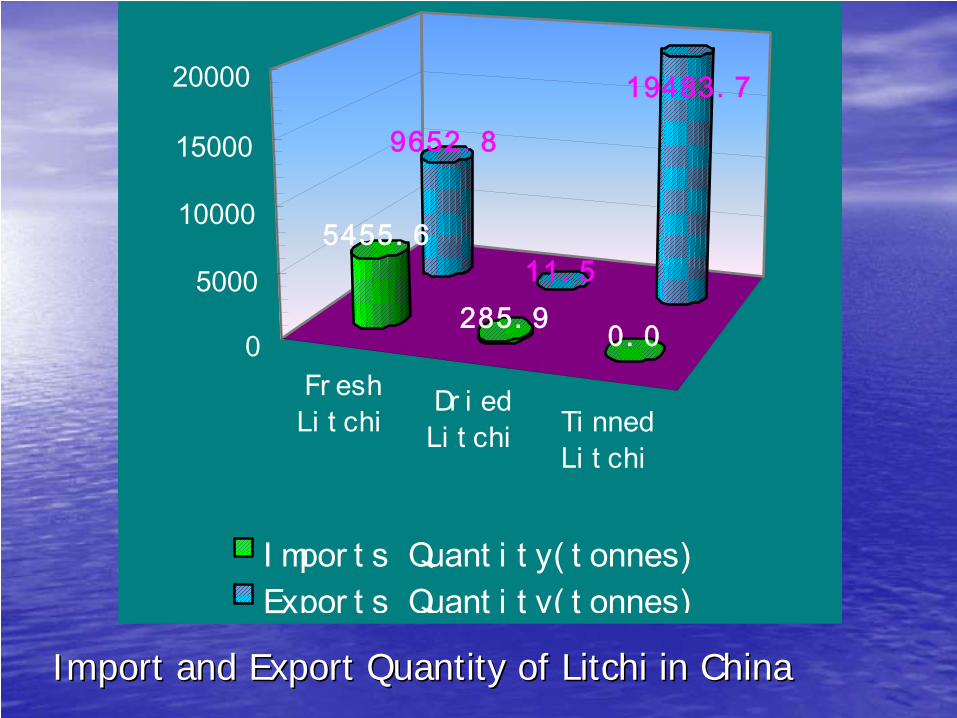
Import and Export Quantity of Litchi in ChinaImport and Export Quantity of Litchi in China
Fr eshLi t chi
Dr i edLi t chi Ti nned
Li t chi
9652. 8
11. 5
19483. 7
5455. 6
285. 9 0. 00
5000
10000
15000
20000
I mpor t s Quant i t y( t onnes)Expor t s Quant i t y( t onnes)
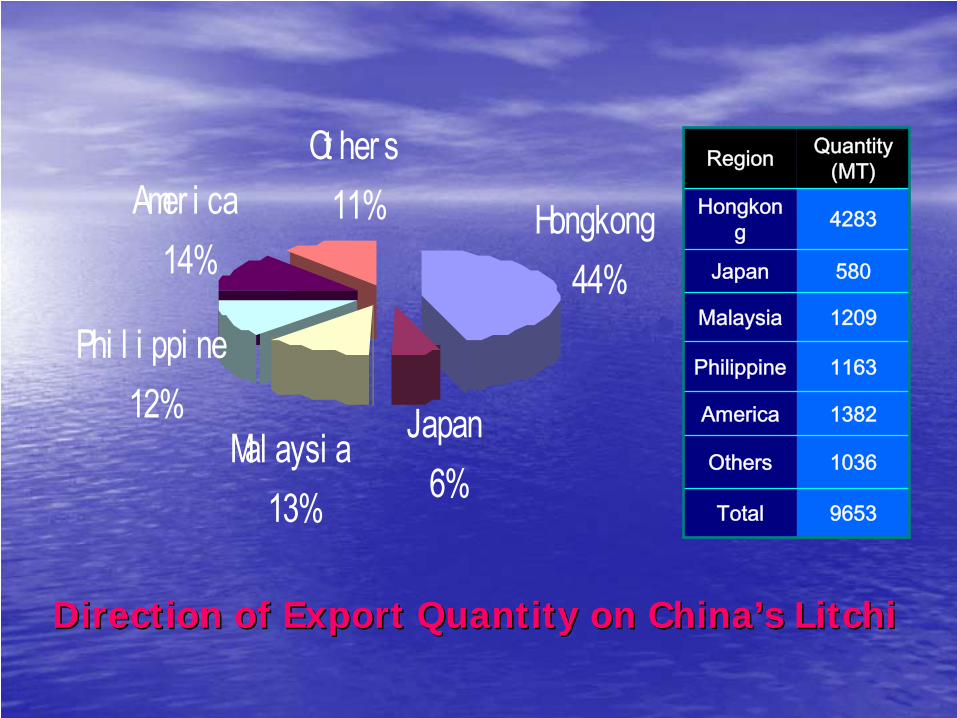
Hongkong44%
Japan6%
Mal aysi a13%
Phi l i ppi ne12%
Amer i ca14%
Ot her s11%
Direction of Export Quantity on ChinaDirection of Export Quantity on China’’s Litchis Litchi
Region Quantity(MT)
Hongkon
g 4283
Japan 580
Malaysia 1209
Philippine 1163
America 1382
Others 1036
Total 9653
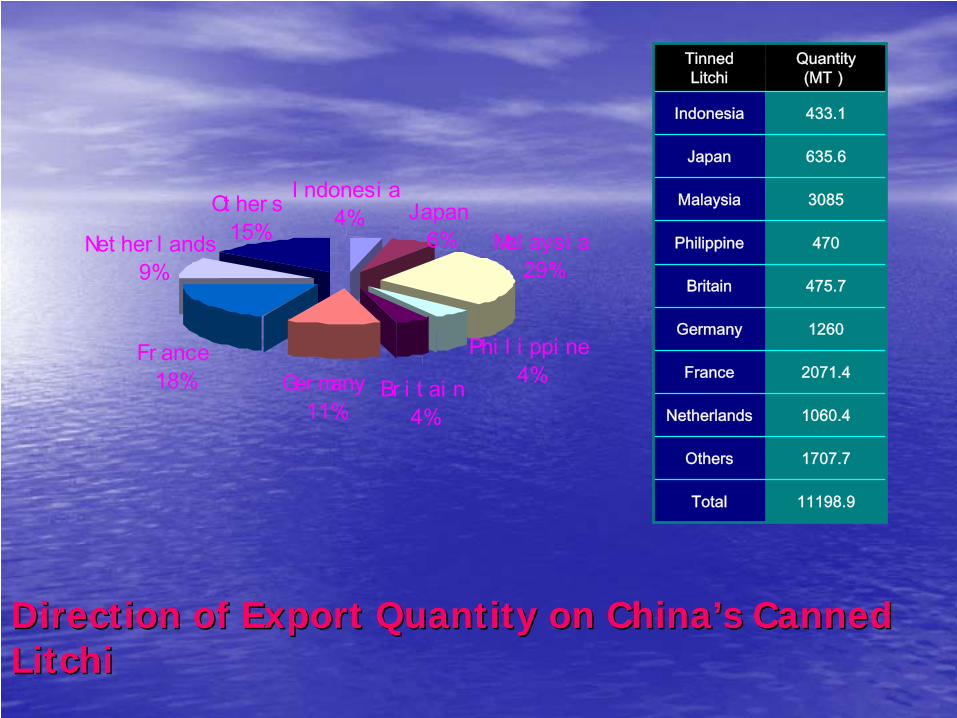
Phi l i ppi ne4%Br i t ai n
4%
Ot her s15%
I ndonesi a4%
Mal aysi a29%
Japan6%
Ger many11%
Fr ance18%
Net her l ands9%
Direction of Export Quantity on ChinaDirection of Export Quantity on China’’s Canned s Canned LitchiLitchi
TinnedLitchi
Quantity(MT)
Indonesia 433.1
Japan 635.6
Malaysia 3085
Philippine 470
Britain 475.7
Germany 1260
France 2071.4
Netherlands 1060.4
Others 1707.7
Total 11198.9
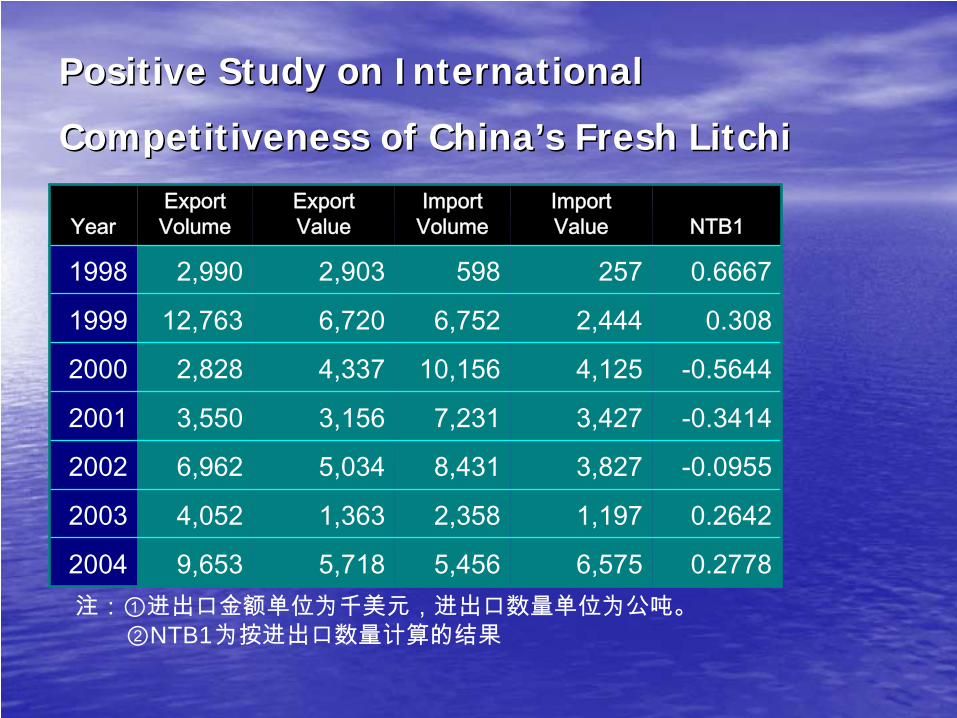
Positive Study on International Positive Study on International
Competitiveness of ChinaCompetitiveness of China’’s Fresh Litchis Fresh Litchi
YearExportVolume
Export Value
ImportVolume
ImportValue NTB1
1998 2,990 2,903 598 257 0.6667
1999 12,763 6,720 6,752 2,444 0.308
2000 2,828 4,337 10,156 4,125 -0.5644
2001 3,550 3,156 7,231 3,427 -0.3414
2002 6,962 5,034 8,431 3,827 -0.0955
2003 4,052 1,363 2,358 1,197 0.2642
2004 9,653 5,718 5,456 6,575 0.2778注:①进出口金额单位为千美元,进出口数量单位为公吨。
②NTB1为按进出口数量计算的结果
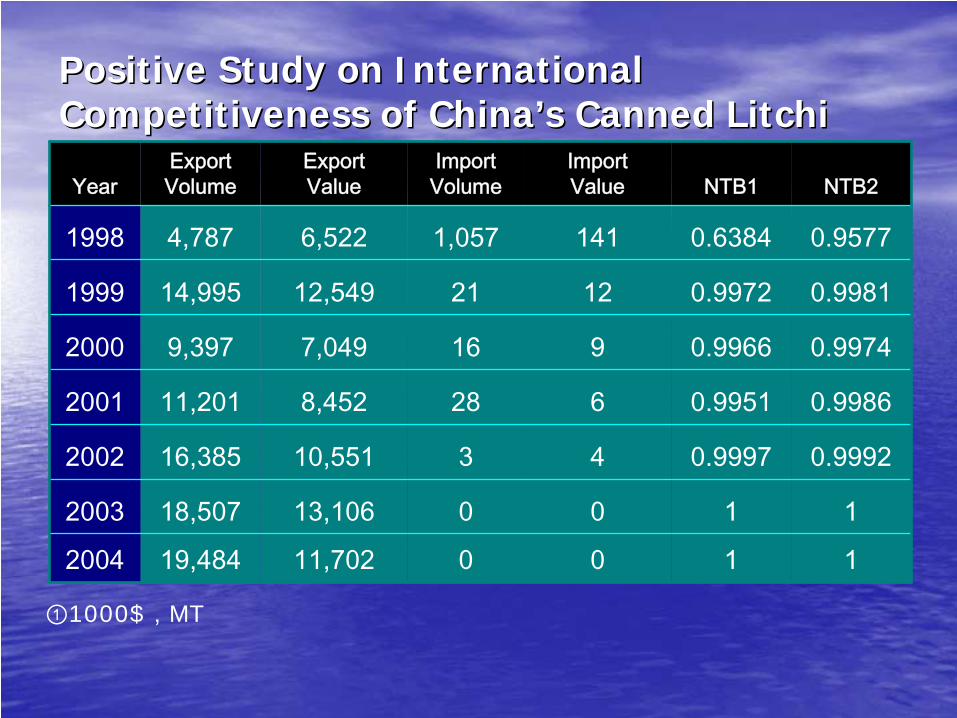
Positive Study on International Positive Study on International Competitiveness of ChinaCompetitiveness of China’’s Canned Litchis Canned Litchi
YearExportVolume
Export Value
ImportVolume
ImportValue NTB1 NTB2
1998 4,787 6,522 1,057 141 0.6384 0.9577
1999 14,995 12,549 21 12 0.9972 0.9981
2000 9,397 7,049 16 9 0.9966 0.9974
2001 11,201 8,452 28 6 0.9951 0.9986
2002 16,385 10,551 3 4 0.9997 0.9992
2003 18,507 13,106 0 0 1 1
2004 19,484 11,702 0 0 1 1
①1000$,MT
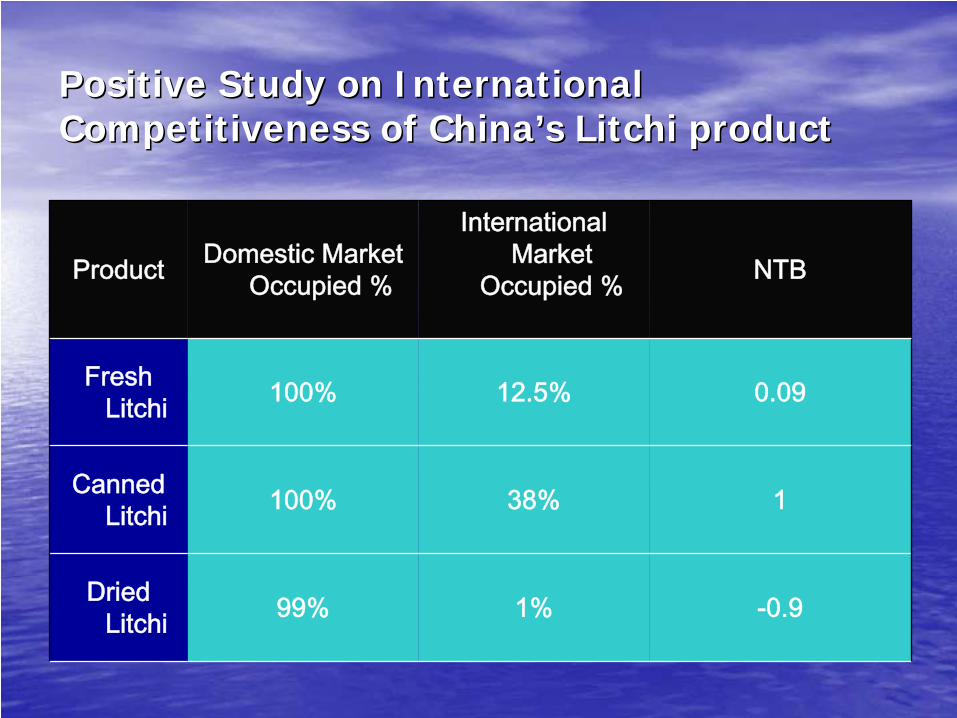
Positive Study on International Positive Study on International Competitiveness of ChinaCompetitiveness of China’’s Litchi products Litchi product
Product Domestic Market Occupied %
International Market
Occupied % NTB
Fresh Litchi 100% 12.5% 0.09
Canned Litchi 100% 38% 1
Dried Litchi 99% 1% -0.9
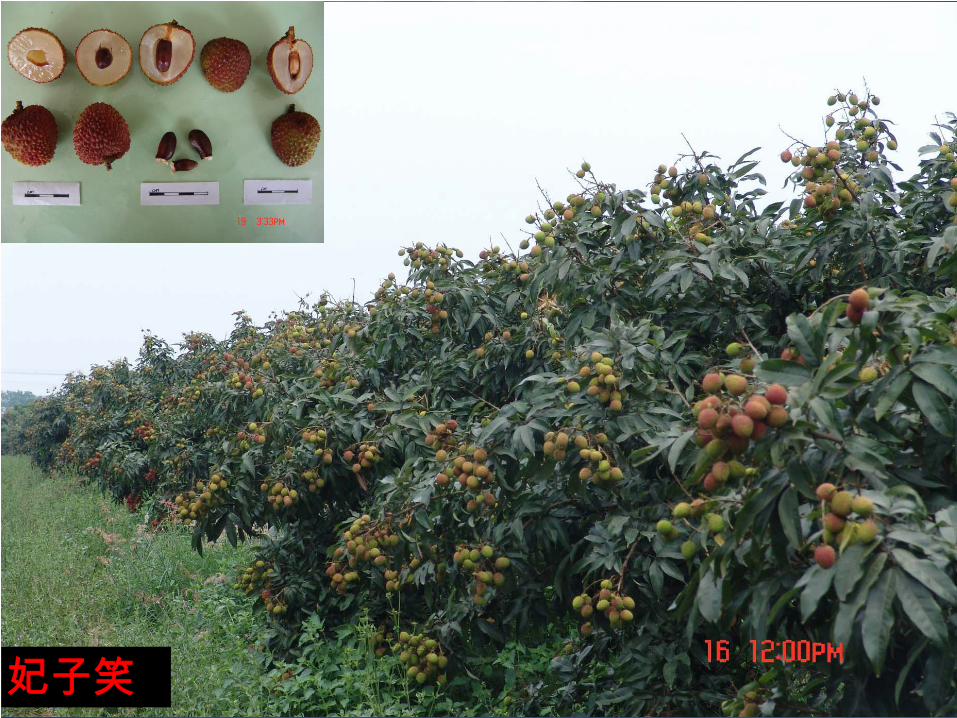
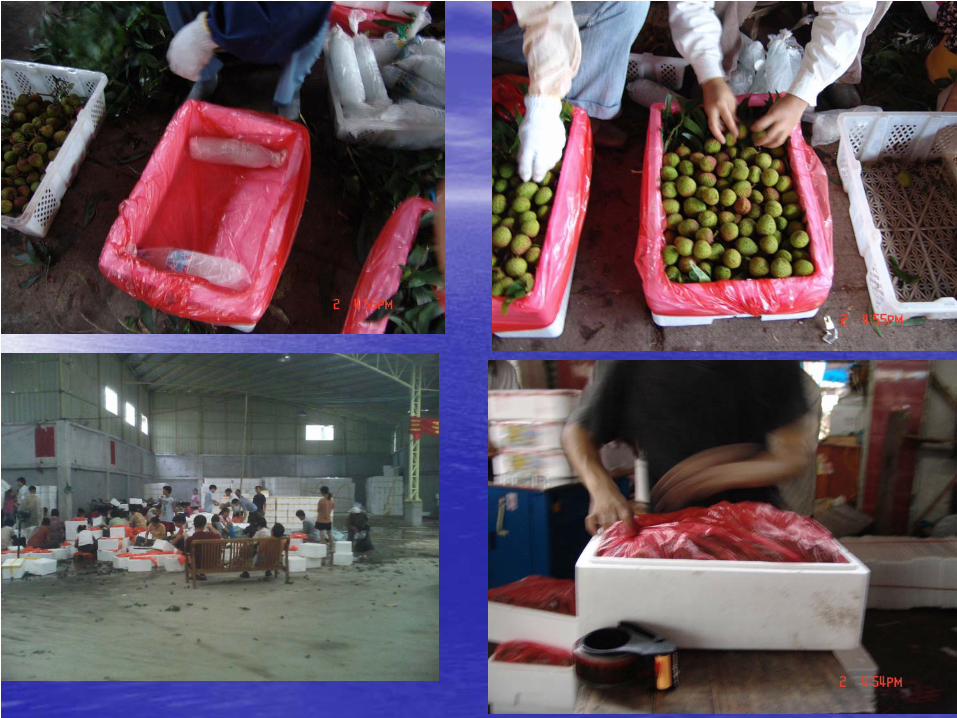
妃子笑
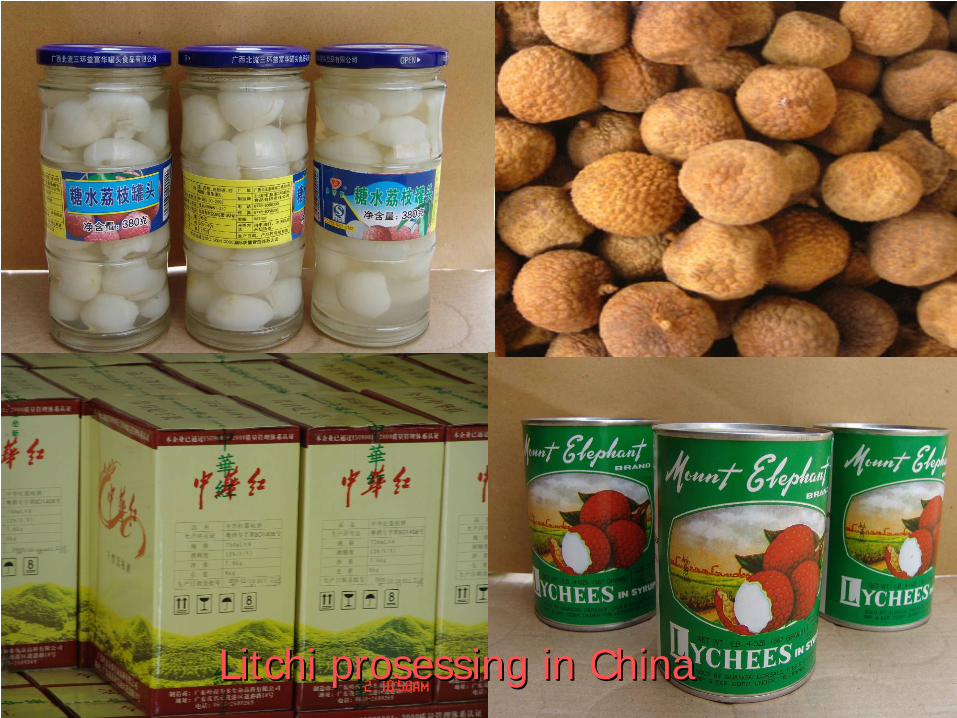
Litchi Litchi prosessingprosessing in Chinain China

BananaBanana
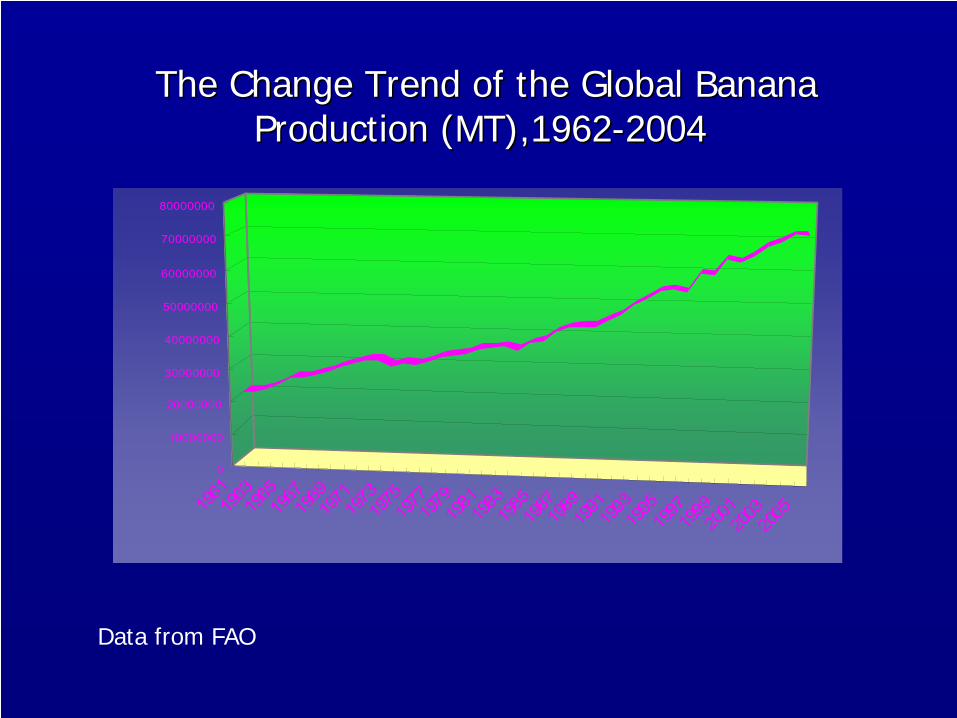
The Change Trend of the Global Banana The Change Trend of the Global Banana Production (MT),1962Production (MT),1962--20042004
Data from FAO
1961
1963
1965
1967
1969
1971
1973
1975
1977
1979
1981
1983
1985
1987
1989
1991
1993
1995
1997
1999
2001
2003
2005
0
10000000
20000000
30000000
40000000
50000000
60000000
70000000
80000000
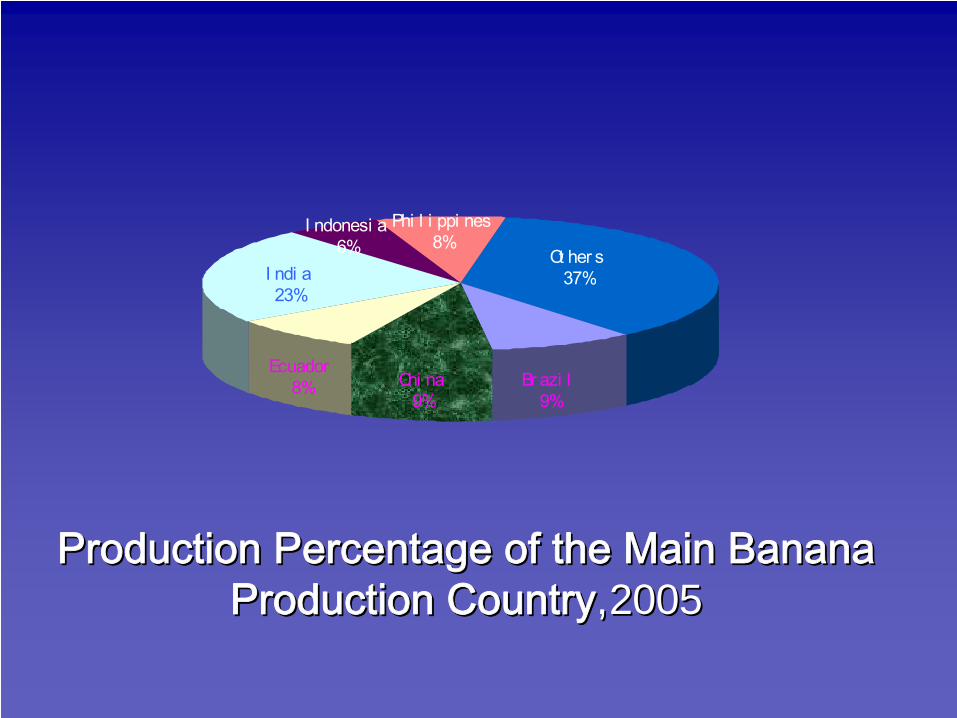
I ndonesi a6%
I ndi a23%
Ecuador8%
Phi l i ppi nes8%
Ot her s37%
Br azi l9%
Chi na9%
Production Percentage of the Main Banana Production Percentage of the Main Banana Production CountryProduction Country,2005,2005
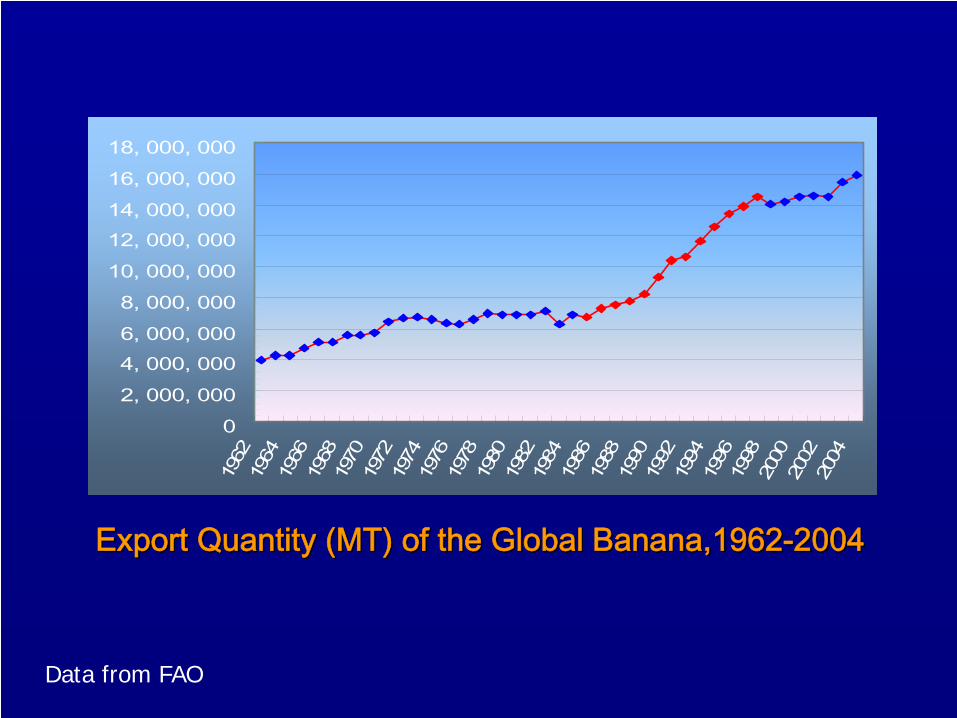
Export Quantity (MT) of the Global Banana,1962Export Quantity (MT) of the Global Banana,1962--20042004
02, 000, 0004, 000, 0006, 000, 0008, 000, 000
10, 000, 00012, 000, 00014, 000, 00016, 000, 00018, 000, 000
1962
1964
1966
1968
1970
1972
1974
1976
1978
1980
1982
1984
1986
1988
1990
1992
1994
1996
1998
2000
2002
2004
Data from FAO
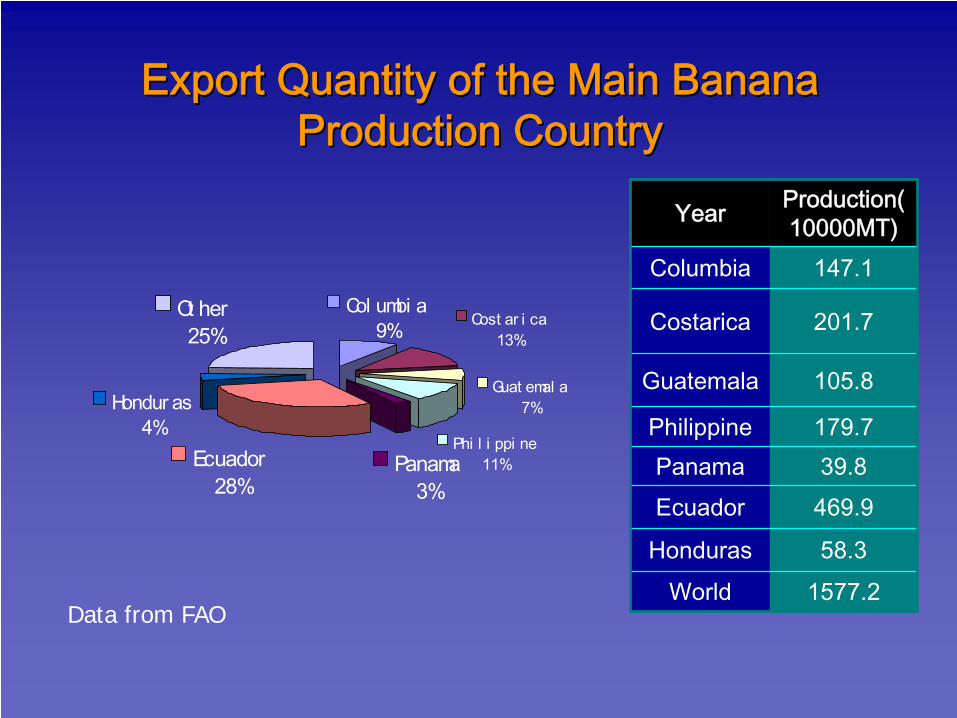
Export Quantity of the Main Banana Export Quantity of the Main Banana Production CountryProduction Country
Ecuador28%
Ot her25%
Hondur as4%
Phi l i ppi ne11%
Col umbi a9% Cost ar i ca
13%
Guat emal a7%
Panama3%
Year Production(
10000MT)
Columbia 147.1
Costarica 201.7
Guatemala 105.8
Philippine 179.7 Panama 39.8 Ecuador 469.9
Honduras 58.3 World 1577.2
Data from FAO
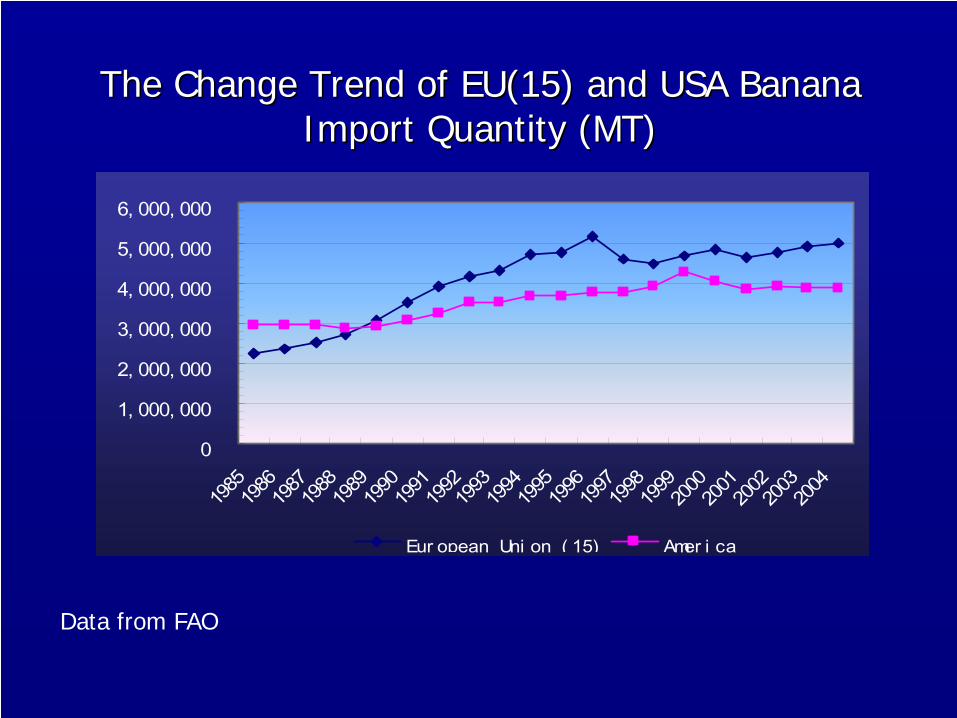
The Change Trend of EU(15) and USA Banana The Change Trend of EU(15) and USA Banana Import Quantity (MT)Import Quantity (MT)
0
1, 000, 000
2, 000, 000
3, 000, 000
4, 000, 000
5, 000, 000
6, 000, 000
1985
1986
1987
1988
1989
1990
1991
1992
1993
1994
1995
1996
1997
1998
1999
2000
2001
2002
2003
2004
Eur opean Uni on ( 15) Amer i ca
Data from FAO
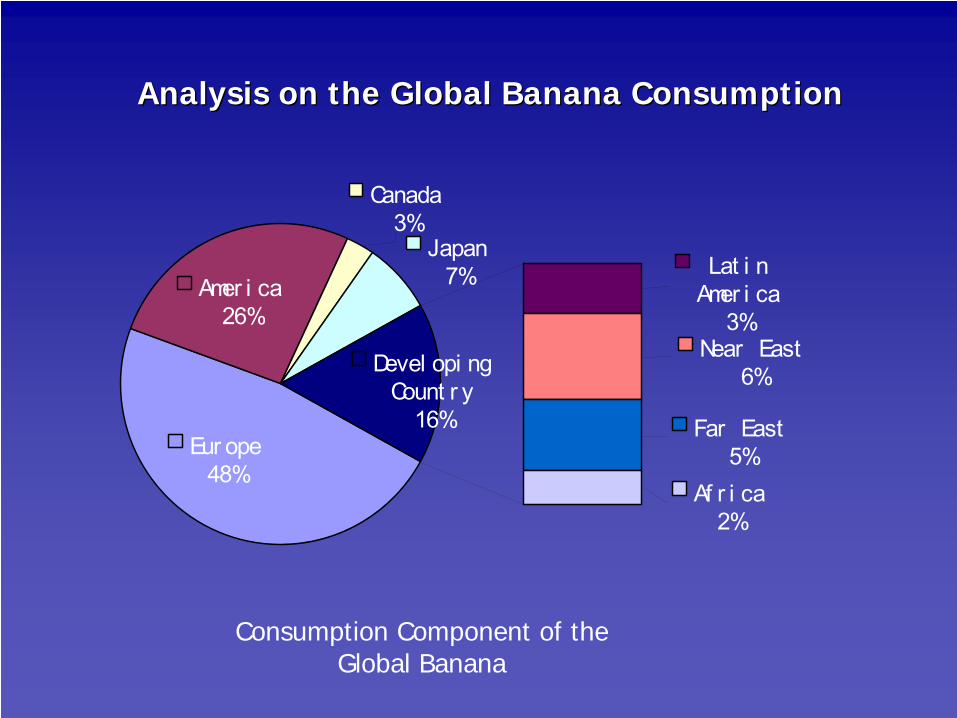
Analysis on the Global Banana ConsumptionAnalysis on the Global Banana Consumption
Consumption Component of the Global Banana
Far East5%
Af r i ca2%
Devel opi ngCount r y
16%
Near East6%
Lat i nAmer i ca
3%
Eur ope48%
Amer i ca26%
Japan7%
Canada3%
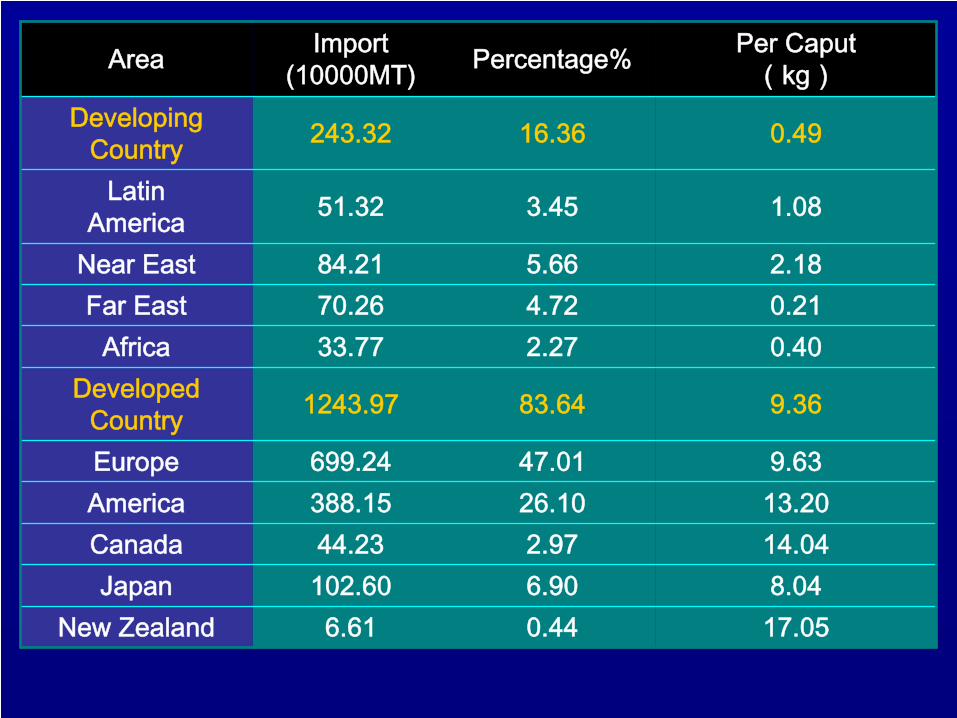
Area Import(10000MT) Percentage% Per Caput
(kg)Developing
Country 243.32 16.36 0.49
LatinAmerica 51.32 3.45 1.08
Near East 84.21 5.66 2.18 Far East 70.26 4.72 0.21
Africa 33.77 2.27 0.40 Developed
Country 1243.97 83.64 9.36
Europe 699.24 47.01 9.63 America 388.15 26.10 13.20 Canada 44.23 2.97 14.04 Japan 102.60 6.90 8.04
New Zealand 6.61 0.44 17.05

Banana Industry in China
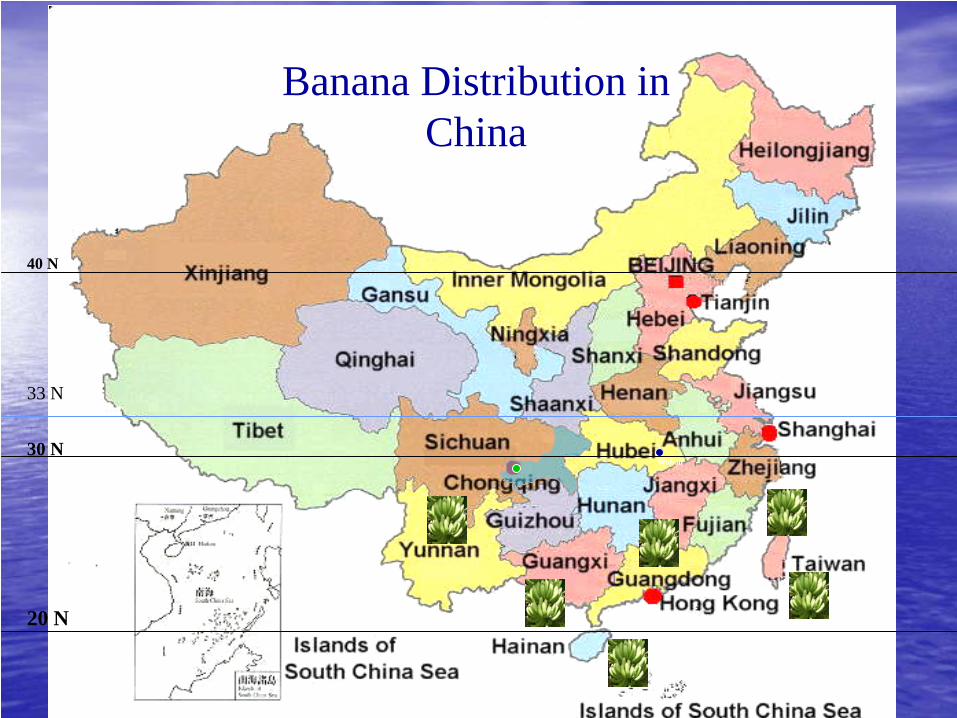
Banana Distribution in China
Wuhan
20 N
30 N
40 N
33 N
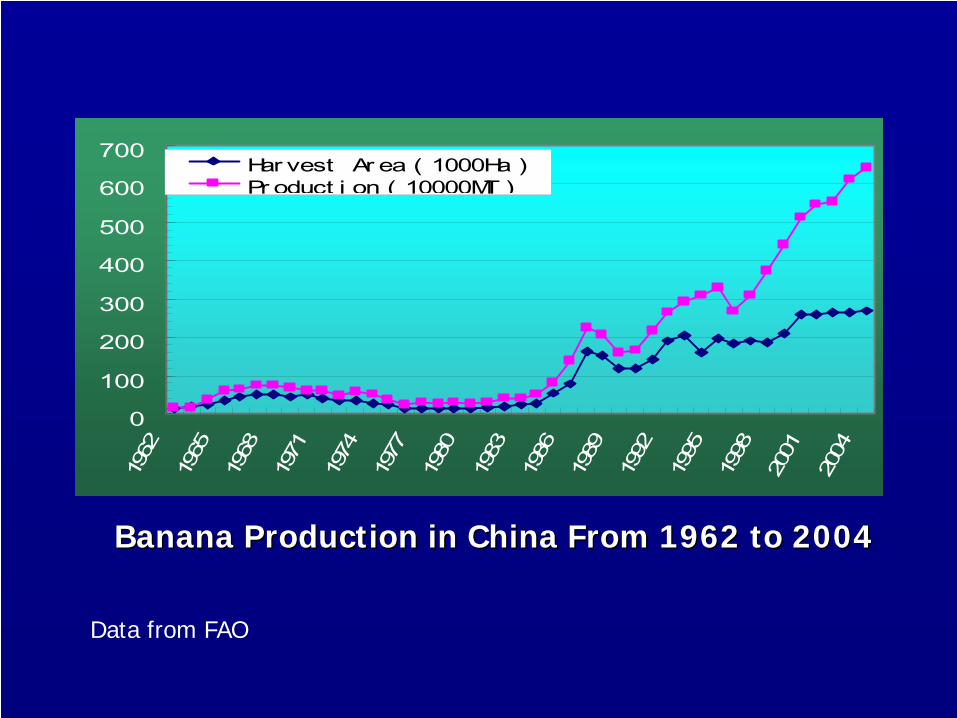
Banana Production in China From 1962 to 2004Banana Production in China From 1962 to 2004
0
100
200
300
400
500
600
70019
62
1965
1968
1971
1974
1977
1980
1983
1986
1989
1992
1995
1998
2001
2004
Har vest Ar ea(1000Ha)Pr oduct i on(10000MT)
Data from FAO
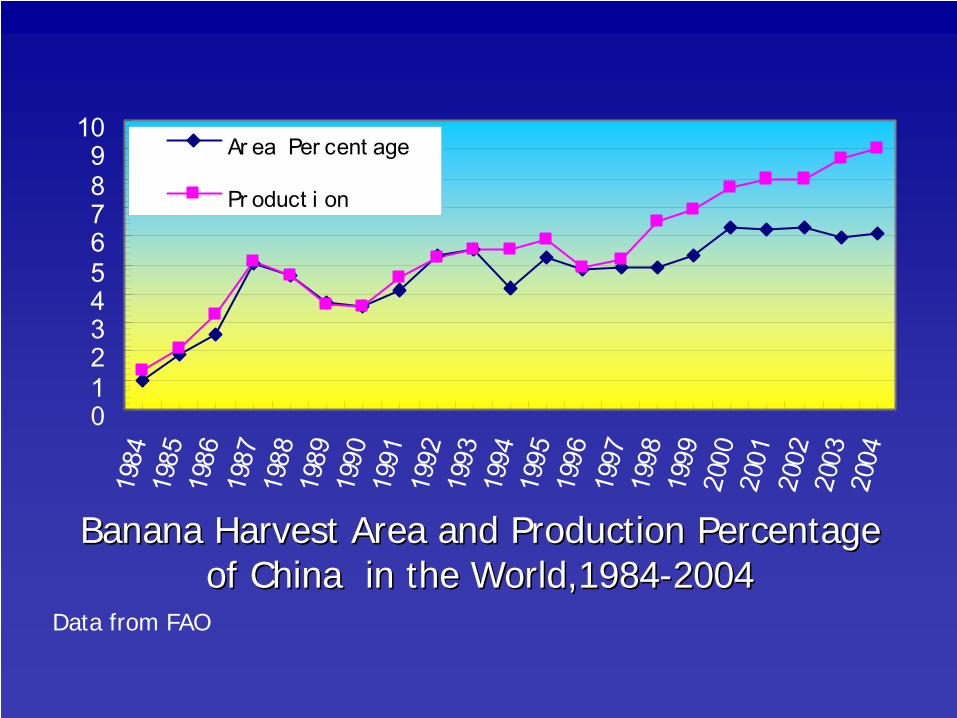
Banana Harvest Area and Production Percentage Banana Harvest Area and Production Percentage of China in the World,1984of China in the World,1984--20042004
Data from FAO
0123456789
1019
8419
8519
8619
8719
8819
8919
9019
9119
9219
9319
9419
9519
9619
9719
9819
9920
0020
0120
0220
0320
04
Ar ea Per cent age
Pr oduct i on
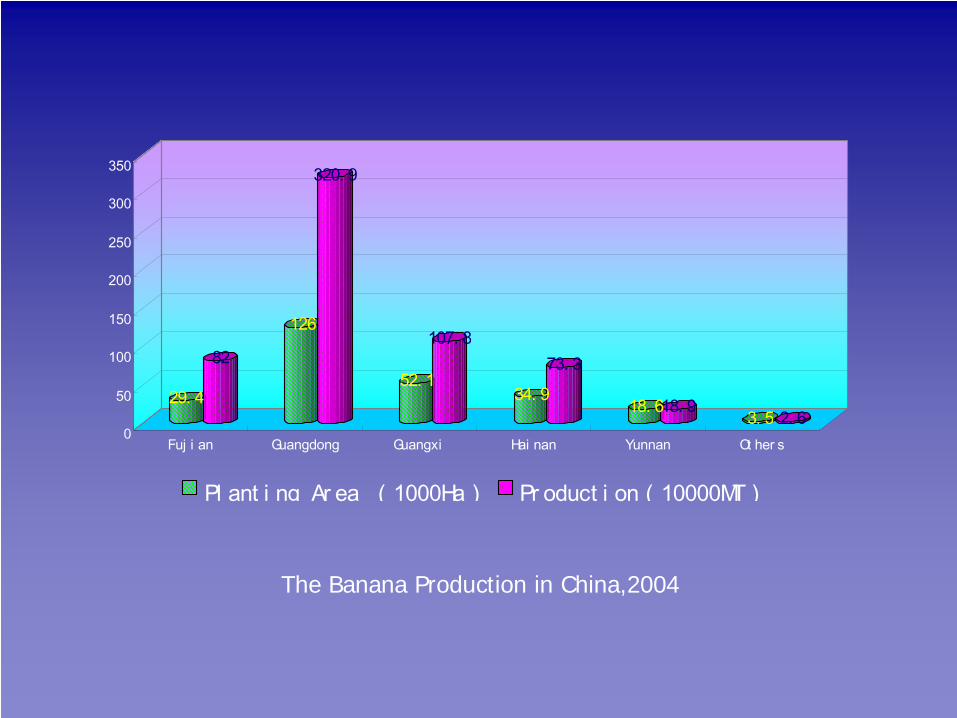
29. 4
82
126
320. 9
52. 1
107. 8
34. 973. 3
18. 618. 9 3. 5 2. 60
50
100
150
200
250
300
350
Fuj i an Guangdong Guangxi Hai nan Yunnan Ot her s
Pl ant i ng Ar ea (1000Ha) Pr oduct i on(10000MT)
The Banana Production in China,2004
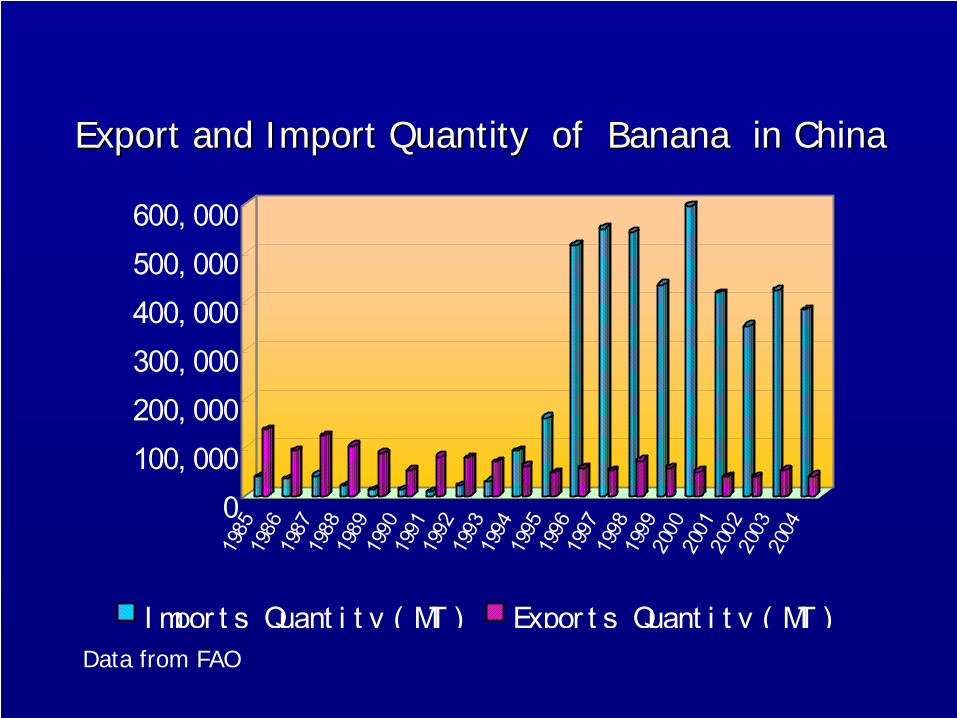
Export and Import Quantity of Banana in ChinaExport and Import Quantity of Banana in China
0100, 000200, 000300, 000400, 000500, 000600, 000
1985
1986
1987
1988
1989
1990
1991
1992
1993
1994
1995
1996
1997
1998
1999
2000
2001
2002
2003
2004
I mpor t s Quant i t y(MT) Expor t s Quant i t y(MT)Data from FAO
I mpor t Expor t
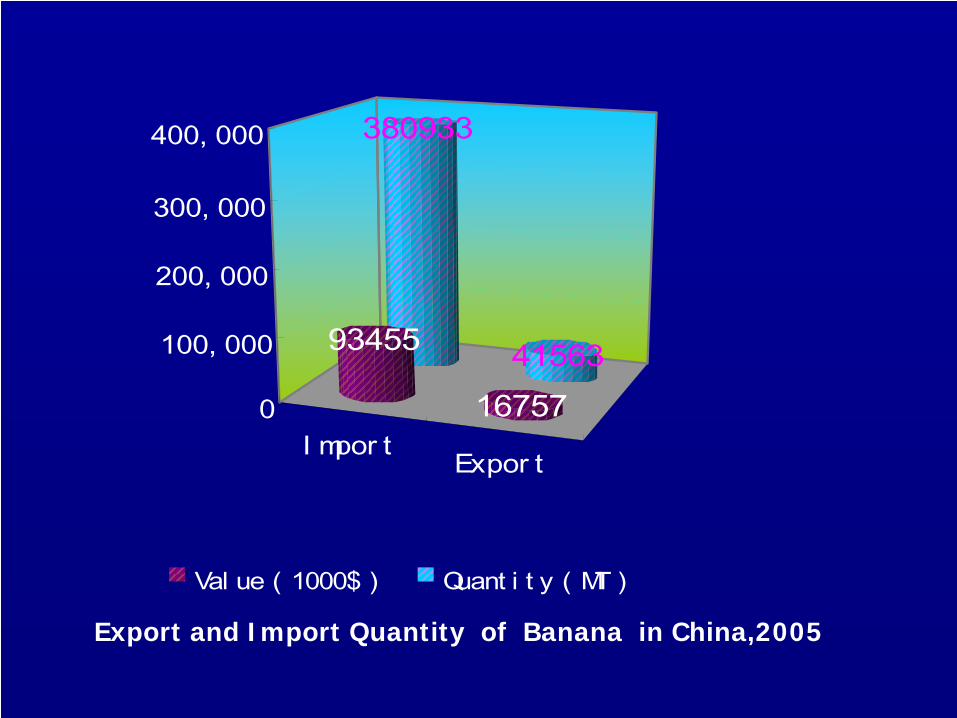
380933
4156393455
167570
100, 000
200, 000
300, 000
400, 000
Val ue(1000$) Quant i t y(MT)
Export and Import Quantity of Banana in China,2005
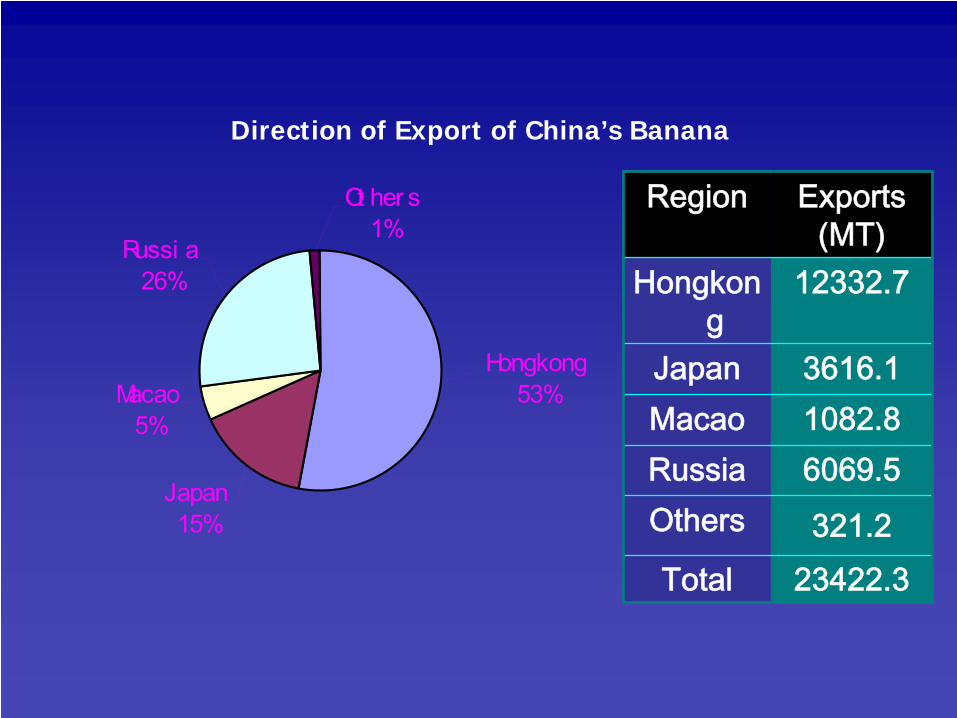
Direction of Export of China’s Banana
Hongkong53%
Japan15%
Macao5%
Russi a26%
Ot her s1%
Region Exports(MT)
Hongkon g
12332.7
Japan 3616.1 Macao 1082.8 Russia 6069.5 Others 321.2 Total 23422.3
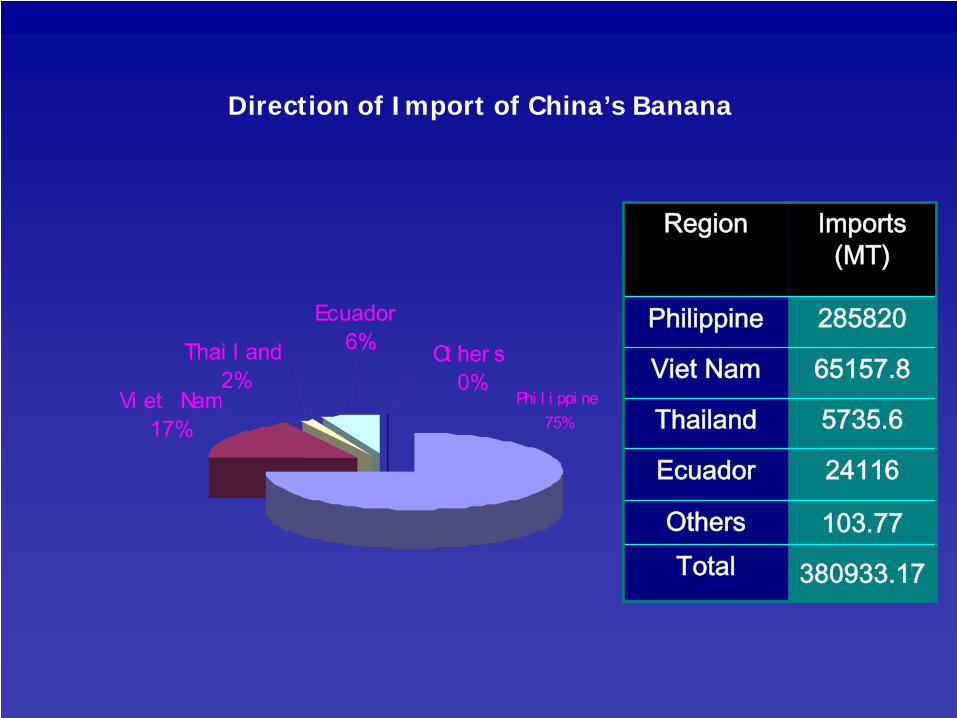
Direction of Import of China’s Banana
Vi et Nam17%
Thai l and2%
Ot her s0%
Ecuador6%
Phi l i ppi ne75%
Region Imports(MT)
Philippine 285820
Viet Nam 65157.8
Thailand 5735.6
Ecuador 24116
Others 103.77Total 380933.17
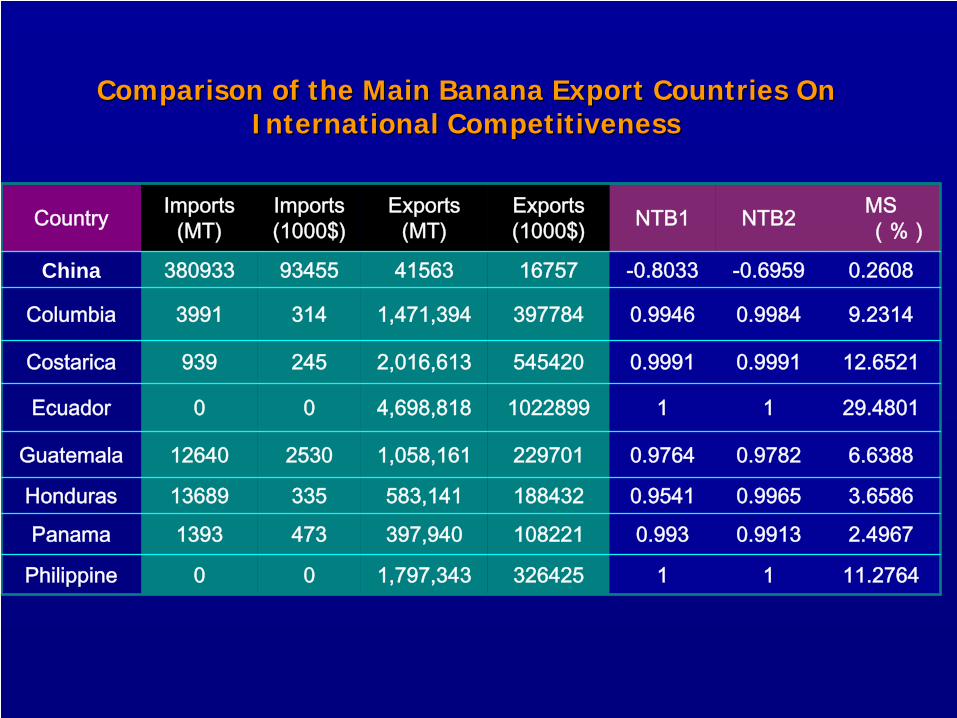
Comparison of the Main Banana Export Countries On Comparison of the Main Banana Export Countries On International CompetitivenessInternational Competitiveness
Country Imports(MT)
Imports(1000$)
Exports(MT)
Exports(1000$) NTB1 NTB2 MS
(%)
China 380933 93455 41563 16757 -0.8033 -0.6959 0.2608
Columbia 3991 314 1,471,394 397784 0.9946 0.9984 9.2314
Costarica 939 245 2,016,613 545420 0.9991 0.9991 12.6521
Ecuador 0 0 4,698,818 1022899 1 1 29.4801
Guatemala 12640 2530 1,058,161 229701 0.9764 0.9782 6.6388
Honduras 13689 335 583,141 188432 0.9541 0.9965 3.6586
Panama 1393 473 397,940 108221 0.993 0.9913 2.4967
Philippine 0 0 1,797,343 326425 1 1 11.2764
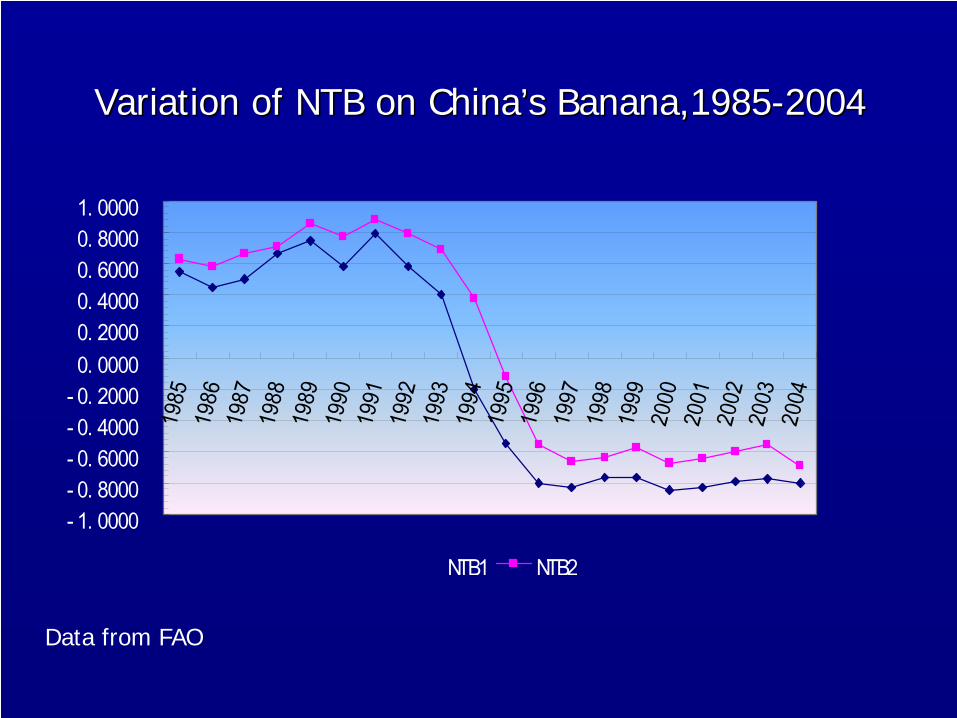
Variation of NTB on ChinaVariation of NTB on China’’s Banana,1985s Banana,1985--20042004
- 1. 0000- 0. 8000- 0. 6000- 0. 4000- 0. 20000. 00000. 20000. 40000. 60000. 80001. 0000
1985
1986
1987
1988
1989
1990
1991
1992
1993
1994
1995
1996
1997
1998
1999
2000
2001
2002
2003
2004
NTB1 NTB2
Data from FAO
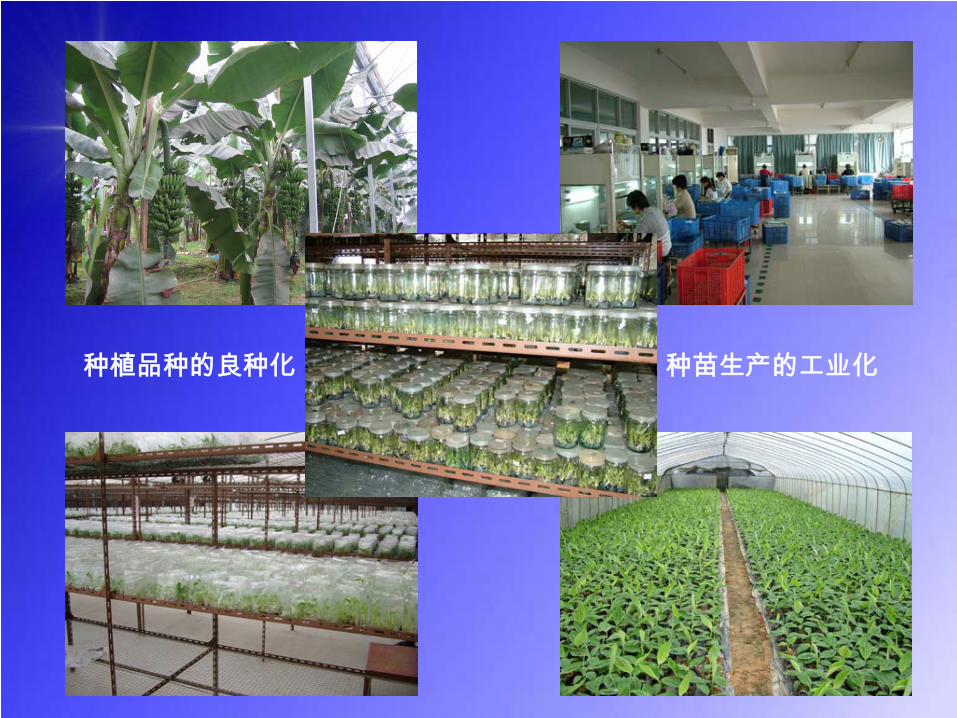
种植品种的良种化 种苗生产的工业化
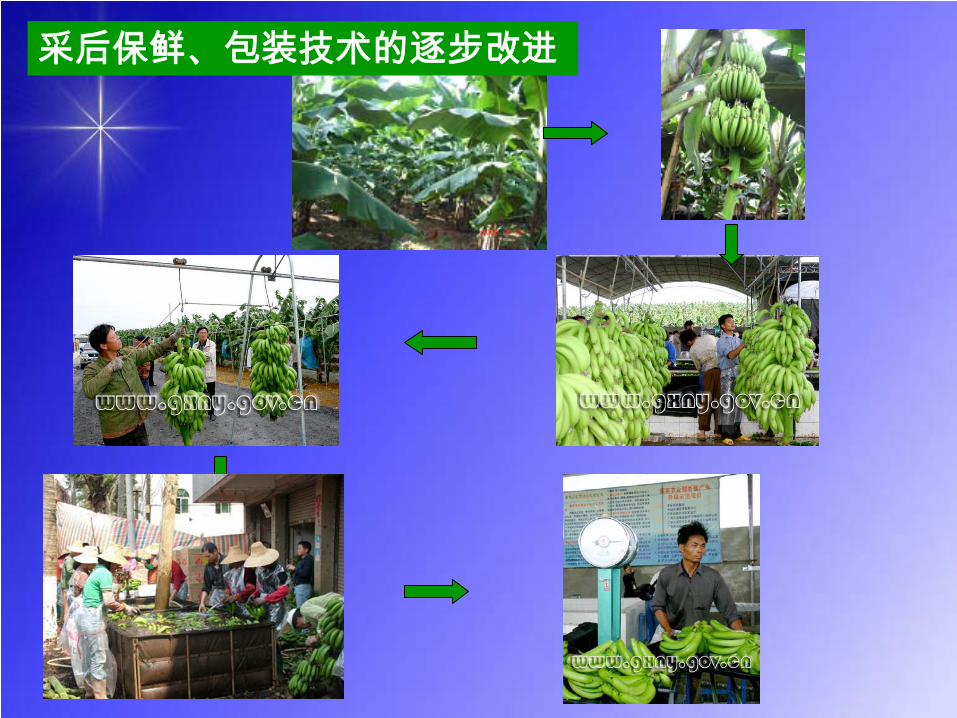
采后保鲜、包装技术的逐步改进
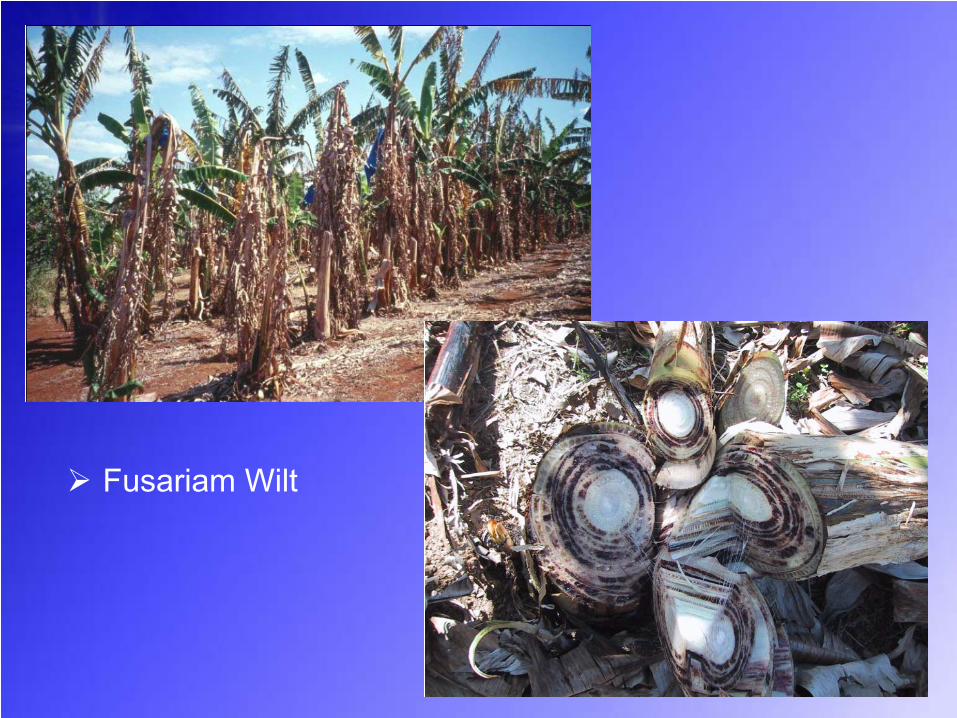
Fusariam Wilt

THANK YOU FOR YOUR KIND ATTENTION!