Embed Size (px)
Citation preview
Listening to Students: Student Panel
Facilitator : Shannon Faris, Ph.D.Director, Planning & External Reporting for Marshall School of Business
Student Panel: Michelle Choi, Undergraduate, Hong KongDona Adamova, MS Economics, Kazakhstan
Mir Hashim Ali Zain, MS Petroleum Engineering, IndiaEmi Sumida, Ph.D., Post-Doctoral Fellow,
Student Counseling Services & Disability Services and Programs, Japan
Inaugural Assessment SymposiumUSC Division of Student Affairs
June 16, 2011
Listening to Students: Learning from Research and
Student Experience
Jack Trump, Assistant Director Office of Residential Education
Janice Schafrik, Ph.D., Student Services Manager, Testing Accommodations, Disability Services & Programs
Emi Sumida, Ph.D., Post-Doctoral Fellow, Student Counseling Services & Disability Services and Programs Najib Al-Samarrai, Ph.D., Associate Director, Testing Bureau
Inaugural Assessment SymposiumUSC Division of Student Affairs
June 16, 2011
Residential Education Student Satisfaction Survey
Jack Trump, Assistant Director ,
Office of Residential Education
Listening to Students: Residential Satisfaction Survey
Issued in Fall 2010 2,240 Residents participated in the
survey 272 Residents identified themselves
as International Students 221 filled out additional questions
about International Students
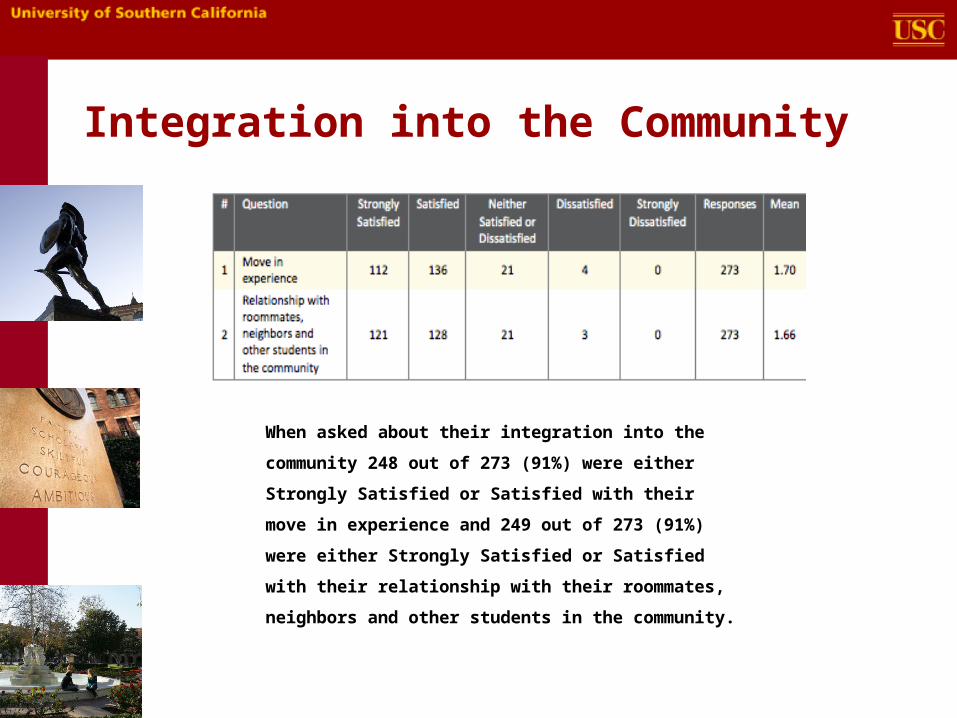
Integration into the Community
When asked about their integration into the
community 248 out of 273 (91%) were either
Strongly Satisfied or Satisfied with their move
in experience and 249 out of 273 (91%) were
either Strongly Satisfied or Satisfied with their
relationship with their roommates, neighbors
and other students in the community.
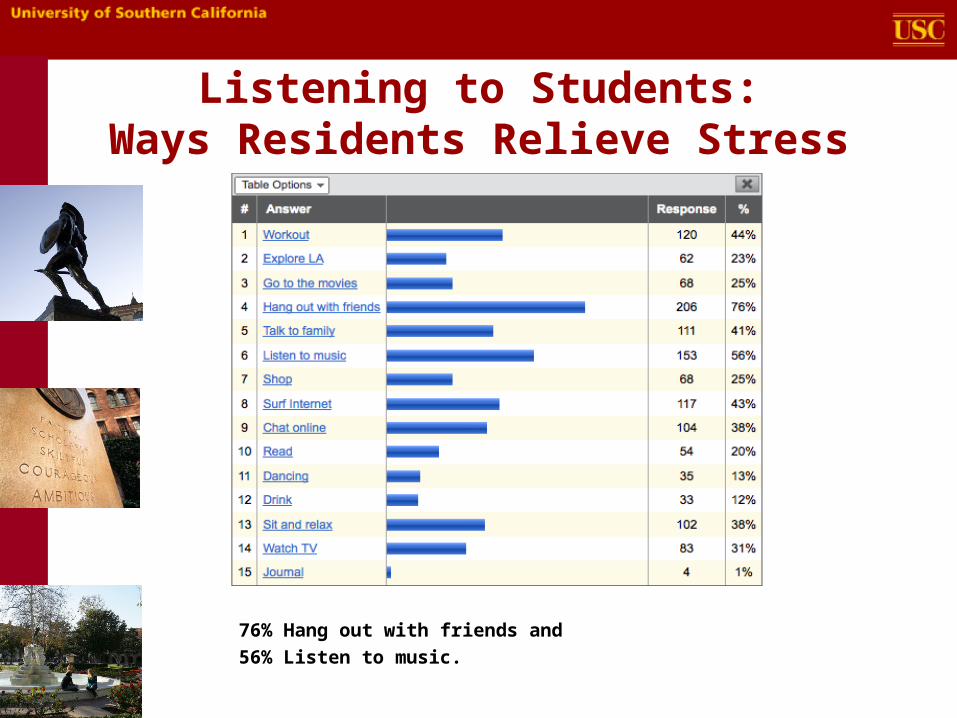
Listening to Students: Ways Residents Relieve Stress
76% Hang out with friends and 56% Listen to music.
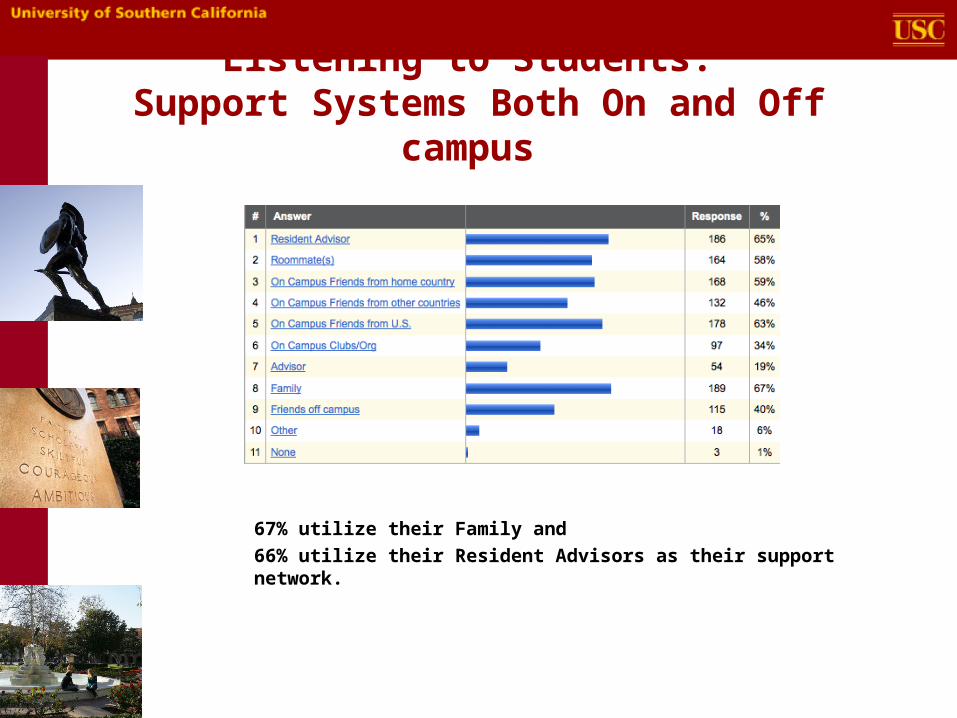
Listening to Students: Support Systems Both On and Off
campus
67% utilize their Family and 66% utilize their Resident Advisors as their support network.
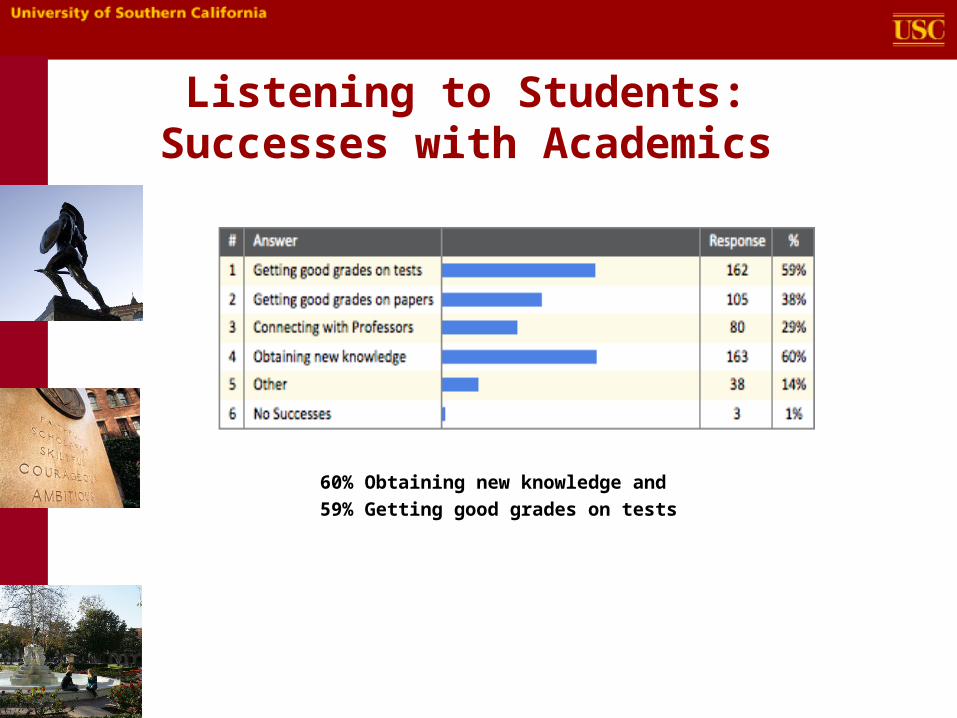
Listening to Students: Successes with Academics
60% Obtaining new knowledge and59% Getting good grades on tests
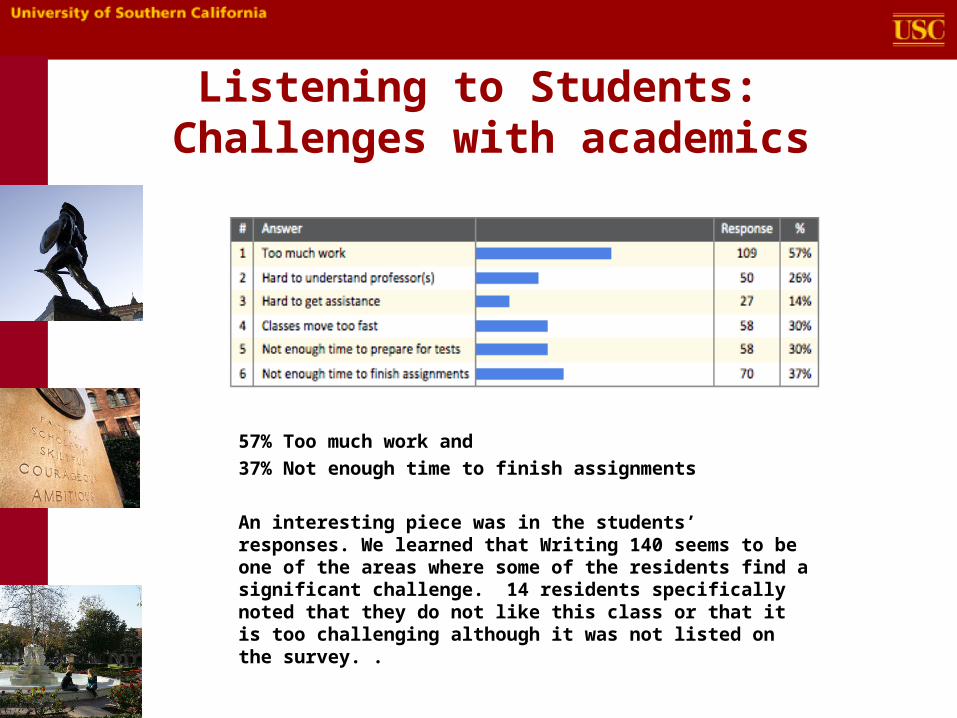
Listening to Students: Challenges with academics
57% Too much work and 37% Not enough time to finish assignments
An interesting piece was in the students’ responses. We learned that Writing 140 seems to be one of the areas where some of the residents find a significant challenge. 14 residents specifically noted that they do not like this class or that it is too challenging although it was not listed on the survey. .
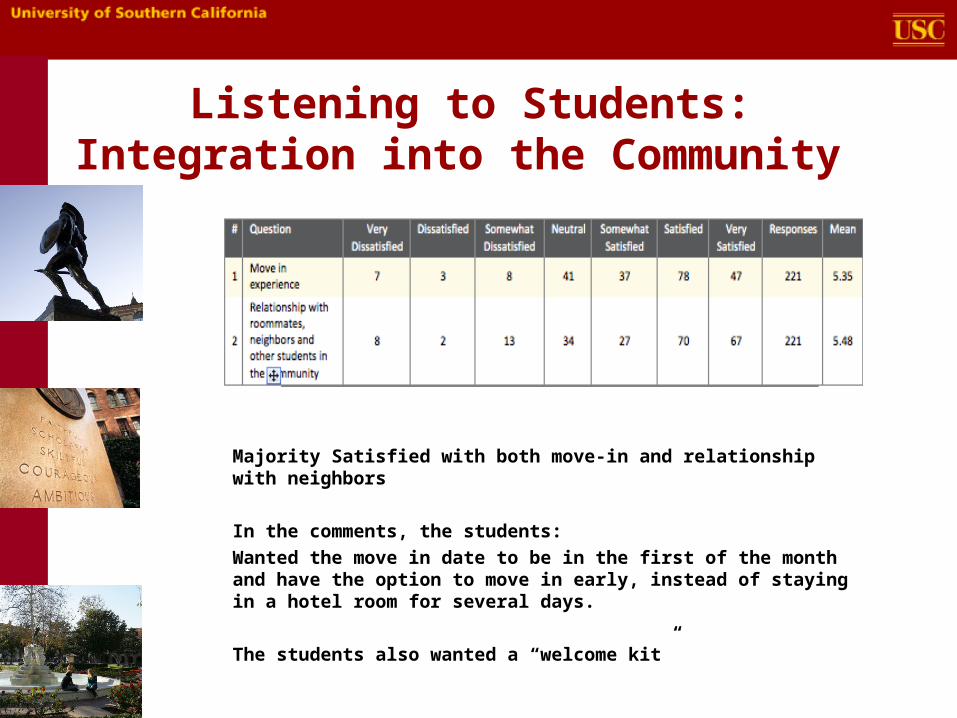
Listening to Students:Integration into the Community
Majority Satisfied with both move-in and relationship with neighbors
In the comments, the students: Wanted the move in date to be in the first of the month and have the option to move in early, instead of staying in a hotel room for several days. The students also wanted a “welcome kit”
Utilization of Student Counseling Services
Emi Sumida, Ph.D.Post Doctoral Fellow
Student Counseling ServicesDisability Services and Programs
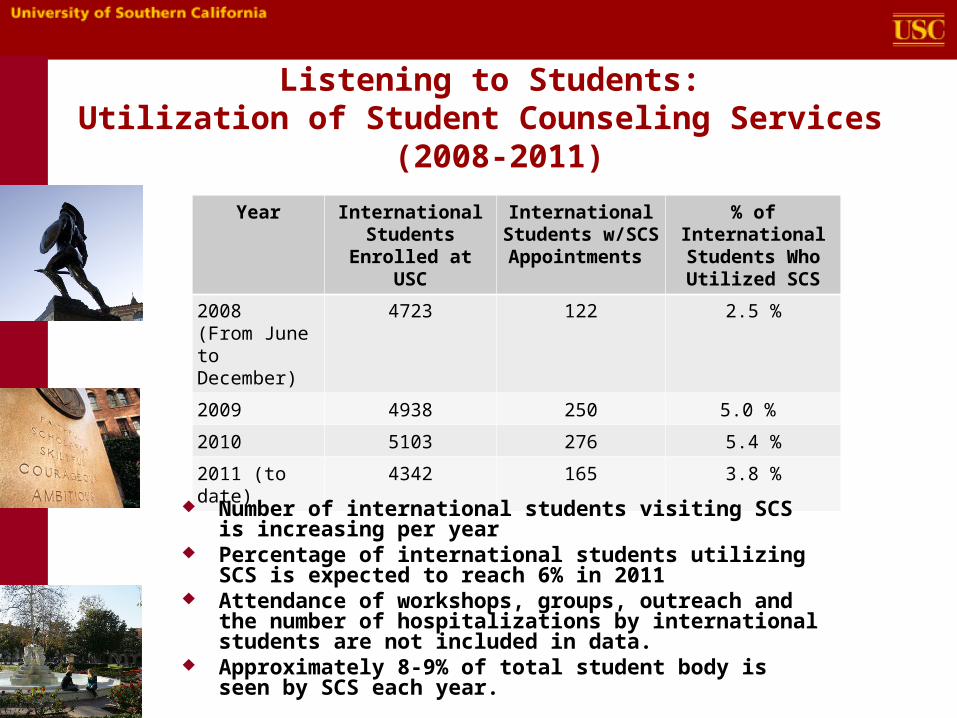
Listening to Students: Utilization of Student Counseling Services
(2008-2011)
Year International Students
Enrolled at USC
International Students
w/SCS Appointments
% of International Students Who Utilized SCS
2008 (From June to December)
4723 122 2.5 %
2009 4938 250 5.0 %
2010 5103 276 5.4 %
2011 (to date)
4342 165 3.8 %
Number of international students visiting SCS is increasing per year
Percentage of international students utilizing SCS is expected to reach 6% in 2011
Attendance of workshops, groups, outreach and the number of hospitalizations by international students are not included in data.
Approximately 8-9% of total student body is seen by SCS each year.
Listening to Students: Utilization of Student Counseling Services
(2008-2011)
Primary Reasons for Therapy Academic problems Relationship concerns Anxiety Depression
International Student Exam (ISE) for Incoming International
Students at USC
Dr. Najib Al-SamarraiAssociate Director, Testing Bureau
Listening to Students: International Student Exam (ISE)
The Test is offered by ALI and administered by the Testing Bureau many times at the beginning of fall and spring semesters.
Who needs to take the test? The test is designed to place students
at the appropriate level based on their English Language proficiency.
Can the student take other courses in his/her major at USC beside the ALI courses?
International Students at USC
Dr. Janice Schafrik
Student Services Manager,
Testing Accommodations,
Disability Services and Programs
International Students at USC
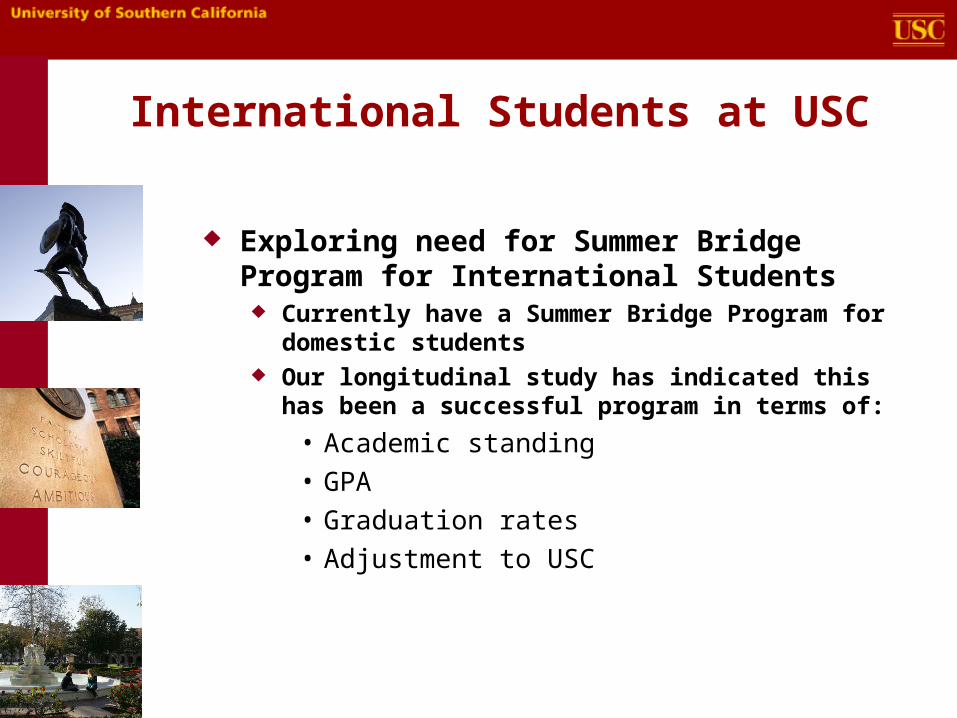
Exploring need for Summer Bridge Program for International Students Currently have a Summer Bridge Program for
domestic students Our longitudinal study has indicated this has
been a successful program in terms of:
• Academic standing• GPA• Graduation rates• Adjustment to USC
International Students at USC
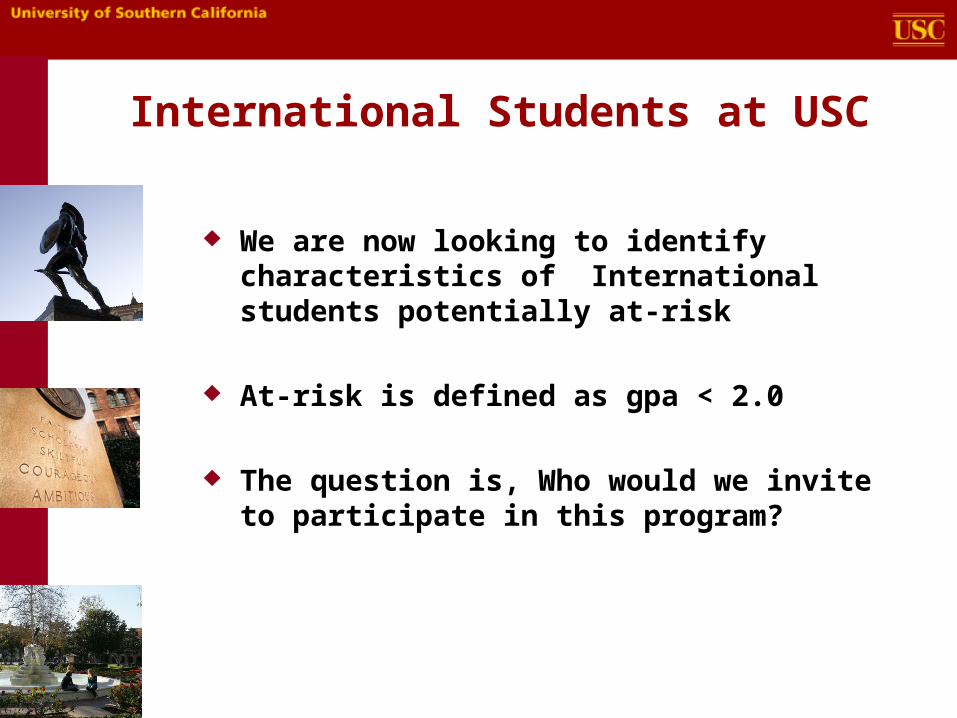
We are now looking to identify characteristics of International students potentially at-risk
At-risk is defined as gpa < 2.0
The question is, Who would we invite to participate in this program?
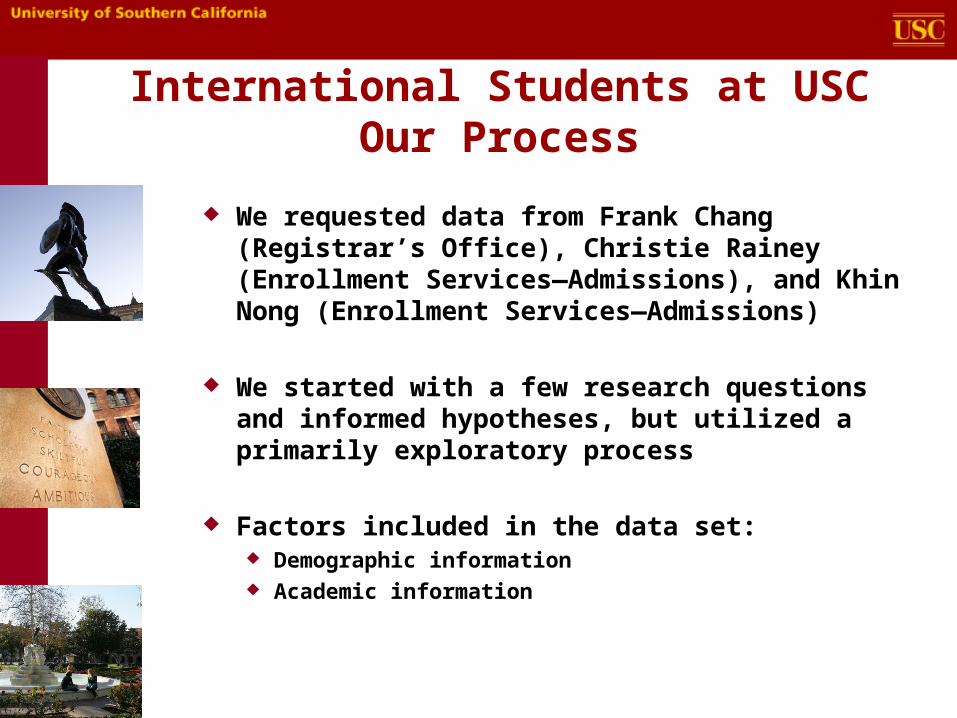
International Students at USCOur Process
We requested data from Frank Chang (Registrar’s Office), Christie Rainey (Enrollment Services—Admissions), and Khin Nong (Enrollment Services—Admissions)
We started with a few research questions and informed hypotheses, but utilized a primarily exploratory process
Factors included in the data set: Demographic information Academic information
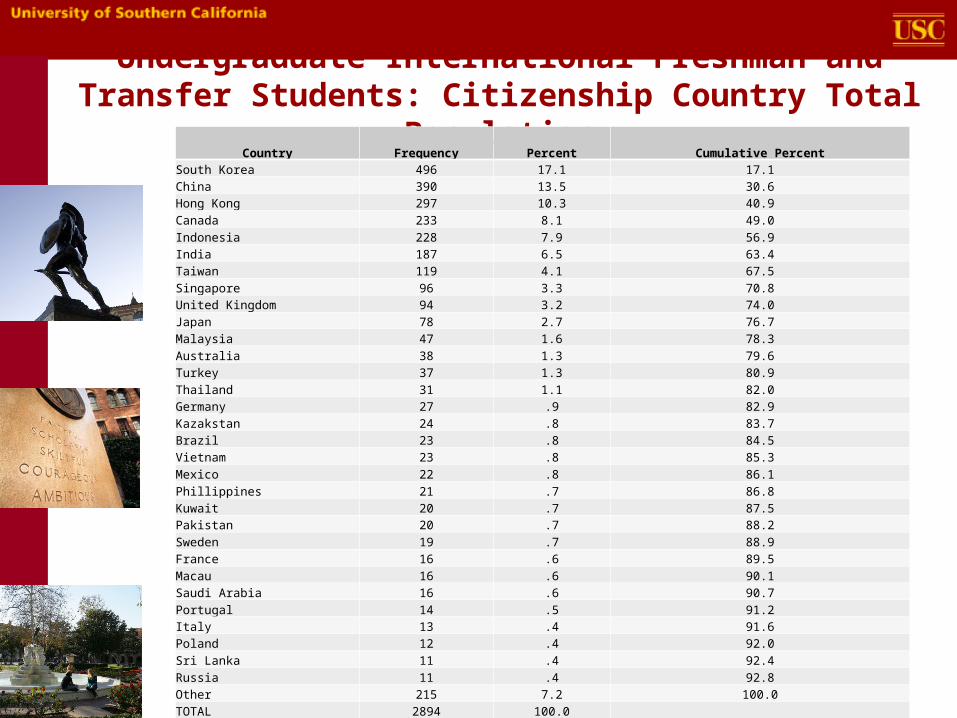
Undergraduate International Freshman and Transfer Students: Citizenship Country Total
Population Country
Frequency
Percent
Cumulative Percent
South Korea 496 17.1 17.1
China 390 13.5 30.6
Hong Kong 297 10.3 40.9
Canada 233 8.1 49.0
Indonesia 228 7.9 56.9
India 187 6.5 63.4
Taiwan 119 4.1 67.5
Singapore 96 3.3 70.8
United Kingdom 94 3.2 74.0
Japan 78 2.7 76.7
Malaysia 47 1.6 78.3
Australia 38 1.3 79.6
Turkey 37 1.3 80.9
Thailand 31 1.1 82.0
Germany 27 .9 82.9
Kazakstan 24 .8 83.7
Brazil 23 .8 84.5
Vietnam 23 .8 85.3
Mexico 22 .8 86.1
Phillippines 21 .7 86.8
Kuwait 20 .7 87.5
Pakistan 20 .7 88.2
Sweden 19 .7 88.9
France 16 .6 89.5
Macau 16 .6 90.1
Saudi Arabia 16 .6 90.7
Portugal 14 .5 91.2
Italy 13 .4 91.6
Poland 12 .4 92.0
Sri Lanka 11 .4 92.4
Russia 11 .4 92.8
Other 215 7.2 100.0
TOTAL 2894 100.0
International Students at USC
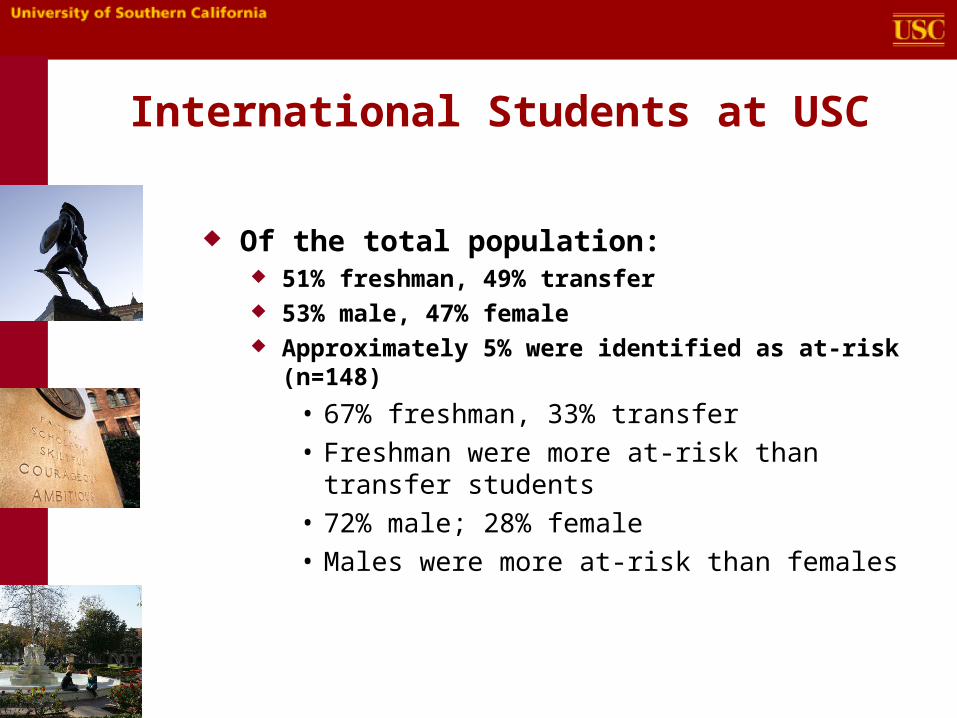
Of the total population: 51% freshman, 49% transfer 53% male, 47% female Approximately 5% were identified as at-risk
(n=148)
• 67% freshman, 33% transfer• Freshman were more at-risk than transfer
students• 72% male; 28% female• Males were more at-risk than females
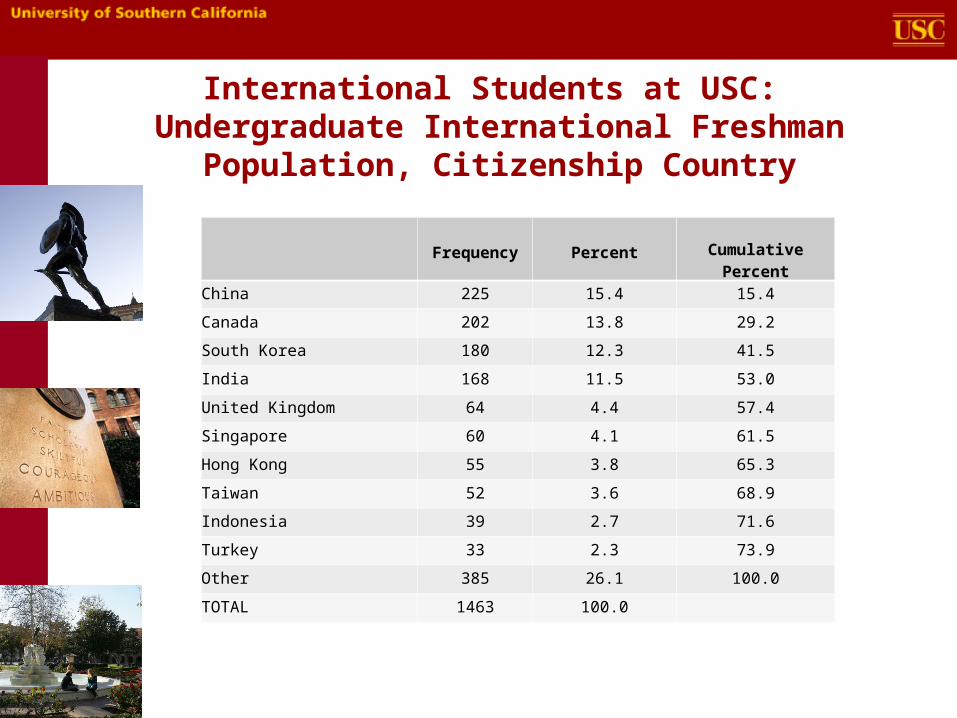
International Students at USC: Undergraduate International Freshman
Population, Citizenship Country
Frequency
Percent Cumulative Percent
China 225 15.4 15.4
Canada 202 13.8 29.2
South Korea 180 12.3 41.5
India 168 11.5 53.0
United Kingdom 64 4.4 57.4
Singapore 60 4.1 61.5
Hong Kong 55 3.8 65.3
Taiwan 52 3.6 68.9
Indonesia 39 2.7 71.6
Turkey 33 2.3 73.9
Other 385 26.1 100.0
TOTAL 1463 100.0
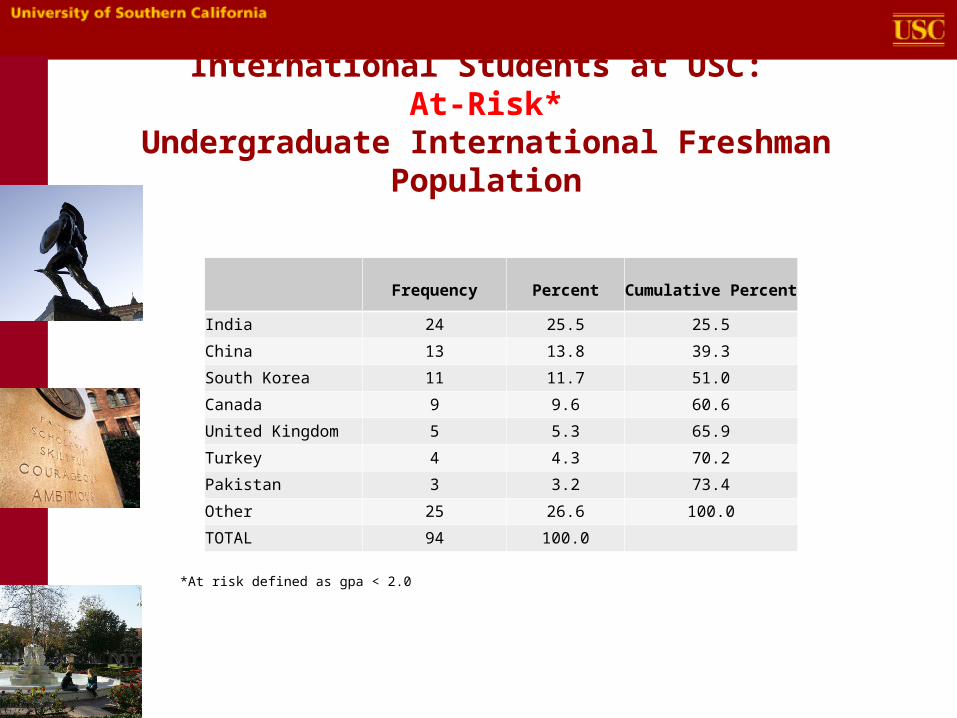
International Students at USC: At-Risk*
Undergraduate International Freshman Population
Frequency Percent Cumulative Percent
India 24 25.5 25.5
China 13 13.8 39.3
South Korea 11 11.7 51.0
Canada 9 9.6 60.6
United Kingdom 5 5.3 65.9
Turkey 4 4.3 70.2
Pakistan 3 3.2 73.4
Other 25 26.6 100.0
TOTAL 94 100.0
*At risk defined as gpa < 2.0
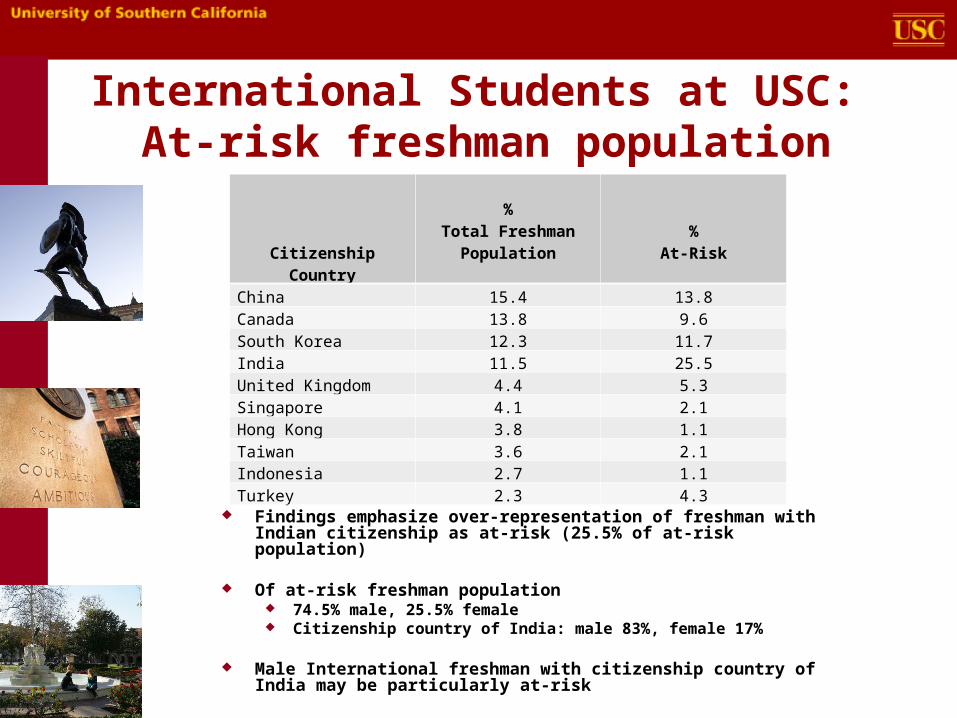
International Students at USC: At-risk freshman population
Findings emphasize over-representation of freshman with Indian citizenship as at-risk (25.5% of at-risk population)
Of at-risk freshman population 74.5% male, 25.5% female Citizenship country of India: male 83%, female 17%
Male International freshman with citizenship country of India may be particularly at-risk
Citizenship Country
%
Total FreshmanPopulation
%At-Risk
China 15.4 13.8Canada 13.8 9.6South Korea 12.3 11.7India 11.5 25.5United Kingdom 4.4 5.3Singapore 4.1 2.1Hong Kong 3.8 1.1Taiwan 3.6 2.1Indonesia 2.7 1.1Turkey 2.3 4.3
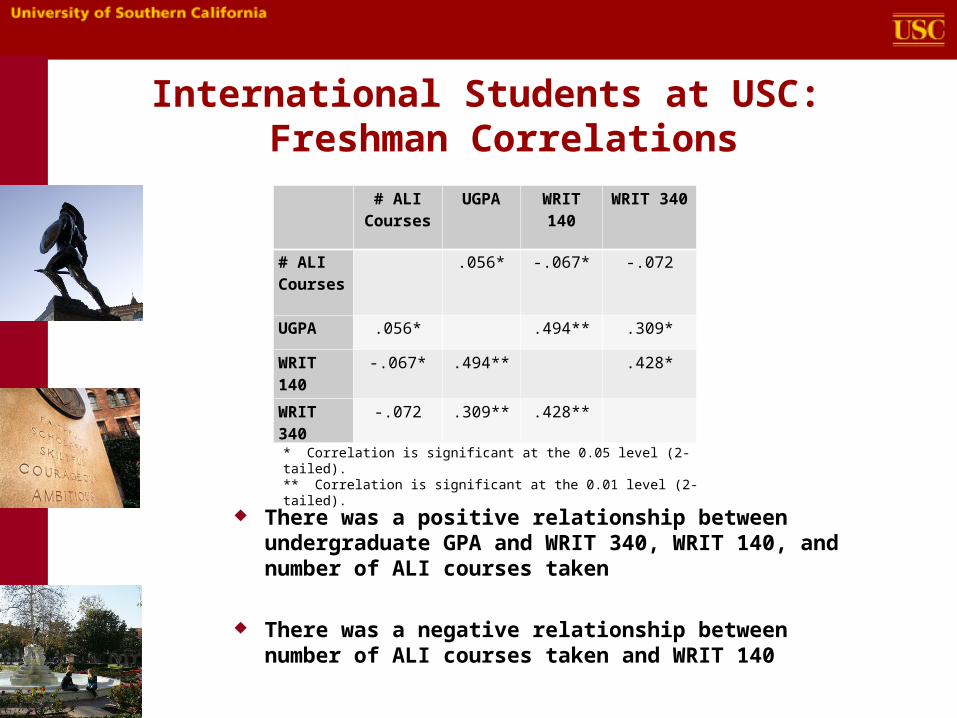
International Students at USC:Freshman Correlations
There was a positive relationship between undergraduate GPA and WRIT 340, WRIT 140, and number of ALI courses taken
There was a negative relationship between number of ALI courses taken and WRIT 140
# ALI Courses
UGPA WRIT 140 WRIT 340
# ALI Courses
.056* -.067* -.072
UGPA .056* .494** .309*
WRIT 140
-.067* .494** .428*
WRIT 340
-.072 .309** .428**
* Correlation is significant at the 0.05 level (2-tailed).** Correlation is significant at the 0.01 level (2-tailed).