Embed Size (px)
Citation preview
1
Report of Earnings and Financial Statements for the Fiscal Year Ended March 31, 2015 (Consolidated)
(Prepared pursuant to Japanese GAAP)
April 28, 2015
Listed company’s name: Kawasaki Heavy Industries, Ltd.
Listed on: 1st sections of the TSE, and NSE
Stock code: 7012
URL: http://www.khi.co.jp/
Representative: Shigeru Murayama, President
Contact: Ryoji Mori, Senior Manager, Accounting Department
Tel: +81 3-3435-2130 Scheduled dates:
Ordinary general meeting of shareholders June 25, 2015
Commencement date of dividend payments June 26, 2015
Submission of financial statements: June 25, 2015 Supplementary materials to financial results Available
Earnings presentation: Conducted (for institutional investors and analysts) 1. Consolidated Financial Results for the Fiscal Year Ended March 31, 2015
(April 1, 2014 – March 31, 2015)
(Amounts in millions of yen rounded down to the nearest million yen)
(1) Operating Results
Years ended March 31 (Millions of yen ) (Percentage figures indicate change compared with the previous fiscal year )
Net sales Operating income Recurring profit Net income
% % % %
2015 1,486,123 7.2 87,259 20.6 84,288 39.0 51,639 33.7
2014 1,385,482 7.4 72,351 72.0 60,605 54.1 38,601 25.0
Note: Comprehensive income Fiscal year ended March 31, 2015: ¥ 87,760 million 27.7%
Fiscal year ended March 31, 2014: ¥ 68,705 million 56.0%
Years ended March 31
Earnings per share Earnings per share
– diluted Return on equity Return on assets
Operating income
to net sales
Yen Yen % % %
2015 30.89 - 12.9 5.2 5.8
2014 23.09 - 11.0 4.0 5.2
For reference: Equity in income of non consolidated subsidiaries and affiliates
Fiscal year ended March 31, 2015: ¥ 6,208 million
Fiscal year ended March 31, 2014: ¥ 7,016 million
(2) Financial Condition
March 31 (Millions of yen )
Total assets Net assets Equity ratio Net assets per share
% Yen
2015 1,662,283 447,957 25.9 258.58
2014 1,554,430 376,686 23.3 217.16
For reference: Shareholders’ equity March 31, 2015: ¥ 431,996 million
March 31, 2014: ¥ 363,041 million

2
(3) Cash Flow Position
Years ended March 31 (Millions of yen)
Cash flows from
operating activities
Cash flows from
investing activities
Cash flows from
financing activities
Cash and cash equivalents
at end of year
2015 127,651 (67,397) (57,133) 47,721
2014 151,721 (77,559) (62,505) 45,431
2. Dividends Years ended/ending March 31
Record
date or
term
Dividend per share Total
dividends
paid
(annual)
Payout ratio
(consolidated)
Dividends /
Net assets
(consolidated) 1Q 2Q 3Q Year-end Full year
Yen Yen Yen Yen Yen million yen % %
2014 - 0.00 - 6.00 6.00 10,030 25.9 2.7
2015 - 3.00 - 7.00 10.00 16,709 32.3 4.2
2016
(forecast) - 5.00 - 7.00 12.00 29.0
3. Forecast of Consolidated Earnings for the Fiscal Year Ending March 31, 2016
(April 1, 2015 – March 31, 2016) (Millions of yen)(Percentage figures indicate change compared with the previous fiscal year)
Net sales Operating income Recurring profit Net income Earnings
per share
% % % % Yen For six months
ending September 30,
2015
785,000 23.9 39,000 68.1 37,000 42.5 26,000 42.9 15.56
Full year 1,650,000 11.0 102,000 16.8 100,000 18.6 69,000 33.6 41.30
*Notes
(1) Changes affecting the status of material subsidiaries (scope of consolidation): None
(2) Changes in accounting policies, changes in accounting estimates, and correction of errors
(ⅰ) Changes in accounting policies in accord with revisions to accounting standards: None
(ⅱ) Changes in accounting policies other than (ⅰ): None
(ⅲ) Changes in accounting estimates: None
(ⅳ) Correction of errors: None
(3) Number of shares issued and outstanding (common stock)
(ⅰ) Number of shares issued as of period-end (including treasury stock)
March 31, 2015: 1,670,805,320 shares
March 31, 2014: 1,671,892,659 shares
(ⅱ) Number of shares held in treasury as of period-end
March 31, 2015: 191,653 shares
March 31, 2014: 141,710 shares
(ⅲ) Average number of shares during respective periods
March 31, 2015: 1,671,637,196 shares
March 31, 2014: 1,671,770,272 shares

3
For reference: Overview of Non-Consolidated Financial Results
(1) Operating Results
Years ended March 31 (Millions of yen ) (Percentage figures indicate change compared with the previous fiscal year)
Net sales Operating income Recurring profit Net income
% % % %
2015 1,098,013 8.5 46,409 28.5 55,513 54.6 36,465 13.6
2014 1,011,603 2.8 36,108 187.1 35,905 84.7 32,099 87.0
Earnings per share Earnings per share
– diluted
Yen Yen
2015 21.81 -
2014 19.20 -
(2) Financial Condition March 31 (Millions of yen)
Total assets Net assets Equity ratio Net assets per share
% Yen
2015 1,301,125 294,052 22.5 176.01
2014 1,243,533 273,193 21.9 163.41
Note: Shareholders’ equity March 31, 2015: ¥294,052 million
March 31, 2014: ¥ 273,193 million
* Review Status
This report is exempt from the review of accounts conducted pursuant to Japan’s Financial Instruments
and Exchange Act. As of this report’s publication, the review of the financial results had not been
completed.
*Appropriate Use of Financial Forecasts and Other Important Matters
Forward-Looking Statements
These materials contain earnings forecast and other forward-looking statements based on information
available to the company at the time of disclosure and the company makes no assurances as to the actual
results and/or other outcomes, which may differ from those expressed or implied herein due to various
factors. For assumptions underlying earnings forecasts and other information regarding the use of such
forecasts, refer to “(iii) Consolidated Earnings Outlook” on page 8 in section “(1) Consolidated Operating
Results” of “1. Qualitative Information and Financial Statements” in the Accompanying Materials.
How to Obtain Supplementary Briefing Material on Financial Results and Details of the Financial
Results Briefing
The Company plans to conduct a briefing for institutional investors and analysts on Tuesday April 28,
2015, and to post the briefing material on financial results to be used for the briefing on TDnet and the
Company’s website simultaneously with the announcement of financial results.

4
Accompanying Materials – Contents
1. Qualitative Information and Financial Statements 5
(1) Consolidated operating results 5
(2) Consolidated financial position 9
(3) Dividend policy and dividends for the fiscal years 2014 and 2015 10
(4) Business and other risks 11
2. Status of Group 11
3. Management Strategy 11
(1) Basic management strategy 11
(2) Target management metrics 11
(3) Medium- to long-term management strategy 12
(4) Management priorities 12
4. Basic rationale for selecting accounting standards 15
5. Consolidated Financial Statements 16
(1) Consolidated balance sheets 16
(2) Consolidated statements of income and comprehensive income 18
Consolidated statements of income 18
Consolidated statements of comprehensive income 19
(3) Consolidated statement of changes in net assets 20
(4) Consolidated statements of cash flows 23
(5) Notes on financial statements
Notes on the going-concern assumption
24
24
Basis of preparation of financial statements 24
Changes in basis of preparation of financial statements 24
Additional information
Consolidated balance sheets
Consolidated Statements of Income
Segment information and others
Per share data
Material subsequent events
24
24
24
25
29
30
6. Others 31
(1) Corporate officer changes 31
(2) Consolidated orders and sales 31
(3) Supplementary information on earnings forecasts for the fiscal year ending March 31, 2016 32

5
1. Qualitative Information and Financial Statements
(1) Consolidated operating results
(i) Overview of consolidated operating results
In fiscal 2014 (the year ended March 31, 2015), the global economy continued to grow
modestly on the whole in conjunction with the full-fledged recovery of the US economy.
However, the situation will continue to bear watching, particularly with respect to the
impacts of US monetary policy actions, concerns about economic stagnation in emerging
countries, uncertainty with respect to the debt problem in Europe and other factors, as
well as the impact of the decline in crude oil prices on resource-rich countries.
While there are concerns about the risk of a downturn in overseas economies
negatively impacting the Japanese economy, the ongoing improvement in the
employment and income environments as well as the decline in crude oil prices have led
to an upturn in consumer sentiment. This, along with other factors, such as the
improvement in exporters’ earnings due to the weakening of the yen against other
currencies, especially the US dollar, are helping the economy rise out of the malaise
caused by the recoil decline following last April’s consumption tax rate hike, and the
economy is expected to continue to grow modestly going forward.
Amid such an operating environment, the Group achieved an increase in orders
received during fiscal 2014, centered on order growth in segments such as Plant &
Infrastructure, Aerospace, and Ship & Offshore Structure. Overall sales increased on
growth in sales in segments such as Aerospace and Gas Turbine & Machinery.
Operating income, recurring profit and net income also rose as a result of the increase
in profit in Aerospace and most other segments.
The Group’s consolidated orders received increased by ¥257.5 billion year on year to ¥1,712.9
billion. Consolidated net sales totaled ¥1,486.1 billion, a ¥100.6 billion year-on-year increase, and
consolidated operating income increased by ¥14.9 billion year on year to ¥87.2 billion. As a result of
operating income growth and decreasing foreign exchange losses, consolidated recurring profit
increased by ¥23.6 billion year on year to ¥84.2 billion. Consolidated net income increased by
¥13.0billion year on year to ¥51.6 billion.

6
Consolidated operating performance in the fiscal year ended March 31, 2015, is summarized by
segment below.
(ii) Segment information
Segment net sales, operating income, and orders received (billions of yen)
Fiscal year ended March 31 Orders received
2014 (A) 2015(B) Change (B – A) Fiscal year ended March 31
Net
sales
Operating
income
Net
sales
Operating
income
Net
sales
Operating
income
2014
(A)
2015
(B)
Change
(B – A)
Ship & Offshore
Structure 80.8 (2.0) 90.3 2.6 9.4 4.6 117.8 179.2 61.3
Rolling Stock 147.9 7.5 121.5 6.0 (26.4) (1.5) 133.0 131.4 (1.6)
Aerospace 280.7 26.2 325.0 36.3 44.3 10.0 286.3 357.0 70.6
Gas Turbine &
Machinery 189.2 10.4 218.7 11.2 29.5 0.7 222.0 235.7 13.7
Plant &
Infrastructure 103.8 6.3 121.1 6.5 17.2 0.2 103.9 203.4 99.5
Motorcycle &
Engine 322.2 16.1 329.2 14.9 6.9 (1.1) 322.2 329.2 6.9
Precision
Machinery 123.2 10.4 135.7 10.9 12.5 0.4 127.2 136.2 8.9
Other 137.2 4.4 144.2 3.9 6.9 (0.4) 142.6 140.5 (2.1)
Adjustments - (7.2) - (5.4) - 1.8 - - -
Total 1,385.4 72.3 1,486.1 87.2 100.6 14.9 1,455.4 1,712.9 257.5
Note: 1. Net sales include only sales to external customers.
2. The Motorcycle & Engine segment’s orders received are equal to its net sales as production is based mainly
on estimated demand.
Ship & Offshore Structure
Consolidated orders received increased ¥61.3 billion year on year to ¥179.2 billion, as a result of
booking orders for a submarine and five liquefied gas carriers (LNG carriers and LPG carrier).
Consolidated net sales increased ¥9.4 billion year on year to ¥90.3 billion, as growth in the
amount of construction of LNG carriers and other factors offset the decline in the amount of
construction of LPG carriers, bulk carriers, and other vessels.
The segment incurred a consolidated operating income of ¥2.6 billion, a ¥4.6 billion upturn from
the previous fiscal year's consolidated operating income. The amelioration in profitability was
chiefly by virtue of sales growth and the reversal of provision for losses on construction contracts.
Rolling Stock
Consolidated orders received were ¥131.4 billion that were equivalent level of the previous fiscal
year, as despite receiving an order from the Singapore Land Transport Authority for subway train

7
cars for new lines, there was an absence of large orders from North America and from within Japan
such as were received in the same period of the previous fiscal year.
Consolidated net sales decreased ¥26.4 billion year on year to ¥121.5 billion, as a result of a
decline in overseas sales to customers in North America.
Consolidated operating income decreased ¥1.5 billion year on year to ¥6.0 billion, attributable to a
decline in sales and profit margin.
Aerospace
Consolidated orders received grew ¥70.6 billion year on year to ¥357.0 billion, due to an increase
in orders from Japan’s Ministry of Defense and for component parts for the Boeing 787.
Consolidated net sales increased ¥44.3 billion year on year to ¥325.0 billion, largely due to the
growth in sales to Japan’s Ministry of Defense and of component parts for Boeing777 and 787.
Consolidated operating income showed a sharp increase of ¥10.0 billion increase year on year to
¥36.3billion, largely by virtue of sales growth and yen depreciation.
Gas Turbine & Machinery
Consolidated orders received increased ¥13.7 billion year on year to ¥235.7 billion, attributable to
the increase in orders for aircraft engine components,industrial gas turbines, natural gas compression
modules, and other products.
Consolidated net sales grew ¥29.5 billion year on year to ¥218.7 billion, due to an increase in
sales of aircraft engine components, hydraulic machinery, and other products.
Despite the increase in amortization of development costs for the aircraft engine new program,
R&D costs, and other factors, the increase in sales resulted in consolidated operating income of
¥11.2billion, a ¥0.7 billion year-on-year increase.
Plant & Infrastructure
Consolidated orders received increased by ¥99.5 billion year on year to ¥203.4 billion
as a result of booking orders for gas-to-gasoline plants, boiler power plants and other
projects.
Consolidated net sales increased ¥17.2 billion year on year to ¥121.1 billion, due to
progress in areas such as LNG storage tank plants and boiler power plants.
The segment posted consolidated operating income of ¥6.5 billion, which was roughly
on par with the previous year, as the increase in sales was partly offset by a
deterioration in profitability and other factors.
Motorcycle & Engine
Consolidated net sales totaled ¥329.2 billion, a ¥6.9 billion year-on-year increase, as
the decline in motorcycle sales to Latin America and Thailand was offset by the increase
in vehicle sales and motorcycle sales to Europe.
Consolidated operating income fell ¥1.1 billion year-on-year to ¥14.9 billion,
primarily due to factors such as intensifying competition in emerging countries and an

8
increase in fixed costs.
Precision Machinery
Consolidated orders received increased by ¥8.9 billion year on year to ¥136.2 billion
as a result of an increase in orders for industrial robots for the automotive industry and
other applications.
Consolidated net sales increased ¥12.5 billion year on year to ¥135.7 billion, as
although sales of hydraulic components were roughly flat year on year, there was an
increase in sales of industrial robots, centered on robots for the automotive industry,
along with other factors.
The segment posted consolidated operating income of ¥10.9 billion, which was
roughly on par with the previous year, as the increase in sales was offset by a
deterioration in profitability and other factors.
Other Operations
Consolidated net sales increased by ¥6.9 billion year on year to ¥144.2 billion.
Consolidated operating income was ¥3.9 billion that were equivalent level of the previous fiscal
year.
(iii) Consolidated earnings outlook
The Group's operating environment is generally solid, underpinned by the recovery in
the economies of Japan, the US, and other developed countries, despite concerns
including the impacts of economic stagnation in emerging countries, uncertainty about
the European debt problem, and the decline in crude oil prices. In fiscal 2015 (the final
year of Medium-Term Business Plan 2013), the Group will put its full efforts into
achieving the targets of the medium-term business plan, and with everyone in the
Group involved in implementing Kawasaki-ROIC management, strive to make the
growth scenario envisioned in the Group Management Model 2018 a reality and
enduringly enhance corporate value.
For fiscal 2015, we are forecasting consolidated net sales of ¥1,650 billion, a
year-on-year increase of ¥163.9 billion expected to be concentrated mainly in the
Rolling Stock, Aerospace and Gas Turbine & Machinery segments. In terms of earnings,
we are forecasting consolidated operating income of ¥102 billion, recurring profit of
¥100 billion, and net income of ¥69 billion. We plan to achieve these forecasts by
continuing our various measures to improve earnings, such as steadily carrying out
investment and development aimed at future growth and boosting productivity.
For fiscal 2015, we are expecting an increase in Ministry of Defense projects in the
Aerospace segment, and an increase in train car orders for overseas customers in the
Rolling Stock segment. However, due to the fact that we are anticipating a decline in
orders in both the Plant & Infrastructure and Ship & Offshore Structure segments
which received orders for large projects in the previous fiscal year, we are expecting

9
consolidated orders received of ¥1,680 billion, a ¥32.9 billion year-on-year decline.
Furthermore, we are expecting ROIC of 11.8% and ROE of 15% due to a further
improvement in capital productivity achieved by putting Kawasaki-ROIC management
into practice.
The Company’s earnings forecasts assume exchange rates of ¥118 to the US dollar
and ¥128 to the euro.
Note regarding consolidated earnings outlook
The above earnings outlook is based on information available at the time of preparation, and
includes risks and uncertainties. We therefore discourage making investment decisions depending
solely on this outlook. Actual earnings may differ materially from this outlook, due to a variety of
important factors stemming from changes the external environment and/or the Company’s internal
environment. Important factors that impact actual operating performance include, but are not limited
to, the economic situation surrounding the Company’s scope of business, foreign exchange rates, in
particular the yen/dollar exchange rate, tax codes and other regulatory system-related issues.
(2) Consolidated financial position
(i) Financial condition
(A) Assets
At March 31, 2015, consolidated assets totaled ¥1,662.2 billion, a 6.9% increase from
March 31, 2014. Of this total, current assets accounted for ¥1,073.0 billion, a 6.6%
year-on-year increase, chiefly attributable to an increase in inventories. Fixed assets
totaled ¥589.2 billion at March 31, 2015, a 7.3% increase from March 31, 2014, mainly
as a result of capital investments that added to holdings of property, plant and
equipment.
(B) Liabilities
Consolidated liabilities increased 3.1% year on year to ¥1,214.3 billion at March 31,
2015, mainly attributable to an increase in advances from customers, despite a decline
in short-term debt and other factors.
(C) Net assets
Consolidated net assets at March 31, 2015, totaled ¥447.9 billion, an 18.9% increase
from March 31, 2014. While dividend payments detracted from consolidated net assets,
this was more than offset by net income, improvement in foreign currency translation
adjustments due to yen depreciation, and other factors.
(ii) Cash flows
(A) Cash flows from operating activities
Operating activities provided net cash of ¥127.6 billion, a ¥24.0 billion decrease from
the previous fiscal year. Major sources of operating cash flow included depreciation
expense of ¥44.5 billion, a ¥29.4 billion increase in advances from customers, and a
10
¥28.9 billion increase in trade payables. Major uses of operating cash flow included
expenditure of ¥22.5 billion due to the increase in inventories.
(B) Cash flows from investing activities
Investing activities used net cash of ¥67.3 billion, ¥10.1 billion less than in the
previous fiscal year, mainly to acquire property, plant and equipment.
(C) Cash flows from financing activities
Financing activities used net cash of ¥57.1 billion, ¥5.3 billion less than the previous
fiscal year. The cash outflow was mainly due to debt repayments.
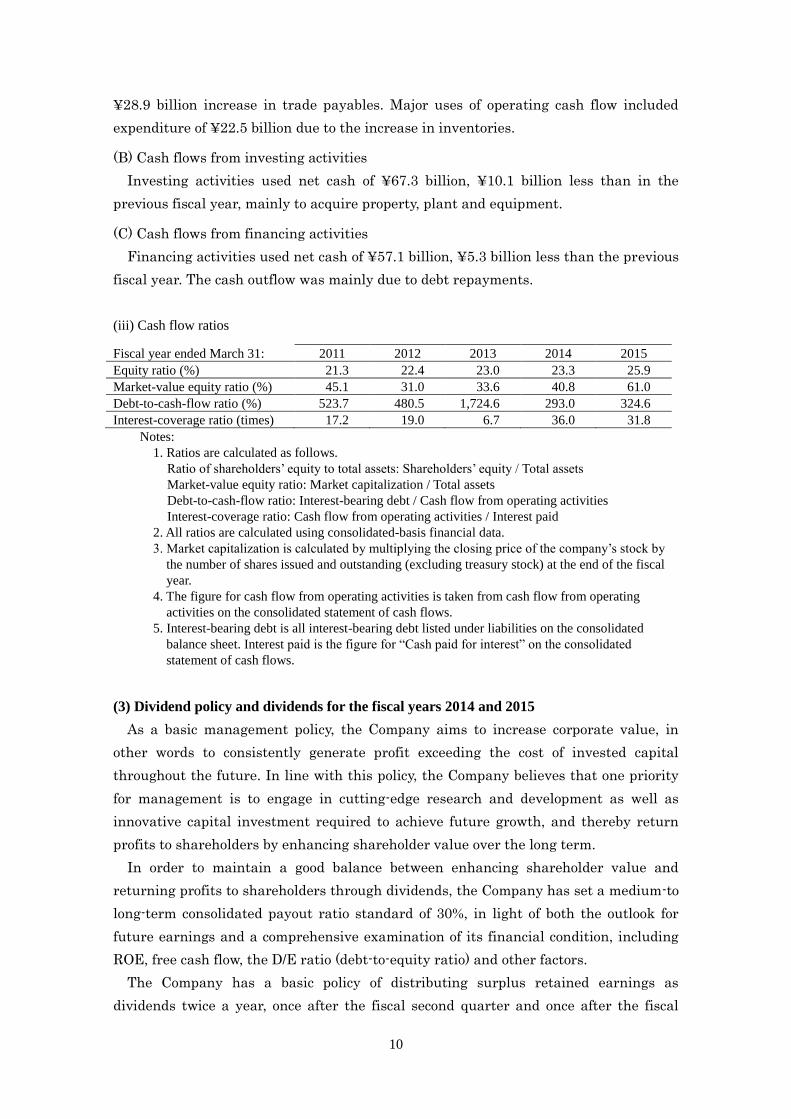
(iii) Cash flow ratios Fiscal year ended March 31: 2011 2012 2013 2014 2015
Equity ratio (%) 21.3 22.4 23.0 23.3 25.9
Market-value equity ratio (%) 45.1 31.0 33.6 40.8 61.0
Debt-to-cash-flow ratio (%) 523.7 480.5 1,724.6 293.0 324.6
Interest-coverage ratio (times) 17.2 19.0 6.7 36.0 31.8
Notes:
1. Ratios are calculated as follows.
Ratio of shareholders’ equity to total assets: Shareholders’ equity / Total assets
Market-value equity ratio: Market capitalization / Total assets
Debt-to-cash-flow ratio: Interest-bearing debt / Cash flow from operating activities
Interest-coverage ratio: Cash flow from operating activities / Interest paid
2. All ratios are calculated using consolidated-basis financial data.
3. Market capitalization is calculated by multiplying the closing price of the company’s stock by
the number of shares issued and outstanding (excluding treasury stock) at the end of the fiscal
year.
4. The figure for cash flow from operating activities is taken from cash flow from operating
activities on the consolidated statement of cash flows.
5. Interest-bearing debt is all interest-bearing debt listed under liabilities on the consolidated
balance sheet. Interest paid is the figure for “Cash paid for interest” on the consolidated
statement of cash flows.
(3) Dividend policy and dividends for the fiscal years 2014 and 2015
As a basic management policy, the Company aims to increase corporate value, in
other words to consistently generate profit exceeding the cost of invested capital
throughout the future. In line with this policy, the Company believes that one priority
for management is to engage in cutting-edge research and development as well as
innovative capital investment required to achieve future growth, and thereby return
profits to shareholders by enhancing shareholder value over the long term.
In order to maintain a good balance between enhancing shareholder value and
returning profits to shareholders through dividends, the Company has set a medium-to
long-term consolidated payout ratio standard of 30%, in light of both the outlook for
future earnings and a comprehensive examination of its financial condition, including
ROE, free cash flow, the D/E ratio (debt-to-equity ratio) and other factors.
The Company has a basic policy of distributing surplus retained earnings as
dividends twice a year, once after the fiscal second quarter and once after the fiscal

11
year-end. Interim dividends are authorized by the Board of Directors; year-end
dividends are authorized at general meetings of shareholders.
In fiscal 2015, the Company intends to pay a dividend of ¥12 per share (¥5 interim
dividend, ¥7 year-end dividend).
(4) Business and other risks
No risks other than those disclosed under the heading “Business and Other Risks” in the Company’s
most recent full-year statutory financial report (filed June 26, 2014) have surfaced since said filing.
Updated risk disclosures are therefore omitted here.
2. Status of Group
There have been no material changes in the “Chart of Operations (Nature of Operations)” and the
“Status of Affiliated Companies” in the Company’s most recent full-year statutory financial report
(filed June 26, 2014). Updated disclosure of them is therefore omitted here.
3. Management Strategy
(1) Basic management strategy
The Kawasaki Group Mission Statement states the Group’s mission as “Kawasaki,
working as one for the good of the planet.” The Group has established the Kawasaki
Business Vision 2020 based on this Group mission, as we aim to be a corporate group
that creates new value through integrated technological capabilities and opens the way
to new possibilities for our customers and society.
The Group has a basic management policy of increasing corporate value, in other
words consistently generating profits exceeding the cost of invested capital throughout
the future, and we will continue to carry out cutting-edge research and development as
well as innovative capital investment in order to achieve the aims of this management
policy.
(2) Target management metrics
The Group has adopted profit targets (operating income, recurring profit, and net
income) and ROIC (return on invested capital: earnings before interest and taxes
(EBIT) ÷ invested capital), a measure of capital efficiency, as its target metrics of
operating performance.
The Group applies ROIC for each of the Group’s business units (BU), the smallest
unit into which its operations are classified, and evaluates BU based on whether or not
ROIC exceeds the weighted-average cost of capital (WACC).
Improving these management metrics ultimately results in higher ROE (net income ÷
shareholders’ equity)

12
(3) Medium- to long-term management strategy
The Group has a medium-term business plan, Medium-Term Business Plan 2013,
effective from fiscal 2013 through fiscal 2015. In addition, the Group has placed
enhancement of corporate value at the heart of its management strategy, and with
everyone in the Group committed to “Kawasaki-ROIC Management,” we will strive to
carry out the following: 1) Plan and implement growth strategies through the
strengthening of core competencies in each BU; 2)Set optimal financial indicators with a
focus on ROIC, and formulate specific action plans to achieve these indicators; 3)Create
new value through internal synergies which leverage integrated management; 4)Define
scale-down or withdrawal strategies broken down to the sub-BU and individual product
level; and 5)Create a business portfolio focused on profitability, stability, and growth.
Furthermore, we have established the Group Management Model 2018 which lays out
what the Group aims to be in fiscal 2018. This Group Management Model 2018 includes
concrete financial indicator targets (operating income margin of 6% or higher, ROIC of
12% or higher, ROE of 14% or higher) and clarifies the philosophy aimed at generating
investment capacity targeting future growth. In addition, we have classified the BUs
into 4 areas (Aerospace and Transport Systems, Land and Sea Transport Systems,
Energy and Environment, and Industrial Equipment) according to their business
characteristics, and have established clear growth strategies and optimal business
portfolios for each area.
(4) Management priorities
In fiscal 2015, the final fiscal year of Medium-Term Business Plan 2013, the Group
will work on the following priorities in order to ensure that the targets of Medium-Term
Business Plan 2013 are achieved and to make the Group Management Model 2018 a
reality.
1. Enhance corporate value
The Group is striving to increase ROIC at the BU level. BUs with an ROIC lower than
the hurdle rate (WACC) will carry out action plans which set a detailed timetable for
clearing the hurdle rate and define the issues to be resolved, while BUs that have
already cleared the hurdle rate will endeavor to boost their ROIC to the highest level in
the industry and to increase their economic value-added, thereby enhancing the Group’s
overall corporate value.
2. Focus on cash flows
The Group will ensure appropriate levels of free cash flow while steadily investing
and developing with an eye to future growth, and use free cash flow as a source for
dividends and to reduce interest-bearing debt, thereby generating spare investment
capacity. To this end, the Group has made securing operating cash flow a particular
priority in fiscal 2015, and in addition to bolstering profitability, the Group plans to
13
develop specific measures aimed at increasing operating capital efficiency.
3. Strengthen risk management through integrated management
The Group’s businesses are exposed to various risks, including foreign exchange rates
and economic changes. In addition to monitoring anticipated risks with frequent risk
tolerance checks and carrying out efficient risk management, among other initiatives
the Group is working to review prices and production bases, and on the development of
high value-added products capable of withstanding changes in the external
environment. The Group is also striving to enhance risk management by leveraging the
strengths of integrated management. This includes well-balanced management of the
size of the 7 segments with different business characteristics, and inspecting the
business portfolio from the standpoint of diversifying risk among, for example, private
sector and public sector demand, between advanced countries and emerging markets,
and between order-made products and mass-produced products.
4. Enhance the corporate governance framework and focus on engagement
In Japan, companies are being asked to make a wide range of changes concerning the
way they interact with the capital markets. Examples of this include the Japanese
Version of the Stewardship Code, the final report (“Ito Review”) of the “Competitiveness
and Incentives for Sustainable Growth: Building Favorable Relationships between
Companies and Investors” project, and the Corporate Governance Code. In addition to
getting started on building a framework in compliance with the Corporate Governance
Code, the Group will continue to work with shareholders and investors to increase
corporate value by engaging in quality dialogue with the capital markets.
5. Bolster core competencies and pursue synergies
The Group is working to strengthen core competencies, which enable BUs to produce
profits, and is pursuing synergies leveraging the strengths of integrated management.
Examples of synergistic effects mobilizing the Group’s technologies include the
next-generation efWING® rolling stock bogie which has a CFRP frame, and the Ninja
H2/H2R which uses a supercharged engine developed by the Company. Going forward,
we will launch full-scale development towards the creation of a complete hydrogen (the
ultimate clean energy source) supply chain, including production, transport, storage
and use, as well as work on technologies to differentiate our products and businesses,
and develop base technologies.
6. Develop human capital and value diversity
The Group’s core competencies are underpinned by the Group’s personnel. Therefore,
the Group works to retain, develop, and enhance talented personnel, and also focuses on
creating a global workforce in conjunction with the global expansion of the Group,
fostering exchange between personnel extending beyond organizational lines, and

14
passing along skills and capabilities to our younger personnel. In addition, the Group is
endeavoring to create working environments that value diversity, such as enhancing
work-life balance, which includes promoting active roles for women and offering
childcare support, as well as establishing accommodating workplaces for persons with
disabilities and ensuring opportunities for persons with disabilities to work by
establishing special subsidiaries.
Individual business segments’ priorities are as follows.
① Ship & Offshore Structure
Continue to receive orders for liquefied gas carriers (LNG carriers, LPG carriers);
complete offshore work vessels and LNG-fueled propulsion ships; further boost the
competitiveness of the China business; launch the Brazil business; and bolster the
foundations of the naval shipping business
② Rolling Stock
Enhance competitiveness by developing leading-edge technologies, new rolling stock,
and other technologies and products that meet customers’ needs; further boost system
integration capabilities by strengthening personnel development; build a global,
optimal business execution platform, including overseas production, overseas
procurement, and utilization of partnerships
③ Aerospace
Establish a mass production system for C-2 transport and P-1 fixed-wing patrol
aircraft, including repair services and parts supply, and apply to derivative aircraft;
increase production of Boeing 787 component parts and apply to derivative aircraft, and
develop and launch mass production for 777X
④ Gas Turbine & Machinery
Develop an energy solutions business based on high-efficiency industrial gas turbines
and gas engines; promote overseas business development; develop new models of jet
engines for civilian aircraft and handle increased production
⑤ Plant & Infrastructure
Enhance competitiveness by making existing products more advanced and rapidly
commercialize new products and technologies; expand overseas businesses centered on
emerging markets and resource-producing countries by strengthening overseas
partnerships; further bolster engineering capabilities by cultivating human resources;
steadily complete large projects
⑥ Motorcycle & Engine

15
Continue to introduce attractive, strong models that possess the Kawasaki appeal;
establish position as a premium brand; further boost presence in advanced countries
where economies are on a recovery track; enhance the strength of the brand and
cultivate new markets in emerging markets; thoroughly promote management
efficiency for the global supply chain
⑦ Precision Machinery
Maintain high market share and expand market share for hydraulic components for
excavators; grow sales in market for construction machinery besides excavators;
enhance system proposal capabilities and upgrade and expand overseas production
framework in the industrial robot field; engage in ongoing initiatives targeting new
fields for the future, such as medical robots
Notes:
These materials contain earnings forecast and other forward-looking statements based on information
available to the company at the time of disclosure and the company makes no assurances as to the actual
results and/or other outcomes.
4. Basic rationale for selecting accounting standards
In light of the fact that the difference in accounting standards continues to narrow,
the Group plans to continue to use Japanese accounting standards in the near term.
The Group has been studying the possible adoption of IFRS, and will continue to
consider the situation surrounding the Group both in Japan and overseas, and will
address this issue as appropriate from the perspective of increasing corporate value.
16
5. Consolidated Financial Statements
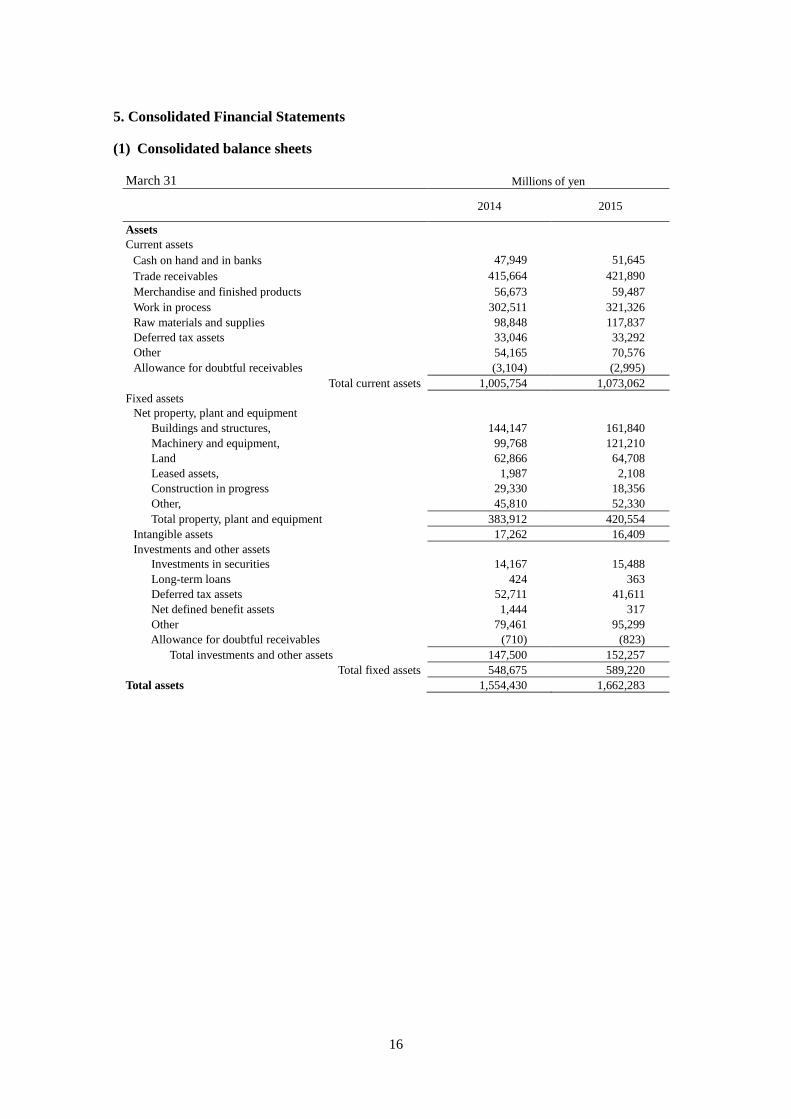
(1) Consolidated balance sheets
March 31 Millions of yen
2014 2015
Assets
Current assets Cash on hand and in banks 47,949 51,645
Trade receivables 415,664 421,890
Merchandise and finished products 56,673 59,487
Work in process 302,511 321,326
Raw materials and supplies 98,848 117,837
Deferred tax assets 33,046 33,292
Other
54,165 70,576
Allowance for doubtful receivables (3,104) (2,995)
Total current assets 1,005,754 1,073,062
Fixed assets
Net property, plant and equipment
Buildings and structures, 144,147 161,840
Machinery and equipment, 99,768 121,210
Land 62,866 64,708
Leased assets, 1,987 2,108
Construction in progress 29,330 18,356
Other, 45,810 52,330
Total property, plant and equipment 383,912 420,554
Intangible assets 17,262 16,409
Investments and other assets
Investments in securities 14,167 15,488
Long-term loans 424 363
Deferred tax assets 52,711 41,611
Net defined benefit assets 1,444 317
Other 79,461 95,299
Allowance for doubtful receivables (710) (823)
Total investments and other assets 147,500 152,257
Total fixed assets 548,675 589,220
Total assets 1,554,430 1,662,283

17
Liabilities
Current liabilities
Trade payables 252,107 253,907
Electronically recorded obligations-operating 53,923 85,453
Short-term debt 190,757 122,338
Lease obligations, current 404 276
Income taxes payable 10,100 17,094
Deferred tax liabilities 442 442
Accrued bonuses 22,118 26,440
Provision for product warranties 10,535 11,480
Provision for losses on construction contracts 13,560 5,873
Advances from customers 137,598 171,607
Current portion of bonds - 20,000
Asset retirement obligations 49 15
Other 103,818 109,691
Total current liabilities 795,415 824,623
Long-term liabilities
Bonds payable 110,000 110,000
Long-term debt 141,343 159,749
Lease obligations 2,139 2,011
Deferred tax liabilities 6,630 8,199
Provision for loss on damages suit 395 -
Provision for environmental measures 3,669 2,535
Net defined benefit liability 97,048 79,272
Asset retirement obligations 487 464
Other 20,614 27,468
Total long-term liabilities 382,328 389,702
Total liabilities 1,177,744 1,214,326
Net assets
Shareholders’ equity
Common stock 104,484 104,484
Capital surplus 54,393 54,393
Retained earnings 217,449 253,605
Treasury stock (43) (67)
Total shareholders’ equity 376,284 412,416
Accumulated other comprehensive income
Net unrealized gains (losses) on securities, net of tax 2,652 3,704
Deferred gains (losses) on hedges (3,803) (1,985)
Foreign currency translation adjustments 6,416 25,179
Remeasurements of defined benefit plans (18,509) (7,318)
Total accumulated other comprehensive income (13,243) 19,579
Minority interests 13,645 15,961
Total net assets 376,686 447,957
Total liabilities and net assets 1,554,430 1,662,283
18
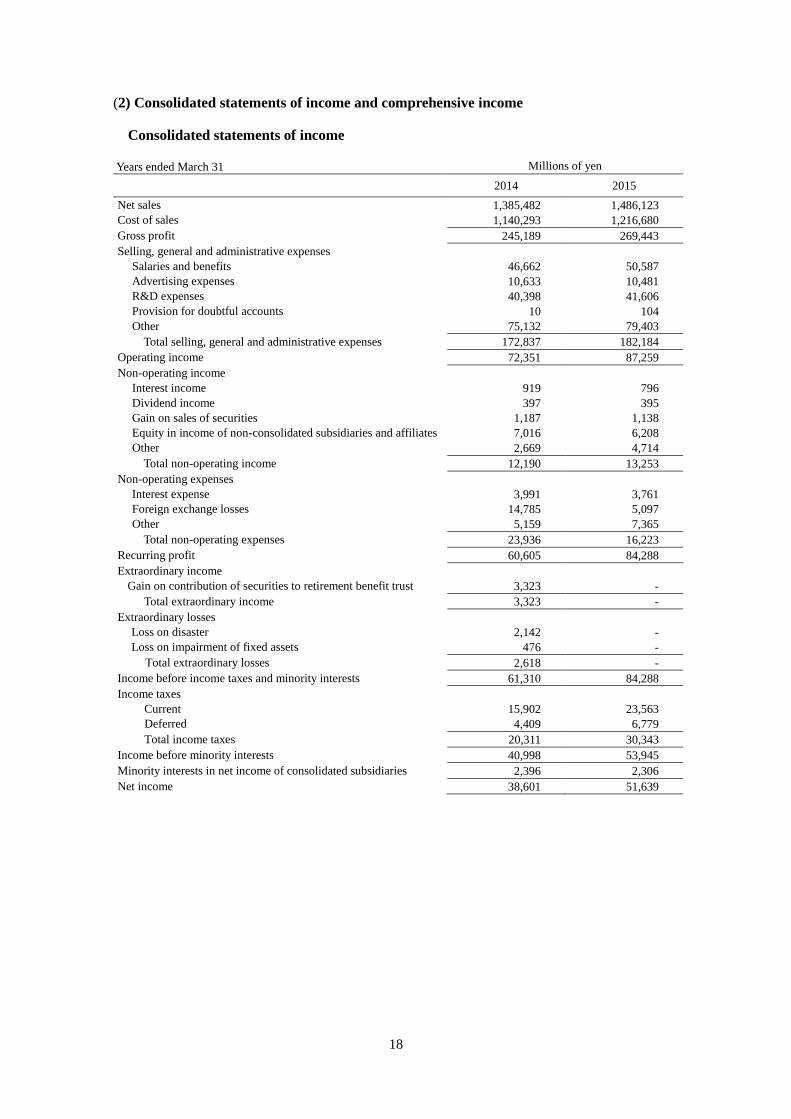
(2) Consolidated statements of income and comprehensive income
Consolidated statements of income
Years ended March 31 Millions of yen
2014 2015
Net sales 1,385,482 1,486,123
Cost of sales 1,140,293 1,216,680
Gross profit 245,189 269,443
Selling, general and administrative expenses
Salaries and benefits 46,662 50,587
Advertising expenses 10,633 10,481
R&D expenses 40,398 41,606
Provision for doubtful accounts 10 104
Other 75,132 79,403
Total selling, general and administrative expenses 172,837 182,184
Operating income 72,351 87,259
Non-operating income
Interest income 919 796
Dividend income 397 395
Gain on sales of securities 1,187 1,138
Equity in income of non-consolidated subsidiaries and affiliates 7,016 6,208
Other 2,669 4,714
Total non-operating income 12,190 13,253
Non-operating expenses
Interest expense 3,991 3,761
Foreign exchange losses 14,785 5,097
Other 5,159 7,365
Total non-operating expenses 23,936 16,223
Recurring profit 60,605 84,288
Extraordinary income
Gain on contribution of securities to retirement benefit trust 3,323 -
Total extraordinary income 3,323 -
Extraordinary losses
Loss on disaster 2,142 -
Loss on impairment of fixed assets 476 -
Total extraordinary losses 2,618 -
Income before income taxes and minority interests 61,310 84,288
Income taxes
Current 15,902 23,563
Deferred 4,409 6,779
Total income taxes 20,311 30,343
Income before minority interests 40,998 53,945
Minority interests in net income of consolidated subsidiaries 2,396 2,306
Net income 38,601 51,639
19
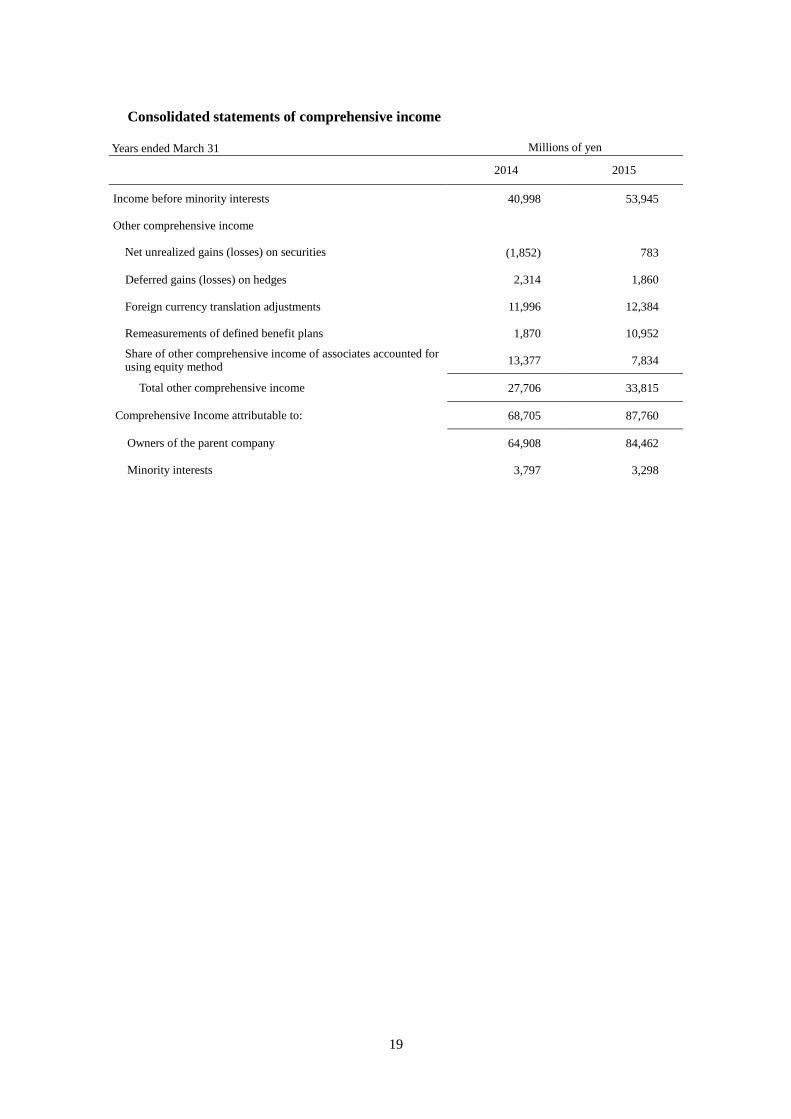
Consolidated statements of comprehensive income
Years ended March 31 Millions of yen
2014 2015
Income before minority interests 40,998 53,945
Other comprehensive income
Net unrealized gains (losses) on securities (1,852) 783
Deferred gains (losses) on hedges 2,314 1,860
Foreign currency translation adjustments 11,996 12,384
Remeasurements of defined benefit plans 1,870 10,952
Share of other comprehensive income of associates accounted for using equity method
13,377 7,834
Total other comprehensive income 27,706 33,815
Comprehensive Income attributable to: 68,705 87,760
Owners of the parent company 64,908 84,462
Minority interests 3,797 3,298
20
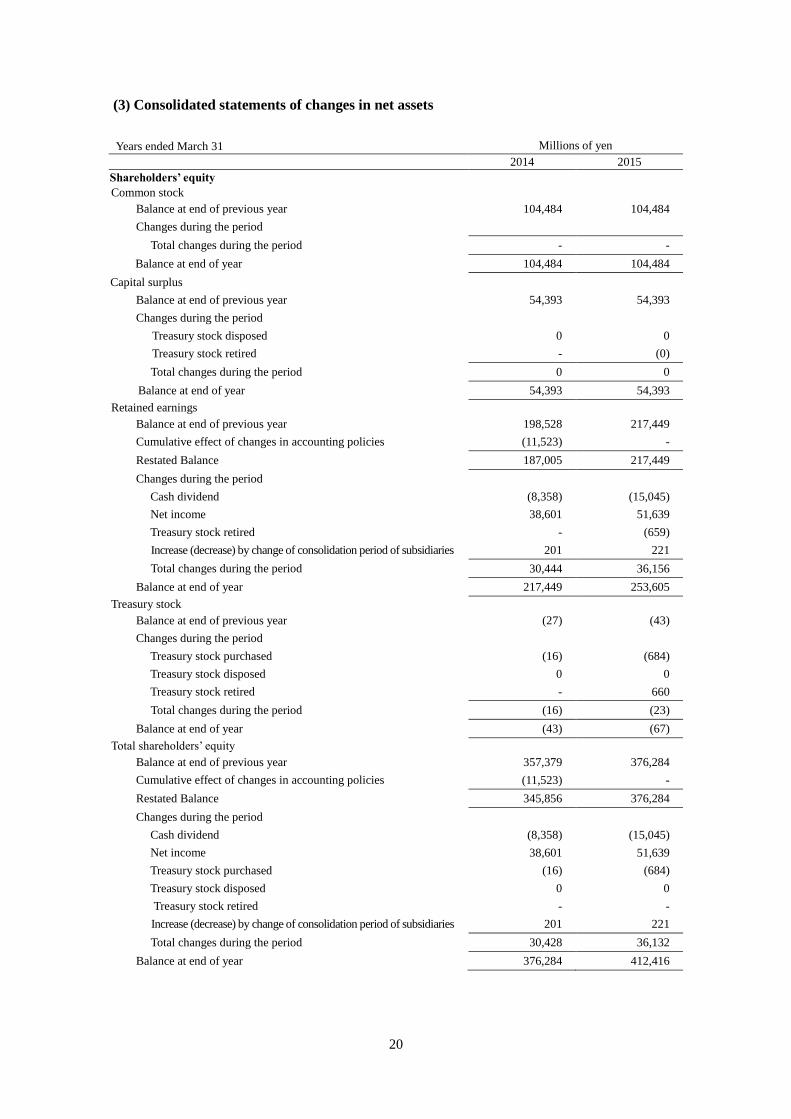
(3) Consolidated statements of changes in net assets
Years ended March 31 Millions of yen
2014 2015
Shareholders’ equity
Common stock
Balance at end of previous year 104,484 104,484
Changes during the period
Total changes during the period - -
Balance at end of year 104,484 104,484
Capital surplus
Balance at end of previous year 54,393 54,393
Changes during the period
Treasury stock disposed 0 0
Treasury stock retired - (0)
Total changes during the period 0 0
Balance at end of year 54,393 54,393
Retained earnings
Balance at end of previous year 198,528 217,449
Cumulative effect of changes in accounting policies (11,523) -
Restated Balance 187,005 217,449
Changes during the period
Cash dividend (8,358) (15,045)
Net income 38,601 51,639
Treasury stock retired - (659)
Increase (decrease) by change of consolidation period of subsidiaries 201 221
Total changes during the period 30,444 36,156
Balance at end of year 217,449 253,605
Treasury stock
Balance at end of previous year (27) (43)
Changes during the period
Treasury stock purchased (16) (684)
Treasury stock disposed 0 0
Treasury stock retired - 660
Total changes during the period (16) (23)
Balance at end of year (43) (67)
Total shareholders’ equity
Balance at end of previous year 357,379 376,284
Cumulative effect of changes in accounting policies (11,523) -
Restated Balance 345,856 376,284
Changes during the period
Cash dividend (8,358) (15,045)
Net income 38,601 51,639
Treasury stock purchased (16) (684)
Treasury stock disposed 0 0
Treasury stock retired - -
Increase (decrease) by change of consolidation period of subsidiaries 201 221
Total changes during the period 30,428 36,132
Balance at end of year 376,284 412,416

21
Comprehensive income
Net unrealized gain (loss) on securities
Balance at end of previous year 4,524 2,652
Changes during the period
Net changes in items other than shareholders’ equity (1,871) 1,051
Total changes during the period (1,871) 1,051
Balance at end of year 2,652 3,704
Deferred gains (losses) on hedges
Balance at end of previous year (5,998) (3,803)
Changes during the period
Net changes in items other than shareholders’ equity 2,195 1,818
Total changes during the period 2,195 1,818
Balance at end of year (3,803) (1,985)
Foreign currency translation adjustments
Balance at end of previous year (17,665) 6,416
Changes during the period
Net changes in items other than shareholders’ equity 24,081 18,762
Total changes during the period 24,081 18,762
Balance at end of year 6,416 25,179
Remeasurements of defined benefit plans
Balance at end of previous year - (18,509)
Cumulative effect of changes in accounting policies (20,410) -
Restated Balance (20,410) (18,509)
Changes during the period
Net changes in items other than shareholders’ equity 1,900 11,190
Total changes during the period 1,900 11,190
Balance at end of year (18,509) (7,318)
Total comprehensive income
Balance at end of previous year (19,139) (13,243)
Cumulative effect of changes in accounting policies (20,410) -
Restated Balance (39,549) (13,243)
Changes during the period
Net changes in items other than shareholders’ equity 26,306 32,822
Total changes during the period 26,306 32,822
Balance at end of year (13,243) 19,579
Minority interests
Balance at end of previous year 11,641 13,645
Changes during the period
Net changes in items other than shareholders’ equity 2,004 2,316
Total changes during the period 2,004 2,316
Balance at end of year 13,645 15,961
Total net assets
Balance at end of previous year 349,881 376,686
Cumulative effect of changes in accounting policies (31,933) -
Restated Balance 317,947 376,686
Changes during the period
Cash dividend (8,358) (15,045)
Net income for the year (loss) 38,601 51,639
Treasury stock purchased (16) (684)
Treasury stock disposed 0 0

22
Treasury stock retired - -
Increase (decrease) by change of consolidation period of subsidiaries 201 221
Net changes in items other than shareholders’ equity 28,310 35,139
Total changes during the period 58,738 71,271
Balance at end of year 376,686 447,957

23
(4) Consolidated statements of cash flows
Years ended March 31 Millions of yen
2014 2015
Cash flows from operating activities Income before income taxes and minority interests 61,310 84,288 Depreciation and amortization 37,838 44,572 Loss on impairment of fixed assets 476 - Increase (decrease) in net defined benefit liability (2,830) (2,521) Increase (decrease) in accrued bonuses 1,839 4,255 Increase (decrease) in allowance for doubtful receivables (129) (160) Increase (decrease) in provision for product warranties 4,117 666 Increase (decrease) in provision for losses on construction contracts (5,345) (7,957) Increase (decrease) in provision for losses on damages suit (102) (467) Increase (decrease) in provision for environmental measures (915) (1,134) Loss on disposal of inventories 1,339 1,966 (Gain) loss on sale of marketable and investment securities (1,187) (1,138) (Gain) loss on valuation of securities 619 52 (Gain) loss on sale of property, plant, and equipment 1,043 1,428 Equity in income non-consolidated subsidiaries and affiliates (7,016) (6,208) Interest and dividend income (1,317) (1,191) Interest expense 3,991 3,761 (Increase) decrease in trade receivables 17,750 630 (Increase) decrease in inventories (1,295) (22,583) (Increase) decrease in advance payments (6,927) (11,086) (Increase) decrease in other current assets 8,277 (623) Increase (decrease) in trade payables 20,059 28,933 Increase (decrease) in advances from customers 25,978 29,460 Increase (decrease) in other current liabilities 7,713 (62) Other 2,969 1,390
Subtotal 168,258 146,272
Cash received for interest and dividends 6,018 6,099 Cash paid for interest (4,210) (4,012) Cash paid for income taxes (18,345) (20,707)
Net cash provided by operating activities 151,721 127,651
Cash flows from investing activities Decrease (increase) in time deposits with maturities over three months (584) (1,276) Acquisition of property, plant and equipment (77,396) (73,917) Proceeds from sale of property, plant and equipment 2,212 11,890 Acquisition of intangible assets (2,778) (3,443) Proceeds from sale of intangible assets 595 23 Acquisition of investments in securities (610) (486) Proceeds from sale of investments in securities 2,695 1,470 Acquisition of investments in subsidiaries of affiliate (2,063) (1,261) Decrease (increase) in short-term loans receivable 196 (1,164) Additions to long-term loans receivable (64) (63) Proceeds from collection of long-term loans receivable 84 141 Other 152 690
Net cash used for investing activities (77,559) (67,397)
Cash flows from financing activities Increase (decrease) in short-term debt, net (64,139) (16,587) Proceeds from long-term debt 40,430 42,456 Repayment of long-term debt (58,749) (86,233) Proceeds from issuance of bonds 40,000 20,000 Redemption of bonds payable (10,000) - Acquisition of treasury stock (17) (25) Proceeds from stock issuance to minority shareholders - 1 Cash dividends paid (8,363) (15,675) Cash dividends paid to minority shareholders (1,532) (986) Other (132) (83)
Net cash used for financing activities (62,505) (57,133)
Effect of exchange rate changes (4,001) (953)
Net increase (decrease) in cash and cash equivalents 7,655 2,167
Cash and cash equivalents at beginning of period 36,971 45,431 Increase (decrease) in cash and cash equivalents by change of consolidation period of subsidiaries
804 122
Cash and cash equivalents at end of period 45,431 47,721

24
(5) Notes on financial statements
Notes on the going-concern assumption
Not applicable
Basis of preparation of financial statements
Other than information disclosed under the heading “Changes in basis of preparation of financial
statements” below, no material changes have been made from the information disclosed in the
Company’s most recent full-year statutory financial report (filed June 26, 2014). An updated
disclosure is therefore omitted here.
Changes in basis of preparation of financial statements
1. Change in the scope of consolidation
(1) Change in the scope of consolidation
Two companies were added as consolidated subsidiaries because they were newly established
by the Company.
One company ceased to be consolidated subsidiaries as they were completed of liquidation .
(2) Number of consolidated subsidiaries after change
97 companies
2. Change in application of the equity method
(1) Non-consolidated subsidiaries which are accounted for under the equity method
None
(2) Associated companies which are accounted for under the equity method
(i) Change in associated companies which are accounted for under the equity method
One company was removed from the use of the equity method due to the sale of shares in said
company.
(ii) Number of associated companies accounted for under the equity method after change
17 companies
Additional Information
Not applicable
Consolidated balance sheets
Fiscal year ended March 31, 2015 (As of March 31, 2015)
Information is omitted here as its disclosure in this report is not of material importance.
Consolidated Statements of Income
Fiscal year ended March 31, 2015 (April 1, 2014 – March 31, 2015)
Information is omitted here as its disclosure in this report is not of material importance.
Information Omitted
Notes on the unapplied accounting policies, consolidated statements of comprehensive income,
consolidated statements of changes in shareholders’ equity, the consolidated cash flow statements,
lease transactions, related-party transactions, tax-effect accounting, financial instruments, securities,

25
derivative transactions, retirement benefits, stock-based compensation, business combination, asset
retirement obligations, investment and rental property are omitted here, as their disclosure in this
report is not of material importance.
Segment information and others
1. Segment information
(1) Overview of reportable segments
The Company’s reportable segments are components of the company about which separate
financial information is available. These segments are subject to periodic reviews by the
Company’s board of directors to decide how to allocate resources and assess performance. The
Company’s operations are divided into internal companies based on product categories. Certain
authority is delegated to each of the internal companies, based on which they conduct businesses
in Japan and overseas. The Company’s operations are therefore segmented based on each internal
company’s product categories. The Company’s eight reportable segments are the Ship & Offshore
Structure segment, the Rolling Stock segment, the Aerospace segment, the Gas Turbine &
Machinery segment, the Plant & Infrastructure segment, the Motorcycle & Engine segment, the
Precision Machinery segment, and the Other segment.
Main segment businesses are listed below.
Industry segment Major products
Ship & Offshore Structure
Construction and sale of ships and other vessels, etc.
Rolling Stock Production and sale of rolling stock, snow plows, etc.
Aerospace Production and sale of aircraft, etc.
Gas Turbines & Machinery
Production and sale of jet engines, general-purpose gas turbine
generators, prime movers, etc.
Plant & Infrastructure Production and sale of industrial equipment, boilers, environmental
equipment, steel structures, crushers, etc.
Motorcycle & Engine
Production and sale of motorcycles, all-terrain vehicles (ATV), utility
vehicles, personal watercraft (“JET SKI”), general-purpose gasoline
engines, etc.
Precision Machinery Production and sale of industrial hydraulic products, industrial robots, etc.
Other
Production and sale of construction machinery, commercial activities,
sales/order agency and intermediary activities, administration of welfare
facilities, etc. (2) Calculation methods for sales, income (loss), assets, liabilities and other items by reportable segment
Accounting methods applied for calculation of sales, income (loss), assets, liabilities, and other
items by industry segment largely correspond to information presented under “Basis of
preparation of financial statements” on page 24. Segment income is based on operating income.
Intersegment sales or transfers are based on market prices.

26
(3) Sales, income (loss), assets, liabilities, and other items by reportable segment
Fiscal year ended March 31, 2014 (April 1, 2013 – March 31, 2014) (Millions of yen)
Sales
Segment income (loss)
Segment assets
Other items
External sales Intersegment
sales or transfer
Total Depreciation/amortization
Loss on impairment
of fixed assets
Investment in equity- method
affiliates
Increase in property, plant and equipment and intangibles
Ship & Offshore
Structure 80,863 1,776 82,640 (2,006) 129,542 755 - 49,089 1,532
Rolling Stock 147,951 5,821 153,772 7,572 159,363 2,630 - 125 5,490
Aerospace 280,737 2,537 283,274 26,254 348,608 9,937 - - 25,699
Gas Turbines
& Machinery 189,241 16,922 206,164 10,486 279,356 3,155 - 1,424 8,300
Plant &
Infrastructure 103,898 15,639 119,537 6,312 109,878 1,297 476 15,234 2,424
Motorcycle &
Engine 322,248 794 323,042 16,100 252,933 10,241 - 1,099 17,250
Precision
Machinery 123,276 13,567 136,844 10,415 124,989 4,435 - 6 7,734
Other
Operations 137,264 33,016 170,280 4,481 120,529 2,078 - 2,717 4,236
Total 1,385,482 90,075 1,475,557 79,616 1,525,202 34,531 476 69,697 72,670
Adjustments - (90,075) (90,075) (7,264) 29,227 3,306 - - 15,055
Consolidated
total 1,385,482 - 1,385,482 72,351 1,554,430 37,838 476 69,697 87,726
Fiscal year ended March 31, 2015 (April 1, 2014 – March 31, 2015) (Millions of yen)
Sales
Segment income (loss)
Segment assets
Other items
External sales Intersegment
sales or transfer
Total Depreciation/ amortization
Investment in equity-
method affiliates
Increase in property, plant and equipment and intangibles
Ship & Offshore
Structure 90,327 3,289 93,616 2,675 171,736 805 56,749 3,317
Rolling Stock 121,519 3,736 125,256 6,044 169,469 2,837 144 3,256
Aerospace 325,083 2,160 327,244 36,318 363,417 10,823 - 34,780
Gas Turbines
& Machinery 218,794 17,637 236,432 11,269 296,359 3,913 1,436 7,053
Plant &
Infrastructure 121,113 18,859 139,973 6,574 124,938 1,345 17,306 2,293
Motorcycle &
Engine 329,240 808 330,048 14,923 271,746 13,245 1,212 15,788
Precision
Machinery 135,782 14,423 150,205 10,908 134,868 5,162 7 6,175
Other
Operations 144,261 40,952 185,213 3,986 101,982 2,222 2,861 2,169
Total 1,486,123 101,866 1,587,990 92,701 1,634,518 40,356 79,719 74,835
Adjustments - (101,866) (101,866) (5,442) 27,765 4,216 - 5,260
Consolidated
total 1,486,123 - 1,486,123 87,259 1,662,283 44,572 79,719 80,096

27
(4) Reconciliation and main components of difference between total for reportable segments and
amounts on the consolidated financial statements Fiscal year ended March 31 (Millions of yen)
Sales 2014 2015
Total for reportable segments 1,475,557 1,587,990
Intersegment transactions (90,075) (101,866)
Net sales reported on the consolidated
financial statements 1,385,482 1,486,123
Fiscal year ended March 31 (Millions of yen)
Income 2014 2015
Total for reportable segments 79,616 92,701
Intersegment transactions (79) (1,042)
Corporate expenses* (7,185) (4,399)
Operating income (loss) on consolidated
financial statements 72,351 87,259
*Note: Corporate expenses mainly comprise general and administrative expenses not attributed to
reportable segments.
Fiscal year ended March 31 (Millions of yen)
Assets 2014 2015
Total for reportable segments 1,525,202 1,634,518
Corporate assets shared by all segments* 129,822 117,990
Intersegment transactions etc. (100,595) (90,225)
Total assets on consolidated financial
statements 1,554,430 1,662,283
*Note: Corporate assets shared by all segments mainly comprise fixed assets not attributed to reportable
segments.
Fiscal year ended March 31 (Millions of yen)
Other items
Total for reportable segments
Adjustments* Amounts reported on
the consolidated financial statements
2014 2015 2014 2015 2014 2015
Depreciation/amortization 34,531 40,356 3,306 4,216 37,838 44,572
Increase in property, plant and equipment and
intangibles 72,670 74,835 15,055 5,260 87,726 80,096
*Note: Adjustments are mainly due to fixed assets not attributed to reportable segments.

28
Related information
Fiscal year ended March 31, 2014 (April 1, 2013 – March 31, 2014)
1. Information by product and service
Information by product and service is omitted here as segmentation is equivalent to that used for
reportable segments.
2. Information by geographic area
(a) Net sales
(Millions of yen)
Japan USA Europe Asia Other areas Total
605,328 326,337 101,381 240,221 112,212 1,385,482
Note: Net sales are classified by country or region based on the location of customers.
(b) Property, plant and equipment
(Millions of yen)
Japan North
America Europe Asia Other areas Total
324,502 26,059 3,704 28,363 1,281 383,912
3. Information by major clients
(Millions of yen)
Clients Net sales Related segments
Ministry of Defense 197,640 Ship & Offshore Structure, Aerospace, Gas Turbines & Machinery
Fiscal year ended March 31, 2015 (April 1, 2014 – March 31, 2015)
1. Information by product and service
Information by product and service is omitted here as segmentation is equivalent to that used for
reportable segments.
2. Information by geographic area
(a) Net sales
(Millions of yen)
Japan USA Europe Asia Other areas Total
631,018 356,806 115,145 252,371 130,782 1,486,123
Note: Net sales are classified by country or region based on the location of customers.

29
(b) Property, plant and equipment
(Millions of yen)
Japan North
America Europe Asia Other areas Total
358,868 24,048 3,794 32,792 1,051 420,554
3. Information by major clients
(Millions of yen)
Clients Net sales Related segments
Ministry of Defense 220,745 Ship & Offshore Structure, Aerospace, Gas Turbines & Machinery
Impairment loss on fixed assets by reportable segment
Fiscal year ended March 31, 2014 (April 1, 2013 – March 31, 2014)
Information is omitted here as it is equivalent to that stated in “1. Segment information”.
Fiscal year ended March 31, 2015 (April 1, 2014 – March 31, 2015)
Not applicable.
Amortization amount for and unamortized balance of goodwill
Fiscal year ended March 31, 2014 (April 1, 2013 – March 31, 2014)
Not applicable.
Fiscal year ended March 31, 2015 (April 1, 2014 – March 31, 2015)
Not applicable.
Gain on negative goodwill by reportable segment
Fiscal year ended March 31, 2014 (April 1, 2013 – March 31, 2014)
Not applicable.
Fiscal year ended March 31, 2015 (April 1, 2014 – March 31, 2015)
Not applicable.
Per share data
Years ended March 31 (Yen)
2014 2015
Net assets per share 217.16 Net assets per share 258.58
Earnings per share - basic 23.09 Earnings per share - basic 30.89
Notes:
1. Diluted net earnings per share is not stated because there are no potential shares.
2. Net assets per share were calculated based on the following:
March31 (Millions of yen)
2014 2015
Total net assets 376,686 447,957
Amounts excluded from total net assets 13,645 15,961
Of which: minority interest (13,645) (15,961)
Net assets attributable to the common shares 363,041 431,996
Number of common shares used to compute net assets per
share (Thousands of shares) 1,671,750 1,670,613

30
3. Net income/loss per share and net income per share (diluted) were calculated based on the following:
Years ended March 31 (Millions of yen)
2014 2015
Earnings per share - basic
Net income 38,601 51,639
Earnings not attributable to common shareholders - -
Net income allocated to the common shares 38,601 51,639
Average number of common shares outstanding (thousands of shares) 1,671,770 1,671,637
Material subsequent events
Not applicable

31
6. Others
(1) Corporate officer changes
Refer to the Company’s press release on March 31, 2015, titled “New Directors and Corporate
Auditor to be Nominated.”
(2) Consolidated orders and sales
Orders received
Years ended March 31 (Millions of yen)
2014(A) 2015(B) Change(B-A)
% of total % of total %
Ship & Offshore Structure 117,872 8.0 179,221 10.4 61,348 52.0 Rolling Stock 133,049 9.1 131,428 7.6 (1,620) (1.2)
Aerospace 286,383 19.6 357,031 20.8 70,648 24.6
Gas Turbine & Machinery 222,013 15.2 235,722 13.7 13,708 6.1
Plant & Infrastructure 103,912 7.1 203,473 11.8 99,560 95.8
Motorcycle & Engine 322,248 22.1 329,240 19.2 6,991 2.1
Precision Machinery 127,297 8.7 136,286 7.9 8,989 7.0 Other 142,684 9.8 140,558 8.2 (2,125) (1.4)
Total 1,455,462 100.0 1,712,963 100.0 257,500 17.6
Note: The Motorcycle & Engine segment’s orders received are equal to its net sales as production is based mainly
on estimated demand.
Net sales
Years ended March 31 (Millions of yen)
2014(A) 2015(B) Change(B-A)
% of total % of total %
Ship & Offshore Structure 80,863 5.8 90,327 6.0 9,463 11.7
Rolling Stock 147,951 10.6 121,519 8.1 (26,431) (17.8)
Aerospace 280,737 20.2 325,083 21.8 44,346 15.7 Gas Turbine & Machinery 189,241 13.6 218,794 14.7 29,553 15.6
Plant & Infrastructure 103,898 7.4 121,113 8.1 17,215 16.5
Motorcycle & Engine 322,248 23.2 329,240 22.1 6,991 2.1
Precision Machinery 123,276 8.8 135,782 9.1 12,505 10.1
Other 137,264 9.9 144,261 9.7 6,996 5.0
Total 1,385,482 100.0 1,486,123 100.0 100,641 7.2
Order backlog
Years ended March 31 (Millions of yen)
2014(A) 2015(B) Change(B-A)
% of total % of total %
Ship & Offshore Structure 161,134 10.7 264,281 14.6 103,146 64.0
Rolling Stock 364,654 24.3 405,999 22.4 41,344 11.3
Aerospace 450,581 30.0 488,431 27.0 37,850 8.4
Gas Turbine & Machinery 295,100 19.6 336,441 18.6 41,341 14.0
Plant & Infrastructure 170,737 11.3 255,522 14.1 84,785 49.6 Motorcycle & Engine - - - - - -
Precision Machinery 25,821 1.7 26,325 1.4 504 1.9
Other 32,234 2.1 28,531 1.5 (3,702) (11.4)
Total 1,500,264 100.0 1,805,533 100.0 305,269 20.3

32
(3) Supplementary information on earnings forecasts for the fiscal year ending March 31, 2016
1. Consolidated earnings outlook
(Billions of yen)
Outlook for the fiscal year
ending March 31, 2016 (A)
Fiscal year ended March 31, 2015(actual)
(B) Change (A – B)
Net sales 1,650.0 1,486.1 163.9 Operating income 102.0 87.2 14.8 Recurring profit 100.0 84.2 15.8 Net income 69.0 51.6 17.4 Orders received 1,680.0 1,712.9 (32.9) Before-tax ROIC (%) 11.8% 10.4% 1.4% R&D expenses 46.0 41.6 4.4 Capital expenditures 92.0 80.0 12.0 Depreciation/ amortization 54.0 44.5 9.5 Number of employees at end of period *Number of employees outside of Japan included therein
35,400
*9,200
35,471
*9,452
(71)
*(252)
Notes: 1. Outlook’s assumed foreign exchange rates: ¥118 = US$1, ¥128 = 1 euro
2. Before-tax ROIC = (income before income taxes + interest expense) / invested capital.
3. Capital expenditures represent the total of newly recorded property, plant and equipment and
newly recorded intangible assets. Depreciation/amortization represents depreciation/amortization
expenses for property, plant and equipment and intangible assets.
2. Outlook by reportable segment
(a) Net sales and operating income (loss)
(Billions of yen)
Outlook for the fiscal year ending March 31, 2016
(A)
Fiscal year ended March 31, 2015 (actual)
(B) Change (A – B)
Net sales Operating
Income (loss) Net sales
Operating
Income (loss) Net sales
Operating
Income (loss)
Ship & Offshore Structure 105.0 3.0 90.3 2.6 14.7 0.4 Rolling Stock 180.0 11.0 121.5 6.0 58.5 5.0 Aerospace 360.0 41.0 325.0 36.3 35.0 4.7 Gas Turbine & Machinery 260.0 16.0 218.7 11.2 41.3 4.8 Plant & Infrastructure 125.0 6.0 121.1 6.5 3.9 (0.5) Motorcycle & Engine 350.0 15.5 329.2 14.9 20.8 0.6 Precision Machinery 150.0 11.5 135.7 10.9 14.3 0.6 Other 120.0 3.0 144.2 3.9 (24.2) (0.9) Adjustments (5.0) (5.4) 0.4
Total 1,650.0 102.0 1,486.1 87.2 163.9 14.8

33
(b) Orders received
(Billions of yen) Outlook for the fiscal year
ending March 31, 2016 (A)
Fiscal year ended March 31, 2015 (actual)
(B) Change (A – B)
Ship & Offshore Structure 120.0 179.2 (59.2) Rolling Stock 160.0 131.4 28.6 Aerospace 440.0 357.0 83.0 Gas Turbine & Machinery 250.0 235.7 14.3 Plant & Infrastructure 100.0 203.4 (103.4) Motorcycle & Engine 350.0 329.2 20.8 Precision Machinery 155.0 136.2 18.8 Other 105.0 140.5 (35.5) Total 1,680.0 1,712.9 (32.9)
(c) Before-tax ROIC
(%) Outlook for the fiscal year
ending March 31, 2016 (A)
Fiscal year ended March 31, 2015 (actual)
(B) Change (A – B)
Ship & Offshore Structure 5.4 6.0 (0.6) Rolling Stock 12.5 8.7 3.8 Aerospace 29.0 35.1 (6.1) Gas Turbine & Machinery 8.6 5.7 2.9 Plant & Infrastructure 12.6 14.3 (1.7) Motorcycle & Engine 12.0 7.3 4.7 Precision Machinery 12.9 16.7 (3.8) Total 11.8 10.4 1.4


![Kawasaki Robot K series · Kawasaki Robot K series] ... Kawasaki Robotics (USA), Inc. Kawasaki Robot Corporate Headquarters for Americas ... Japan & Asia ] 3 Combination of](https://img.pdfslide.us/doc/110x75/5b52f2687f8b9a056a8df79c/kawasaki-robot-k-series-kawasaki-robot-k-series-kawasaki-robotics-usa.jpg)