Embed Size (px)
Citation preview
Final Recommendations for the Potentially Avoidable Utilization Savings Policy
Final Recommendation for the Potentially Avoidable Utilization Savings Policy for Rate Year 2018
June 14, 2017
Health Services Cost Review Commission
4160 Patterson AvenueBaltimore, Maryland 21215
(410) 764-2605FAX: (410) 358-6217
Table of ContentsList of Abbreviations.............................................................................................................1
Introduction............................................................................................................................2
Background............................................................................................................................2
Exemption from CMS Quality-Based Payment Programs..............................................4
Assessment.............................................................................................................................4
Potentially Avoidable Utilization Performance...............................................................4
Proposed Required Revenue Reduction...........................................................................5
Hospital Protections.........................................................................................................6
Future Expansion of PAU................................................................................................6
Recommendations..................................................................................................................7
Appendix I. Analysis of PQI Trends......................................................................................8
Appendix II. Percent of Revenue in PAU by Hospital..........................................................9
Appendix III. Modeling Results Proposed PAU Savings Policy Reductions for RY 2018. .12

Final Recommendations for the Potentially Avoidable Utilization Savings Policy
LIST OF ABBREVIATIONS
ADI Area deprivation index
ARR Admission-Readmission Revenue Program
CMS Centers for Medicare & Medicaid Services
CY Calendar year
DRG Diagnosis-related group
ECMAD Equivalent case-mix adjusted discharge
FFY Federal fiscal year
FY Fiscal year
GBR Global budget revenue
HRRP Hospital Readmissions Reduction Program
HSCRC Health Services Cost Review Commission
IPPS Inpatient prospective payment system
PAU Potentially avoidable utilization
PQI Prevention quality indicators
RRIP Readmissions Reduction Incentive Program
RY Rate year
SOI Severity of Illness
TPR Total patient revenue
1

Final Recommendations for the Potentially Avoidable Utilization Savings Policy
INTRODUCTION
The Maryland Health Services Cost Review Commission (HSCRC or Commission) operates a potentially avoidable utilization (PAU) savings policy as part of its portfolio of value-based payment policies. This policy was formerly known as the readmission shared savings policy, but its name changed to account for the expanded definition of avoidable utilization. The PAU savings policy is an important tool to maintain hospitals’ focus on improving patient care and health through reducing PAU and its associated costs. The PAU savings policy is also important for maintaining Maryland’s exemption from the Centers for Medicare & Medicaid Services (CMS) quality-based payment programs, as this exemption allows the state to operate its own programs on an all-payer basis.
In this recommendation, staff is proposing to continue the PAU methodology used in rate year 2017, to increase the level of savings derived from the policy, and to specify the calculations and application of the policy in conjunction with the state fiscal year (FY) 2018 update. The purpose of this report is to present background information and supporting analyses for the PAU savings recommendation for rate year (RY) 2018.
BACKGROUND
The United States ranks behind most countries on many measures of health outcomes, quality, and efficiency. Physicians face particular difficulties in receiving timely information, coordinating care, and dealing with administrative burden. Enhancements in chronic care— with a focus on prevention and treatment in the office, home, and long-term care settings—are essential to improving indicators of healthy lives and health equity. As a consequence of inadequate chronic care and care coordination, the healthcare system currently experiences an unacceptably high rate of preventable hospital admissions and readmissions. Maryland’s new All-Payer Model was approved by CMS effective January 1, 2014. This Model aims to demonstrate that an all-payer system with accountability for the total cost of hospital care is an effective model for advancing better care, better health, and reduced costs.
HSCRC, together with stakeholders, has adapted and developed a series of policies and initiatives to improve care and care coordination, with a particular focus on reducing PAU.
Under the state’s previous Medicare waiver, the Commission approved a savings policy on May 1, 2013, which reduced hospital revenues based on case-mix adjusted readmission rates using specifications set forth in the HSCRC’s Admission-Readmission Revenue (ARR) Program.1 Nearly all hospitals in the state participated in the ARR program, which incorporated 30-day readmissions into a hospital episode rate per case, or in the Total Patient Revenue (TPR) system, a global budget for more rural hospital settings. With the implementation of the ARR and the advent of global budgets, the HSCRC created a Savings policy to ensure that payers received savings that would be similar to those that would have been expected from the federal Medicare 1 A readmission is an admission to a hospital within a specified time period after a discharge from the same or another hospital.
2

Final Recommendations for the Potentially Avoidable Utilization Savings Policy
HRRP. Unlike the federal Hospital Readmissions Reduction Program (HRRP) which provides savings to payers by avoiding readmissions, the Maryland system “locks in” those savings into the hospital budget, so a separate savings policy is necessary. Under the new All-Payer Model, the Commission continued to use the savings adjustment to ensure a focus on reducing readmissions, to ensure savings to purchasers, and to meet the exemption requirements for “revenue at-risk” under Maryland’s value-based programs.
For RYs 2014 and 2015, the HSCRC calculated a case-mix adjusted readmission rate based on ARR specifications for each hospital for the previous calendar year.2,3 The statewide savings percentage was converted to a required reduction in readmission rates, and each hospital’s contribution to savings was determined by its case-mix adjusted readmission rates. Based on 0.20 percent annual savings, the total reduction percentage was 0.40 percent of total revenue in RY 2015.
In RY 2016, the HSCRC updated the methodology for calculating the savings reduction to use the case-mix adjusted readmission rate based on the specifications for the Readmissions Reduction Incentive Program (RRIP).4 Based on 0.20 percent annual savings, the total reduction percentage was 0.60 percent of total revenue in RY 2016.
In RY 2017, the Commission expanded the savings policy to align the measure with the potentially avoidable utilization (PAU) definition used in the market shift adjustment, incorporating readmissions, as well as admissions for ambulatory care sensitive conditions as measured by the Agency for Health Care Research and Quality’s Prevention Quality Indicators (PQIs).5 Aligning the readmissions measure with the PAU definition changed the focus of the readmissions measure from “sending” hospitals to “receiving” hospitals. In other words, the updated PAU methodology calculated the percentage of revenue associated with readmissions that occur at the hospital, regardless of where the original (index) admission occurred. Assigning readmissions to the receiving hospital should incentivize hospitals to work within their service areas to reduce readmissions, regardless of where the index stay took place. Additionally, the savings associated with readmission reductions will accrue to the receiving hospital. Finally, aligning the readmission measure with the PAU definition enabled the measure to include observation stays that are longer than 23 hours in the calculation of both readmissions and PQIs. In RY 2017, the Commission increased the total reduction percentage to 1.25% of total revenue.
Exemption from CMS Quality-Based Payment Programs
Section 3025 of the Affordable Care Act established the federal Medicare Hospital Readmission Reduction Program in federal fiscal year (FFY) 2013, which requires the Secretary of the U.S. 2 Only same-hospital readmissions were counted, and stays of one day or less and planned admissions were excluded.3 The case-mix adjustment was based on a total of observed readmissions vs. expected readmissions, which is calculated using the statewide average readmission rate for each diagnosis-related group (DRG) severity of illness (SOI) cell and aggregated for each hospital.4 This measures 30-day all-cause, all hospital readmissions with planned admission and other exclusions.5 PQIs measure inpatient admissions for ambulatory care sensitive conditions. For more information on these measures, see http://www.qualityindicators.ahrq.gov/modules/pqi_overview.aspx .
3

Final Recommendations for the Potentially Avoidable Utilization Savings Policy
Department of Health and Human Services to reduce payments to inpatient prospective payment system (IPPS) hospitals with excess readmissions for patients in fee-for-service Medicare.6,7 According to the IPPS rule published for FFY 2015, the Secretary is authorized to exempt Maryland hospitals from the Medicare Hospital Readmissions Reduction Program if Maryland submits an annual report describing how a similar program in the State achieves or surpasses the nationally measured results for patient health outcomes and cost savings under the Medicare program. As mentioned in other HSCRC quality-based payment recommendations reports, the new All-Payer Model changed the criteria for maintaining exemptions from the CMS programs. As part of the new All-Payer Model Agreement, the aggregate amount of revenue at-risk in Maryland quality/performance-based payment programs must be equal to or greater than the aggregate amount of revenue at-risk in the CMS Medicare quality programs. The PAU savings adjustment is one of the performance-based programs used for this comparison. In contrast to HSCRC’s other quality programs that reward or penalize hospitals based on performance, the PAU Savings policy is intentionally designed to assure savings to payers.
ASSESSMENT
A central focus of the new All-Payer Model is the reduction of PAU through improved care coordination and enhanced community-based care. While hospitals have achieved significant progress in transforming the delivery system to date, there needs to be a continued emphasis on care coordination, improving quality of care, and providing care management for complex and high-needs patients. For this reason, staff suggests that the HSCRC continue to focus the savings program on PAU, defined to include both readmissions and PQIs.
Potentially Avoidable Utilization
Calendar year (CY) 2017 trends indicate that readmission improvement is accelerating, while progress in reducing PQIs remains limited. Figure 1 below shows trends in readmissions and PQIs since CY 2013. While the CY 2016 equivalent case-mix adjusted readmission discharges (ECMADs) declined by 5.08 percent over CY 2013, PQIs declined by 0.97 percent, which was preceded by a 0.68 percent PQI increase in CY 2015. Appendix I shows more detailed information on specific PQI trends. PQI trends between CY 2015 and CY 2016 should be interpreted with caution due to differences in PQI logic because of ICD-10 implementation.
6 Patient Protection and Affordable Care Act, 124 Stat. 119 (2010) (codified as amended at 42 U.S.C. § 1395ww(q) (Supp. 2010)).7 For more information on this program, see https://www.cms.gov/Medicare/Medicare-Fee-for-Service-Payment/AcuteInpatientPPS/Readmissions-Reduction-Program.html.
4

Final Recommendations for the Potentially Avoidable Utilization Savings Policy
Figure 1. Changes in Maryland’s Readmission and PQI Rates over CY 2013
2014 2015 2016
-6.00%
-5.00%
-4.00%
-3.00%
-2.00%
-1.00%
0.00%
1.00%
2.00%
-1.77%
0.68%
-0.97%
-3.50%
-4.82% -5.08%
% Change from CY2013 ECMADs
PQI Readmission
Proposed Required Revenue Reduction
HSCRC staff proposes to adjust the annual savings amount from last year’s annual reduction of 0.65% to an annual reduction of 0.20%, which will result in a statewide PAU savings adjustment
Figure 2. Proposed RY 2018 Statewide SavingsEstimated PAU Revenue Formula ValueRY 2017 Total Approved Permanent Revenue A $15.8 billion Total RY18 PAU % B 10.86%*Total RY18 PAU $ (Eligible Savings) C $1.7 billion
Statewide Savings Calculations Formula Total Last year NetProposed RY 2018 Revenue Adjustment % D -1.45% -1.25% -0.20%Proposed RY 2018 Revenue Adjustment $ (Expected Savings) E=A*D -$228.4
million** -$194.4 million -$34.0 million
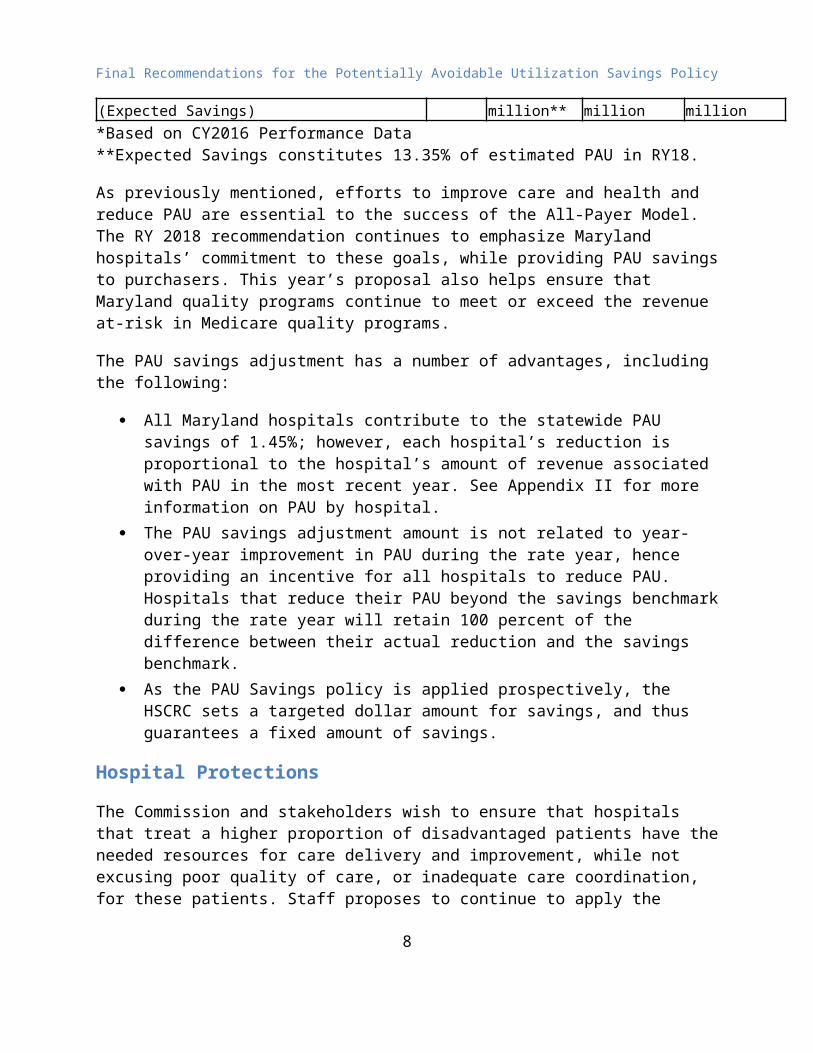
*Based on CY2016 Performance Data**Expected Savings constitutes 13.35% of estimated PAU in RY18.
As previously mentioned, efforts to improve care and health and reduce PAU are essential to the success of the All-Payer Model. The RY 2018 recommendation continues to emphasize Maryland hospitals’ commitment to these goals, while providing PAU savings to purchasers. This year’s proposal also helps ensure that Maryland quality programs continue to meet or exceed the revenue at-risk in Medicare quality programs.
5

Final Recommendations for the Potentially Avoidable Utilization Savings Policy
The PAU savings adjustment has a number of advantages, including the following:
All Maryland hospitals contribute to the statewide PAU savings of 1.45%; however, each hospital’s reduction is proportional to the hospital’s amount of revenue associated with PAU in the most recent year. See Appendix II for more information on PAU by hospital.
The PAU savings adjustment amount is not related to year-over-year improvement in PAU during the rate year, hence providing an incentive for all hospitals to reduce PAU. Hospitals that reduce their PAU beyond the savings benchmark during the rate year will retain 100 percent of the difference between their actual reduction and the savings benchmark.
As the PAU Savings policy is applied prospectively, the HSCRC sets a targeted dollar amount for savings, and thus guarantees a fixed amount of savings.
Hospital Protections
The Commission and stakeholders wish to ensure that hospitals that treat a higher proportion of disadvantaged patients have the needed resources for care delivery and improvement, while not excusing poor quality of care, or inadequate care coordination, for these patients. Staff proposes to continue to apply the methodology used in last year’s PAU Savings Policy and to cap the PAU savings contributions at the state average if a hospital has a high proportion of disadvantaged populations. The measure includes the percentage of Medicaid and Self-pay or Charity ECMADs for inpatient and observation cases with 23 hours or longer stays, with protection provided to those hospitals in the top quartile. For RY 2019, HSCRC staff is developing risk-adjustment approaches for measuring hospital PAU revenue with Commission contractor Mathematica Policy Research.
Appendix III provides the results of the PAU savings policy based on the proposed 0.20 percent annual (1.45 percent total) reduction in total patient revenues with and without these protections.
Comments Received on Proposed Savings Policy Recommendation
The Maryland Hospital Association (MHA) submitted a comment letter on 5/15/17 (Appendix IV) expressing concern with the use of Prevention Quality Indicators (PQIs). HSCRC staff has examined the issue and determined that PQI software is used in multiple payment programs, such as the CMS Physician Value-Based Modifier8, ACO quality metrics9, and Medicaid Adult Core Measures Set10. However, HSCRC staff does recognize that the denominator used with PQIs varies among the programs. The PAU Savings Policy uses revenue as the PQI denominator, rather than an attribution-based denominator used in other programs. For the purposes of the PAU Savings Policy, the HSCRC staff believes that the use of PQIs with a denominator of total approved revenue is appropriate. The Savings Policy indicates the Commission’s focus for the 8 https://www.cms.gov/Medicare/Medicare-Fee-for-Service-Payment/PhysicianFeedbackProgram/Downloads/2015-ACSC-MIF.pdf9 https://www.cms.gov/Medicare/Medicare-Fee-for-Service-Payment/sharedsavingsprogram/Downloads/2017-Reporting-Year-Narrative-Specifications.pdf10 https://www.medicaid.gov/medicaid/quality-of-care/downloads/2017-adult-core-set.pdf
6

Final Recommendations for the Potentially Avoidable Utilization Savings Policy
upcoming year, but allows hospitals to generate savings through other reductions in avoidable utilization. If hospitals exceed their PAU savings benchmark, which represents 13.35% of the identified PAU related revenue, the hospitals may retain 100% of the additional savings. Staff believes the PAU Savings Policy provides a mechanism to generate savings for payers and ensures the success of the All-Payer Model by adjusting for needed reductions in PAUs that are a key focus of the Model.
Future Expansion of PAU
Staff will continue to consider additional categories of admissions to the PAU measures. Areas of future focus for additional PAU measures include sepsis and other avoidable admissions from long-term care and post-acute settings, unplanned medical admissions through the emergency department setting, and readmissions that occur in a 60-day or 90-day period after index admission.
RECOMMENDATIONS
Based on this assessment, staff recommends the following for the PAU savings policy for RY 2018:
1. Set the value of the PAU savings amount to 1.45 percent of total permanent revenue in the state, which is a 0.20 percent net reduction in RY 2018.
2. Cap the PAU savings reduction at the statewide average reduction for hospitals with higher socioeconomic burden, which is defined for this purpose as above 75th percentile of Medicaid and Self-pay or Charity ECMADs.
3. Evaluate further expansion of PAU definitions for RY 2019 to incorporate additional categories of unplanned admissions.
7
Final Recommendations for the Potentially Avoidable Utilization Savings Policy
APPENDIX I. ANALYSIS OF PQI TRENDS
PQIs—developed by the Agency for Healthcare Research and Quality—measure inpatient admissions for ambulatory care sensitive conditions. The following figure presents an analysis of the change in PQI rates between CYs 2015 and 2016. However, overall total PQI trends and trends for PQI 08 and 13 should be interpreted with caution due to the impact of ICD-10 and AHRQ PQI version changes.11 From 2015 to 2016, there were improvements in the rates of PQI 03 (diabetes long-term complications), 07 (hypertension), 05 (chronic obstructive pulmonary disease or asthma in older adults), and 11 (bacterial pneumonia) However, there were continuing increases in PQI 10 (dehydration) and 14 (uncontrolled diabetes).
Appendix I. Figure 1. PQI Trends, CY 2015-CY 2016
PQI Admission Rate CY 2015 PQI COUNT
CY 2016 PQI COUNT
CY 2015-2016 %CHANGE
CY 2015-2016 PQI Count
CY 2016 % CONTRIBUTION
A B C=B/A-1 D=B-A PQI 01 Diabetes Short-Term Complications 2,971 2,993 0.74% 22 0.98%PQI 02 Perforated Appendix 1,071 1,207 12.70% 136 6.06%PQI 03 Diabetes Long-Term Complications 4,324 3,525 -18.48% - 799 -35.62%PQI 05 COPD or Asthma in Older Adults 13,489 13,043 -3.31% - 446 -19.88%PQI 07 Hypertension 2,897 2,319 -19.95% - 578 -25.77%PQI 08 Heart Failure * 14,720 11,402 -22.54% - 3,318 -147.93%PQI 10 Dehydration 5,245 7,342 39.98% 2,097 93.49%PQI 11 Bacterial Pneumonia 9,649 9,179 -4.87% - 470 -20.95%PQI 12 Urinary Tract Infection 7,683 7,712 0.38% 29 1.29%PQI 13 Angina Without Procedure* 880 1,780 102.27% 900 40.12%PQI 14 Uncontrolled Diabetes 965 2,192 127.15% 1,227 54.70%PQI 15 Asthma in Younger Adults 1,078 927 -14.01% - 151 -6.73%PQI 16 Lower-Extremity Amputation among Patients with Diabetes 704 782 11.08% 78 3.48%Total PQI, Unduplicated 65,114 62,871 -3.44% - 2,243 100.00%
11 AHRQ updated to PQI software version 6 in October 2016. The major changes in version 6 include the retirement of PQI 13 (Angina without Procedure), and a correction to an incorrect decrease in PQI 08 (Heart Failure) under ICD-10.
8

Final Recommendations for the Potentially Avoidable Utilization Savings Policy
APPENDIX II. PERCENT OF REVENUE IN PAU BY HOSPITAL
The following figure presents the total non-PAU revenue for each hospital, total PAU revenue by PAU category (PQI, readmissions, and total), total hospital revenue, and PAU as a percentage of total hospital revenue for CY 2016. Overall, PAU revenue comprised 10.86 percent of total statewide hospital revenue.
Appendix II. Figure 1. PAU Percentage of Total Revenue by Hospital, CY 2016
Hosp ID Hospital Name
Non-PAU Revenue
A
Readmission Revenue
BPQI Revenue
C
Total PAU RevenueD=B+C
Grand Total Hospital Revenue
E=A+D
% Readmission
F=B/E% PQIG=C/E
% PAUH=F+G
210001 MERITUS $283,289,310 $23,494,447 $17,431,874 $40,926,321 $324,215,631 7.25% 5.38% 12.62%
210002 UMMC $1,435,191,399 $93,675,647 $20,684,230 $114,359,877 $1,549,551,276 6.05% 1.33% 7.38%
210003 PRINCE GEORGE $246,688,579 $22,850,811 $14,644,428 $37,495,238 $284,183,818 8.04% 5.15% 13.19%
210004 HOLY CROSS* $449,274,541 $39,116,459 $19,456,706 $58,573,165 $507,847,706 7.70% 3.83% 11.53%
210005 FREDERICK MEMORIAL $319,528,571 $22,787,248 $17,033,173 $39,820,420 $359,348,991 6.34% 4.74% 11.08%
210006 HARFORD $84,734,904 $11,413,170 $7,405,362 $18,818,532 $103,553,436 11.02% 7.15% 18.17%
210008 MERCY $488,967,333 $18,196,792 $8,910,342 $27,107,134 $516,074,467 3.53% 1.73% 5.25%
210009 JOHNS HOPKINS $1,983,907,849 $149,286,161 $37,525,052 $186,811,213 $2,170,719,063 6.88% 1.73%8.61%
9

Final Recommendations for the Potentially Avoidable Utilization Savings Policy
Hosp ID Hospital Name
Non-PAU Revenue
A
Readmission Revenue
BPQI Revenue
C
Total PAU RevenueD=B+C
Grand Total Hospital Revenue
E=A+D
% Readmission
F=B/E% PQIG=C/E
% PAUH=F+G
210010 DORCHESTER $37,560,890 $4,428,502 $4,790,869 $9,219,371 $46,780,260 9.47% 10.24% 19.71%
210011 ST. AGNES $373,518,101 $34,126,243 $26,439,581 $60,565,824 $434,083,925 7.86% 6.09% 13.95%
210012 SINAI $671,374,840 $46,429,824 $22,084,279 $68,514,103 $739,888,943 6.28% 2.98% 9.26%
210013 BON SECOURS $90,243,822 $14,576,531 $6,427,626 $21,004,157 $111,247,979 13.10% 5.78% 18.88%
210015 FRANKLIN SQUARE $434,451,376 $48,312,713 $28,450,630 $76,763,343 $511,214,718 9.45% 5.57% 15.02%
210016 WASHINGTON ADVENTIST $230,211,335 $20,384,557 $12,259,135 $32,643,691 $262,855,026 7.76% 4.66% 12.42%
210017 GARRETT COUNTY $47,907,285 $1,301,034 $2,951,330 $4,252,364 $52,159,649 2.49% 5.66% 8.15%
210018 MONTGOMERY GENERAL $157,121,596 $13,179,066 $8,061,244 $21,240,310 $178,361,906 7.39% 4.52% 11.91%
210019 PRMC $375,726,858 $27,944,511 $21,591,418 $49,535,929 $425,262,787 6.57% 5.08% 11.65%
210022 SUBURBAN $268,526,295 $21,158,297 $11,703,782 $32,862,079 $301,388,373 7.02% 3.88%10.90%
10

Final Recommendations for the Potentially Avoidable Utilization Savings Policy
Hosp ID Hospital Name
Non-PAU Revenue
A
Readmission Revenue
BPQI Revenue
C
Total PAU RevenueD=B+C
Grand Total Hospital Revenue
E=A+D
% Readmission
F=B/E% PQIG=C/E
% PAUH=F+G
210023 ANNE ARUNDEL $531,467,116 $28,422,056 $21,567,332 $49,989,388 $581,456,503 4.89% 3.71% 8.60%
210024 UNION MEMORIAL $387,563,521 $27,863,344 $15,148,428 $43,011,772 $430,575,293 6.47% 3.52% 9.99%
210027 WESTERN MARYLAND $292,514,732 $21,538,583 $13,559,716 $35,098,299 $327,613,031 6.57% 4.14% 10.71%
210028 ST. MARY $165,372,543 $11,055,617 $10,236,061 $21,291,678 $186,664,221 5.92% 5.48% 11.41%
210029 HOPKINS BAYVIEW $533,626,396 $51,181,366 $24,245,810 $75,427,176 $609,053,573 8.40% 3.98% 12.38%
210030 CHESTERTOWN $45,378,104 $3,668,205 $4,218,472 $7,886,676 $53,264,780 6.89% 7.92% 14.81%
210032 UNION HOSPITAL OF CECIL $139,474,644 $8,679,051 $11,444,321 $20,123,372 $159,598,016 5.44% 7.17% 12.61%
210033 CARROLL COUNTY $207,735,335 $17,628,425 $16,110,880 $33,739,305 $241,474,641 7.30% 6.67% 13.97%
210034 HARBOR $166,109,732 $15,972,533 $11,126,689 $27,099,222 $193,208,954 8.27% 5.76% 14.03%
210035 CHARLES REGIONAL $127,077,125 $10,590,715 $10,156,771 $20,747,486 $147,824,611 7.16% 6.87%14.04%
11

Final Recommendations for the Potentially Avoidable Utilization Savings Policy
Hosp ID Hospital Name
Non-PAU Revenue
A
Readmission Revenue
BPQI Revenue
C
Total PAU RevenueD=B+C
Grand Total Hospital Revenue
E=A+D
% Readmission
F=B/E% PQIG=C/E
% PAUH=F+G
210037 EASTON $176,562,941 $10,657,173 $12,058,895 $22,716,068 $199,279,009 5.35% 6.05% 11.40%
210038 UMMC MIDTOWN $177,671,741 $23,608,371 $7,850,769 $31,459,140 $209,130,881 11.29% 3.75% 15.04%
210039 CALVERT $124,008,743 $7,173,390 $8,766,775 $15,940,165 $139,948,908 5.13% 6.26% 11.39%
210040 NORTHWEST $214,136,851 $22,904,526 $18,580,729 $41,485,254 $255,622,105 8.96% 7.27% 16.23%
210043 BALTIMORE WASHINGTON $352,763,331 $36,132,870 $24,334,401 $60,467,272 $413,230,603 8.74% 5.89% 14.63%
210044 G.B.M.C. $394,487,807 $22,088,927 $15,900,674 $37,989,601 $432,477,409 5.11% 3.68% 8.78%
210045 MCCREADY $14,664,665 $527,671 $1,039,034 $1,566,705 $16,231,370 3.25% 6.40% 9.65%
210048 HOWARD COUNTY $262,331,613 $21,701,488 $15,597,612 $37,299,100 $299,630,713 7.24% 5.21% 12.45%
210049 UPPER CHESAPEAKE $291,541,981 $20,665,762 $14,816,885 $35,482,648 $327,024,629 6.32% 4.53% 10.85%
210051 DOCTORS $193,700,410 $23,307,784 $16,057,893 $39,365,677 $233,066,087 10.00% 6.89%16.89%
12

Final Recommendations for the Potentially Avoidable Utilization Savings Policy
Hosp ID Hospital Name
Non-PAU Revenue
A
Readmission Revenue
BPQI Revenue
C
Total PAU RevenueD=B+C
Grand Total Hospital Revenue
E=A+D
% Readmission
F=B/E% PQIG=C/E
% PAUH=F+G
210055 LAUREL REGIONAL $76,524,079 $8,204,956 $4,280,226 $12,485,181 $89,009,261 9.22% 4.81% 14.03%
210056 GOOD SAMARITAN $249,052,413 $26,757,469 $16,434,629 $43,192,098 $292,244,511 9.16% 5.62% 14.78%
210057 SHADY GROVE $349,193,037 $24,088,433 $14,101,319 $38,189,752 $387,382,790 6.22% 3.64% 9.86%
210058 REHAB & ORTHO $101,744,779 $324,691 $324,691 $102,069,470 0.32% 0.32%
210060 FT. WASHINGTON $41,152,352 $3,063,270 $4,465,871 $7,529,141 $48,681,493 6.29% 9.17% 15.47%
210061 ATLANTIC GENERAL $97,618,544 $3,908,166 $4,882,142 $8,790,307 $106,408,852 3.67% 4.59% 8.26%
210062 SOUTHERN MARYLAND $230,216,619 $24,002,657 $18,299,811 $42,302,468 $272,519,087 8.81% 6.72% 15.52%
210063 UM ST. JOSEPH $367,993,303 $21,653,327 $12,826,818 $34,480,145 $402,473,448 5.38% 3.19% 8.57%
210064 LEVINDALE $52,996,890 $4,390,825 $4,390,825 $57,387,715 7.65% 7.65%
210065 HOLY CROSS $78,854,583 $6,919,516 $5,463,433 $12,382,949 $91,237,532 7.58% 5.99%13.57%
13

Final Recommendations for the Potentially Avoidable Utilization Savings Policy
Hosp ID Hospital Name
Non-PAU Revenue
A
Readmission Revenue
BPQI Revenue
C
Total PAU RevenueD=B+C
Grand Total Hospital Revenue
E=A+D
% Readmission
F=B/E% PQIG=C/E
% PAUH=F+G
GERMANTOWN*
STATEWIDE $14,461,534,140 $1,121,343,178 $641,423,453 $1,762,766,631 $16,224,300,772 6.91% 3.95% 10.86%*Holy Cross and Holy Cross Germantown are combined for PAU Savings adjustments (combined CY 2016 PAU % is 11.84%).
14

Final Recommendations for the Potentially Avoidable Utilization Savings Policy
APPENDIX III. Modeling Results Proposed PAU Savings Policy Reductions for RY 2018
The following figure presents the proposed PAU savings reduction policy for each hospital for RY 2018.
Appendix III. Figure 1. Proposed PAU Savings Policy Reductions for RY 2018, by Hospital
Hospital ID Hospital Name
FY17 Permanent Total Revenue
CY16 PAU %
FY18 PAU Savings
Adjustment
FY18 PAU Savings
Adjustment Before
Protections
CY 16 % ECMAD
Inpatient Medicaid &SelfPay Charity
FY18 PAU Savings
Adjust w/ Protectio
n (%)
FY 18 PAU Savings with Protections
Revenue Impact ($)
FY17 PAU Savings
Adjustment with
Protection ($)
Net Impact to RY 2018
Inflation Factor
Net RY 18 Revenue Impact
A B C=B*-13.912
D = A*C E F G = A*F H K=(G-H)/A
L=K*A
210001 MERITUS $314,827,422 12.62% -1.75% -$5,520,664 18.70% -1.75% -$5,520,664 -$4,350,206 -0.37% -$1,170,528210002 UMMC $1,316,372,491 7.38% -1.03% -$13,498,782 30.64% -1.03% -$13,498,782 -$11,958,459 -0.12% -$1,540,156210003 PRINCE GEORGE $286,573,599 13.19% -1.83% -$5,252,190 42.75% -1.51% -$4,324,396 -$3,608,563 -0.25% -$715,861210004 HOLY CROSS* $479,646,983 11.84% -1.65% -$7,893,731 22.24% -1.65% -$7,893,731 -$6,837,249 -0.22% -$1,056,662210005 FREDERICK MEMORIAL $329,156,555 11.08% -1.54% -$5,067,592 7.36% -1.54% -$5,067,592 -$4,326,716 -0.23% -$740,931210006 HARFORD $99,998,182 18.17% -2.52% -$2,524,681 18.01% -2.52% -$2,524,681 -$2,058,207 -0.47% -$466,492210008 MERCY $502,208,027 5.25% -0.73% -$3,663,552 24.46% -0.73% -$3,663,552 -$3,375,724 -0.06% -$287,765210009 JOHNS HOPKINS $2,229,450,835 8.61% -1.20% -$26,672,300 23.44% -1.20% -$26,672,300 -$23,369,402 -0.15% -$3,301,817210010 DORCHESTER $48,094,357 19.71% -2.74% -$1,317,165 25.45% -1.51% -$725,744 -$1,202,307 0.99% $476,567210011 ST. AGNES $416,466,586 13.95% -1.94% -$8,072,607 23.43% -1.94% -$8,072,607 -$6,807,387 -0.30% -$1,265,225210012 SINAI $709,153,890 9.26% -1.29% -$9,124,538 24.01% -1.29% -$9,124,538 -$7,716,249 -0.20% -$1,408,380210013 BON SECOURS $114,232,763 18.88% -2.62% -$2,996,761 59.97% -1.51% -$1,723,772 -$1,584,298 -0.12% -$139,478210015 FRANKLIN SQUARE $492,402,641 15.02% -2.09% -$10,276,606 26.75% -1.51% -$7,430,356 -$6,318,376 -0.23% -$1,111,845
210016 WASHINGTON ADVENTIST $258,319,310 12.42% -1.73% -$4,457,978 30.47% -1.51% -$3,898,038 -$3,278,301 -0.24% -$619,708
210017 GARRETT COUNTY $53,507,634 8.15% -1.13% -$605,944 15.88% -1.13% -$605,944 -$484,974 -0.23% -$120,981
210018 MONTGOMERY GENERAL $169,927,186 11.91% -1.65% -$2,812,121 15.26% -1.65% -$2,812,121 -$2,351,779 -0.27% -$460,333
12 Required % reduction in PAU revenue= [Savings (-1.45%) + the statewide impact of Medicaid Protection (-0.06%)] / % PAU (10.86%) = -13.90%.
15

Final Recommendations for the Potentially Avoidable Utilization Savings Policy
Hospital ID Hospital Name
FY17 Permanent Total Revenue
CY16 PAU %
FY18 PAU Savings
Adjustment
FY18 PAU Savings
Adjustment Before
Protections
CY 16 % ECMAD
Inpatient Medicaid &SelfPay Charity
FY18 PAU Savings
Adjust w/ Protectio
n (%)
FY 18 PAU Savings with Protections
Revenue Impact ($)
FY17 PAU Savings
Adjustment with
Protection ($)
Net Impact to RY 2018
Inflation Factor
Net RY 18 Revenue Impact
A B C=B*-13.9
D = A*C E F G = A*F H K=(G-H)/A
L=K*A
210019 PENINSULA REGIONAL $419,622,018 11.65% -1.62% -$6,792,718 18.01% -1.62% -$6,792,718 -$5,584,916 -0.29% -$1,207,672210022 SUBURBAN $296,104,140 10.90% -1.51% -$4,484,669 8.47% -1.51% -$4,484,669 -$3,310,346 -0.40% -$1,174,349210023 ANNE ARUNDEL $575,908,245 8.60% -1.19% -$6,881,944 11.90% -1.19% -$6,881,944 -$5,776,774 -0.19% -$1,105,168210024 UNION MEMORIAL $414,710,552 9.99% -1.39% -$5,756,652 18.79% -1.39% -$5,756,652 -$5,370,044 -0.09% -$386,510210027 WESTERN MARYLAND $316,661,093 10.71% -1.49% -$4,712,416 14.37% -1.49% -$4,712,416 -$3,839,345 -0.28% -$873,035210028 ST. MARY $172,574,583 11.41% -1.59% -$2,736,037 19.47% -1.59% -$2,736,037 -$2,134,757 -0.35% -$601,250210029 HOPKINS BAYVIEW $620,440,469 12.38% -1.72% -$10,672,844 29.09% -1.51% -$9,362,447 -$7,898,881 -0.24% -$1,463,619210030 CHESTERTOWN $54,289,889 14.81% -2.06% -$1,117,206 12.33% -2.06% -$1,117,206 -$847,354 -0.50% -$269,875210032 UNION HOSP OF CECIL $156,358,285 12.61% -1.75% -$2,739,652 26.43% -1.51% -$2,359,447 -$1,987,435 -0.24% -$371,976210033 CARROLL COUNTY $223,662,684 13.97% -1.94% -$4,341,595 13.67% -1.94% -$4,341,595 -$3,958,120 -0.17% -$383,582210034 HARBOR $190,469,979 14.03% -1.95% -$3,713,160 32.39% -1.51% -$2,874,192 -$2,461,177 -0.22% -$412,939210035 CHARLES REGIONAL $143,723,289 14.04% -1.95% -$2,803,843 17.95% -1.95% -$2,803,843 -$2,386,640 -0.29% -$417,229210037 EASTON $195,481,707 11.40% -1.58% -$3,096,495 17.25% -1.58% -$3,096,495 -$2,642,856 -0.23% -$453,713210038 UMMC MIDTOWN $228,124,869 15.04% -2.09% -$4,767,381 42.15% -1.51% -$3,442,404 -$2,895,546 -0.24% -$546,815210039 CALVERT $141,821,983 11.39% -1.58% -$2,244,537 16.25% -1.58% -$2,244,537 -$1,865,860 -0.27% -$378,665210040 NORTHWEST $248,058,564 16.23% -2.26% -$5,594,125 21.22% -2.26% -$5,594,125 -$4,615,117 -0.39% -$979,087
210043 BALTIMORE WASHINGTON $398,733,080 14.63% -2.03% -$8,105,616 17.50% -2.03% -$8,105,616 -$7,057,541 -0.26% -$1,048,269
210044 G.B.M.C. $435,420,575 8.78% -1.22% -$5,312,059 10.34% -1.22% -$5,312,059 -$4,050,196 -0.29% -$1,261,849210045 MCCREADY $15,530,984 9.65% -1.34% -$208,250 14.53% -1.34% -$208,250 -$121,592 -0.56% -$86,663210048 HOWARD COUNTY $291,104,867 12.45% -1.73% -$5,035,913 15.50% -1.73% -$5,035,913 -$4,020,574 -0.35% -$1,015,374210049 UPPER CHESAPEAKE $325,619,300 10.85% -1.51% -$4,909,071 11.39% -1.51% -$4,909,071 -$4,286,879 -0.19% -$622,258210051 DOCTORS $226,126,371 16.89% -2.35% -$5,306,892 18.75% -2.35% -$5,306,892 -$4,318,086 -0.44% -$988,851210055 LAUREL REGIONAL $98,343,286 14.03% -1.95% -$1,917,175 29.37% -1.51% -$1,484,000 -$1,310,667 -0.18% -$173,379
16

Final Recommendations for the Potentially Avoidable Utilization Savings Policy
Hospital ID Hospital Name
FY17 Permanent Total Revenue
CY16 PAU %
FY18 PAU Savings
Adjustment
FY18 PAU Savings
Adjustment Before
Protections
CY 16 % ECMAD
Inpatient Medicaid &SelfPay Charity
FY18 PAU Savings
Adjust w/ Protectio
n (%)
FY 18 PAU Savings with Protections
Revenue Impact ($)
FY17 PAU Savings
Adjustment with
Protection ($)
Net Impact to RY 2018
Inflation Factor
Net RY 18 Revenue Impact
A B C=B*-13.9
D = A*C E F G = A*F H K=(G-H)/A
L=K*A
210056 GOOD SAMARITAN $284,642,445 14.78% -2.05% -$5,845,659 20.39% -2.05% -$5,845,659 -$5,130,445 -0.25% -$715,306210057 SHADY GROVE $376,694,222 9.86% -1.37% -$5,160,898 19.17% -1.37% -$5,160,898 -$4,461,883 -0.19% -$699,144210058 REHAB & ORTHO $117,465,701 0.32% -0.04% -$8,357 24.04% -0.01% -$8,357 -$6,651 0.00% -$1,762210060 FT. WASHINGTON $47,023,363 15.47% -2.15% -$1,010,796 18.46% -2.15% -$1,010,796 -$802,982 -0.44% -$207,796210061 ATLANTIC GENERAL $102,841,659 8.26% -1.15% -$1,180,344 12.82% -1.15% -$1,180,344 -$1,032,629 -0.14% -$147,681
210062 SOUTHERN MARYLAND $269,769,528 15.52% -2.16% -$5,817,602 21.05% -2.16% -$5,817,602 -$5,253,518 -0.21% -$564,088
210063 UM ST. JOSEPH $388,253,807 8.57% -1.19% -$4,623,341 11.27% -1.19% -$4,623,341 -$3,595,241 -0.26% -$1,028,096210064 LEVINDALE $57,520,942 7.65% -1.06% -$611,430 5.70% -1.06% -$611,430 -$435,119 -0.31% -$176,302
210065 HOLY CROSS GERMANTOWN* $100,218,431 11.84% -1.65% -$1,649,332 21.98% -1.65% -$1,649,332 -$1,271,536 -0.38% -$377,823
STATEWIDE $15,753,659,372 10.86% -1.51% -$237,722,720 20.85% -$228,429,107 -0.22% -$34,069,720Top Quartile= 24.14%
* Holy Cross Germantown is combined with Holy Cross Hospital for PAU Savings calculations but PAU percent’s in Appendix II are presented separately for reference.
17


![Ensuring Demand-Driven Youth Training Programs4].pdf · Ensuring Demand-Driven Youth Training Programs How to Conduct an Effective Labor Market Assessment: a program of the International](https://img.pdfslide.us/doc/110x75/5c71d8be09d3f211558b60b8/ensuring-demand-driven-youth-training-programs-4pdf-ensuring-demand-driven.jpg)