Embed Size (px)
Citation preview

WORKING PAPER SERIES
The Role of Social Capital in Poverty Alleviation
in Native American Reservation Communities
Kathleen Pickering David Mushinski
John C. Allen
RPRC Working Paper No. 06-07
February, 2006
Rural Poverty Research Center http://www.rprconline.org/
RUPRI Rural Poverty Research Center
214 Middlebush Hall University of Missouri
Columbia MO 65211-6200 PH 573 882-0316
RUPRI Rural Poverty Research Center Oregon State University
213 Ballard Hall Corvallis OR 97331-3601
PH 541 737-1442

The Role of Social Capital in Poverty Alleviation in Native American Reservation Communities*
ByDr. Kathleen Pickering
Department of AnthropologyColorado State UniversityFort Collins, CO 80523
Dr. David MushinskiDepartment of EconomicsColorado State University
Fort Collins, CO [email protected]
Dr. John C. AllenWestern Rural Development Center
Utah State UniversityLogan, UT
_____________________________ The authors acknowledge and appreciate support from Northwest Area Foundation (grant 06-*
G042).
Abstract
Researchers’ and practitioners’ recognition of the importance of community social and
cultural relations ( “social capital”) to effective implementation of poverty reduction projects and
differences in social capital across communities suggest that such projects should be tailored to
the types of social capital present in a given community. Drawing upon a data set collected by
the Northwest Area Foundation of twelve Native American communities which includes a wide
array of questions regarding social capital, this paper evaluates the different types of social
capital in each community and considers the implications of that capital for the types of poverty
reduction programs which would be effective in each community. We find differences in social
capital across the communities in the study, with resulting differing implications for economic
development and poverty reduction projects. Our results support observations that social capital
is a community-specific phenomenon and must, therefore, be studied at the local level.
Keywords: social capital, Native American communities, poverty alleviation
Kathleen Pickering is an Associate Professor in the Department of Anthropology at Colorado State
University. David Mushinski is an Associate Professor in the Department of Economics at Colorado State
University. John C. Allen is Director of the Western Rural Development Center and Professor in the
Department of Sociology, Social Work, and Anthropology at Utah State University. Funding for this
project was provided by the Northwest Area Foundation

1
Introduction
Impoverished areas tend to have marginal levels of economic activity in formal markets.
There is little manufacturing or, generally, economic activity which provides high paying jobs.
Individuals in those communities tend to have low levels of education, little work experience in
formal markets, and no access to financial capital (i.e., loans from banks). On the other hand,
individuals in those communities are “super-entrepreneurs” in that they are constantly looking
for economic opportunities in order to patch together an existence. A family might engage in a
variety of economic activities over the course of a year in order to survive.
Recently, people involved in poverty reduction and economic development in
impoverished areas have recognized that an important shortcoming of economic development
projects designed to reduce poverty in impoverished areas is their failure to recognize the social
and cultural context into which the projects are introduced. Carter and Maluccio (2003) have
observed that these social and cultural relationships are an important backdrop against which
economic development may occur. These social and cultural relationships have been labeled
“social capital.”
The definition of social capital varies across academic disciplines and practitioners.
Woolcock (2000) has stated that “the basic idea of social capital is that a person’s family,
friends, and associates constitute an important asset and that ... [w]hat is true for individuals ...
also holds for groups. Those communities endowed with [more social capital] are in a stronger
position to confront poverty and social vulnerability” (226). He goes on to note that “social
capital refers to the norms and networks that enable people to act collectively” (226). This article
adopts his distinction between social and cultural relationships which relate to the “Networks”
within a community and those which relate to the “Norms” of individuals and in a community.
2
Networks are the social networks and associations which provide mutual benefits to members of
the networks and associations. Woolcock, et. al. (2000) observe that this type of social capital
“stresses the importance of vertical as well as horizontal associations between people and of
relations within and among such organizational entities as community groups and firms (230).”
Networks can concern relationships among people in a local community. Cordes, et. al. (2003)
call these local networks “linking social capital.” Other networks concern relationships with
people outside of the local community. We may call it bridging social capital in that it represents
a bridge to outside communities. Bridging social capital may be important to local community
economic development in that they may represent a connection with outside sources of business
and financial capital. Of course, development of those external ties depends on the willingness of
the external ties to develop economic relationships with the impoverished communities. Another
aspect of networks stressed by Putnam (2000) was membership in clubs and organizations. He
cited declining membership in clubs and organizations as evidence of declining social capital in
the United States. With respect to such institutions, we may distinguish between clubs and
organizations which serve a social purpose (such as sports clubs, religious organizations and
hobby groups) in that from organizations which serve an economic purpose (such as a Chamber
of Commerce and professional associations).
Norms refer to individuals’ norms values, attitudes, beliefs and levels of interpersonal
trust and civic cooperation which define how they act individually, and the relationship of those
individual actions with a group, and how they interact with others in the group. “[T]rust may be
understood as an optimistic expectation or belief regarding other agents’ behavior” (Durlauf and
Fafchamps 2004:9). Trust can arise from repeated personal interactions or it may come from
knowledge about a general group of people (Durlauf and Fafchamps 2004). From an economic
3
perspective, trustworthiness, for example, “makes cooperation possible while avoiding the cost
associated with the enforcement of legal contracts” (Carter and Castillo 2004:2).
A comparison of norms and networks indicates that norms are cognitive in that they
define an individual’s internal framework which defines how they interact with others while
networks refer to the actual ties and organizations individuals have with others in their
community. Thus, we might expect them to have different impacts on poverty reduction.
Networks provide insights into the nature of economic opportunities in a community while
norms capture the values and standards which form the basis of interactions between individuals
in a community. The presence of one form of social capital in the absence of the other form of
social capital makes economic development and poverty reduction difficult. For example, norms
which support consumption of goods produced locally will not help reduce poverty in the
absence of networks which permit entrepreneurs to locate sources of demand for their products.
Individuals involved in analysis of social capital have adopted different approaches in deciding
how to use social capital. Some have argued that communities should develop the types of social
capital which they are lacking. For example, if the community has few links with outside sources
the community should develop those links. Others contend that a community’s social capital
determines the type of economic development projects which a community might undertake.
Kenneth Arrow has observed that “[i]nstead of thinking of more or less [social capital], it may be
more fruitful to think of the existing social relations as a preexisting network into which new
parts of the economy (for example, development projects) have to be fitted” (1999:4). Thus,
before identifying an economic development project appropriate for a community, the
community must be aware of the nature of its social capital. This paper adopts the latter
approach.
The eight states include Minnesota, Iowa, North Dakota, South Dakota, Montana, Washington, and1
Oregon.
4
The success of an economic development project may depend on the extent to which it is
consonant with local social capital. Thus, economic development projects for a community may
have to be tailored in light of the social capital in the community. Consider, for example, a
community with notable networks among middle and upper income families within the
community. A poverty-alleviation program might seek to expose impoverished families, which
tend not to be in those networks, to those networks. If networks among impoverished families
are significant, a program designed to encourage enterprise development might do so through,
say, Grameen Bank type lending groups combined with training programs. Further, strong local
networks may be used to identify potential sources of demand for individual entrepreneurs. If, on
the other hand, individuals networks consist primarily of familial ties approaching poverty
reduction through inter-family relationships would be inappropriate.
Framework for Analysis
This article relies primarily on the NWAF’s Horizons data set, which surveyed
households in twelve three-community clusters. The NWAF Horizon program focuses on rural
communities with fewer than 5,000 people in the NWAF’s eight-state region. Four of the twelve1
clusters were included within Native American reservations. Table 1 identifies reservations
which include three-community clusters: two reservations in South Dakota and one reservation
in Montana. The remaining Native American cluster consisted of separate reservations in
Western Washington. We have suppressed the names of specific communities and the
reservations in order to preserve the anonymity of the communities. Table 1 also reports the

5
sample sizes for each of the twelve communities in the four Native American clusters. The
average sample size is 68 with a low value of 19 and a high value of 155. The sample size
exceeded one hundred in only two communities. Because of small sample sizes for many Native
American communities in the datasets and because some of the samples do not appear
representative of the communities, the conclusions we reach in this report must be interpreted as
suggestive of the nature of social capital in the communities studied. Further, while it would be
tempting to draw causal conclusions from our comparisons such conclusions would not be
warranted by our analysis because we have not formally estimated models which permit us to
test for the nature and direction of causality in a given relationship. (See: Durlauf(2002) and
Manski (2000) for discussions of making such inferences.) Finally, since the communities were
not chosen randomly from the communities in their respective reservations, we cannot make
inferences about reservations from our results.
The seeming non-random nature of the samples is more problematic from a statistical
perspective. Table 1 compares the percent of the Horizons samples which are Native American
with the percent of the populations in these communities which are Native American according
to the 2000 Decennial Census. In all cases, the 2000 Decennial Census percentages are greater
than the sample percentages. In some cases, the differences are notable. An extreme example is
Montana community II, where the 2000 Decennial Census indicates that 68% of the people in
that community were Native American, while 16% of the Horizons sample in the community
was Native American. These differences suggest that some of the statistics in this report might
not accurately reflect the communities they are intended to represent and, thus, counsel caution
in interpreting the results.
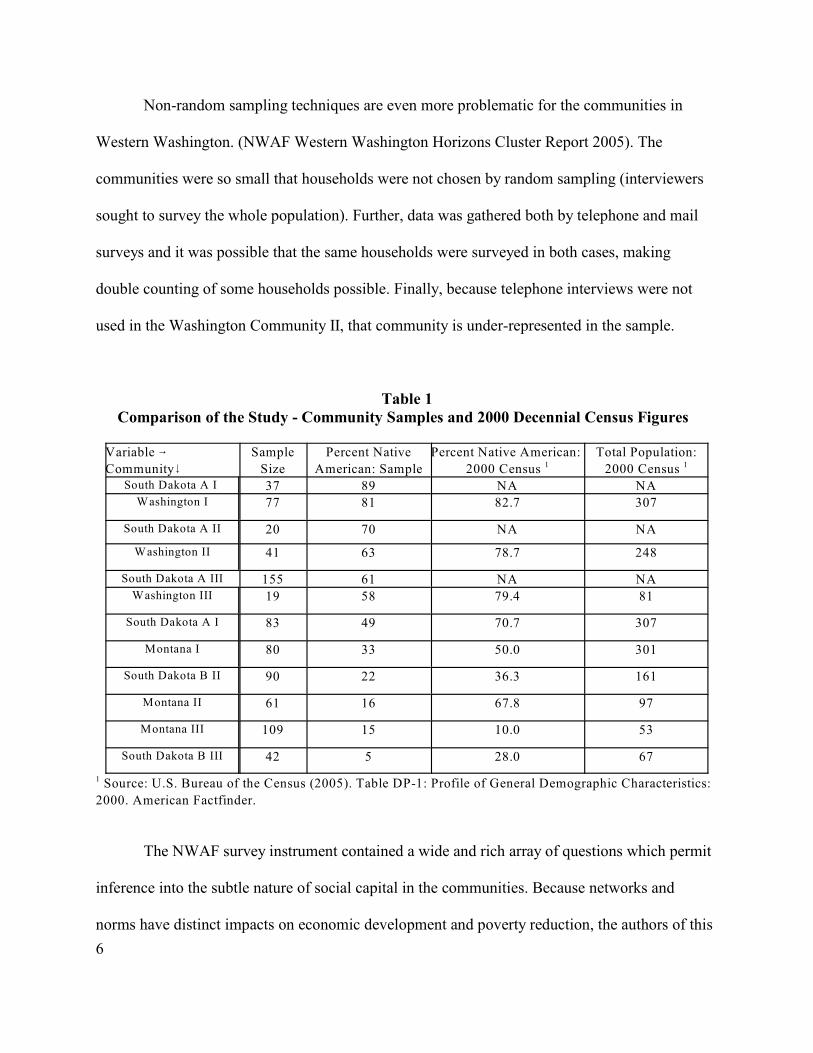
6
Non-random sampling techniques are even more problematic for the communities in
Western Washington. (NWAF Western Washington Horizons Cluster Report 2005). The
communities were so small that households were not chosen by random sampling (interviewers
sought to survey the whole population). Further, data was gathered both by telephone and mail
surveys and it was possible that the same households were surveyed in both cases, making
double counting of some households possible. Finally, because telephone interviews were not
used in the Washington Community II, that community is under-represented in the sample.
Table 1Comparison of the Study - Community Samples and 2000 Decennial Census Figures
Variable 6
Community9
Sample
Size
Percent Native
American: Sample
Percent Native American:
2000 Census 1
Total Population:
2000 Census 1
South Dakota A I 37 89 NA NAWashington I 77 81 82.7 307
South Dakota A II 20 70 NA NA
Washington II 41 63 78.7 248
South Dakota A III 155 61 NA NAWashington III 19 58 79.4 81
South Dakota A I 83 49 70.7 307
Montana I 80 33 50.0 301
South Dakota B II 90 22 36.3 161
Montana II 61 16 67.8 97
Montana III 109 15 10.0 53
South Dakota B III 42 5 28.0 67
Source: U.S. Bureau of the Census (2005). Table DP-1: Profile of General Demographic Characteristics:1
2000. American Factfinder.
The NWAF survey instrument contained a wide and rich array of questions which permit
inference into the subtle nature of social capital in the communities. Because networks and
norms have distinct impacts on economic development and poverty reduction, the authors of this

7
study organized the survey questions into those questions which related to households’ networks
and those questions which related to a household’s norms. Table 2 identifies the network-related
questions (variables) which were included in this analysis and Table 3 identifies the norm-related
questions (variables) used in this analysis. The questions identified in Tables 2 and 3 reflect the
rich nature of the Horizons data set.
Table 2Network Variables Used In The Analysis
Have you served on a committee or as an officer of any local club or organization? (Variable values: 1 = Yes and
0 = No.)
Have you helped plan or lead a meeting, as part of a job, volunteer work, or you involvement with a group, club, or
organization? (Variable values: 1 = Yes and 0 = No.)
Have you displayed a symbol of your community, or your community’s name in some way in the last 12 months?
(Variable values: 1 = Yes and 0 = No.)
Have you ever worked with your neighbors to solve a neighborhood problem? (Variable values: 1 = Yes and \
0 = No.)
Say that you were involved in helping to solve a local community problem or issue. Do you have any connections or
resources outside the community that you could draw upon to help? (Variable values: 1 = Yes and 0 = No.)
How often do you feel a sense of belonging or membership in [your community]? (Variable values: 5 = always to
1 = never.)
How often do you feel that people like you are excluded or left out of community activities in [your community]?
(Variable values: 5 = never to 1 = always.)
Overall, how often do you think people like you have an impact in making [your community] a better place to live?
(Variable values: 5 = always to 1 = never.)
Social Organizations: Have you been involved with ... (1) any recreation, sports, investment, garden, or hobby
groups, (2) any religious, spiritual, or church-sponsored groups, (3) any clubs or organizations related to your age,
sex, race, ethnicity, or veteran’s status, (4) a your or parents’ organization, (5) a community or neighborhood project,
or (6) any support groups or self-help programs. (Variable values: 0 to 6.)
Economic Organizations: Have you been involved with ... (1) a local service or fraternal organization [e.g., Chamber
of Commerce, Lions Club, or Rotary Club] or (2) a job-related group, such as a professional association, co-op,
union, or trade, farm, or business organization. (Variable values: 0 to 2.)
All Organizations: social organizations plus economic organizations. (Variable values: 0 to 8.)
8
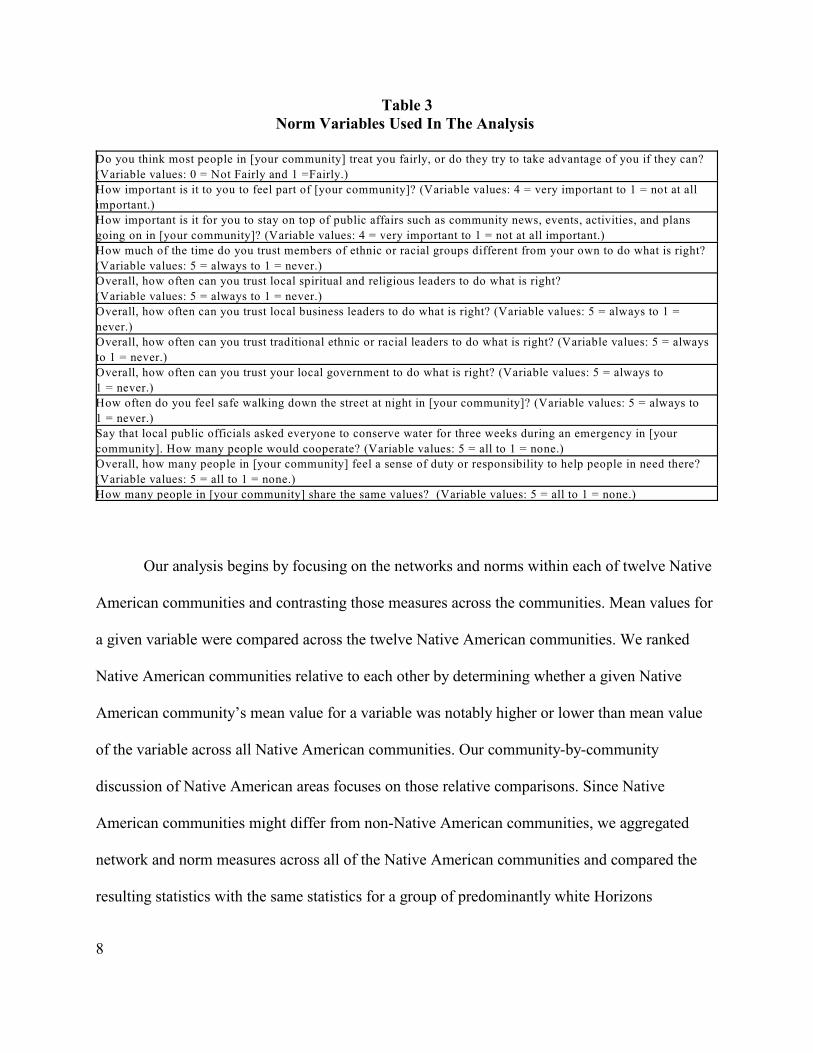
Table 3Norm Variables Used In The Analysis
Do you think most people in [your community] treat you fairly, or do they try to take advantage of you if they can?
(Variable values: 0 = Not Fairly and 1 =Fairly.)
How important is it to you to feel part of [your community]? (Variable values: 4 = very important to 1 = not at all
important.)
How important is it for you to stay on top of public affairs such as community news, events, activities, and plans
going on in [your community]? (Variable values: 4 = very important to 1 = not at all important.)
How much of the time do you trust members of ethnic or racial groups different from your own to do what is right?
(Variable values: 5 = always to 1 = never.)
Overall, how often can you trust local spiritual and religious leaders to do what is right?
(Variable values: 5 = always to 1 = never.)
Overall, how often can you trust local business leaders to do what is right? (Variable values: 5 = always to 1 =
never.)
Overall, how often can you trust traditional ethnic or racial leaders to do what is right? (Variable values: 5 = always
to 1 = never.)
Overall, how often can you trust your local government to do what is right? (Variable values: 5 = always to
1 = never.)
How often do you feel safe walking down the street at night in [your community]? (Variable values: 5 = always to
1 = never.)
Say that local public officials asked everyone to conserve water for three weeks during an emergency in [your
community]. How many people would cooperate? (Variable values: 5 = all to 1 = none.)
Overall, how many people in [your community] feel a sense of duty or responsibility to help people in need there?
(Variable values: 5 = all to 1 = none.)
How many people in [your community] share the same values? (Variable values: 5 = all to 1 = none.)
Our analysis begins by focusing on the networks and norms within each of twelve Native
American communities and contrasting those measures across the communities. Mean values for
a given variable were compared across the twelve Native American communities. We ranked
Native American communities relative to each other by determining whether a given Native
American community’s mean value for a variable was notably higher or lower than mean value
of the variable across all Native American communities. Our community-by-community
discussion of Native American areas focuses on those relative comparisons. Since Native
American communities might differ from non-Native American communities, we aggregated
network and norm measures across all of the Native American communities and compared the
resulting statistics with the same statistics for a group of predominantly white Horizons

The tables may be obtained from the authors upon request. 2
9
communities. Possible systematic differences between economic classes counsel comparing low-
income and high-income households across Native American and “white” Horizons
communities. Because the Horizons communities, which are rural, may differ systematically
from rural communities in the eight-state region, we conclude by comparing statistics for the
Native American and white communities with statistics for rural areas from the data in a broader
Social Indicators Survey gathered by the NWAF. This article does not contain all of the tables
upon which our analysis relies.2
1. Social Capital Within Individual Native American Communities
As we noted above, this part of our analysis involves comparing the mean values of
social capital variables of the twelve Native American communities relative to each other. In
order to get a feel for the analysis, we provide three examples in Table 4 of the nature of our
analysis. The table reports mean values of the variables for each community, as well as the
overall mean across communities and the range of the means across the communities. We first
looked at the overall variation of a given variable across the communities. Situations in which
there was not much variation suggested that all communities were similar with respect to the
social capital measure being considered. The second column in Table 4 is a variable with little
variation; it ranged from 3.39 to 3.74. The differences in mean values were nominal, putting
aside the substantive importance of a difference of, say, 0.30 in mean values for a variable whose
values range from one to five. We excluded such variables from our analysis because they
provided no insight into how social capital differed across the communities.
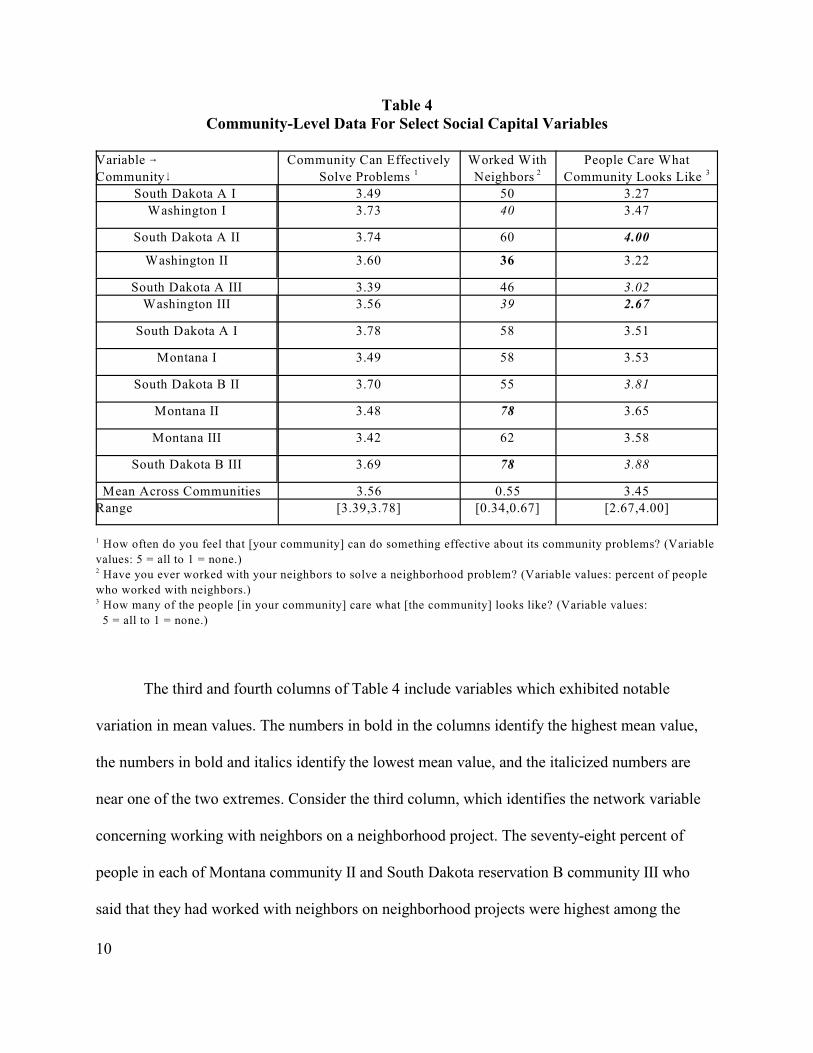
10
Table 4Community-Level Data For Select Social Capital Variables
Variable 6
Community9
Community Can Effectively
Solve Problems 1
Worked With
Neighbors 2
People Care What
Community Looks Like 3
South Dakota A I 3.49 50 3.27
Washington I 3.73 40 3.47
South Dakota A II 3.74 60 4.00
Washington II 3.60 36 3.22
South Dakota A III 3.39 46 3.02
Washington III 3.56 39 2.67
South Dakota A I 3.78 58 3.51
Montana I 3.49 58 3.53
South Dakota B II 3.70 55 3.81
Montana II 3.48 78 3.65
Montana III 3.42 62 3.58
South Dakota B III 3.69 78 3.88
Mean Across Communities 3.56 0.55 3.45
Range [3.39,3.78] [0.34,0.67] [2.67,4.00]
How often do you feel that [your community] can do something effective about its community problems? (Variable1
values: 5 = all to 1 = none.)
Have you ever worked with your neighbors to solve a neighborhood problem? (Variable values: percent of people2
who worked with neighbors.)
How many of the people [in your community] care what [the community] looks like? (Variable values: 3
5 = all to 1 = none.)
The third and fourth columns of Table 4 include variables which exhibited notable
variation in mean values. The numbers in bold in the columns identify the highest mean value,
the numbers in bold and italics identify the lowest mean value, and the italicized numbers are
near one of the two extremes. Consider the third column, which identifies the network variable
concerning working with neighbors on a neighborhood project. The seventy-eight percent of
people in each of Montana community II and South Dakota reservation B community III who
said that they had worked with neighbors on neighborhood projects were highest among the
11
twelve communities. Our analysis of each of these communities would include this result as
suggesting that these communities had high levels of localized (neighborhood) community
networks. At the other extreme, Washington Community II had the lowest percent of people who
had worked with neighbors, with Washington Communities I and III close behind. These results
would suggest that these communities had relatively lower levels of such networks. The fourth
column of Table 4 identifies a norm-related variable, whether people care about what their
community looks like. South Dakota Reservation A Community II had the highest value of this
variable, with South Dakota Reservation B Communities II and III close behind. The
Washington III and South Dakota Reservation A III communities had the lowest values for these
variables. These results informed our analyses of each of these communities. Our discussion
focuses on the variables for which a community’s mean value tended to high or low among the
twelve communities. With respect to variables not mentioned in the following discussion, one
can assume that the community tended toward the average of the means across communities.
With these examples at hand, we turn to our community-by-community analysis.
a. The Western Washington Communities
We have already observed that the data-gathering process makes these communities
different from the other communities. The historical context of the communities in the Western
Washington reservations is also important in understanding why social capital appears different
in the communities compared with the other reservations. First, these individual reservations
have the highest percentage of Native American residents of all the Native American
communities (community I 82.7; community III 79.4; community II 78.7). These three

12
reservations have small populations (community I 307; community II 248; community III 81).
They have somewhat intersecting but mostly independent political histories. Community III
formed an independent constitutional government in 1969, separating from the administrative
control of community I. Community II, because they chose not to settle with another tribe, had
no land until 1934, and no constitution until 1968, and was formed by only fourteen families.
They also possess limited land resources, in contrast to the other Native American communities,
with only 1300 acres across the three reservations. Flowing from their small population and
physical size, bridging capital with external networks and resources emerges as important for
these communities.
We will first discuss the ways in which all communities’ social capital are similar and
then turn to community-specific social capital attributes. Generally, when these communities had
notable means the means were low. The majority of those low means were among norm
variables. All communities had low means for the network variable concerning working with
neighbors to solve neighborhood problems. These communities’ had low mean values for the
following norm variables: (1) voting in local elections; (2) reading about local news and events;
and (3) trusting local business leaders. We now turn to how the specific communities differed in
distinct ways.
With respect to community-specific differences, community I generally had means below
the cross-community average for community-related network variables. It had a low mean for
the network variable concerning feeling excluded from or left out of one’s community. On the
other hand, its mean values for community-related norm variables were around the cross-
community means. It had among the lowest means for four of the five trust-related questions; it
13
was around the cross-community mean for trusting traditional ethnic or racial leaders. It was also
above the cross-community mean for participation in social organizations.
Community II had the lowest participation rates, among all Horizons communities, in
economic and social organizations. It did have a high mean value for the network variable
concerning display of a community symbol. It had a high mean in the norm variable concerning
feeling a sense of responsibility to help people in need and a low mean in trust of local
government. While not among extreme values, community II was above the cross-community
mean for the “trusting traditional ethnic or racial leaders” variable. This was the only trust
variable, among the five trust variables, for which community II was above the cross-community
means.
Community III had many extreme means. These extreme values are likely, in part, a
product of the mean values’ high variances associated with the small sample size for the
community. It had highest mean value for the network variables concerning connections outside
of the community to help solve problems, and displaying a community symbol. It had the lowest
mean values for the network variables concerning (1) service on a committee or as an officer of a
local club or organization, (2) feeling a sense of belonging in the community, (3) being excluded
or left out of the community, and (4) having an impact in making the community better. With
respect to norm variables, the community had the highest mean by far for the norm of trusting
different ethnic or racial group members to do what is right, and had a high mean for staying on
top of public affairs. On the other hand, community III had the lowest mean values for people in
the community (1) treating one fairly, (2) trusting local spiritual and religious leaders to do what
is right, (3) cooperating in the case of a water emergency, (4) feeling a sense of responsibility to
help people in need, (5) caring what the community looks like, (6) sharing the same values, and

14
(7) reading about local news and events in a local newspaper. Community III was also low in
people feeling safe walking down the street.
The similarities across these reservations suggest similar approaches to poverty reduction
and economic development. The general lack of connection with community and lack of trust of
community members in the communities indicate that community-level economic development
or poverty alleviation programs and programs which require trust among participants will not
likely be effective in these areas. The lack of comfort with government and local businesses
suggests that such programs should not be implemented through local government or local
business leaders. It is notable that trust was at or above the overall cross-community mean for
the “trusting traditional ethnic or racial leaders variable” and that, with the exception of
community II, participation in economic and social organizations was above the overall cross-
community means. With respect to community II, the means for participating in social and
economic organizations and trusting traditional ethnic or racial leaders suggest approaching
those organizations or leaders about implementing such programs. Programs directed at
individuals and, perhaps, extended families may be most effective in this community. For
communities I and III, one might also consider turning to local social and economic
organizations. Communities II and III having means above the cross-community means for the
“connections outside of the community to solve problems” variable suggests that these
communities might try to use those connections to enhance poverty reduction and economic
development.

15
b. Communities in South Dakota Reservation B
The South Dakota reservation B communities are in some respects the mirror image of
the Western Washington communities. When these communities had mean values which lay at
extremes those extremes were high, suggesting higher levels of social capital. Only South
Dakota reservation B communities II and III had a variable which had a low extreme mean. They
had a low mean for the same variable: the “trusting traditional ethnic or racial leaders” variable.
If one ranked the communities in terms of the number of variables which extreme means,
community I would be at the low end (it had few extreme means), community II would be in the
middle and community III would be at the high end. Communities I and II differ in the latter
community has more norm variables which are at the high extremes. Communities II and III
differ in that the latter has more network variables which are at the high extremes.
All three communities had high means for two norm variables. They had high mean
values for the “How often can you trust local spiritual and religious leaders to do what is right”
variable, with community II having the highest mean for that variable across all twelve
communities. They also had high values for the “[h]ow often do you vote in local elections”
variable, with community III having the highest mean across all twelve communities.
While there were only two similarities across all three communities, communities II and
III were similar for one network variable and four norm variables. Community II had the highest
mean for the “[h]ow often do you feel a sense of belonging in your community” network
variable, with community III close behind. The communities had high means for the following
norm variables: (1) people in the community share the same values; (2) trust local government;
(3) feeling safe walking down the street; and (4) the number of people who care what the
community looks like. The similarity of communities II and III in these regards may be due to
16
the low percentages of people in the sample who were Native American in these communities:
22% and 5%, respectively (see: Table 3). Forty-nine percent of the population in community I
was Native American.
With respect to community-specific notable variables, we first consider community I. It
had the highest mean value for the “how often do people like you have an impact in making the
community better” network variable and a high mean for the “have you helped plan or lead a
meeting” network variable. It also had high mean values for the (1) “do people in your
community treat you fairly” and (2) “how much of the time do you trust members of ethnic or
racial groups different from your own to do what is right” norm variables. With respect to the
latter variable, it is interesting that community I is similar to the Western Washington
communities, which also had higher percentages of Native Americans in their samples.
In addition to mean values already mentioned, community II had high mean values for
four other norm variables. Those variables include (1) “how many people in the community
would cooperate in the case of a water emergency,” (2) “how many people in the community
feel a sense of duty or responsibility to help people in need,” (3) “how important to you is it to
feel part of the community,” and (4) “how often can you trust your local business leaders.”
Community III had the highest mean values for seven network variables, in addition to
the high values for norm variables shared with other reservation communities already mentioned.
The network variables included (1) having served on a committee or as an officer of a local club
or organization, (2) having helped plan or lead a meeting, (3) having worked with neighbors on a
neighborhood problem, (4) not feeling excluded from or left out of the community, (5)
participation in social and economic organizations, (6) participation in economic organizations,
17
and (7) participation in social organizations. Community III appears to have strong internal
network connections.
The contrasting results between community I, on the one hand, and the other
communities on the reservation suggested that race and ethnicity may have had an impact on the
responses in the sample. Because of the over-sampling of whites in these communities, our
initial hypothesis was that whites tended to express higher levels of the types of social capital
measured in these surveys generally, and as a result were skewing the community results toward
more of a ‘white’ perspective. To that end, we aggregated across the communities and split the
sample into Native American respondents and “White” respondents. We then considered
whether race had an impact on the foregoing results.
The results from the data revealed a different picture, which is important to interpreting
community levels of social capital. White respondents in these communities did raise the
community means for feeling safe on the street at night, and for having a sense of belonging in
the community. The White residents also had higher means for how many people in the
community share the same values, which may reveal an important assumption on the part of
white people generally and for trusting local government and business leaders.
However, Native American residents raised other mean levels that are important to
understanding and implementing poverty reduction. For example, it was Native American
responses that raised the means for how many people in the community would cooperate in a
water emergency, and for how many people feel a sense of duty or responsibility to help people
in need. The Native American residents also raised the community means for trusting traditional
ethnic and racial leaders. Mean levels of variables for the communities were essentially the same
for Native American and white residents for the other social capital variables. Both groups had
18
approximately the same responses for having helped plan a meeting, worked with neighbors on a
neighborhood problem, and knowing about public affairs. These shared responses reflect some
of the basic skills necessary to make use of social capital opportunities.
Turning to the import of these findings for poverty alleviation and economic
development programs, the general absence of low levels of norm and network social capital in
these areas suggests the presence of both forms of social capital in all communities. People in
community I, which had the fewest variables in the “high” range, appear empowered in that they
felt that they could have an impact in their communities and that other people in their
community treated them fairly. The presence of a larger percentage of people who had helped
plan or lead a meeting suggests the presence of potential leaders. These findings indicate that
programs which encourage co-operation among participants should work and that those
programs are more likely to include potential leaders. High percentages of people who trust
spiritual and religious leaders and who trust members of other racial groups to do what is right
further suggest that people might work well together.
The program implications regarding community I are only strengthened when we turn to
the other communities. The high scores for a number of community-related norm variables in
community II suggests a strong sense of community. Community-level programs which involve
cooperation, thus, may be effective in reducing poverty or developing the local economy. Of
course, programs which focus on individuals may also be effective but they would fail to take
advantage of these stronger norms. All of these observations apply to community III.
Community III, however, also apparently has strong networks. It has a greater percentage of
leaders, which may be due, in part, to the larger percentage of economic and social organizations
in the community. In terms of poverty reduction and economic development programs,

19
community III has networks which may be accessed by such a program. A program might
encourage people to use their networks to foster development projects and to interact. Synergies
that develop along these networks may enhance development.
c. Communities in South Dakota Reservation A
Generally, when the communities on the reservation had extreme mean values, those
values were low. Otherwise, the communities shared few similarities with respect to specific
social capital variables. As a result, our discussion for the South Dakota Reservation A
communities focus on each community alone. In interpreting the results for these communities,
one must also recall that South Dakota Reservation A community II had the second smallest
sample size (20) and that community I on the reservation did not have a large sample size (37).
While community I generally had low mean values when it had an extreme mean, the two
variables for which it had high values suggest avenues for implementation of poverty reduction
and economic development programs. The community had low mean values for several
community-related variables: (1) how often people are excluded from or left out of the
community; (2) displaying a symbol of the community; (3) feel safe walking down streets at
night; (4) number of people who share the same values; and (5) the number of people who would
cooperate in a water emergency. It also had low mean values for two trust-related questions: (1)
trust members of ethnic or racial groups to do what is right; and (2) trust business leaders. On the
other hand, the community had the highest mean for trusting traditional ethnic or racial leaders.
It also had high means for participating in clubs and organizations, and for participating in social
clubs or organizations. These results for the community suggest implementing poverty reduction
and economic development programs through social organizations associated with traditional

20
ethnic or racial relationships.
Community II was notable in that it had no extreme mean values among the network
variables. Of course, one must remember that this implies that the community has the average
level of network social capital for these communities; it is pretty much around the cross-
community mean values for these variables. The community had high means for several
community-related norm variables: (1) importance of staying on top of public affairs; (2) people
cooperating in a water emergency; (3) people caring what the community looks like; and (4)
people having a sense of duty to help others in need. It did have low means for people in the
community sharing the same values and for trusting local government. These results, to some
extent, conflict. Four high mean community-related variables and one low mean community-
related variable, in light of the small sample size for community II, suggest that residents have a
sense of community. These results suggest that approaching poverty reduction through
community, non-government related programs might prove fruitful.
With respect to community III, we note at the outset that it had the highest sample size
among the Native American communities. We, thus, have greater confidence in the estimated
means for this community than the other Horizons Native American communities. With one
exception, when community III had an extreme mean that mean was low. This result suggests
that the community does not have high levels of norm or network social capital. The one
exception to the community’s low extreme means was connections outside the community to
help solve a local community problem. Community III had low means or the lowest mean for the
following community-related norm and network variables: (1) importance of feeling part of the
community; (2) people in the community share the same values; (3) people in the community
care what the community looks like; and (4) staying on top of public affairs (lowest); (5) feel
21
safe walking down the street (lowest); and (6) feel sense of belonging in the community. It also
had low means for variables which suggest the presence of leaders; it had the lowest mean for
the percent of people who helped plan or lead a meeting and a low mean for people who served
on a committee or as an officer of a local club or organization. It also had low means for several
trust variables: (1) trust local government; (2) trust traditional ethnic or racial leaders; and (3)
trust members of ethnic or racial groups different from your own to do what is right.
The results regarding community III suggest, generally, that there is a low sense of
community, little trust and fewer people who might serve as leaders. These results would imply a
focus on poverty reduction and economic development programs which focus on the individual,
the immediate family, or the extended family. The high mean on connections with outside
sources suggests implementation of a program which takes advantage of such connections.
d. Communities in the Montana Reservation
Like the South Dakota reservation A communities, the Montana Reservation
communities shared few similarities. Thus, we will consider each community individually. It is
important to note that among the Native American communities, those on the Montana
reservation had the lowest percentage of Native American residents (26.7%).
The analysis for Montana community II produced, at times, interesting results. While it
was low in terms of the variable concerning the importance of staying on top of public affairs, it
had the highest mean for the variable concerning reading about local news and events. While
local news and events are broader than public affairs the latter are included within the former. It
had the lowest mean for the importance of feeling part of the community, a high mean for people
in the community sharing the same values, and the highest mean for working with neighbors to

22
solve a neighborhood problem. We might interpret these results as suggesting that it is a
community of people who are individualistic (their share the same value of individualism) but
that they work together when necessary. The community also had low means for overall
participation in groups and organizations, participation in economic groups and organizations,
and participation in social groups and organizations. It had a high mean for trusting members of
ethnic or racial groups different from their own to do what is right. These results suggest
adopting poverty reduction and economic development programs which get people together
(there are no existing organizations of which to take advantage) to work toward a common goal.
Community I had a few instances in which it had a mean with an extreme value. It had a
high mean for the network variable involving connections outside of the community which could
be used to solve community problems. It had a low mean for the norm variable concerning
trusting local spiritual and religious leaders to do what is right. It had high mean values for
trusting traditional racial and ethnic leaders, for trusting members of racial and ethnic groups
different from their own to do what is right, and for feeling that people in their community
treated them fairly. The two trust measures suggest higher levels of trust in the community,
while the outside connections variable hints that external sources of poverty reduction may be
available. Programs which rely on interpersonal trust may prove fruitful, especially if they take
advantage of outside connections.
Community III had no extreme mean values for network variables and it had high means
for the norm variables (1) trusting local business leaders, (2) reading about local news and events
in the paper, and (3) people having a sense of duty or responsibility to others in need. The norm
variables are not really suggestive of a systematic difference between community III and the
other Native American communities on average. With respect to poverty reduction and

We defined “non-urban” as not urban or suburban.3
23
economic development programs, these observations suggest trying one of the many programs
available that focus on building entrepreneurship through community based action.
2. Native American Communities in Relation to White Communities in the Eight State Region
An analysis of individual Native American communities provides insights into how the
communities differ among each other. Those communities, of course, might differ in systematic
and important ways from other Horizons communities and from the eight-state region covered
by the NWAF. This paper will next undertake a comparison of network and norm measures for
Native American Horizons communities as a whole (i.e., aggregated across all twelve
communities) and Horizons “White” communities. We define a “White” community as a
community with 94% or more residents who are Caucasian. Since the communities were not
randomly chosen from among the communities in the NWAF’s eight-state region, it is useful to
compare the network and norm measures in the Horizons communities with the same measures
in the eight-state Social Indicators Survey (SIS) data set. Our analysis compared households in
the SIS data set in non-urban areas in the eight-state region with households in Horizons White
and Native American communities. We did not generally find substantial differences in the3
mean values of the network and norm measures across these areas. We discuss below the
differences which were present when we compared the Horizons communities with the broader
region.
Two network variables differed notably between the Native American communities and
the White communities and SIS non-urban areas. The mean values of the variable concerning
whether a respondent felt excluded or left out of their community was higher in the SIS area, as
24
compared with Horizons communities. A lower mean value indicates that respondents felt more
excluded from their community. The mean levels of the variable were 3.94 for the SIS region,
3.51 for White communities and 3.23 for Native American communities. This variable also
differed among groups within Native American communities. White people (mean = 3.49) in
White Horizons communities felt virtually the same as people in White Horizons communities,
while Native American people felt more excluded (mean = 2.97) and low-income Native
American people in those communities (mean = 2.87) felt the most excluded. Combining these
results with the lower levels of trust of local government and of local business leaders among
Native American people in Native American communities, as compared with White in
communities generally, we might conclude that delivery of poverty reduction programs through
community-level organizations may not be appropriate in Native American communities.
While participation in economic organizations in Native American communities was
basically the same as in non-urban areas in the eight-state region, important differences emerged
along racial and economic lines. Within Native American communities, White households
participated in 0.73 organizations (on average) while Native American households participated
in 0.59 organizations. When we break these groups into high- and low-income households, we
find that high-income Native American households and high-income White households had the
same participation rates in economic organizations (89%). Low-income Native American
households participated in 0.54 organizations, while low-income White households participated
in 0.62 organizations.
The story regarding participation in social organizations was different in these
communities. Households in the communities studied participated in more social organizations
than in the eight-state, non-urban SIS region. The mean level of participation in social

25
organizations in the SIS region was 2.26, while it was 2.44 in White communities and 2.62 in
Native American communities. Within Native American communities, Native American people
had a mean participation rate of 2.84 and 2.44 for White people in those communities.
Participation in these organizations also differed according to one’s income level. High income
Native American households in Native American communities had mean participation rates of
3.16, while low-income Native American people in those communities had mean participation
rates of 2.83. White Households in Native American Communities had lower participation rates,
with high-income households having a mean participation of 2.85 and low-income households
having a mean participation of 2.20. Overall, the higher participation rates in social
organizations of Native Americans in Native American communities, contrasted with
participation in economic organizations, suggest implementing poverty reduction programs
through social groups rather than economic groups.
The network variable concerning a respondent’s connections or resources outside of their
community upon which they could draw reveals interesting results. The percent of respondents
in White Horizons communities and in non-urban areas in the eight-state NWAF region were
similar: 51% and 52%, respectively. The percent of all people in Native American Horizons
communities who had such connections were higher: 55%. When we distinguish between high-
income (income more than $40,000) and low-income (income less than $40,000) households, we
observe that 72% of high-income households had such connections, while 47% of low-income
households had those connections. (These results did not change when we distinguished between
Native American and White households in the Native American communities.) This difference
suggests that a household’s poverty may be due, in part, to a lack of access to resources outside
of one’s community.
26
While about the same percentage of people in Native American communities worked
with neighbors on neighborhood problems as people in the eight-state region (about 55%), fewer
Native American people in those communities (48%) worked with neighbors as compared with
White people in those communities( 62%). These statistics suggest that Native American people
have fewer connections with people in their neighborhoods, generally.
Several results regarding the norm variables are of interest. At a broad level, high-income
and low-income households were not much different with respect to norm variables, when
compared with network variables. This general result suggests that networks are an important
determinant of a household’s poverty level. Of course, we cannot determine the causal
relationship between a household’s economic status and its networks. A household’s networks
could determine its poverty level. Alternatively, the networks could reflect a household’s
economic status.
When comparing the study communities with the eight-state, non-urban SIS area one
norm variable differed notably between these areas. A greater percentage of people in the studied
communities felt that people in their community treated them fairly. Ninety-five percent of the
people in White communities and 91% of the White people in Native American communities felt
that other people in their community treated them fairly, compared with 80% feeling that way in
the SIS areas. It is also notable, that Native American people in Native American communities
were more like the SIS areas in that 78% of them felt that people in their communities treated
them fairly.
Questions regarding respondents’ trust in various local institutions appeared in the
Horizons surveys but not in the SIS surveys. Trust levels in White communities were uniformly
higher than in Native American communities. Native American people in Native American

27
communities had lower levels of trust in local government, local business leaders, other racial
and ethnic groups, and local spiritual and religious leaders. Native American people in those
communities did have higher levels of trust in traditional racial and ethnic leaders. While these
results might suggest introduction of poverty reduction programs in Native American
communities through traditional racial and ethnic leaders, one has to be cautious in this regard
because different Native American cultures traditionally had different relationships among tribal
members. Some cultures had hierarchical relationships in which leaders would redistribute
community resources with the common good in mind, while leaders in other cultures distributed
resources to family and friends. The latter type of structure might not be amenable to
introduction of poverty reduction programs through traditional leaders. As a final matter, Native
American peoples’ lack of trust in local governmental and business institutions counsels caution
in introducing poverty reduction programs through those institutions.
Conclusion
This paper has analyzed the variation in social capital across Native American Horizons
communities using a data set which is rich in detail regarding social capital. The diversity in
types of social capital across the communities studied indicates that projects intended to foster
economic development in impoverished areas should be tailored to account for the nature of
social capital in a specific community. Among the four clusters of Native American
communities considered here, there is notable variation. There were also some important
differences in social capital between Native American and white respondents, both within Native
American Horizon communities and across all Horizon communities. For example, whites, and
28
high income whites in particular, tended to have higher social capital in relation to formal
institutions and business, no doubt because they control these institutions. Native American
respondents were more likely to be involved in informal organizations based on social
relationships, because these are likely the networks they control. Therefore, to enhance poverty
reduction on Native American reservations, programs that only work with formal institutions are
likely to end up reinforcing the status quo, because these are the networks currently controlled
by high income whites. Overall, the central conclusion is that communities should be engaged in
different ways simultaneously, working in different types of organizations and across different
social groups to create new synergies and break down old barriers. It would also appear to be
important to have a mixture of individual approaches to poverty reduction along with those that
involve the community as a whole. If a community does not get along internally, then individual
solutions are more likely to work than those that demand a sense of belonging and duty to the
community.
The findings of this study support observations which have been made about the
relationship between social capital and community development. First, social capital is a local
phenomenon; it varies across communities. This study also suggests that social capital varies
across communities which have similar ethnic or economic structures. Second, given that social
capital is local, it is important to understand the local levels and types of social capital when
attempting to develop programs that would alleviate poverty.
This paper may be viewed as a first step in an analysis of the interaction between social
capital and economic development in impoverished communities. The analysis suggests several
extensions. First, most of the Native American communities did not contain large percentages of
Native American people. Including more communities which are predominantly Native

29
American would provide a better picture of the nature of social capital in Native American areas.
Surveying communities on reservations which are predominantly Native American would serve
this goal. Second, there are some difficulties with interpreting the questions as formulated in the
current surveys once social and cultural issues for Native Americans are considered. For
example, there is no real definition of community provided to the respondents, so it is not clear
what the responders are envisioning when they make characterizations of “the community.”
Previous research in Pine Ridge demonstrates that, for Oglala Lakota respondents, community
was not a geographic concept but rather a kinship concept that embraced extended family
members living in distant geographic communities across the reservation. Similarly, the concept
of “government” is particularly ambiguous in Native American communities, where “local
government” could be tribal, county, city or state. Third, the importance of cultural factors to
social capital and recent work on the use of economic experiments to measure social capital
(e.g., Carter and Castillo (2004) and Glaeser, et. al. (2000)) suggest that data gathering alone
might not capture the complexity and various dimensions of social capital. Qualitative research,
such as focus groups and open ended interviews, will provide a richer sense of where the specific
opportunities and constraints for poverty reduction reside in each community. Finally, further
research is necessary to understand the development of social capital and its role in alleviating
poverty and enhancing the capacity of local communities to create their own positive futures.

30
References
Arrow, Kenneth J. (1999). “Observations on Social Capital,” in Social Capital A
Multifaceted Perspective. Partha Dasgupta and Ismail Serageldin, eds. The World Bank:
Washington, D.C.
Carter, Michael R. and Marco Castillo (December 2004). “An Experimental Approach to
Social Capital in South Africa.” Manuscript.
Carter, Michael R. and John A. Maluccio (2003). “Social Capital and Coping with
Economic Shocks: An Analysis of Stunting of South African Children.” 31(7) World
Development 1147-1163.
Cordes, et. al. (2003). “Social Capital, Attachment Value, and Rural Development: A
Conceptual Framework and Application of Contingent Valuations.” 85(5) American Journal of
Agricultural Economics 1201-1207.
Durlauf, Steven N. (2002). “On the Empirics of Social Capital.” 112 (November)
Economic Journal F459-F479.
Durlauf, Steven N. and Marcel Fafchamps (April 28, 2004). “Social Capital.”
Manuscript.
Glaeser, Edward L., David I. Laibson, José A. Scheinkman and Christine L. Soutter
(2000). “Measuring Trust.” 105 Quarterly Journal of Economics 811-846.
Manski, Charles F. (2000). “Economic Analysis of Social Interactions.” 14(3) Journal of
Economic Perspectives 115-136.
Northwest Area Foundation (June 2005). “Horizons Program Social Indicators Survey:
Western Washington Cluster Report.”
Putnam, R. (2000). Bowling Alone. Simon and Schuster: New York.

31
Woolcock, Michael and Deepa Narayan (2000). “Social Capital: Implications for
Development Theory, Research, and Policy.” 15(2) World Bank Research Observer 225-249.


![[XLS]plan.rajasthan.gov.inplan.rajasthan.gov.in/content/dam/planning-portal... · Web viewudaipur tonk sriganganagar sirohi sikar sawaimadhopur rajsamand pratapgarh pali nagour kota](https://img.pdfslide.us/doc/110x75/5aa9c64f7f8b9a8b188d492d/xlsplan-viewudaipur-tonk-sriganganagar-sirohi-sikar-sawaimadhopur-rajsamand-pratapgarh.jpg)