Embed Size (px)
Citation preview

CELLULAR BEAMS AT AMBIENT AND ELEVATED TEMPERATURES
2
LIST OF CONTENTS
LIST OF CONTENTS 2 LIST OF TABLES 6 LIST OF FIGURES 7 NOMENCLATURE 14 ABSTRACT 16 COPYRIGHT 18 ACKNOWLEDGEMENTS 20
1 INTRODUCTION 21 1.1 BACKGROUND 21 1.2 OBJECTIVES 22 1.3 OUTLINE OF THE THESIS 23
2 LITERATURE REVIEW 26 2.1 INTRODUCTION 26 2.2 FIRE DESIGN OF STRUCTURES 26
2.2.1 Prescriptive method 27 2.2.2 Performance based method 29
2.3 BEAMS WITH WEB OPENINGS 36 2.3.1 Fabrication of cellular beams 37 2.3.2 Cellular beams versus castellated beams 37
2.4 INVESTIGATIONS ON BEAMS WITH WEB OPENINGS 39 2.4.1 Experimental studies on castellated and cellular beams 40 2.4.2 Experimental studies on cellular composite beams at ambient
temperature 42 2.4.3 Experimental studies on cellular composite floors at elevated
temperature 43 2.5 DESIGN OF CELLULAR BEAMS AT AMBIENT
TEMPERATURE 50 2.5.1 Web post buckling 51 2.5.2 Vierendeel mechanism 55
2.6 DESIGN OF CELLULAR COMPOSITE BEAMS AT AMBIENT TEMPERATURE 57
2.7 DESIGN OF CELLULAR COMPOSITE BEAMS AT ELEVATED TEMPERATURES 59 2.7.1 Temperature distribution in cellular composite beams 60
2.8 INTRODUCTION TO THE FINITE ELEMENT ANALYSIS 60
3 CELLULAR BEAMS AT AMBIENT TEMPERATURE 63 3.1 INTRODUCTION 63 3.2 MODELLING CELLULAR BEAMS 63 3.3 MODELLING NATAL BEAM 4B 64
3.3.1 Introduction 64

CELLULAR BEAMS AT AMBIENT AND ELEVATED TEMPERATURES
3
3.3.2 Modelling using ANSYS and ABAQUS 65 3.3.3 Modelling in ABAQUS 66 3.3.4 Modelling in ANSYS 67 3.3.5 Sensitivity study on mesh size 68 3.3.6 Analysis types 69 3.3.7 Applying imperfections 71 3.3.8 Numerical modelling results for Natal Beam 4B 74
3.4 MODELLING LEEDS BEAM 2 76 3.4.1 Introduction 76 3.4.2 Modelling approach for Leeds Beam 2 77 3.4.3 Comparison between ABAQUS and ANSYS 79 3.4.4 Modified modelling approach for Leeds Beam 2 81 3.4.5 Importance of boundary conditions in modelling CBs 83 3.4.6 Importance of load increments in modelling CBs 98
3.5 MODELLING LEEDS BEAM 3 103 3.5.1 Introduction and modelling 103 3.5.2 Numerical versus test results 104 3.5.3 Internal stresses of web post while buckling 106
3.6 SUMMARY OF THE MODELLING OF CELLULAR BEAMS AT AMBIENT TEMPERATURE 108
4 CELLULAR COMPOSITE BEAMS AT AMBIENT TEMPERATURE 110 4.1 INTRODUCTION 110 4.2 MODELLING COMPOSITE SLABS USING ABAQUS 111
4.2.1 General 111 4.2.2 Modelling concrete material 112
4.3 MODELLING ULSTER BEAM A1 119 4.3.1 Introduction and objectives 119 4.3.2 Details of the modelling approach 119 4.3.3 Numerical results for the Beam A1 123 4.3.4 Investigating stress distribution at failure 128
4.4 MODELLING ULSTER BEAM B1 132 4.4.1 Modelling 132 4.4.2 Results of modelling for Beam B1 133
4.5 MODELLING RWTH BEAM 3 138 4.5.1 Details of the test 138 4.5.2 Numerical model 139 4.5.3 Numerical results against the test results 142
4.6 SUMMARY OF THE MODELLING OF CELLULAR COMPOSITE BEAMS AT AMBIENT TEMPERATURE 144
5 PARAMETRIC STUDIES ON CELLULAR COMPOSITE BEAMS AT AMBIENT TEMPERATURE 145 5.1 INTRODUCTION 145 5.2 EFFECT OF LOADING TYPE 145
5.2.1 Effect of loading type on symmetric beam 145 5.2.2 Effect of loading type on asymmetric beam 148

CELLULAR BEAMS AT AMBIENT AND ELEVATED TEMPERATURES
4
5.3 EFFECT OF TENSILE BEHAVIOUR OF CONCRETE 150 5.4 EFFECT OF WEB IMPERFECTIONS 151
5.4.1 On symmetric Beam A1 151 5.4.2 On asymmetric Beam B1 152
5.5 SUMMARY OF THE CASE STUDIES ON THE CELLULAR COMPOSITE BEAMS AT AMBIENT TEMPERATURE 153
6 CELLULAR COMPOSITE BEAMS AT ELEVATED TEMPERATURE155 6.1 INTRODUCTION 155 6.2 ULSTER FIRE TESTS 156 6.3 NUMERICAL MODELLING AND RESULTS FOR ULSTER
BEAM A2 158 6.3.1 Modelling 158 6.3.2 Comparing modelling and test results for Beam A2 168 6.3.3 Investigating the internal forces 171
6.4 NUMERICAL MODELLING AND RESULTS FOR ULSTER BEAM B2 174 6.4.1 Introduction 174 6.4.2 Modelling and results 176
6.5 MODELLING AND RESULTS OF FIRE TEST FOR ULSTER BEAM A3 178 6.5.1 Introduction 178 6.5.2 Numerical modelling of Beam A3 179 6.5.3 Results of numerical modelling for Beam A3 180
6.6 NUMERICAL MODELLING AND RESULTS FOR ULSTER BEAM B3 184 6.6.1 Introduction 184 6.6.2 Numerical modelling and results for Ulster Beam B3 184
6.7 SUMMARY OF THE MODELLING AT ELEVATED TEMPERATURE 190
7 PARAMETRIC STUDIES ON CELLULAR COMPOSITE BEAMS AT ELEVATED TEMPERATURE 191 7.1 INTRODUCTION 191 7.2 WEB IMPERFECTIONS 191 7.3 TEMPERATURE DISTRIBUTION 194
7.3.1 Effect on symmetric beam 195 7.3.2 Effect on asymmetric beam 198
7.4 LOADING TYPE AND WEB STIFFENER 200 7.4.1 Effect on symmetric beam 200 7.4.2 Effect on asymmetric beam 206
7.5 LOAD RATIO 209 7.6 THICKNESS OF WEB STIFFENER 211 7.7 SUPPORT CONDITIONS 212
7.7.1 Effect on symmetric beams under point load 212 7.7.2 Effect on symmetric beams under a UDL 215 7.7.3 Effect on asymmetric beams under point load 216

CELLULAR BEAMS AT AMBIENT AND ELEVATED TEMPERATURES
5
7.7.4 Effect on asymmetric beams under a UDL 218 7.7.5 Interaction between cellular beam and end supports (catenary
action) 224 7.8 SUMMARY OF THE CASE STUDIES ON CELLULAR
COMPOSITE BEAMS AT ELEVATED TEMPERATURE 229
8 CONCLUSIONS & RECOMMENDATIONS 231 8.1 CONCLUSIONS 231 8.2 RECOMMENDATIONS AND FUTURE WORK 236 REFERENCES 238
Main text word count: 42,672
CELLULAR BEAMS AT AMBIENT AND ELEVATED TEMPERATURES
6
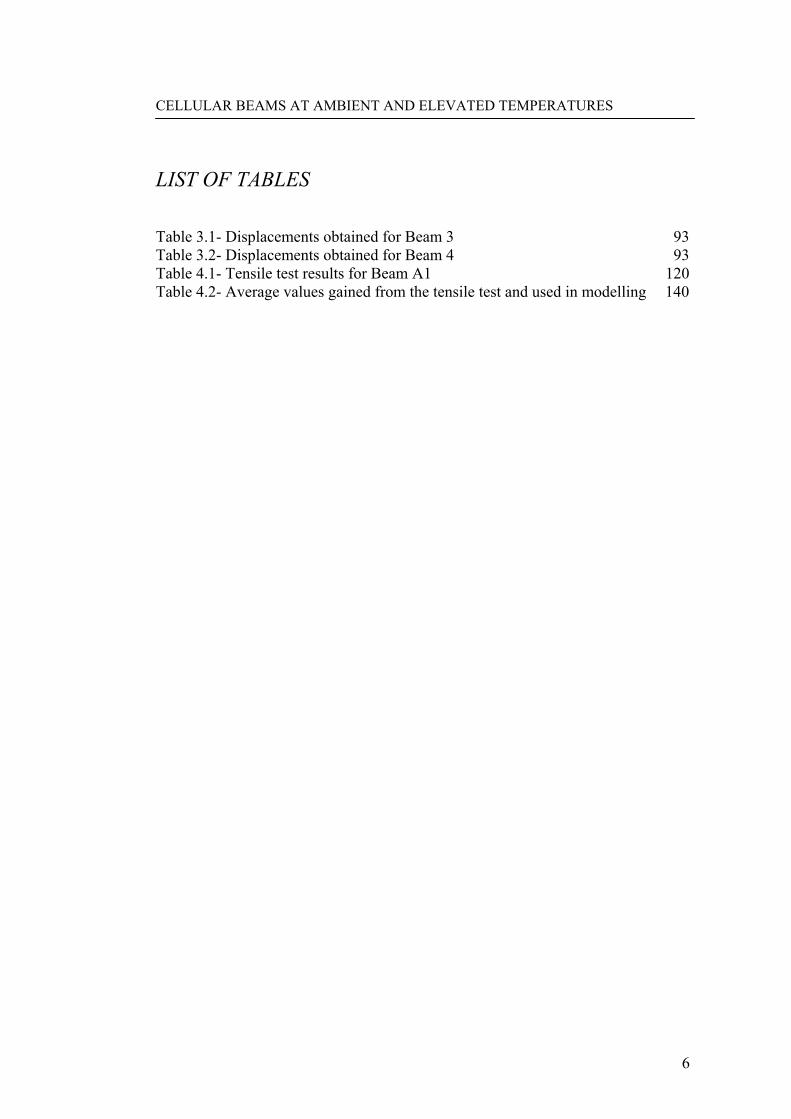
LIST OF TABLES
Table 3.1- Displacements obtained for Beam 3 93 Table 3.2- Displacements obtained for Beam 4 93 Table 4.1- Tensile test results for Beam A1 120 Table 4.2- Average values gained from the tensile test and used in modelling 140

CELLULAR BEAMS AT AMBIENT AND ELEVATED TEMPERATURES
7
LIST OF FIGURES
Figure 2.1-Nominal fire curves based on BSEN1991-1-2 and PD7974 (Source: http://www.mace.manchester.ac.uk/project/research/structures/strucfire/default.htm)............................................................................................................... 27
Figure 2.2- Time-temperature curve of a natural fire and the 5 phases.................. 31 Figure 2.3- Angelina beam produced by Arcelomittal ........................................... 36 Figure 2.4- Cellular beams fabricated from steel plates used in Fabsec (Source:
www.fabsec.co.uk) ......................................................................................... 37 Figure 2.5- Cutting pattern of Castellated and Cellular beams............................... 39 Figure 2.6- Comparing use of infill plates in cellular and castellated beams......... 39 Figure 2.7- Geometry of the CTICM Beam P1 ...................................................... 44 Figure 2.8- Geometry of the CTICM Beam P2 ...................................................... 45 Figure 2.9- Applying various fire protections at various sections of the CTICM
Beam P2.......................................................................................................... 45 Figure 2.10- Failure of the protected CTICM Beam P2 due to web post buckling
after removing the fire protection (Source: test report (Joyeux, 2003)) ......... 46 Figure 2.11- Indicative furnace test on unloaded protected cellular and solid beams
with similar geometric details......................................................................... 47 Figure 2.12- Steel being exposed at the proximity of the holes as the protection fell
off.................................................................................................................... 48 Figure 2.13- Full scale compartment test by the University of Ulster with cellular
beams .............................................................................................................. 50 Figure 2.14- Forces applied to a web post and the critical section to check to web
post.................................................................................................................. 52 Figure 2.15- Design curves proposed in P100 to check the flexural and buckling
capacity of the web post.................................................................................. 53 Figure 2.16- The ‘Strut’ model for web post buckling proposed by Lawson......... 54 Figure 2.17- CTICM model for the web post buckling .......................................... 55 Figure 2.18- Different approaches to consider the critical section in the Tees ...... 56 Figure 2.19- The circular opening represented by an equivalent rectangle (for the
Vierendeel bending check) and applied forces ............................................... 58 Figure 2.20- The Riks method ................................................................................ 62 Figure 3.1- Details of Natal Beam 4B .................................................................... 65 Figure 3.2- Half of the Natal Beam 4B modelled in ABAQUS ............................. 66 Figure 3.3- Material specifications used in FE model ............................................ 67 Figure 3.4- Half of the Natal Beam 4B modelled in ANSYS................................. 68 Figure 3.5 - Sensitivity study on the mesh size, Natal Beam 4B............................ 69 Figure 3.6- Load steps applied to the Natal Beam 4B in which load has increased
with a high rate in elastic region and low rate while plasticity....................... 70 Figure 3.7-Comparison between General and Arc-length method ......................... 71 Figure 3.8- First buckling mode of Natal Beam 4B gained by ABAQUS buckling
analysis............................................................................................................ 73 Figure 3.9- Comparison of the load-deflection curves according to the test and the
results obtained from ANSYS and ABAQUS ................................................ 74

CELLULAR BEAMS AT AMBIENT AND ELEVATED TEMPERATURES
8
Figure 3.10- Web post buckling of Natal Beam 4B using ABAQUS .................... 75 Figure 3.11- Development of S-shape web post buckling of the Natal Beam 4B
using ANSYS.................................................................................................. 75 Figure 3.12- Geometry of the Leeds Beam 2.......................................................... 76 Figure 3.13- (a) assumed stress-strain curve for Leeds Beam 2; (b) The (half) beam
geometry and B.C.s......................................................................................... 78 Figure 3.14- Test results versus ANSYS and ABAQUS results for Leeds Beam 2
assuming E= 205 kN/mm2 .............................................................................. 79 Figure 3.15- Test results versus ABAQUS for Leeds Beam 2 assuming E= 195
kN/mm2 ........................................................................................................... 81 Figure 3.16- Development of Von Mises stress with load increase ....................... 82 Figure 3.17- Boundary conditions applied to Beam 1 and Beam 2, for comparison
purposes .......................................................................................................... 83 Figure 3.18- Load-deflection curves for Beam 1, Beam 2 and the test .................. 84 Figure 3.19-Models developed to investigate the influence of the boundary
condition of the top flange on the behaviour of castellated beams................. 85 Figure 3.20- Failure due to excessive shear deformation of the web post in Model 1
and Model 2 .................................................................................................... 86 Figure 3.21- Failure due to S-shaped web post buckling in Model 3 ..................... 86 Figure 3.22- Out-of-web plane displacement contour ............................................ 87 Figure 3.23- Displacements of points A, B and C of Beam 1 and Beam 2 ............ 88 Figure 3.24- The beam and the applied material properties ................................... 89 Figure 3.25- Load-displacement comparison for different cases ........................... 90 Figure 3.26- Boundary conditions applied to beams 3 and 4 ................................. 90 Figure 3.27- Comparison of the load-deflection curves for the four beams........... 91 Figure 3.28- Sections investigated and naming used in details .............................. 92 Figure 3.29 Rotation of the top flange in Beam 3 (continuous restrain) compared to
Beam 4 (two point restraints).......................................................................... 94 Figure 3.30-Two samples of reaction compressive force applied by lateral supports
per node........................................................................................................... 95 Figure 3.31- Internal forces and interaction with lateral supports .......................... 96 Figure 3.32- Effect of lateral supports in the web buckling in numerical model ... 96 Figure 3.33- Expansion and shortening of the top and bottom flange respectively in
the solid webbed beam.................................................................................... 98 Figure 3.34- Out-of-web plane displacement contours indicating buckling and no
buckling in Beam 1 and Beam 2 respectively............................................... 100 Figure 3.35- Load-deflections curves of beams one 1 and 2 ................................ 100 Figure 3.36- Typical bilinear curve for steel material and importance of load
increment ...................................................................................................... 102 Figure 3.37- A conceptual model to look at web post buckling ........................... 103 Figure 3.38- Half of Leeds Beam 3 modelled in ABAQUS benefiting from
symmetry ...................................................................................................... 104 Figure 3.39- Experimental versus modelling results for Leeds Beam 3............... 105 Figure 3.40- Web Buckling of the web post near end support in the long span
Leeds Beam 3................................................................................................ 106

CELLULAR BEAMS AT AMBIENT AND ELEVATED TEMPERATURES
9
Figure 3.41-Maximum principal stress which represent the tensile stress while buckling ........................................................................................................ 107
Figure 3.42-Minimum principal stress which represents the developed compression stress while buckling..................................................................................... 108
Figure 4.1 Typical Stress-strain relationship for concrete in compression to BSEN1994-1-2.............................................................................................. 113
Figure 4.2- Tension softening curves assumed for concrete................................. 113 Figure 4.3- Concrete in tension and fracture energy............................................. 114 Figure 4.4- Crack detection surface in concrete model ........................................ 116 Figure 4.5- Yield and failure surfaces defined for biaxial stress in concrete ....... 117 Figure 4.6- Details of the symmetric beam A1..................................................... 120 Figure 4.7- Providing high density of shear connectors to ensure 100% steel-
concrete interaction....................................................................................... 122 Figure 4.8- Test set up for Beam A1 .................................................................... 123 Figure 4.9- First buckling mode for Beam A1 from linear Eigenvalue analysis.. 124 Figure 4.10- Second buckling mode for Beam A1 from linear Eigenvalue analysis
...................................................................................................................... 125 Figure 4.11- Load-deflection comparison for Beam A1, FE model versus test ... 126 Figure 4.12- S-Shaped web post buckling of Beam A1 ....................................... 126 Figure 4.13- The web post bucking of the Beam A1............................................ 127 Figure 4.14- Von Mises stress contour plot to check Vierendeel mechanism...... 127 Figure 4.15- Max principal stress representing tensile stresses............................ 128 Figure 4.16- Maximum principal stress in tensile diagonals ................................ 129 Figure 4.17- Compressive force in the strut and tension in the opposite diagonal129 Figure 4.18- Min principal stress representing the compressive stress ................ 130 Figure 4.19- Min Principal stresses in compressive strut for Beam A1 ............... 131 Figure 4.20- Stress distribution after web buckling.............................................. 132 Figure 4.21- Details of the asymmetric beam B1 ................................................. 133 Figure 4.22- First buckling mode for Beam B1 based on linear Eigenvalue analysis
...................................................................................................................... 134 Figure 4.23- Second buckling mode for Beam B1 based on linear Eigenvalue
analysis.......................................................................................................... 134 Figure 4.24- S-shaped web buckling as the governing failure mode of Beam B1 135 Figure 4.25- Occurrence of the S-shaped web buckling of Beam B1 in the
ABQAUS model ........................................................................................... 135 Figure 4.26- Out-of-web plane displacement of the buckled web post ................ 136 Figure 4.27- Numerical and experimental results for Beam B1 ........................... 137 Figure 4.28-Plot of minimum principal stresses in Beam B1 while buckling...... 138 Figure 4.29- Geometric details of RWTH Beam 3............................................... 139 Figure 4.30-- Steel sheeting used in the RWTH Beam 3...................................... 141 Figure 4.31- The approach used for the slab thickness and steel decking............ 141 Figure 4.32- RWTH Beam 3 modelled in ABAQUS ........................................... 143 Figure 4.33-Web post buckling of the last web post gained in numerical and test
results ............................................................................................................ 143 Figure 4.34- Comparison of the model and test Load-Deflection curves for RWTH
Beam 3 .......................................................................................................... 144

CELLULAR BEAMS AT AMBIENT AND ELEVATED TEMPERATURES
10
Figure 5.1- Web post buckling of Beam A1 without web stiffeners, under a UDL at ambient temperature ..................................................................................... 146
Figure 5.2- Web post buckling of Beam A1 with web stiffeners, under a UDL at ambient temperature ..................................................................................... 147
Figure 5.3- Load-deflection curve of Beam A1 under a UDL with and without web stiffener ......................................................................................................... 147
Figure 5.4- Web post buckling of Beam B1 without web stiffeners, under a UDL and at ambient temperature........................................................................... 148
Figure 5.5- Web post buckling of Beam B1 with web stiffeners, under a UDL and at ambient temperature.................................................................................. 149
Figure 5.6- Load-deflection curve of Beam B1 under a UDL with and without web stiffener ......................................................................................................... 149
Figure 5.7- Comparing the load-deflection curves for Beam A1 assuming ductile and brittle behaviour for concrete after cracking in tension ......................... 151
Figure 5.8-Effect of web post imperfection in the load-deflection curve for Beam A1.................................................................................................................. 152
Figure 5.9- Effect of web post imperfection in the load-deflection curve for Beam B1.................................................................................................................. 153
Figure 6.1- Standard and slow fire curve to BSEN1991 ...................................... 157 Figure 6.2- Geometry of Beam A2 (Also Beam A1 and Beam A3)..................... 158 Figure 6.3- Stress- strain transform of steel at elevated temperature ................... 159 Figure 6.4- Stress- strain transform of concrete in compression at elevated
temperature ................................................................................................... 160 Figure 6.5- Stress-Strain relationship of concrete in tension at elevated temperature
...................................................................................................................... 160 Figure 6.6- Drucker-Prager failure surfaces for different temperatures ............... 161 Figure 6.7- Temperatures at bottom, middle and top of the concrete slab ........... 162 Figure 6.8- Position of the thermocouples on steel Beam A2 (Nadjai, 2007) ...... 163 Figure 6.9- Temperatures recorded by thermocouples 4a to 4f in zone 4 of Beam
A2.................................................................................................................. 165 Figure 6.10-Temperatures averaged and applied equally all over the beam length
...................................................................................................................... 166 Figure 6.11- Temperature profile over the length of Beam A2 at 45 minutes ..... 167 Figure 6.12- Temperature profile over the length of Beam A2 at 55 minutes ..... 167 Figure 6.13-Time- temperature curves resulted from averaging in all over the beam
length ............................................................................................................ 168 Figure 6.14- Test results against the numerical results of Beam A2 considering the
recorded and extrapolated temperatures ....................................................... 169 Figure 6.15- Initiation of buckling at 50 minutes ................................................. 170 Figure 6.16- Prediction of web buckling of Beam A2 in numerical modelling ... 171 Figure 6.17- The struts in compression to investigate the internal stresses.......... 173 Figure 6.18- Minimum principal stresses (representing compression) in the six
nodes ............................................................................................................. 173 Figure 6.19- Geometric details of asymmetric Beam B2 ..................................... 174 Figure 6.20- Position of thermocouples for Beam B2 (Nadjai, 2007).................. 175
CELLULAR BEAMS AT AMBIENT AND ELEVATED TEMPERATURES
11
Figure 6.21- Web post buckling in the Beam B2 (Source: The test report of the Ulster fire tests on cellular composite beams (Nadjai et al., 2007)) ............. 176
Figure 6.22- Web buckling of Beam B2 predicted by the developed numerical model ............................................................................................................ 177
Figure 6.23- Comparison of load-deflection curves for the test against numerical model ............................................................................................................ 177
Figure 6.24- Average of the temperatures recorded in the critical web post in Tests A2 and A3..................................................................................................... 179
Figure 6.25- Small areas used to calculate and apply the recorded temperatures more accurately............................................................................................. 180
Figure 6.26- Numerical versus experimental results for Beam A3 ...................... 181 Figure 6.27- Deformation at Time=24.16, Load increment number 262, web
buckling is developing .................................................................................. 182 Figure 6.28- Deformation at Time=24.16, Load increment number 263, Sudden
local buckling in the bottom Tee .................................................................. 182 Figure 6.29- Load-deflection curves by experiment and numerical model .......... 183 Figure 6.30- Final deformed shape of Beam A3 in ABAQUS............................. 184 Figure 6.31- Final deformed shape of Beam B3................................................... 185 Figure 6.32- Load-deflection curves of Beam B3 resulted from experiment and
model ............................................................................................................ 186 Figure 6.33- Time-deflection curves resulted from some of the approaches to
calibrate the numerical model for Beam B3 ................................................. 187 Figure 6.34- Furnace temperatures recorded by eight thermocouples for fire test on
Beam B3 ....................................................................................................... 188 Figure 7.1- Investigating the influence of web imperfection for Beam A2 at fire
conditions...................................................................................................... 192 Figure 7.2- Investigating the influence of web imperfection for Beam B2 at fire
conditions...................................................................................................... 193 Figure 7.3- Averaging the Temperatures along the beam length ......................... 196 Figure 7.4- Applying temperatures in details ....................................................... 197 Figure 7.5- The location of the critical web posts with regard to the moment and
shear: (a) Beam A2 and (b) Beam B2........................................................... 197 Figure 7.6- Comparing the time deflection curves resulted from employing the two
approaches to Beam A2 ................................................................................ 198 Figure 7.7- Temperature profile along the length of Beam B2 at 50 minutes ...... 199 Figure 7.8- Temperature profile along the length of Beam B2 at 65 minutes ...... 199 Figure 7.9- Comparing the time deflection curves resulted from employing the two
approaches to Beam B2 ................................................................................ 200 Figure 7.10- Out-of-web plane displacements for Beam A2 without stiffeners at 48
minutes.......................................................................................................... 201 Figure 7.11- Out-of-web plane displacements for Beam A2 without stiffeners at 63
minutes.......................................................................................................... 202 Figure 7.12- Final deformed shape showing the distorsional buckling at 75 minutes
...................................................................................................................... 202 Figure 7.13- A section of the mid-span of the beam at 61 minutes to schematically
present the P-∆ effect causing distorsional buckling.................................... 203
CELLULAR BEAMS AT AMBIENT AND ELEVATED TEMPERATURES
12
Figure 7.14- Slight out-of-web plane displacements of the bottom Tee at the mid-span at 21 minutes......................................................................................... 204
Figure 7.15- Out-of-web plane displacements at 49 minutes highlighting the critical role of web stiffener to limit the lateral displacement in bottom Tee........... 204
Figure 7.16-Final deformed shape of the beam failed due to web buckling in which bottom and top Tees are still in a straight line .............................................. 205
Figure 7.17- Comparing the performance of Beam A2 under point load and a UDL at elevated temperature for load ratio of 50%............................................... 206
Figure 7.18- Distorsional Buckling of Beam B2 without stiffener at 62 minutes 207 Figure 7.19-Final deformed shape of Beam B2 with stiffener under a UDL ....... 208 Figure 7.20- Comparing the performance of Beam B2 under a point load and a
UDL at elevated temperature for load ratio of 50% ..................................... 208 Figure 7.21- Sensitivity of symmetric Beam A2 to load ratio at elevated
temperature ................................................................................................... 209 Figure 7.22- Sensitivity of asymmetric Beam B2 to load ratio at elevated
temperature ................................................................................................... 210 Figure 7.23- Effect of web stiffener thickness on performance of cellular beams in
fire ................................................................................................................. 211 Figure 7.24- Sensitivity studies carried out on the loading type and support
restraints at elevated temperature.................................................................. 212 Figure 7.25- Load-deflection curves for the Beam A2 under point load and various
axial end support stiffness............................................................................. 213 Figure 7.26- The maximum lateral deflection of the bottom flange of the Beam A2
versus time for three different K values........................................................ 215 Figure 7.27- Load-deflection curves for Beam A2 under distributed load and
various K values............................................................................................ 216 Figure 7.28- Load-deflection curve for Beam B2 under point load and experiencing
various axial restraints .................................................................................. 217 Figure 7.29- Load-deflection curve for Beam B2 under line load experiencing
various axial restraints .................................................................................. 218 Figure 7.30- Local flange buckling, distortional buckling and web post buckling of
CBs................................................................................................................ 219 Figure 7.31- Minimum in-plane principal stress representing the compressive
stresses .......................................................................................................... 220 Figure 7.32-Local buckling of the Top Tee of the last opening ........................... 221 Figure 7.33-Uz plot at 15 minutes which shows shaping of overall distorsional
buckling in Beam A2, due to high end restraints (K=100%)........................ 222 Figure 7.34- Uz plot at 24 minutes, which shows development of the overall
distorsional buckling in Beam A2 and how it perturbed the web post ......... 222 Figure 7.35- Shaping of the overall distorsional buckling in Beam A2, at 61
minutes, (K=100%)....................................................................................... 223 Figure 7.36- Failure of the internal cellular beams due to distorsional buckling at
the full-scale fire test carried out by University of Ulster in 2010 ............... 224 Figure 7.37-Position of the nodes through the beam height ................................. 225 Figure 7.38- Axial Deflection of the nodes through the height of Beam A2 for
K=0%............................................................................................................ 226

CELLULAR BEAMS AT AMBIENT AND ELEVATED TEMPERATURES
13
Figure 7.39- Axial Deflection of the nodes through the height of Beam A2 for K=5%............................................................................................................ 226
Figure 7.40- Axial Deflection of the nodes through the height of Beam A2 for K=75%.......................................................................................................... 227
Figure 7.41- Axial Deflection of the nodes through the height of Beam B2 for K=25%.......................................................................................................... 228
Figure 7.42- Axial Deflection of the nodes through the height of Beam B2 for K=50%.......................................................................................................... 228
Figure 7.43- Axial Deflection of the nodes through the height of Beam B2 for K=75%.......................................................................................................... 229

CELLULAR BEAMS AT AMBIENT AND ELEVATED TEMPERATURES
14
NOMENCLATURE
A The cross sectional area of the structural element
Atf Area of the top flange of the beam
Abf Area of the bottom flange of the beam
Do Opening diameter in cellular beams
Hp The perimeter of the section which is exposed to fire
Gf Fracture energy of concrete
GFo Base value of fracture energy
Mmax Maximum allowable web post moment
Mb,NV,Rd Bending resistance of the bottom Tee reduced for axial tension and
shear
Me Web post capacity at its critical section
Mt,NV,Rd Bending resistance of the top Tee, reduced for axial compression
and shear
Mmax Bending capacity the Tee section at the critical section
Mvc,Rd Local composite Vierendeel resistance moment
Ncr, θ Elastic critical buckling capacity of the strut at temperature θ
Npl, θ Plastic axial resistance of the effective strut at temperature θ
Pcr Buckling capacity of the web (Euler load)
Pmax Axial capacity of the Tee section at the critical section
Po Acting local axial force at Tee at the critical section
VEd Design value of the shear force
d Depth of the web of the steel beam
fb Buckling strength of the web post
fb,θ Buckling strength of the web post at temperature θ
fcm Mean compressive strength of concrete
fck Concrete cylinder strength at 28 days
ft Tensile strength of concrete
fu Ultimate strength of structural steel

CELLULAR BEAMS AT AMBIENT AND ELEVATED TEMPERATURES
15
fy Yield strength of structural steel
hc Crack band width of concrete according to Bazant’s theory
ky,θ Strength reduction factor for steel at temperature θ
le Effective length of the equivalent rectangle web opening replacing
circular opening
t Thickness of the web of the beam
wi Associated scale factor for the ith buckling mode
θF,b Temperature at the bottom flange of the beam
χ Buckling coefficient
χfi Buckling coefficient at temperature θ
λ Non-dimensional slenderness
λfi Non-dimensional slenderness at temperature θ
ν Poissons ratio
φi ith mode shape of the buckling
δui Change of displacement

CELLULAR BEAMS AT AMBIENT AND ELEVATED TEMPERATURES
16
ABSTRACT
Cellular beams (CBs) have become increasingly popular in the UK and other countries over the recent years. However, the research into the behaviour of these beams has not advanced at the same rate. There is still no robust codified guidance available to design cellular beams and cellular composite beams at ambient and elevated temperatures.
Meanwhile, numerical simulation approaches, such as Finite Element (FE) analysis, have enabled the researchers to advance their investigations into various behavioural aspects of these beams.
In this research, the developed numerical models using the ABAQUS package were able to predict, to a high accuracy, the failure mode and failure load (temperature) of CBs and cellular composite beams at ambient and elevated temperatures.
Within the investigations on cellular beams, it was found that predicting the correct failure mode by FE models can be extremely sensitive to the maximum load increment allowed in the software (for elastic-perfectly plastic stress-strain relationship for steel material) and also to the applied boundary conditions. In particular, slight changes in the boundary conditions applied to the top flange of the beam, can change the failure mode from web post buckling to Vierendeel mechanism.
The buckling resistance of the web post of cellular composite beams was found to be sensitive to the amplitude of web imperfections at ambient temperature. However, the ultimate resistance of these beams was not affected by the amplitude of web imperfections at elevated temperature. This suggests that the ‘Strut’ model used in current design method to estimate the buckling resistance of the web post is not reasonable at elevated temperature and needs to be modified.
The failure of cellular composite beams under a uniform distributed load (UDL) and at elevated temperatures, was governed by distorsional buckling before the development of web post buckling. Adding full-height web stiffeners to the beam in such cases improved their loading resistance at ambient temperature by up to 15% and prevented the occurrence of distorsional buckling at elevated temperature.
Increasing the end-restraints decreased the deflections of CBs which are governed by catenary action at elevated temperature. However, this also critically promoted the occurrence of web post buckling which could be due to the P-∆ effects and instabilities resulting from the restrained expansion of the beam.
Asymmetric beams showed a higher sensitivity and vulnerability to the magnitude of the load ratio than symmetric sections. This suggests a more prudent approach for the fire design of asymmetric beams as opposed to symmetric beams.

CELLULAR BEAMS AT AMBIENT AND ELEVATED TEMPERATURES
17
DECLARATION
No portion of the work referred to in the thesis has been submitted in support of an
application for another degree or qualification of this or any other university or
other institute of learning.

CELLULAR BEAMS AT AMBIENT AND ELEVATED TEMPERATURES
18
COPYRIGHT
I. The author of this thesis (including any appendices and/or schedules to this
thesis) owns any copyright in it (the “Copyright”) and he has given The
University of Manchester the right to use such Copyright for any
administrative, promotional, educational and/or teaching purposes.
II. Copies of this thesis, either in full or in extracts, may be made only in
accordance with the regulations of the John Rylands University Library of
Manchester. Details of these regulations may be obtained from the
Librarian. This page must form part of any such copies made.
III. The ownership of any patents, designs, trade marks and any and all other
intellectual property rights except for the Copyright (the “Intellectual
Property Rights”) and any reproductions of copyright works, for example
graphs and tables (“Reproductions”), which may be described in this thesis,
may not be owned by the author and may be owned by third parties. Such
Intellectual Property Rights and Reproductions cannot and must not be
made available for use without the prior written permission of the owner(s)
of the relevant Intellectual Property Rights and/or Reproductions.
IV. Further information on the conditions under which disclosure, publication
and exploitation of this thesis, the Copyright and any Intellectual Property
Rights and/or Reproductions described in it may take place is available
from the Head of School of Mechanical, Aerospace and Civil Engineering
(or the Vice-President).
CELLULAR BEAMS AT AMBIENT AND ELEVATED TEMPERATURES
19
To My Parents

CELLULAR BEAMS AT AMBIENT AND ELEVATED TEMPERATURES
20
ACKNOWLEDGEMENTS
I would like to express my appreciation and sincere gratitude to my supervisor,
Professor Colin Bailey, for his constant guidance, enthusiastic advice and critical
review of my work throughout this research project. Professor Bailey gave me the
opportunity to advance my knowledge up to a professional level by being an
excellent mentor and allowing me to attend international conferences. I am also
grateful to him for letting me work part-time at the period that I faced serious
financial problems and also fully supporting me towards getting an emergency
fund from the University in order to focus on my research with no delays and
hectic.
My Special thanks go to my colleagues and friends whom I have shared the same
office with, for their support and continued warm and honest friendships during my
studies at the University of Manchester. I would like to also thank Dr. Ehab
Ellobody for helping me with ABAQUS and the University staff, especially
Carmela Venosa-Ridyard and Christine Jinks, for their continued assistance and
support.
Finishing this course would have been very difficult without the support of the
Steel Construction Institute (SCI). In special, I am grateful to Dr Ian Simms and
Dr. Graham Couchman for being flexible and supportive and also giving me the
chance to focus on completing my thesis.
And last but no means least, I am eternally grateful to my parents, for their endless
patience, care, love and encouragement during this project. Without their
inspiration and support, I would not have made it. I gratefully dedicate the thesis to
them.

CELLULAR BEAMS AT AMBIENT AND ELEVATED TEMPERATURES
21
1 INTRODUCTION
1.1 BACKGROUND
It has always been one of the major concerns of construction engineers to optimise
the material usage in structural elements. One of the major advances in this regard
has been to split and expand steel beams. Perforated beams, and in particular
cellular beams, not only have notably higher bending capacity compared to the
parent section, but they are also more convenient in terms of passing service pipes,
wires and ventilating ducts through perforations (Chung, 2002). This crucially
reduces the height of floors, which is especially important in design of high-rise
buildings.
The performance and mode of failure of cellular beams varies depending on the
geometric details of the beam. Various simple design methods have been presented
for cellular beams to check the beam’s resistance against web post bucking,
Vierendeel mechanism and other failure modes. However, there is still no robust
codified design method available for the beams with web openings. The only
codified design guide was provided in the National Annex N of BSENV1993-1-1
(BSI, 1998) which was superseded later on due to reliability concerns.
The composite use of cellular beams with a concrete slab has become increasingly
popular within which the resulted section benefits from the concrete’s compressive
strength and steel’s tensile strength. This composite action has also added to the
complexities of implementing simple methods to design cellular composite beams
(Lawson and Hicks, 2009). Some tests were carried out to provide the researchers
with experimental data to calibrate the proposed analytical models and more
importantly to validate the numerical models to investigate the performance of
CELLULAR BEAMS AT AMBIENT AND ELEVATED TEMPERATURES
22
these beams with various combinations of loadings, geometries, material properties
and boundary conditions.
One of the controversial issues over the recent years has been to estimate the fire
resistance of cellular composite beams and fire protection requirements. Very
limited test data was available in this regard until 2006 when University of Ulster
conducted a series of 6 tests on unprotected cellular composite beams, 2 at ambient
temperature and 4 at elevated temperature (Nadjai, 2007). These tests provided the
first set of test data on the performance of unprotected cellular composite beams at
elevated temperature.
In order to obtain a better understanding on how cellular beams and cellular
composite beams behave, this research includes studies into multiple aspects of
their behaviour at ambient and elevated temperatures. The investigations are based
on numerical studies where after implementing a numerical approach to simulate
the performance of these beams, the calibrated models were utilised for case
studies to investigate the effect of some critical factors. Conclusions of this
research provide useful information to be considered in modifying the current
design approaches and include a design recommendation for cellular beams
subjected to a UDL.
1.2 OBJECTIVES
The basic objective of this research was to gain a better understanding on how
cellular composite beams behave at ambient and elevated temperatures. In order to
achieve this, finite element models were developed using the ABAQUS package
and validated against various test data. In brief, the main objectives of this research
were:
• Validate the numerical models developed for cellular beams and investigate
some of the modelling issues, which do not allow the developed numerical
CELLULAR BEAMS AT AMBIENT AND ELEVATED TEMPERATURES
23
models to be able to predict the correct failure mode and failure load for
cellular beams.
• Validate the FE models for cellular composite beams at ambient
temperature
• Investigate the role of web imperfection and loading type on the
performance of cellular beams with symmetric and asymmetric geometries
• Validate the FE models for cellular composite beams at elevated
temperature
• Investigate the effect of temperature distributions, loading type,
imperfections and also support conditions on the performance of these
beams at elevated temperature
• Improving the performance of cellular composite beams subjected to a
UDL at ambient and especially elevated temperatures by adding full height
web stiffeners to prevent the distortional buckling
• Proposing a modification to the current design approach to estimate the
buckling capacity of the web post at elevated temperature.
1.3 OUTLINE OF THE THESIS
This thesis is divided into 8 chapters and the following is a description of each
chapter:
This chapter (Chapter 1) reviews a general background to this thesis, the work
involved in the research and the outline of the project.
Chapter 2 provides a literature background of the fire engineering as a discipline
and the two common approaches to design structures for fire safety. This chapter
then presents the history of the development of beams with web openings and
cellular beams as the most popular product. Finally, this chapter reviews the failure
modes of these beams, the relevant experimental studies conducted on cellular
beams and cellular composite beams at ambient and elevated temperatures and the

CELLULAR BEAMS AT AMBIENT AND ELEVATED TEMPERATURES
24
analytical models to predict the failure load and mode of cellular beams at various
conditions.
Chapter 3 is dedicated to the numerical modelling of cellular beams at ambient
temperature where developed models have been validated against various test data.
In addition, this chapter investigates some of the issues in numerical modelling of
cellular beams which do not allow the correct prediction of failure mode and
failure load by numerical models and also suggests solutions to overcome these
issues.
Chapter 4 includes the numerical approach implemented within ABAQUS to
simulate some tests carried out on cellular composite beams at ambient
temperature. The approach to model the rather complicated concrete material
within these numerical studies is also discussed in this chapter.
Chapter 5 presents the results of the case studies conducted on calibrated models
for cellular composite beams at ambient temperature. These case studies included
the effect of web imperfections, loading types (point load(s) or a UDL) and tensile
characteristics of concrete.
Chapter 6 is dedicated to the numerical approach implemented to model the
cellular composite beams at elevated temperature. The numerical results are
compared against test data and discussed in detail.
Chapter 7, investigates the effects of temperature distribution, support conditions,
utilization factor and web imperfection on the performance of cellular composite
beams at elevated temperature and proposes a modification to the current ‘Strut’
model presented by SCI (SCI, 1985) to estimate the web buckling capacity. This
chapter also presents the investigations on the effect of the loading type and gives a
design recommendation for cellular beams under a UDL.

CELLULAR BEAMS AT AMBIENT AND ELEVATED TEMPERATURES
25
Chapter 8 summarises the main conclusions of the work carried out on this
research project along with recommendations for further research work.

CELLULAR BEAMS AT AMBIENT AND ELEVATED TEMPERATURES
26
2 LITERATURE REVIEW
2.1 INTRODUCTION
This chapter reviews the literature of the topics covered in this research. In
particular, Section 2.2 describes the principles of the fire safety engineering and the
two common approaches, the prescriptive and performance based approach, to
design structures for fire safety. Section 2.3 presents some details about cellular
beams and compares them against their rival castellated beams. Some experimental
tests have been carried out on these beams to investigate their performance, failure
modes and to validate the simple design methods. Section 2.4 presents these tests
which are carried out on castellated and cellular beams as well as cellular
composite beams at ambient and elevated temperatures. Finally, this chapter
describes the common failure modes in beams with web openings and development
of the simple design methods proposed to check the design of cellular beams and
cellular composite beams at ambient and elevated temperatures.
2.2 FIRE DESIGN OF STRUCTURES
The main objective of the fire safety regulations is to ensure the protection of
human lives (occupants and fire fighters) in the first place and partly environment
and the property (building and its contents). Through many measures, including a
combination of active and passive fire protection systems, the objectives are:
• To minimise the incidence of fire by controlling fire hazards in the building
• To provide safe escape routes for evacuation of occupants and prevent fire
spread from the fire compartment to other sections of the building
• To ensure that the building remains structurally stable for a time period
adequate to evacuate the occupants and for the fire fighters, to rescue the
trapped occupants.
CELLULAR BEAMS AT AMBIENT AND ELEVATED TEMPERATURES
27
The minimum fire resistance period that buildings should be designed for is
specified in the approved document B of the building regulations for England and
Wales (FTA, 2008) in 30 minutes intervals from 30 to 120 minutes. These values
are defined based on occupancy type, building height and size, and sprinklers.
Currently, design of the structures for fire safety is based on prescriptive or
performance based approaches. The following sections present these two
approaches and compare them briefly.
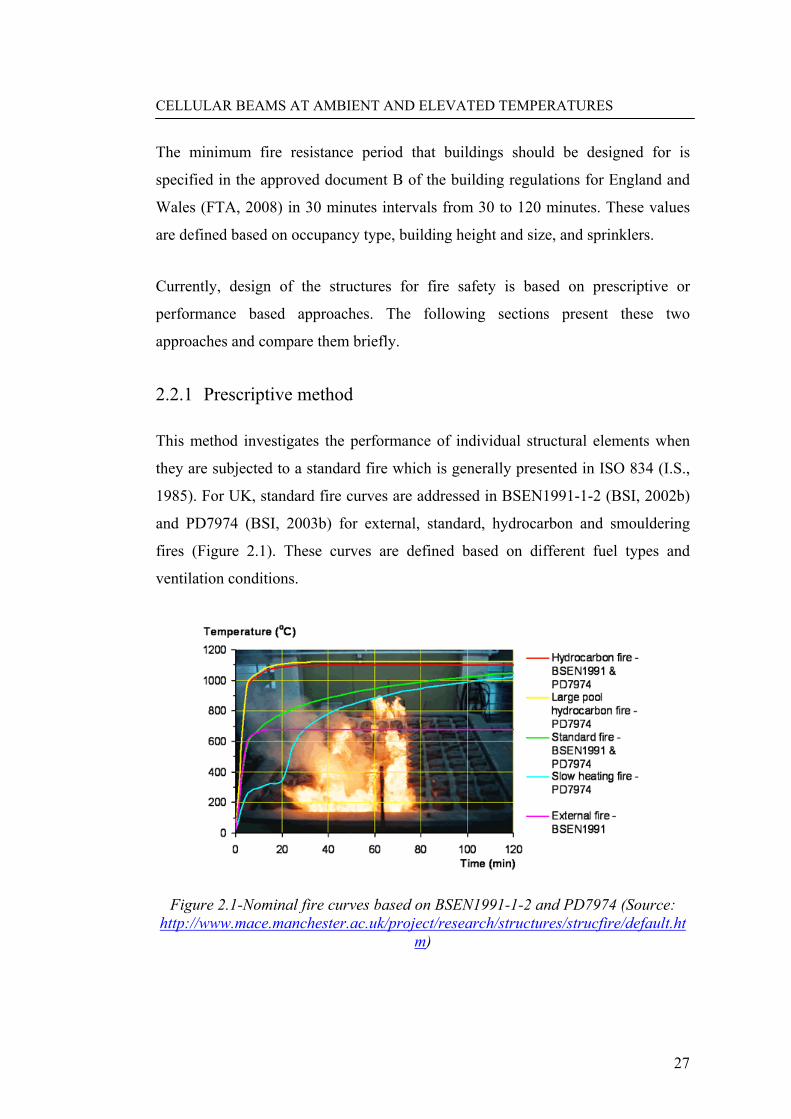
2.2.1 Prescriptive method
This method investigates the performance of individual structural elements when
they are subjected to a standard fire which is generally presented in ISO 834 (I.S.,
1985). For UK, standard fire curves are addressed in BSEN1991-1-2 (BSI, 2002b)
and PD7974 (BSI, 2003b) for external, standard, hydrocarbon and smouldering
fires (Figure 2.1). These curves are defined based on different fuel types and
ventilation conditions.
Figure 2.1-Nominal fire curves based on BSEN1991-1-2 and PD7974 (Source: http://www.mace.manchester.ac.uk/project/research/structures/strucfire/default.ht
m)

CELLULAR BEAMS AT AMBIENT AND ELEVATED TEMPERATURES
28
In the prescriptive method, the performance of the buildings against fire is
normally evaluated with three criteria: stability, integrity and insulation (BSI,
1987). Stability is the ability of the structural elements to resist the fire without
failing. In practice, the stability criterion is monitored by a limit for deflections
higher than span/30 with a maximum of span/20 for flexural members such as slabs
and beams. Integrity is assessed with ability of a separating element to prevent
passage of smoke and hot gas from the fireside to the other isolated sides. Finally,
insulation is the ability of an isolating element, to limit the temperature rise (to an
average of 140°C and a maximum of 180°C) on the unexposed face.
The prescriptive method does not require much expertise or advanced tools to be
exploited to design the structures for fire safety. However, there are increasing
concerns about this traditional approach:
• This method simply investigates the performance of one individual
structural element against the standard fire and excludes all the interactions
between different structural elements which can be very inaccurate and
conservative (non-economical), or sometimes even non-conservative(Bake
and Bailey, 2007a). A good example to show how non-economical this
approach can be is the development of membrane actions in the concrete
slab when the composite slab is subjected to fire. Utilising the effect of
enhancing membrane action in the fire design of composite floors has
significantly reduced the fire protection costs by excluding the costs
associated with fire protecting the secondary steel beams (Bailey and
Moore, 2000b; Bailey and Moore, 2000a) . However, if composite beams
are designed individually for fire then secondary beams need to be fire
protected or over designed to satisfy the design requirements for the fire
conditions.
• The standard fire curve, which is the basis of the prescriptive method, is an
ever-increasing curve and does not consider any cooling phases.
Nevertheless, in the fire tests and actual buildings engulfed in fire, it has

CELLULAR BEAMS AT AMBIENT AND ELEVATED TEMPERATURES
29
repeatedly been observed that a lot of structural damage and failures
actually happen due to high reversal strains that the structure experiences
during the cooling period (Peijun et al., 2008). Occurrence of ruptures in
the bolts and end plate connections (Wang, 2000) or occurrence of huge
tensile cracks in concrete slabs are some of the most common types of such
failures which are witnessed to take place during the cooling phase.
• The prescriptive method is generally restrictive and cannot provide reliable
measures of the robustness of the structures.
The above points have encouraged designers to incorporate a more realistic but
complicated approach, so called “Performance based method”, to design the
structures for fire safety.
2.2.2 Performance based method
The increasing concerns about the prescriptive method (Bailey, 2006) along with
the enhanced capabilities of numerical approaches to model integrated structures,
as opposed to individual elements, has raised interest in using the performance
based approach. This reliable and economical method is flexible and can be utilised
for structures of various types. However, extra expertise is needed to deal with the
complexities of this approach and designers are advised to consult experts in this
regard.
The performance based approach is constituted of three components: Fire
modelling, thermal modelling and structural modelling.
2.2.2.1 Fire behaviour
The aim of the fire modelling is to simulate the fire development to predict the
severity of the fire (gas temperatures and heat flux) on the structural elements.
Although the common approach is to represent the fire by a standard fire curve, the
fire safety design may also be based on more realistic design fires curves
(parametric fires) which are defined with regard to details of the compartment

CELLULAR BEAMS AT AMBIENT AND ELEVATED TEMPERATURES
30
specifically (Purkiss, 2007). Within these approaches, the fire curves and
corresponding thermal actions may be derived with regard to factors comprising
the fire load, heat release rate, size and geometry of the compartment, ventilation
factor and finally thermal characteristics of the boundaries of the compartment.
The identification of the relevant and realistic design fire scenarios is a vital aspect
of the fire safety design in the performance based approach. The design fire
scenarios used for the analysis of a building need to be deduced from the total
number of possible fire scenarios, which is infinite for most buildings. In other
words, only the ‘credible worst case’ fire scenarios need to be investigated.
When the design fire scenarios are chosen, a number of fire models are available to
assess the fire severity and calculate the corresponding thermal actions. Different
levels of fire models are relevant to the various stages of development of a natural
fire. Development of natural fires is generally divided into the 5 phases addressed
in Figure 2.2 and the severity of the fire in any of these phases depends on the
specifications of the compartment presented previously. When a fire is initiated, it
is localised within a compartment. Depending on the characteristics of the
compartment and the fire load, it can remain localised or become generalised to the
whole compartment. Localised fire refers to fires with no spread to the whole
compartment and happens when the fire spread is so slow. In localised fires, the
temperature increase is not adequate to cause flashover (BSI, 2003c). In
generalised fires however, the temperature increase is enough to cause flash over
and it is fair to assume a uniform temperature distribution throughout the fire
compartment. Generalised fires usually happen in small compartments or
compartments with low ventilation factors where the fire usually develops into a
fully engulfed fire.
There are various methods to define the fire severity for either localised or
generalised fires, which are briefly presented in the following sections.

CELLULAR BEAMS AT AMBIENT AND ELEVATED TEMPERATURES
31
Figure 2.2- Time-temperature curve of a natural fire and the 5 phases
2.2.2.1.1 Fire spread in localised fires
For localised fires, the fire severity can be defined by Fire Plume models, Zone
models or Computational Fluid Dynamics (CFD). The Fire Plume model (the
simplest of the three) uses the approach presented in BSEN1991-1-2 (BSI, 2002b)
which defines the thermal action depending on whether the flame reaches the
ceiling or not. However, the UK national annex does not accept this method and
refers to a method presented in PD7974-1 (BSI, 2003c) where the temperatures in a
fire compartment, in the fire growth phase, are predicted with a single formula.
The Zone models are computer models that divide a compartment into distinct
zones with uniform temperatures. This method is based on solving differential
equations for the conservation of energy and mass in a specific compartment.
Utilising CFD models is currently the most advanced and accurate approach to
define the fire severity and temperature distribution in a compartment. CFD models
are able to bring into account fluid flow and heat transfer effects to provide the
temperatures at every location within the compartment. This method is based on
solving thermodynamic and aerodynamic partial differential equations of the fluid
flow with regard to the boundary conditions, source and compartments details.

CELLULAR BEAMS AT AMBIENT AND ELEVATED TEMPERATURES
32
2.2.2.1.2 Fire spread in generalised fires
In generalised fires, all combustibles in the compartment are burning and the
amount of the heat being released is controlled by the ventilation or the type and
availability of the fuel in the compartment. There are also various approaches to
define the temperature growth in the compartment in generalised fires. Apart from
the simple way of considering standard fire curves in a fire design approach, the
designer can use the time equivalence method, natural fire curve method or
computer based zone or CFD methods to define the fire severity in a compartment
subjected to a generalised fire.
The time equivalence method is a simple approach to relate the actual temperature
of a structural member from predicted fire intensity to the time taken for the same
member to reach the same temperature when it is exposed to the standard fire
(Bailey, 2008). The time equivalence approach enables the designer to consider the
effects of the fire load as well as compartment size, ventilation and boundary
conditions.
The natural fire model defines the time-temperature curves by an energy equation
that deals with the balance of the heat in the compartment. This equation relates the
heat produced by the combustion to the heat loss by convection and radiation
through openings plus the heat loss by radiation and conduction through the
boundaries of the compartment (Drysdale, 1999; Karlsson and Quintiere, 2000).
Similar to the time equivalence method, this method also considers the effects of
the fire load as well as compartment size, ventilation factor and thermal properties
of the boundaries. In this approach, temperature is again assumed uniform inside
the compartment.
The basics of the zone models for generalised fires is similar to that described
earlier for the localised fires where the temperatures of each zone is defined based
on the mass and energy conservation. However, for generalised (post flashover)

CELLULAR BEAMS AT AMBIENT AND ELEVATED TEMPERATURES
33
fires, temperature is assumed to be uniform within the compartment and therefore,
one-zone models are used.
Similar to what was mentioned about the use of CFD models in localised fires,
CFD models can also be used for generalised fires as long as they are calibrated
against test data.
2.2.2.2 Thermal behaviour
Once the fire actions are calculated, the exchange of the heat between the gas and
the structural elements has to be calculated along with the temperature distribution
within the structural elements. The temperature distribution is generally dependent
to the radiation and convection characteristics of the surface of the members and
conduction of the heat within the members.
It may be reasonable to assume a uniform temperature distribution for materials
with a high thermal conductivity (such as steel) and ignore the thermal gradient
within members. However, this assumption is only valid when the member is not in
contact with a material with relatively low thermal conductivity (such as concrete).
In such cases, the material with low conductivity causes a heat-sink effect resulting
in a thermal gradient through the member with high thermal conductivity.
There are various ways to carry out heat transfer analysis for structural members.
There are simple design equations and tables provided in the codes (BSI, 2004b;
BSI, 2005b; BSI, 2005c) to define the temperature distribution within common
structural elements with regard to their thermal characteristics and fire exposure
type. However, estimating the heat transfer in materials such as concrete with a low
conductivity and high moisture content is difficult due to the high thermal
gradients. Therefore, use of simple design charts and tables (provided in the codes
for the heat transfer analysis) is generally not allowed with performance-based
approach, as these charts are resulted from standard fire tests. These charts can
only be used within the performance based approach if the fire behaviour is

CELLULAR BEAMS AT AMBIENT AND ELEVATED TEMPERATURES
34
represented by the standard fire curve. In any other cases where parametric curves,
zone models or CFD models are employed to assess the fire severity, the heat
transfer analysis should be used to investigate the thermal behaviour in structural
elements.
2.2.2.3 Structural behaviour
The final stage of the performance based approach is to assess the structural
performance of the structures subjected to the temperature distribution defined
within the heat transfer analysis. The structural behaviour can be assessed in three
levels: member analysis, sub-model analysis and global analysis.
In the member analysis approach, each member of the structure is assessed as
being separated from other members. The interaction with other members is
represented by appropriate boundary conditions. This simple method, which is
based on fundamental engineering principles, defines the loads at the fire limit state
using partial safety factors, which take into account realistic loads at the time of the
fire. BSEN1990 (BSI, 2002a) defines the load combination factors to be used in the
event of fire, which is categorised as an accidental condition, while the reduction
factors for the strength and stiffness at different temperatures for different materials
are also defined in the relevant design codes. The designer utilises the “Limiting
temperature” or “Moment capacity” method to define the fire resistance period of
individual elements and to decide on the fire protection requirements.
The limiting temperature method provides the designer with the maximum
temperature the section can reach before failure for a given load ratio (utilization
factors). This method can also be utilised to decide on the fire protection by
comparing the limiting temperature with the temperature of the hottest part of the
section at the required fire resistance time (the design temperature). BS5950 Part 8
(BSI, 2003a) includes a set of prepared design tables to check the fire design of
sections based on this approach.

CELLULAR BEAMS AT AMBIENT AND ELEVATED TEMPERATURES
35
The moment capacity method is based on assessing the fire resistance of a beam by
calculating its moment capacity given the temperature profile of the section at the
required fire resistance time. If the applied moment, which is calculated based on
the load combinations for the fire condition, is less than the moment capacity of the
beam at that time (temperature), the member provides the adequate fire resistance
without requiring fire protection. The method is limited only to beams with webs
which fulfil the section classification requirements for plastic or compact section.
However, observations based on full-scale fire tests (Bailey et al., 1999) have
proved that this method can be very conservative and unrealistic.
The idea of developing the structural model, from an individual element to a sub-
model, was followed after the full-scale Cardington fire tests. This approach takes
into account a limited part of the structure in the structural assessments and is
applicable with any fire models. The interactions with other parts of the structure
are again reflected by using appropriate boundary conditions. For Cardington test
(BSP, 1999), the developed simple sub-structure model (Newman et al., 2006;
Bailey, 2001) was based on considering the enhancing effects of the membrane
action of floor slabs along with the beneficial effect of the grillage of the secondary
beams acting compositely with the slab.
Finally, the most comprehensive approach is to model the whole structure using the
finite element method. This method is generally more accurate, reliable and
economical which provides a better evidence of the overall performance of the
structure, interaction between the structural elements and weak points of the
structures. However, this method is not necessarily detailed enough for localised
behaviour such as reinforcement fracture or failure of connections and extra
detailed models can be specifically developed to investigate local failures, which
are of special interest or have critical consequences.
CELLULAR BEAMS AT AMBIENT AND ELEVATED TEMPERATURES
36
2.3 BEAMS WITH WEB OPENINGS
In 1910, Horton, who was a member of the Chicago Bridge and Iron works, for the
first time proposed cutting the beam web and reassembling the two halves to
increase the section modulus, (Das and Seimaini, 1985). The idea of castellated
beam was proposed later in 1935 by Geoffrey Boyd who was a structural engineer
in the British Structural Steel Company (Knowles, 1991). Invention of castellated
beams which were previously known as ‘Boyd beams’, brought him the British
Patent award in 1939. Following the developments, cellular beams were first
introduced to the steel construction industry in 1987 by the steel manufacturer
Westok (Westok, 1985) who are the current world-wide patent holders of cellular
beams. These beams seem to be a significant development in steel construction in
the past 20 years. Since 1997, these beams have been used in over 4000 projects
and 20 countries.
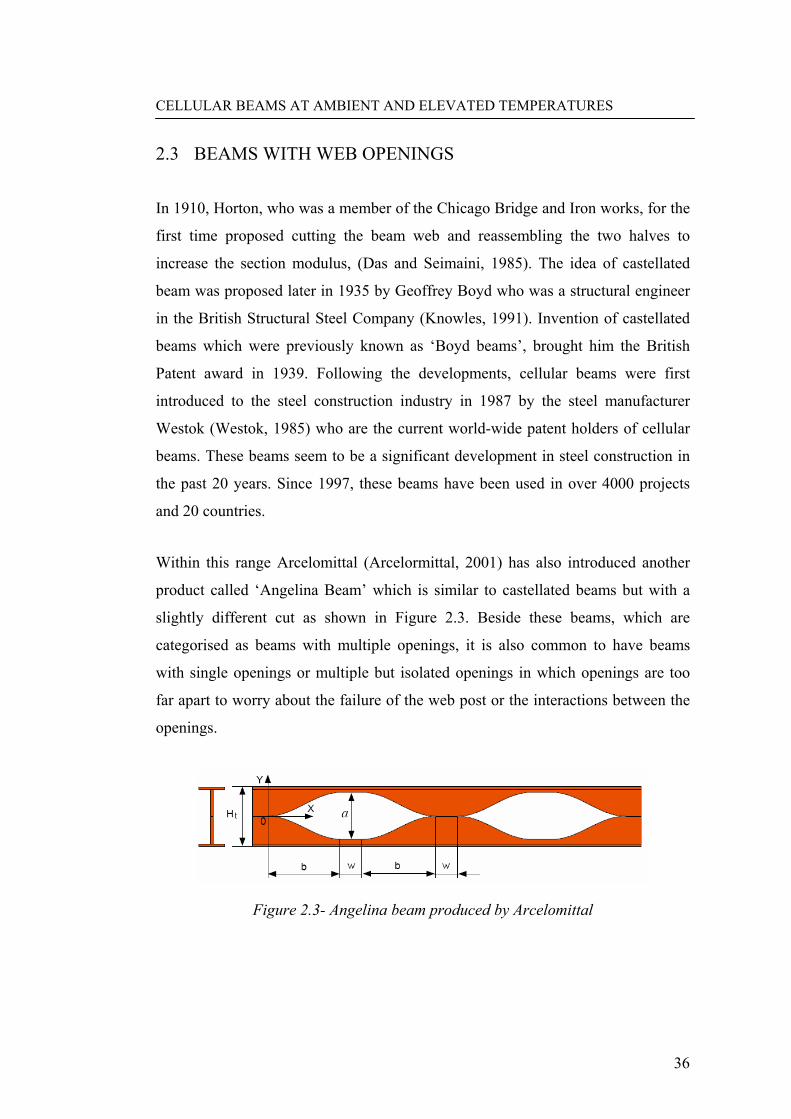
Within this range Arcelomittal (Arcelormittal, 2001) has also introduced another
product called ‘Angelina Beam’ which is similar to castellated beams but with a
slightly different cut as shown in Figure 2.3. Beside these beams, which are
categorised as beams with multiple openings, it is also common to have beams
with single openings or multiple but isolated openings in which openings are too
far apart to worry about the failure of the web post or the interactions between the
openings.
Figure 2.3- Angelina beam produced by Arcelomittal

CELLULAR BEAMS AT AMBIENT AND ELEVATED TEMPERATURES
37
2.3.1 Fabrication of cellular beams
Cellular beams are currently manufactured using two methods. In the first method
which is used in Westok Company(Westok, 1985), they are manufactured by
cutting and welding a solid webbed beam by which the resulted cellular beams can
be up to 1.6 times deeper than its parent section. This procedure is similar to the
way the castellated beams are manufactured. Alternatively, the cellular beams are
fabricated as built-up sections from steel plates using automated flame-based
cutting and welding techniques. The web and flange plates are welded together
using a double-sided process with a thin wire submerged arc which creates a 7 mm
fillet weld in a single pass. This method is being used in the other major producer
company of cellular beam in the UK called Fabsec (Fabsec, 2004).
Figure 2.4- Cellular beams fabricated from steel plates used in Fabsec (Source:
www.fabsec.co.uk)
2.3.2 Cellular beams versus castellated beams
Both cellular and castellated beams provide passage for the utilities and have high
strength to weight ratio as opposed to solid beams, which results in lighter and
more economical structures. However, various differences between the cellular and
castellated beams have made the cellular beams the successor of the two over the
recent years. Cellular beams produce perpetually more options than castellated
beams due to their greater flexibility in geometry. The profile and cutting pattering
of the castellated section is fixed whereas the main dimensions of a cellular beam
(finished depth, cell diameter and cell spacing) are flexible. Figure 2.5 compares

CELLULAR BEAMS AT AMBIENT AND ELEVATED TEMPERATURES
38
the standard cutting pattern of the castellated and cellular beam according to
British standard. This flexibility results in cellular beams being generally lighter
than even the most efficient castellated beams.
In addition to using lighter sections, a cellular beam usually requires less infill
plates than castellated beams. Web openings of castellated beams need to be
infilled at the two following occasions (Figure 2.6):
1. At the position of high shear, such as beam-ends or point loads. However,
the geometry of cellular beams can be selected in a way to give higher
shear resistance, which reduces the use of infill palates.
2. At connections with secondary beams. In cellular beams, however,
adjusting the diameter and cell spacing can keep the added infill plates to
a minimum.
Cellular beams also have another advantage over the castellated beams. They can
be fabricated as highly asymmetric sections in which the bottom Tee can be much
stronger than the top Tee. Use of asymmetric beams is especially efficient when
these beams are acting compositely with concrete slab and therefore the top Tee
does not have much contribution in the beam resistance. In contrast, castellated
beams can only be constructed as symmetric sections.

CELLULAR BEAMS AT AMBIENT AND ELEVATED TEMPERATURES
39
Figure 2.5- Cutting pattern of Castellated and Cellular beams
Figure 2.6- Comparing use of infill plates in cellular and castellated beams
2.4 INVESTIGATIONS ON BEAMS WITH WEB OPENINGS
During extensive experimental and numerical investigations conducted on beams
with web openings, various failure modes are observed which are briefly discussed
here along with the design approaches.

CELLULAR BEAMS AT AMBIENT AND ELEVATED TEMPERATURES
40
2.4.1 Experimental studies on castellated and cellular beams
Research on the performance of beams with multiple web openings was seriously
followed in 1964 when Kolosowski (Kolosowski, 1964) tested one castellated
beam to study its deflection and failure mode. The overall height of this beam was
150% of its parent section, the span to depth ratio was 10 and the web post had the
angle of 56.3o (this angle is 60o in UK sections). Kolosowski was expecting a
behaviour similar to a Vierendeel truss, However, the beam eventually failed due
to overall lateral torsional buckling as there was no lateral restraints provided
within the supports. In 1973, Husain and Speirs (Hosain and Speirs, 1973)
conducted twelve tests to investigate the effect of the opening geometry on the
mode of failure of these beams. In their tests they observed three different failure
types, flexural failure, Vierendeel failure and web post buckling.
Nethercot and Kerdal (Nethercot and Kerdal, 1982) suspected the vulnerability of
castellated beams to lateral torsional buckling and set up two series of tests with
different boundary conditions and for each case investigated a wide range of web
slenderness ratios. They concluded that web openings do not have a critical effect
on the beam’s lateral stability. The following researches also confirmed
Nethercot’s conclusion (Radić and Markulak, 2007).
The web post buckling was only known as a major failure of such beams since
1996 when Zaarour and Redwood (Zaarour and Redwood, 1996) tested 12 short
span (3000 mm) castellated beams with thin webs with minimum web post width
to opening depth ratio ranging from 0.18 to 0.26. Most of these beams failed due to
web post buckling and the rest failed due to lateral-torsional buckling. Redwood
(Redwood and Demirdjian, 1998) also focused more on the web post buckling and
tested four short span castellated beams with the UK cutting details. In his tests, he
observed a double curvature buckling shape in the web post of the all but the
longest beam in which the web buckled with a single curvature. The test results
showed that web post buckling loads were not sensitive to the moment/shear ratio.

CELLULAR BEAMS AT AMBIENT AND ELEVATED TEMPERATURES
41
With the introduction of the cellular beams to the UK market by Westok (Westok,
1985), research was mostly focused on the performance of these beams. The first
series of full scale destructive tests was carried out at Bradford University under
the supervision of the Steel Construction Institute (SCI, 1985). The results of these
tests were not published but the relevant design guide published later by the SCI,
titled P100 (Ward, 1990), mentioned that web post flexural buckling was observed
in the tests. These tests were followed by another set of 7 tests carried out at Leeds
University (Surtees and Li, 1995) again under the supervision of the Steel
Construction Institute. The aim was to seek greater accuracy in modelling the
behaviour of cellular beams under normal service loading as well as at the point of
failure. Based on these tests it was shown that use of full height web stiffeners at
the location of point loads invariably increased the loading resistance of the beam.
However, most of the tests were carried out without web stiffeners to promote the
most critical conditions in the test. The test data of two of these beams are used in
this thesis to calibrate the numerical models developed by the author for cellular
beams at ambient temperature which will be presented in Sections 3.4 and 3.5 of
this thesis.
A total of 8 destructive tests was carried out on cellular beams spanning between
3.1 m to 8.2 m at the University of Natal in 2001 (Warren, 2001). The aim was to
assess the reliability of the existing method presented by SCI and improve it where
necessary. All of these beams failed due to Vierendeel mechanism apart from one
beam which failed due to web post buckling. Warren concluded that the SCI
method was accurate in predicting the failure mode but generally over
conservative. The test data of one of these beams is again used in this research to
validate the numerical approach used to model the cellular beams. This will be
presented in Section 3.3 of this thesis.
CELLULAR BEAMS AT AMBIENT AND ELEVATED TEMPERATURES
42
2.4.2 Experimental studies on cellular composite beams at ambient
temperature
Recently some tests were also carried out on composite floors with cellular beams
to provide the data for calibrating the simple design methods and the numerical
models. In 2002, RWTH (Institute of Steel Construction) coordinated the ECSC
project where 4 cellular composite beams were tested (ECSC, 2003) in
Kaiserslautern. The first two beams were tested twice. For the first beam, after the
beam failed due to Vierendeel mechanism, they tested the same beam again but
with a plate welded across the opening which had failed. Adding this plate changed
the failure mode to web post buckling and increased the failure load from 806 kN
to 844 kN. The second beam, which was the only beam with an elongated opening,
was also tested twice. In the first test, just one point load was applied to the beam
and beam failed due to Vierendeel mechanism. In the second test, the same beam
was subjected to four point loads which were applied through secondary beams.
This time the beam failed due to excessive plasticity in the bottom Tee at the
elongated opening.
The third cellular composite beam was a highly asymmetrical section which failed
due to web post buckling in the test. This composite beam was also modelled in
this research as part of validation of the numerical models which were developed
for composite cellular beams at ambient temperature and is presented in Section
4.5.
The scope of test on the 4th beam was to check the behaviour of ring-stiffened,
half-closed or closed circular web openings. More details about these tests can be
found in the test report (RWTH, 2002) which are also summarised in the SCI
report RT1025 (Simms, 2004b).
A total of five tests have also been carried out by Arcelormittal (Arcelormittal,
2001) where the main focus has been on highly asymmetric cellular beams acting
compositely with a concrete slab (Simms, 2004b). In four of the five beams, the

CELLULAR BEAMS AT AMBIENT AND ELEVATED TEMPERATURES
43
test was terminated due to development of a plastic hinge in the top Tee of the
section. In one of these four cases, development of the plastic hinge in the top Tee
was initiated by crushing of the concrete. The failure of the fifth case was due to
web post buckling.
University of Ulster carried out two tests on cellular composite beams (one
symmetric and one asymmetric sections) at ambient temperature in 2005 (Nadjai,
2005). These tests provided the base for the four fire tests carried out later on the
same geometries. Both of the beams failed due to web post buckling at ambient
temperature. Numerical models were developed for these two beams in this
research and Sections 4.3 and 4.4 presents the details of the numerical approach to
calibrate the models. Further case studies were then carried out based on the
calibrated beams, which will be presented in the Chapter 5.
2.4.3 Experimental studies on cellular composite floors at elevated
temperature
There are a very limited number of fire tests conducted on cellular composite
beams at elevated temperature which are summarised in this section.
2.4.3.1 CTICM Fire Tests
CTICM (CTICM, 1962) carried out the first set of fire tests on two cellular
composite beams in which two beams were tested at Mets in 2003 (Joyeux, 2003).
These beams were fire protected and the main aim of the tests was to assess the
performance of the fire protection material and how the protected cellular beam
performs at elevated temperature.
2.4.3.1.1 CTICM cellular composite beam P1
CTICM beam P1 was designed to investigate the performance of fire protected
asymmetric cellular beams for which a fire test was conducted on a 7200 mm long

CELLULAR BEAMS AT AMBIENT AND ELEVATED TEMPERATURES
44
cellular composite beam. Top and bottom Tees were based on IPE300 and HEB340
respectively. See Figure 2.7 for the geometric details.
Figure 2.7- Geometry of the CTICM Beam P1
2.4.3.1.2 CTICM cellular composite beam P2
The second fire test was carried out on a symmetric section based on IPE400 and
the mid-span openings were filled (Figure 2.8). The focus of this test was to
investigate the effect of fire protection on the edges of openings for which three
different details of fire protection (according to Figure 2.9) were applied in
different sections of the beam.
Both beams tested by CTICM failed due to web post buckling and Figure 2.10
shows the failure of the Beam P2 after removing the fire protection.

CELLULAR BEAMS AT AMBIENT AND ELEVATED TEMPERATURES
45
Figure 2.8- Geometry of the CTICM Beam P2
Figure 2.9- Applying various fire protections at various sections of the CTICM Beam P2

CELLULAR BEAMS AT AMBIENT AND ELEVATED TEMPERATURES
46
Figure 2.10- Failure of the protected CTICM Beam P2 due to web post buckling after removing the fire protection (Source: test report (Joyeux, 2003))
2.4.3.2 Indicative fire tests by the University of Manchester
The decision to carry out indicative fire tests on protected cellular beam was made
after the concerns raised about the temperature of the web post being higher than a
similar solid beam. This was contradicting the assumption of the relevant guidance
given by SCI in publication P160 (Yandzio et al., 1996) which assumed similar
temperatures for a web post and a solid web with similar geometric details.
Unfortunately, the test results which were the basis of the concerning comment
were commercially confidential. The only released information was published in a
technical note (Note, 2002) and an article in the Structural Engineer magazine
(Service, 2003). They stated that the fire tests on protected cellular beams
consistently showed higher temperatures in the web posts than flanges. The
technical note also provided a guidance on the required thickness of intumescent
which was up to 50% higher than the thickness recommenced by the SCI approach.
To investigate the rate of temperature increase in the web post and compare it with
solid beams, a series of tests were conducted on unloaded, protected and

CELLULAR BEAMS AT AMBIENT AND ELEVATED TEMPERATURES
47
unprotected cellular and solid beams. The furnace test (Figure 2.11) showed that in
the beams with no fire protection, the flange and web post temperatures of the
cellular beams were slightly lower than the corresponding temperatures of the solid
beams (Bailey, 2003a). It was also observed that the ratio of the web to flange
temperature did not increase at a faster rate in the cellular beam compared to the
solid beam (Bailey, 2004).
Figure 2.11- Indicative furnace test on unloaded protected cellular and solid beams with similar geometric details (Source: test report (Bailey, 2003a))
Based on these observations, it was concluded that the notable difference between
the web of the protected cellular and solid beams has to do with the performance of
the fire protection material. Therefore, three set of indicative fire tests were
conducted on unloaded protected cellular beams with 0.8 mm water-based, 0.8 mm
solvent-based and 2.1 mm solvent based intoumescent coatings (Bailey, 2003b).
These tests were repeated for similar solid webbed beams. The aim was to compare
the temperatures of the web post against the web and investigate the performance
of fire protection material.
It was witnessed that in all three cases the web post and flange temperatures were
higher in the cellular beam than the corresponding temperatures of the solid

CELLULAR BEAMS AT AMBIENT AND ELEVATED TEMPERATURES
48
webbed beams. Moreover, the relative temperature variation between the web post
and bottom flange of the cellular beam was similar to that of the solid beam.
In the two tests with solvent based coating the char was swept away from the edges
of the cellular beam exposing the steel web (Figure 2.12). These tests also
highlighted that the temperature difference between the web post and bottom
flange in protected cellular beams depends on type and thickness of the
intumescent material.
Figure 2.12- Steel being exposed at the proximity of the holes as the protection fell off (Source: test report beam (Bailey, 2004))
2.4.3.3 Fire tests by the University of Ulster
Four full-scale destructive fire tests were conducted on unprotected symmetric and
asymmetric cellular composite beams in 2006 by the University of Ulster (Nadjai,
2007). Before these tests there was no test data on how unprotected cellular beams
behave under fire conditions and these beams provided researchers with valuable
information. All four tests were also investigated in this research and numerically
modelled for further investigations. Chapter 6 of this thesis presents the details of
the 4 fire tests and the numerical approach used to model these fire tests.

CELLULAR BEAMS AT AMBIENT AND ELEVATED TEMPERATURES
49
2.4.3.4 Fire tests by CTICM
In 2009, CTICM carried out four full scale fire tests on cellular beams spanning 8.8
metres which covered asymmetric sections and elongated openings (CTICM,
2008). One of these beams was equipped with half-height web stiffeners for each
web post to investigate their impact on delaying the failure due to web post
buckling. Two of these beams clearly failed due to web post buckling while there
was no clear failure mode observed in the other two tests which suggested that
these beams have failed due to global bending.
2.4.3.5 Full scale compartment test with cellular beams
University of Ulster also carried out a full-scale fire test in 2010 on a 15 metres
long and 9 wide compartment (Figure 2.13) as part of a European project (FiCEB).
The aim was to investigate the development of enhancing membrane actions in the
concrete slab when it is acting compositely with unprotected secondary cellular
beams. It was also interesting to see how cellular beams perform in fire while
interacting with other structural elements as opposed to furnace tests where they
are simply supported and free to expand at the ends. The final report for this test is
not available at the time of writing.
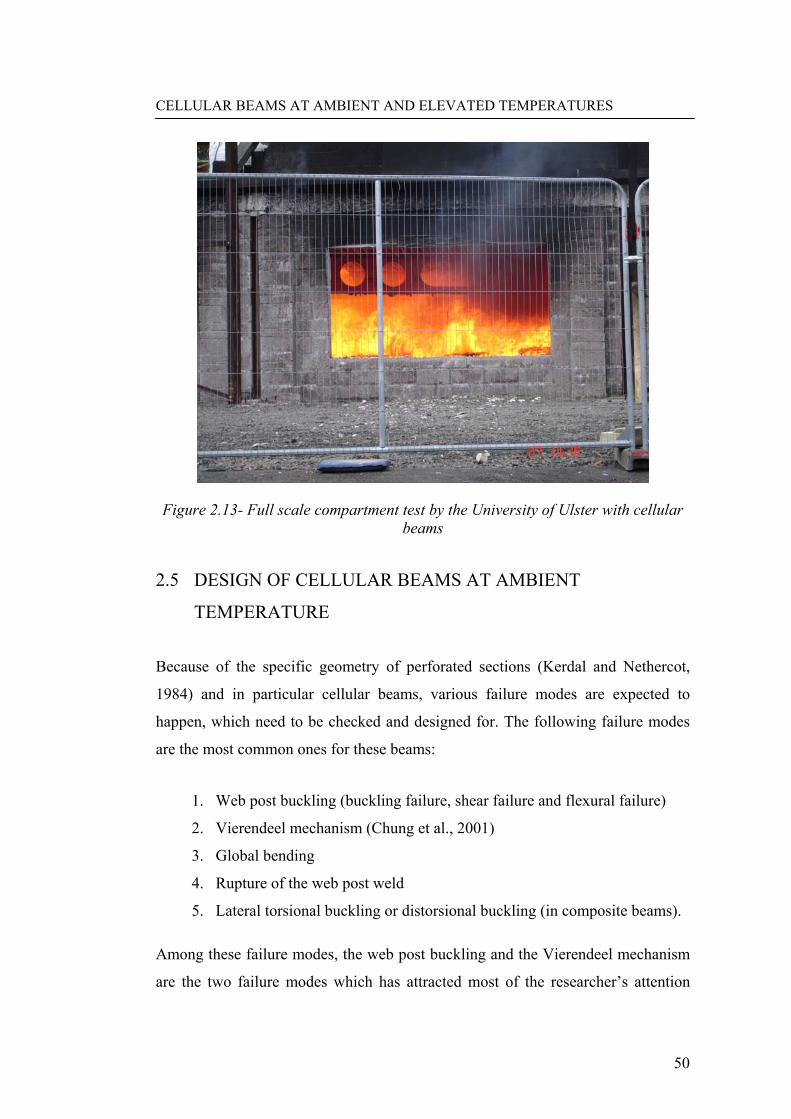
CELLULAR BEAMS AT AMBIENT AND ELEVATED TEMPERATURES
50
Figure 2.13- Full scale compartment test by the University of Ulster with cellular beams
2.5 DESIGN OF CELLULAR BEAMS AT AMBIENT
TEMPERATURE
Because of the specific geometry of perforated sections (Kerdal and Nethercot,
1984) and in particular cellular beams, various failure modes are expected to
happen, which need to be checked and designed for. The following failure modes
are the most common ones for these beams:
1. Web post buckling (buckling failure, shear failure and flexural failure)
2. Vierendeel mechanism (Chung et al., 2001)
3. Global bending
4. Rupture of the web post weld
5. Lateral torsional buckling or distorsional buckling (in composite beams).
Among these failure modes, the web post buckling and the Vierendeel mechanism
are the two failure modes which has attracted most of the researcher’s attention

CELLULAR BEAMS AT AMBIENT AND ELEVATED TEMPERATURES
51
over the years. The reason is not only because these two failure modes are the most
dominant failure modes of cellular beams, but they have been proved to be more
complex to formulate and codify through a reliable simple design method
compared to the other failure modes. The only codified design approach was
presented in the National Annex N of the BSENV1993-1-1 (BSI, 1998) which has
been withdrawn due to the concerns raised about the reliability of this design
approach especially to check for the web post buckling and vierndeel failure.
The following section briefly describes these two failure modes and the design
methods developed to check the cellular beams against these failure types at
ambient temeratures.
2.5.1 Web post buckling
Buckling of the web post is the most common failure mode in cellular beams
especially at elevated temperature as steel loses its stiffness with a higher rate than
its strength. This section presents the design methods to check for web post
buckling in CBs at ambient temperatures and Section 2.7 discusses the design
approach for at elevated temperatures.
The first robust design method for the buckling of the web post was presented by
Ward in SCI publication P100 (Ward, 1990). His approach was that the ultimate
strength of a web post is governed by two modes, either a flexural failure caused
by the development of a plastic hinge in a web post, or buckling of the web post.
The type of failure in the web post was assumed to be dependant on the geometric
details of the web post. He carried out a series of nonlinear finite element analysis
to develop the design curves for the web post which resulted in proposing the
following formula for the web post capacity:
3
2
02
01 C
DSC
DSC
MM
e
−⎟⎟⎠
⎞⎜⎜⎝
⎛−⎟⎟
⎠
⎞⎜⎜⎝
⎛= Equation 2-1

CELLULAR BEAMS AT AMBIENT AND ELEVATED TEMPERATURES
52
where:
S = Opening spacing
Do = Opening diameter
Mmax = Maximum allowable web post moment (Mmax= 0.9RVh)
Me = Web post capacity at section A-A of Figure 2.14
C1, C2 and C3 are constants defined as: 2
001 00174.01464.0097.5 ⎟
⎠⎞
⎜⎝⎛−⎟
⎠⎞
⎜⎝⎛+=
tD
tDC Equation 2-2
200
2 000683.00625.0441.1 ⎟⎠⎞
⎜⎝⎛−⎟
⎠⎞
⎜⎝⎛+=
tD
tDC Equation 2-3
200
3 00108.00853.0645.3 ⎟⎠⎞
⎜⎝⎛−⎟
⎠⎞
⎜⎝⎛+=
tD
tDC Equation 2-4
where t is the thickness of the web post.
Figure 2.14- Forces applied to a web post and the critical section to check to web post
This method presented the simple design curves given in Figure 2.15 to check the
flexural and buckling capacity of the web post.

CELLULAR BEAMS AT AMBIENT AND ELEVATED TEMPERATURES
53
Figure 2.15- Design curves proposed in P100 to check the flexural and buckling capacity of the web post
One of the drawbacks of the method presented in P100 was that it was only
applicable to symmetric beams and did not allow treatment of web post moment in
asymmetric sections.
Lawson from SCI (Lawson et al., 2002) proposed a new approach based on a
compression zone or ‘Strut model’ schematically shown in Figure 2.16. This model
was reasonably calibrated against nonlinear finite element analyses (Lawson et al.,
2006). One of the complexities in this approach was to establish a reasonable
effective length for the strut in buckling because of the compound stress pattern
around the opening. The effective length, which considers the stress variations
around the critical opening, was represented by a simple geometric model with a
restraint point in the middle of the strut, and was calibrated against a range of finite
elements studies.

CELLULAR BEAMS AT AMBIENT AND ELEVATED TEMPERATURES
54
Figure 2.16- The ‘Strut’ model for web post buckling proposed by Lawson
For the effective web slenderness (λ) of the strut, this methods refers to the
approach given in BS5950-1 (BSI, 2000) or BSEN1993-1-1 (BSI, 2005a). This
approach checks the buckling of the strut against the applied compressive force,
which is equal to the horizontal shear at the web post (Vh in Figure 2.16).
In 2005, Bitar from CTICM presented another approach to estimate the buckling
capacity of cellular beams which was calibrated against the tests conducted by
CTICM and some numerical models (Bitar et al., 2005). In this approach the first
step is to identify the critical section for web post buckling (Figure 2.17) using
some factors which are drived from a curve fitting process based on the numerical
studies. The applied compressive force in this section is then compared to the
design resistance of the web post, which is defined as a function of imperfection,
slenderness of the web post and a factor dependent to the spacing of openings.

CELLULAR BEAMS AT AMBIENT AND ELEVATED TEMPERATURES
55
Figure 2.17- CTICM model for the web post buckling
2.5.2 Vierendeel mechanism
Vierendeel mechanism is caused by the failure due to the formation of four plastic
hinges in the top and bottom Tees. The need to transfer the shear force across the
opening causes some secondary moments in the Tee section. The interaction of
these moments with the global bending moments and the local axial force due to
global bending, dominate the formation of plastic hinges in the Tees (Sherbourne
and Oostrom, 1972). Therefore, top and bottom Tees should be checked for
flexural capacity.
Ward (Ward, 1990) proposed a linear interaction relationship between the local
axial force and moment of the Tees (Equation 2-5) to evaluate their moment
capacity. The forces were the ones acting at the critical section of the Tees (causing
the highest concentration of stresses) to form the plastic hinges.
0.1maxmax
≤+M
MPPo Equation 2-5

CELLULAR BEAMS AT AMBIENT AND ELEVATED TEMPERATURES
56
In this equation, Pmax and Mmax were the axial and bending capacities at the critical
section and Po and M were the acting local axial force and moment at the critical
section.
The moment capacity of the Tees depends on the location of the plastic hinge. On
the other hand, the moment capacity is also dependent on the axial force and shear
force, which is again a function of the location of the plastic hinge. This requires an
iterative approach to define the critical section, which makes it not very favourable
for simple hand calculations.
However, there are recommendations on how to consider the critical section
(straight or curved sections as shown in Figure 2.18) and also about the angle of
the critical section to the vertical line. This angle normally varies between 0o to 28o
for standard sections and Ward recommended 25o (Ward, 1990).
Figure 2.18- Different approaches to consider the critical section in the Tees
Investigations showed that Ward’s method is too conservative as it only considers
the most critical section while beams can carry higher loads until the formation of
4 plastic hinges to cause failure due to Vierendeel mechanism. Liu and Cheng (Liu
and Chung, 1999) conducted a wide range of numerical studies to investigate the
neglected capacity of the beam due to stress redistribution before the formation of
4 plastic hinges. They found that the Ward approach was about 15% conservative
and recommended a parabolic interaction formula (Equation 2-6).

CELLULAR BEAMS AT AMBIENT AND ELEVATED TEMPERATURES
57
0.12
max
2
max
≤⎟⎟⎠
⎞⎜⎜⎝
⎛+⎟⎟
⎠
⎞⎜⎜⎝
⎛M
MPPo Equation 2-6
They also investigated the shear capacity of cellular beams in more detail using
numerical studies and suggested that a percentage of the flange (0.35tf) also
contributes in carrying shear stresses. They improved their proposed moment-shear
interaction to (Liu and Chung, 2003):
0.15.2
max
5.2
max
≤⎟⎟⎠
⎞⎜⎜⎝
⎛+⎟⎟
⎠
⎞⎜⎜⎝
⎛M
MPPo Equation 2-7
2.6 DESIGN OF CELLULAR COMPOSITE BEAMS AT
AMBIENT TEMPERATURE
The basics of the design models proposed to check for web post buckling and
Vierendeel mechanism in cellular composite beams is identical to those proposed
for cellular beams. The difference is that for cellular composite beams, the
distribution of forces in the web post and Tees, as well as the flexural resistance of
the top Tees is modified to consider the contribution of the concrete slab.
The SCI publications P068 and P100 included the first guidance on the design of
composite beams with web openings (Ward, 1990). The SCI approach showed
good agreement with some tests on composite beams (Lawson and Chung, 1992)
and was also presented by a similar guidance published by AISC (Darwin, 1990).
This approach was rather generic and did not consider the composite action in the
checks for Vierendeel bending. Moreover, it did not provide any details about the
distribution of forces between the steel beam and concrete slab. The other
deficiency of this method was that there was no consideration of the slab type,
degree of shear connection and decking system.

CELLULAR BEAMS AT AMBIENT AND ELEVATED TEMPERATURES
58
Lawson proposed a semi-empirical simplified method for cellular composite beams
(Chung and Lawson, 2001; Chung et al., 2003) which was based on his approach
for cellular beams presented earlier in Section 2.5.1. In this approach, the load
applied to the strut was modified with regard to the contribution of the concrete
slab.
For Vierendeel bending checks, the effect of composite action of the top Tee was
included in the Vierendeel bending check and forces acting on the Tees were also
modified (Lawson et al., 2006). For Vierendeel bending check, the circular opening
is generally replaced by an equivalent rectangular opening (Lawson and Hicks,
2009) and the forces presented in Figure 2.19 should satisfy the Equation 2-8.
According to Lawson’s approach (Equation 2-8), sum of the Vierendeel bending
resistances at the four corners should not be less than the design value of applied
Vierendeel moment, which is expressed as:
Mc,RdMt,NV,Rd
Mb,NV,Rd Mb,NV,Rd
VEd VEd
Mc,RdMt,NV,Rd
Mb,NV,Rd Mb,NV,Rd
VEd VEd
Figure 2.19- The circular opening represented by an equivalent rectangle (for the Vierendeel bending check) and applied forces
VEdle ≤ 2Mb,NV,Rd + 2Mt,NV,Rd + Mc,Rd Equation 2-8
where:
Mb,NV,Rd is the bending resistance of the bottom Tee reduced for axial tension and shear, VEd

CELLULAR BEAMS AT AMBIENT AND ELEVATED TEMPERATURES
59
Mt,NV,Rd is the bending resistance of the top Tee, reduced for axial compression and shear
Mc,Rd is the local composite Vierendeel resistance moment
VEd is the design value of the shear force (taken as the larger of the values at either end of the length le)
le is the length of the equivalent rectangular opening.
2.7 DESIGN OF CELLULAR COMPOSITE BEAMS AT
ELEVATED TEMPERATURES
The strut model by SCI is extended to estimate the buckling resistance of the web
post at elevated temperature by applying reduction factors for the material at
elevated temperature. SCI report RT1085 (Simms, 2007) includes the details of this
approach for web buckling check. The CTICM method presented earlier in Section
2.5.3 is also updated to estimate the buckling capacity of the cellular beams at
elevated temperature (Vassart et al., 2008). This approach uses an iterative
procedure to define the critical section for the web post buckling, at temperature θ,
by comparing the applied force and the resistance.
For Vierendeel failure, the common approach at ambient temperature is again
extended to include the material reduction factors with the increase of temperature.
These approaches have been established in the software available to design cellular
beams (including fire) such as Cellbeam by Westok or FBEAM by Fabsec.
However, implementing a simple design method which can be followed by hand
calculations has proved to be difficult as the iterative procedure of considering the
interactions between moment, shear and axial force, distribution of the forces
within the composite section and finding the critical section can be tedious to
follow by hand calculations. Some research is now being carried out by SCI
focusing on the some pragmatic simplistic assumptions, which does not affect the
reliability of the approach but allows for a simplified method that can be followed
by hand calculations.

CELLULAR BEAMS AT AMBIENT AND ELEVATED TEMPERATURES
60
2.7.1 Temperature distribution in cellular composite beams
Along with the investigation on the structural side, it is also critical to assume a
reasonable temperature distribution within the sections in the fire design of cellular
beams. As steel has a high thermal conductivity and low thermal capacity, there is
not much time delay between the steel temperature and air temperature. However,
the thermal characteristics of concrete means that concrete is notably less
responsive to the surrounding gas temperature.
The relative steel to gas temperature also depends on the Section Factor (Hp/A)
which is the ratio of the area exposed to the fire to its volume that absorbs the heat
(Simms, 2004a). Equation 2-9 is an empirical formula that relates the temperature
of the bottom flange to the gas temperature based on the section factor of the
bottom Tee. Recommendations and simple methods are provided in the
BSEN1994-1-2 (BSI, 2005c) to estimate the temperatures in the steel section, shear
studs and concrete slab. However, comparisons between the output of this
approach and recent test data (Nadjai et al., 2008) suggested that improvements can
still be made in the temperature distribution assumed in the cellular composite
beams.
⎥⎥⎦
⎤
⎢⎢⎣
⎡−⎟⎟
⎠
⎞⎜⎜⎝
⎛×+= 15065.0547bF,
BTM
p
AH
θ Equation 2-9
2.8 INTRODUCTION TO THE FINITE ELEMENT ANALYSIS
Use of the finite element analysis, which was implemented in 1943 (Pelosi, 2007),
has become increasingly popular over the recent years. Along with the advances in
computations, finite element packages are now playing a critical role in the design
of ordinary structures as well as research into new issues in structural engineering.
The basics of the finite element approach (Fagan, 1992) is to discretise the
structure into a number of nodes which are connected by elements. Displacement

CELLULAR BEAMS AT AMBIENT AND ELEVATED TEMPERATURES
61
interpolation functions (shape functions) (Zienkiewicz and Hinton, 1976) are
defined to simulate the variations within the elements and stress-strain
relationships to represent different materials. This method then derives the stiffness
matrix of elements and assembles the global stiffness matrix (K) which determines
a relationship between the nodal displacement vector (u) and the external forces
vector (F) presented in Equation 2-7. By introducing the boundary conditions, the
following equation can be solved for the unknown value, which is mostly
displacement in structural analyses. Equilibrium is attained when the virtual work
dissipated by the external forces is equal to the virtual strain energy for any
allowable virtual displacement (δu) of the deformed structure.
[ ] { } { }FuK =× Equation 2-7
The system of equations is solved in increments. Iterations in each increment
consider three types of nonlinearities associated with structural analysis.
Geometrical nonlinearities (Mackerle, 2002) to cover the P-∆ (second order)
effects, material nonlinearities which consider the materials with non-elastic
behaviours, and finally boundary nonlinearities which deal with contacts and
interactions between elements of separate bodies.
Geometrically nonlinear structures sometimes incur buckling or collapse
behaviour, where the load-displacement response shows a negative stiffness. This
post failure behaviour of the structure cannot be followed by the common Newton-
Raphson algorithm as the structure must release strain energy to remain in
equilibrium. The Riks method (Riks, 1984) allows for finding static equilibrium
states during the unstable phase of the response by decreasing the applied load to
find the maximum load that the failed structure can take at each stage (Figure
2.20). In this approach, the user just defines the load at the first iteration and has no
control over the load applied in the next iterations, which means this method
considers the load magnitude as an additional unknown. The Riks method solves
simultaneously for loads and displacements and another quantity is used to

CELLULAR BEAMS AT AMBIENT AND ELEVATED TEMPERATURES
62
measure the progress of the solution, which is the arc-length along the static
equilibrium path of the load-deflection curve. This approach provides solutions
regardless of whether the response is stable or unstable.
Figure 2.20- The Riks method

CELLULAR BEAMS AT AMBIENT AND ELEVATED TEMPERATURES
63
3 CELLULAR BEAMS AT AMBIENT TEMPERATURE
3.1 INTRODUCTION
This chapter presents the numerical approach used to model a Cellular Beam (CB)
at ambient temperature and compares the results of the numerical models
developed for various destructive tests against the test data. The calibration of the
numerical approach was conducted against test data of the tests carried out by
Leeds (Surtees and Li, 1995) and Natal (Warren, 2001) universities. In addition,
this chapter highlights some crucial points in the numerical modelling of CBs,
which might cause the numerical model to predict the wrong failure mode as
opposed to what was witnessed in the tests. In particular, this chapter investigates
the critical role of boundary conditions and time increments in the analysis of CBs,
especially when web post buckling occurs.
3.2 MODELLING CELLULAR BEAMS
The numerical models for single CBs were validated against three experiments
conducted on symmetric beams as follows:
1) Natal Beam 4B (Warren, 2001)
2) Leeds Beam 2 (Surtees and Li, 1995)
3) Leeds Beam 3 (Surtees and Li, 1995)
In this research, the following assumptions were taken within the nonlinear
analysis of CBs:
• Use of shell elements with a linear and quadratic deformation approach and
the ability to handle large strains, large deformations and plasticity.
• Geometrical as well as material non-linearity.

CELLULAR BEAMS AT AMBIENT AND ELEVATED TEMPERATURES
64
• Solver by iterations according to the Newton-Raphson method or using the
Riks (Arc-length) method, explained in Section 2.8, to investigate the post-
buckling behaviour.
• The stress-strain curve for steel was considered either according to the
results of the recorded one-dimensional tensile test, or the BSEN1992-1-1
(BSI, 2004a), BSEN1993-1-1 (BSI, 2005a) and BSEN1994-1-1 (BSI,
2004c) suggestions, were applied to the FE analysis when data were not
available.
• The section dimensions and thicknesses were assumed as nominal values
except the test samples in which actual section dimensions were measured
and available in the report.
• To reduce the computational time, only half of the beams were modelled
where possible and the symmetrical boundary conditions were applied.
Imperfections need to be considered in the modelling of CBs and Section 3.3.7
discusses the way they are defined and applied to the models.
3.3 MODELLING NATAL BEAM 4B
3.3.1 Introduction
A total of 8 cellular beams were tested in the University of Natal (Warren, 2001).
Two conveniently small sections, namely UB203X133X25 and UB305X102X25,
were used as parent sections to construct cellular beams with two ratios of opening
spacing to opening diameter. For each of the four resulted geometries, two loading
conditions were chosen: mid-point and third-point loading, in order to investigate
different web post slenderness ratios as well as loading patterns.
Out of these 8 beams, only one failed due to web post buckling which was Beam
4B. Since this research mainly focuses on the web post buckling failure mode, only
this beam was modelled in this study. The parent section of Natal Beam 4B was a
UB 305X102X25 and the cell diameters were 325 mm as shown in Figure 3.1.

CELLULAR BEAMS AT AMBIENT AND ELEVATED TEMPERATURES
65
Further details of the test are available in the test report (Warren, 2001) are not
repeated here.
Figure 3.1- Details of Natal Beam 4B
3.3.2 Modelling using ANSYS and ABAQUS
Two of the commercially available FE programs were used for this simulation,
ANSYS and ABAQUS. Using two well-known FE packages gave the opportunity to
compare the modelling approach used and their results. It was particularly useful to
compare the results knowing the fact that the approach used in the buckling of shell
elements is slightly different in the two software packages. Specifically, in ANSYS,
the occurrence of the web post buckling was probable even in the geometrically
perfect CBs. Whilst in ABAQUS, it was necessary to apply a minimum
imperfection in order to provoke the web post buckling failure mode. Various
approaches used to calculate and apply the web imperfections will be presented
and discussed later in this chapter.
Moreover, the mesh used in ABAQUS was generally finer than that of ANSYS. The
reason for this was that in ABAQUS, unlike ANSYS, there was no quadratic (8
noded) element with the ability to handle large strains and large deformations.
Hence, a finer mesh with 4 noded shells, especially in web posts, was applied to
compensate this deficiency and provide a better base for comparing the two
software packages. Sections 3.3.3 and 3.3.4 present the modelling approach within
ABAQUS and ANSYS respectively and Section 3.3.8 compares the results of the
numerical models developed within the two packages.
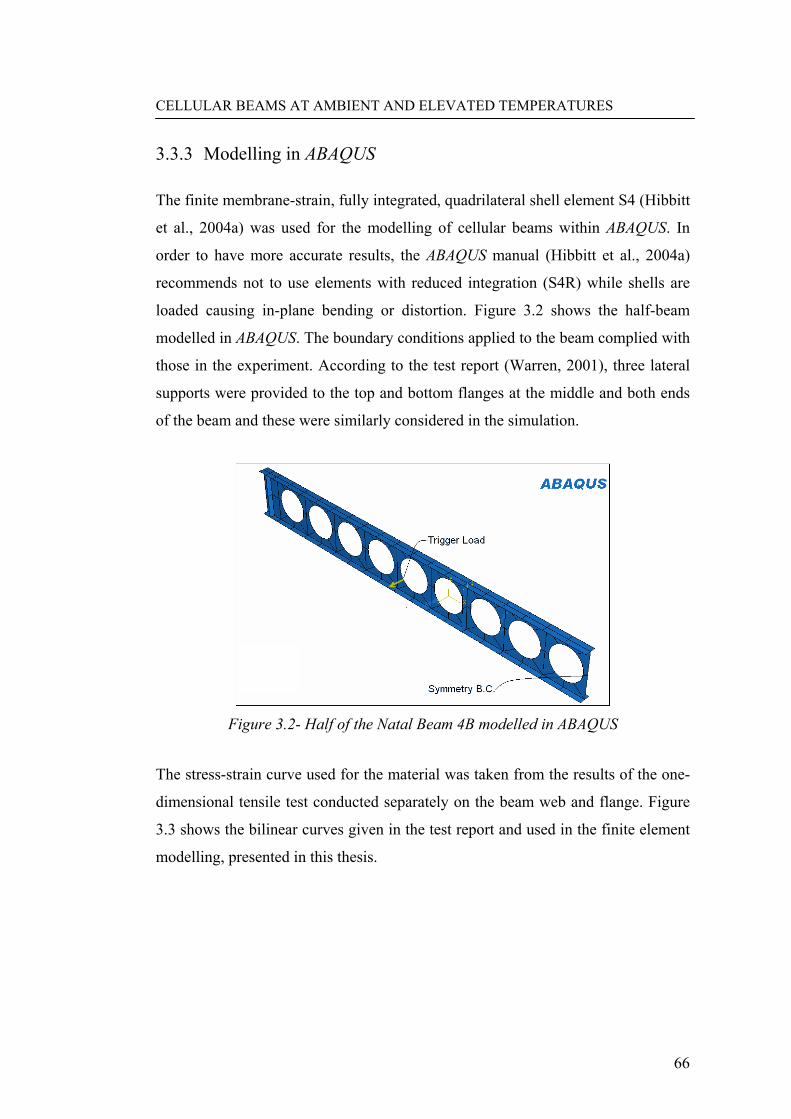
CELLULAR BEAMS AT AMBIENT AND ELEVATED TEMPERATURES
66
3.3.3 Modelling in ABAQUS
The finite membrane-strain, fully integrated, quadrilateral shell element S4 (Hibbitt
et al., 2004a) was used for the modelling of cellular beams within ABAQUS. In
order to have more accurate results, the ABAQUS manual (Hibbitt et al., 2004a)
recommends not to use elements with reduced integration (S4R) while shells are
loaded causing in-plane bending or distortion. Figure 3.2 shows the half-beam
modelled in ABAQUS. The boundary conditions applied to the beam complied with
those in the experiment. According to the test report (Warren, 2001), three lateral
supports were provided to the top and bottom flanges at the middle and both ends
of the beam and these were similarly considered in the simulation.
Figure 3.2- Half of the Natal Beam 4B modelled in ABAQUS
The stress-strain curve used for the material was taken from the results of the one-
dimensional tensile test conducted separately on the beam web and flange. Figure
3.3 shows the bilinear curves given in the test report and used in the finite element
modelling, presented in this thesis.

CELLULAR BEAMS AT AMBIENT AND ELEVATED TEMPERATURES
67
Figure 3.3- Material specifications used in FE model
3.3.4 Modelling in ANSYS
The 8-noded shell element, Shell93 (ANSYS, 2003) , with the ability to handle
large deformations, large strains and plasticity, was used in the simulation using
ANSYS. As mentioned, in ANSYS, unlike ABAQUS, the web post buckling of the
shell can occur with no imperfection. In other words, the solution algorithm in
ANSYS is more comprehensive and handles the buckling behaviour of perfect
structures at their critical load. Literally, a perfect plate, under a compressive force
in its plane, does not buckle in ABAQUS and either an imperfection or trigger load
needs to be used. Whereas in ANSYS, a plate buckles at its critical load. However,
this difference in the two software packages was not critical in modelling CBs, as
in most cases CBs were assumed imperfect due to their fabrication.
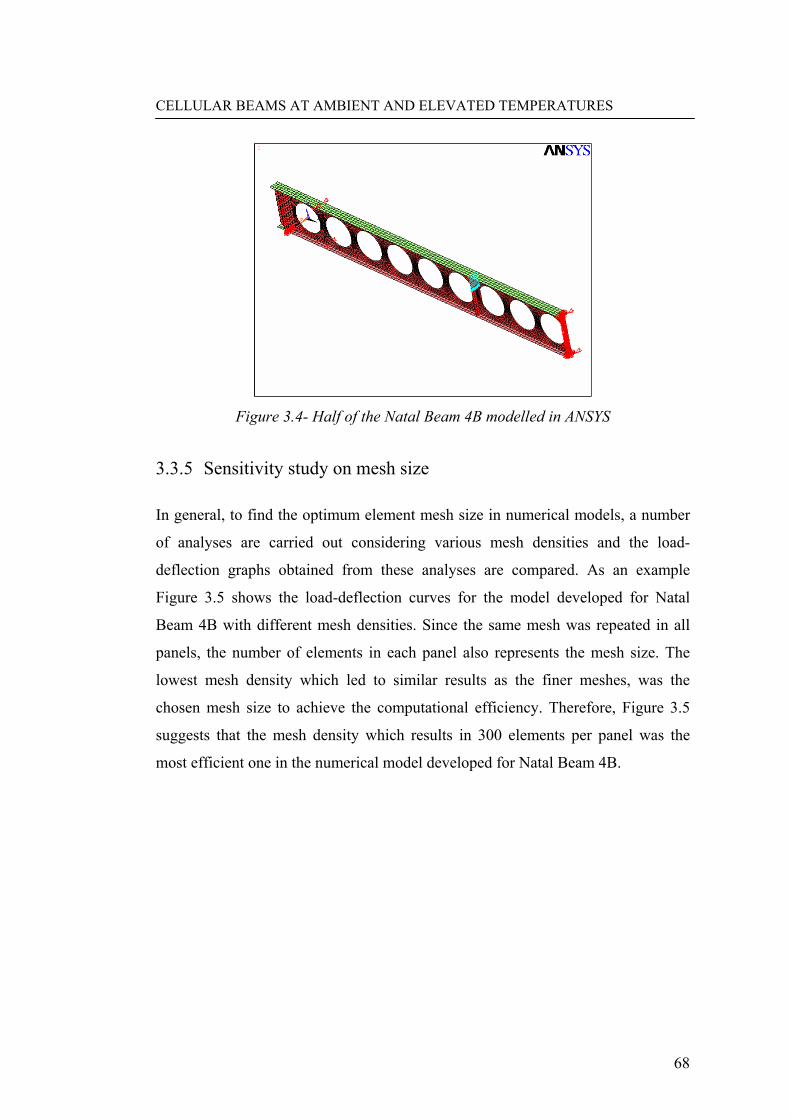
CELLULAR BEAMS AT AMBIENT AND ELEVATED TEMPERATURES
68
Figure 3.4- Half of the Natal Beam 4B modelled in ANSYS
3.3.5 Sensitivity study on mesh size
In general, to find the optimum element mesh size in numerical models, a number
of analyses are carried out considering various mesh densities and the load-
deflection graphs obtained from these analyses are compared. As an example
Figure 3.5 shows the load-deflection curves for the model developed for Natal
Beam 4B with different mesh densities. Since the same mesh was repeated in all
panels, the number of elements in each panel also represents the mesh size. The
lowest mesh density which led to similar results as the finer meshes, was the
chosen mesh size to achieve the computational efficiency. Therefore, Figure 3.5
suggests that the mesh density which results in 300 elements per panel was the
most efficient one in the numerical model developed for Natal Beam 4B.

CELLULAR BEAMS AT AMBIENT AND ELEVATED TEMPERATURES
69
0
20
40
60
80
100
120
140
160
0 10 20 30 40 50 60 70Displacement (mm)
Load
(KN
)
420 Elements per panel
300 Elements p. p.
96 Elements p. p.
48 Elements p. p.
16 Elements p. p.
``
Figure 3.5 - Sensitivity study on the mesh size, Natal Beam 4B
The mesh density was also increased in some cases to help resolve convergence
problems. Increasing the number of elements (nodes and integration points) proved
to be useful in overcoming the divergence of the solution due to occurrence of
large displacements, local instability of web posts, and concrete cracking and
crushing, within very small time-increments before failure.
3.3.6 Analysis types
As mentioned in Section 3.2, two different types of analyses were used in the
simulations conducted at ambient temperature. The Newton-Raphson or general
method, which increases the load and controls the displacement, was used to
investigate the behaviour of the CB up to the failure (buckling) point. The Riks
(Arc-length) method was used in some cases in order to look into the pre as well as
the post failure behaviour. In the general method, models were analysed linearly
and then non-linearly. The initial elastic analysis gave a good indication of the load
at which the beam was likely to yield by comparing the von Mises stress
distribution against the yield stress. This information was needed in formulating

CELLULAR BEAMS AT AMBIENT AND ELEVATED TEMPERATURES
70
the load increments for the plastic analysis and resulted in saving time and space in
the finite element analysis (FEA). This is shown for the Natal Beam 4B in Figure
3.6.
0
20
40
60
80
100
120
140
160
0 0.2 0.4 0.6 0.8 1 1.2 1.4 1.6 1.8 2Time step
Load
(KN
)
Beginning of the Plasticity for the Natal Beam 4B (P~88KN)
Figure 3.6- Load steps applied to the Natal Beam 4B in which load has increased
with a high rate in elastic region and low rate while plasticity
In general, when buckling happens in the structure, the load-displacement response
shows a negative stiffness and some strain energy should dissipate so that the
structure remains in equilibrium. Several approaches can be used for modelling the
buckling as well as post-buckling behaviour, one of which is the Riks method. The
Riks method uses both displacement and load magnitude as unknowns, and solves
the equilibrium equations for load and displacement simultaneously (Hibbitt et al.,
2004a). The only limit for using this method is that the loading should be
proportional; that is, the load magnitudes are increased by a single scalar
parameter. The Riks method uses the “arc length” along the equilibrium path in the
load-deflection curve, which provides solutions regardless of the response being
stable or unstable.

CELLULAR BEAMS AT AMBIENT AND ELEVATED TEMPERATURES
71
Figure 3.7 compares typical load-deflection curves obtained from the general and
Riks analyses which shows the general method has diverged with failure while the
Riks method, has handled the post-buckling behaviour of the failed beam.
0
20
40
60
80
100
120
140
160
0 20 40 60 80 100 120 140 160 180Def. (mm)
Load
(KN
)
Arc-Length Method
General Method
Figure 3.7-Comparison between General and Arc-length method
3.3.7 Applying imperfections
Imperfections are usually introduced to the model as perturbations in the initial
geometry. They consist of multiple superimposed buckling modes applied to the
model, unless the exact shape of the imperfection is known. Considering
imperfections in cellular beams is vital because of several reasons. In practice, the
process of cutting and fabrication of cellular beams would typically cause
geometrical perturbations. Therefore, considering them as intact sections in
modelling is far from reality. Besides, as mentioned in most of the FE software
such as ABAQUS, in order to reach the post-buckling stage, the equilibrium path
should not branch (bifurcation point). In other words to analyse a buckling problem
it must be turned into a continuous response instead of bifurcation.

CELLULAR BEAMS AT AMBIENT AND ELEVATED TEMPERATURES
72
Two different methods were used in this research to apply the imperfection to the
model. One way was to apply a fictitious “trigger” load (or initial displacement) to
initiate the instability. This trigger load must be very small so that it does not affect
the overall buckling and post-buckling behaviour of the structure, but big enough
to avoid bifurcation. A sensitivity study on the magnitude of the trigger load was
carried out in this regard.
The trigger load must be located in a position that perturbs the structure in the
expected buckling mode, resulting from test observations or buckling analysis.
Therefore, in order to define the best location for the trigger load a buckling
analysis was carried out on the model, and global as well as local buckling modes
of the structure were defined. Figure 3.8 shows the first buckling mode from the
buckling analysis carried out on Natal Beam 4B. The imperfection was applied to
Natal Beam 4B by exerting a trigger load where the out-of-web plane displacement
was the maximum.
The second approach to introduce the imperfection is by applying a linear
superposition of local and global buckling modes to the model. In this method, the
rate of association of each mode is defined by imperfection amplitudes according
to Equation 3.1.
∑=
=∆M
iiii wx
1ϕ Equation 3-1
where:
iϕ is the ith mode shape
wi is the associated scale factor
There is no absolute regulation for the shape of the web post imperfection in
numerical modelling of perforated steel sections, or a unique formula to propose
the imperfection amplitude. The latest SCI report to design the cellular beams
(Simms, 2008) proposes to take the form of a half sine wave from the top to the

CELLULAR BEAMS AT AMBIENT AND ELEVATED TEMPERATURES
73
bottom of the section with a maximum amplitude equal to H/600 for numerical
modelling where H is the section height. The L/500 is also recommended by
BSEN1993-1-1 (BSI, 2004c) as the overall mid-span imperfection for lateral-
torsional buckling investigations. Schafer and Pekoz (Schafer and Pekoz, 1998)
have also proposed approaches in which the amplitude of the imperfections is
governed by the thickness of the steel plate for local bucking and the overall length
of the section for global buckling.
Figure 3.8- First buckling mode of Natal Beam 4B gained by ABAQUS buckling
analysis
In this method, the first step was to perform a buckling analysis on the beam to get
the first local and global buckling modes (the ones with the lowest Eigenvalues). In
the second analysis, the imperfection is applied to the perfect geometry by
introducing scale factors for buckling modes of the structure. This method was
used for most of the simulations of this research and also for the parametric studies
conducted later investigating the effect of web imperfections. Comparisons
between these two different ways of applying imperfections showed there was no
major difference between these methods at ambient temperature provided that they
were used properly i.e. the trigger load caused a deflection equal to what was
considered as the imperfection amplitude.
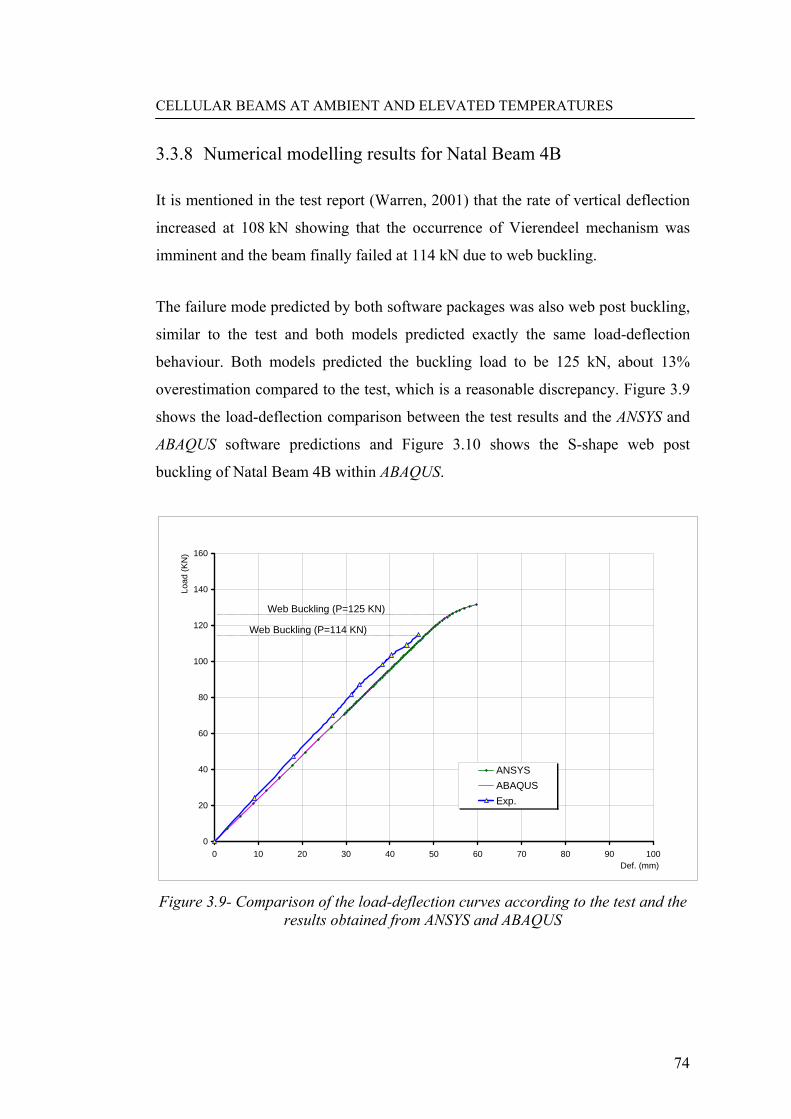
CELLULAR BEAMS AT AMBIENT AND ELEVATED TEMPERATURES
74
3.3.8 Numerical modelling results for Natal Beam 4B
It is mentioned in the test report (Warren, 2001) that the rate of vertical deflection
increased at 108 kN showing that the occurrence of Vierendeel mechanism was
imminent and the beam finally failed at 114 kN due to web buckling.
The failure mode predicted by both software packages was also web post buckling,
similar to the test and both models predicted exactly the same load-deflection
behaviour. Both models predicted the buckling load to be 125 kN, about 13%
overestimation compared to the test, which is a reasonable discrepancy. Figure 3.9
shows the load-deflection comparison between the test results and the ANSYS and
ABAQUS software predictions and Figure 3.10 shows the S-shape web post
buckling of Natal Beam 4B within ABAQUS.
0
20
40
60
80
100
120
140
160
0 10 20 30 40 50 60 70 80 90 100
Load
(KN
)
Def. (mm)
ANSYSABAQUSExp.
Web Buckling (P=125 KN)
Web Buckling (P=114 KN)
Figure 3.9- Comparison of the load-deflection curves according to the test and the
results obtained from ANSYS and ABAQUS

CELLULAR BEAMS AT AMBIENT AND ELEVATED TEMPERATURES
75
Figure 3.10- Web post buckling of Natal Beam 4B using ABAQUS
The model developed in ANSYS also correctly predicted the occurrence of the S-
shape buckling for this beam as shown Figure 3.11.
Figure 3.11- Development of S-shape web post buckling of the Natal Beam 4B
using ANSYS

CELLULAR BEAMS AT AMBIENT AND ELEVATED TEMPERATURES
76
3.4 MODELLING LEEDS BEAM 2
3.4.1 Introduction
Five CBs were tested, on behalf of the Steel Construction Institute (SCI), at Leeds
University in 1995 (Surtees and Li, 1995), with the aim of seeking a better insight
into the behaviour of CBs. The beam geometries were designed to fail in various
modes including web post buckling, which was observed in Beam 2 and Beam 5.
The second finite element modelling presented in this research is based on Leeds
Beam 2. Figure 3.12 shows the overall specifications of this beam. More details
can be found in the test report (Surtees and Li, 1995). Notably, web stiffeners were
omitted in most of the beams tested in Leeds, including Beam 2, in order to
provoke the most critical circumstances of the tests.
Figure 3.12- Geometry of the Leeds Beam 2
One of the most important aspects of numerical modelling of CBs is to mimic the
load-deflection curve and the failure load of the test. However, identifying the
correct mode of failure is also critical. This is the area where the majority of the
existing software which are designed specifically for the analysis of CBs, such as
Cellbeam v5.0 (Simms, 2005), incur notable prediction errors. Cellbeam software
is developed by the Steel Construction Institute (SCI) to design cellular beams and
cellular composite beams and SCI report RT1025 (Simms, 2004b) includes the
design prediction obtained from this software for 22 tests carried out on composite
and non-composite cellular beams of various geometries. This report compares the
failure modes predicted by the software against the test results which reveals the
notable errors in the prediction of the correct failure modes observed in the tests. In

CELLULAR BEAMS AT AMBIENT AND ELEVATED TEMPERATURES
77
particular, Vierendeel mechanism was specified by Cellbeam as the failure mode in
some of the cases while the beam actually failed due to web post buckling in the
test. The utilization factors given by Cellbeam for Vierendeel mechanism and web
buckling were also conservative by 20% and 10% respectively.
3.4.2 Modelling approach for Leeds Beam 2
Following the methodology used for Natal Beam 4B, ABAQUS and ANSYS
software packages were used for the modelling of Leeds Beam 2. The Leeds Beam
2 failed due to web post buckling in the test (Surtees and Li, 1995). Unfortunately,
the test report for these beams suffers from the lack of data given for material
properties and the only available information was the yield strengths of the web
and the flange. Hence, some assumptions were made in modelling. The missing
values (ultimate stress, strain and Elastic modulus) assumed in the model were
determined with regard to the data available in the test report for other Leeds
beams or using BSEN1993-1-1 (BSI, 2005a) recommendations as a reference.
Figure 3.13 shows the bilinear stress-strain curve used for numeral modelling
which resulted from the following three initial assumptions:
Fu = 1.1 Fy
eu = 0.2
E = 205 (kN/mm2)
According to the test report, full lateral restraint was provided for the upper and
lower flanges of the beam at approximately one-metre intervals to avoid lateral-
torsional buckling of the beam. This was considered in the model as shown in
Figure 3.13.
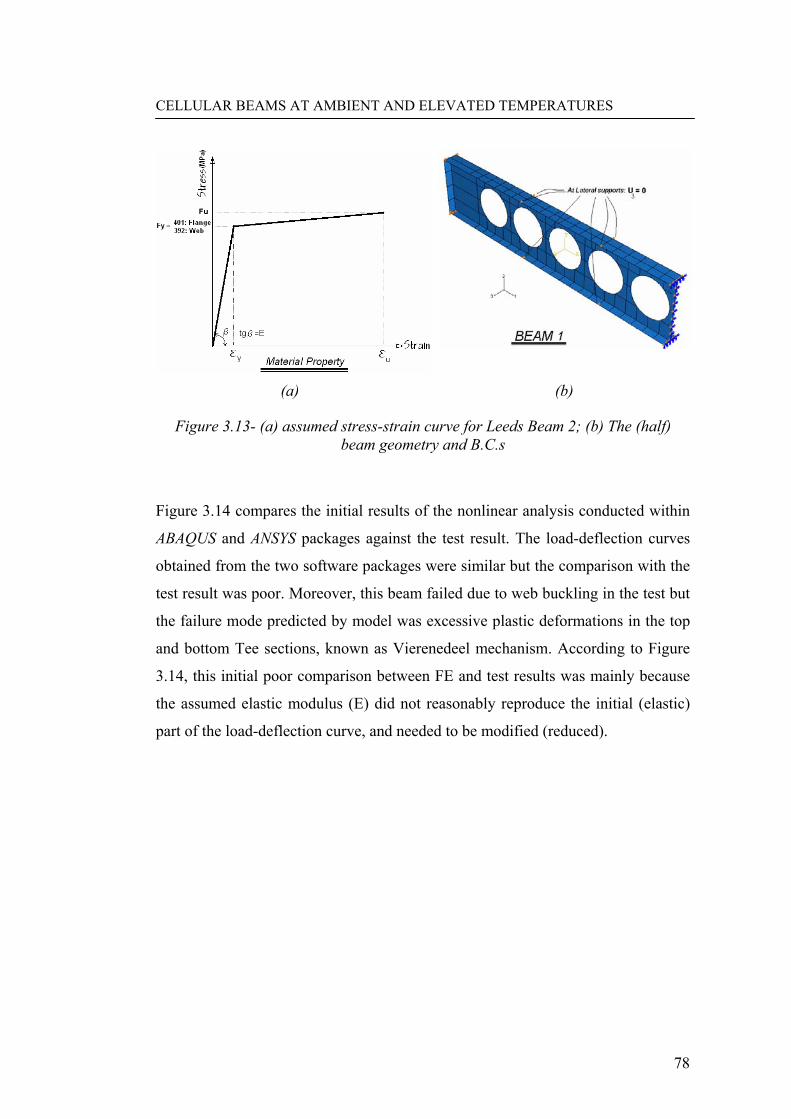
CELLULAR BEAMS AT AMBIENT AND ELEVATED TEMPERATURES
78
(a) (b)
Figure 3.13- (a) assumed stress-strain curve for Leeds Beam 2; (b) The (half) beam geometry and B.C.s
Figure 3.14 compares the initial results of the nonlinear analysis conducted within
ABAQUS and ANSYS packages against the test result. The load-deflection curves
obtained from the two software packages were similar but the comparison with the
test result was poor. Moreover, this beam failed due to web buckling in the test but
the failure mode predicted by model was excessive plastic deformations in the top
and bottom Tee sections, known as Vierenedeel mechanism. According to Figure
3.14, this initial poor comparison between FE and test results was mainly because
the assumed elastic modulus (E) did not reasonably reproduce the initial (elastic)
part of the load-deflection curve, and needed to be modified (reduced).

CELLULAR BEAMS AT AMBIENT AND ELEVATED TEMPERATURES
79
0
50
100
150
200
250
0 2 4 6 8 10 12 14 16 18Def. (mm)
Load
(KN
)
ExperimentABAQUS ANSYS
Figure 3.14- Test results versus ANSYS and ABAQUS results for Leeds Beam 2
assuming E= 205 kN/mm2
A decision should also have been taken on the software to be used for the
subsequent modelling to investigate cellular composite beams. Therefore, the
literature and capabilities of the ABAQUS and ANSYS software were investigated
and compared. The following section summarises these findings which proved
useful in choosing the software for the future numerical studies carried out in this
research.
3.4.3 Comparison between ABAQUS and ANSYS
In general, the studies conducted comparing ABAQUS and ANSYS in terms of the
ability to predict the correct failure mode of CBs, with no concrete slab involved,
showed no notable difference between the two software packages, as long as
similar approaches were used.
In order to make a sound decision regarding which software package to use in this
research project, their ability to model the rather complicated concrete material,
considering cracking and crushing behaviour, was investigated. This was done by
referring to the relevant literature and research (Barbosa and Riberio, 1998;
Fanning, 2001) which included modelling the concrete material, software manuals
and seeking advice from ANSYS and ABAQUS peers.

CELLULAR BEAMS AT AMBIENT AND ELEVATED TEMPERATURES
80
Based on these studies it was known that ANSYS is only capable of associating the
concrete material with a particular solid element (SOLID 65). In other words,
concrete material cannot be associated with any shell or beam elements. Despite,
ABAQUS enables the user to incorporate the concrete material with solid elements
as well as shell and beam elements. As the main focus of this research was the
performance of the steel beam, as opposed to the concrete slab, it was prefered to
model the concrete slab with shell elements to save computational time and avoid
the potential numerical issues associated with shell-solid interaction.
In terms of the available approaches to model the concrete material, ANSYS, only
offers the smeared cracking model whereas ABAQUS benefits from three concrete
models, namely smeared cracking model, damaged plasticity and crack model.
This equips the ABAQUS user with more options to tackle the foreseen and
unforeseen challenges associated with modelling concrete.
Moreover, ABAQUS offers notably more flexibility in the options available to
model and manipulate the concrete properties than ANSYS. An example of this
flexibility is related with defining the post cracking behaviour of concrete. In
ANSYS there is no option to control the post cracking behaviour of concrete, the
strength reduction rate and ultimate tensile strain and constant defaults have to be
used. However, in ABAQUS, post-cracking behaviour can be accurately defined
and manipulated as necessary. The definition of the post-cracking can be critical
considering that in many cases, minor changes in ultimate tensile strain (changing
from brittle towards ductile) could help overcome the convergence problems
associated with modelling concrete material. However, the user needs to ensure the
general response of the structure remains reasonably unaffected.
Consequently, the decision was made to use ABAQUS for future validations and
investigations presented in this research.

CELLULAR BEAMS AT AMBIENT AND ELEVATED TEMPERATURES
81
3.4.4 Modified modelling approach for Leeds Beam 2
Based on the comparison between the test and FE results, the elastic modulus
(which was an assumed value not a measured one, was then reduced to
195 kN/mm2 (from 205 kN/mm2) for a better fit with the elastic part of the load-
deflection curve. Figure 3.15 compares the modelling versus test result after this
modification.
It should be noted that the discrepancy between the numerical and test result in this
case could have been because of differences between the actual section sizes and
thicknesses, and the nominal ones that were used in the model. This discrepancy
can also be due to settlement of the support. Reducing the modulus of elasticity to
less than 200 kN/mm2 is not realistic and was done to get a better agreement
between test and numerical results, within the elastic range, in the absence of any
details about the actual section sizes and support settlements.
0
50
100
150
200
250
300
0 10 20 30 40 50 60Def. (mm)
Load
(KN
)
FE
Experiment
Buckling
Vierendeel Def.s
Figure 3.15- Test results versus ABAQUS for Leeds Beam 2 assuming E= 195
kN/mm2
This beam buckled at 195 kN in the test but in the FE model web post buckling
was notably delayed up to 270 kN. Meanwhile, development of plasticity in the
web post and Tee sections caused gradual plastic and Vierendeel deformations as

CELLULAR BEAMS AT AMBIENT AND ELEVATED TEMPERATURES
82
highlighted in Figure 3.15. Figure 3.16 shows the Von Mises stress distribution
with increasing load. The plasticity initiated in the web posts and then developed to
the Tee sections.
Figure 3.16- Development of Von Mises stress with load increase
The unconvincing results obtained from the numerical modelling approach led to
the need to carry out more comprehensive studies to investigate the effect of
material properties, boundary conditions, imperfections and time increments in the
behaviour of this beam.
Consequently, investigations focused in two significant areas of the numerical
modelling of CBs, which could influence the results notably. These two areas were

CELLULAR BEAMS AT AMBIENT AND ELEVATED TEMPERATURES
83
the boundary conditions and the time stepping and load increments while using the
automatic time stepping option to run the nonlinear analysis. These two issues are
discussed in the following two sections.
3.4.5 Importance of boundary conditions in modelling CBs
According to the test report (Surtees and Li, 1995), the top and bottom flanges of
the beam were laterally restrained at one-metre intervals. Here, two similar beams
are presented (Leeds Beam 2) and the only difference is the length in which the
lateral support is applied. Figure 3.17(a) shows approach 1 (Beam 1), where
supports were provided at single nodes (U3=0), the old approach also shown in
Figure 3.13. Figure 3.17(b) shows Beam 2, where lateral supports were applied
over 225 mm of the length of the flange, which relates to the test condition, rather
than just on a single node.
Both beams were expected to show a similar behaviour under the applied load, and
if different Beam 2, which benefits from more lateral support, was expected to be
slightly more stable against buckling and resist higher loads compared to Beam 1.
(a) (b)
Figure 3.17- Boundary conditions applied to Beam 1 and Beam 2, for comparison purposes
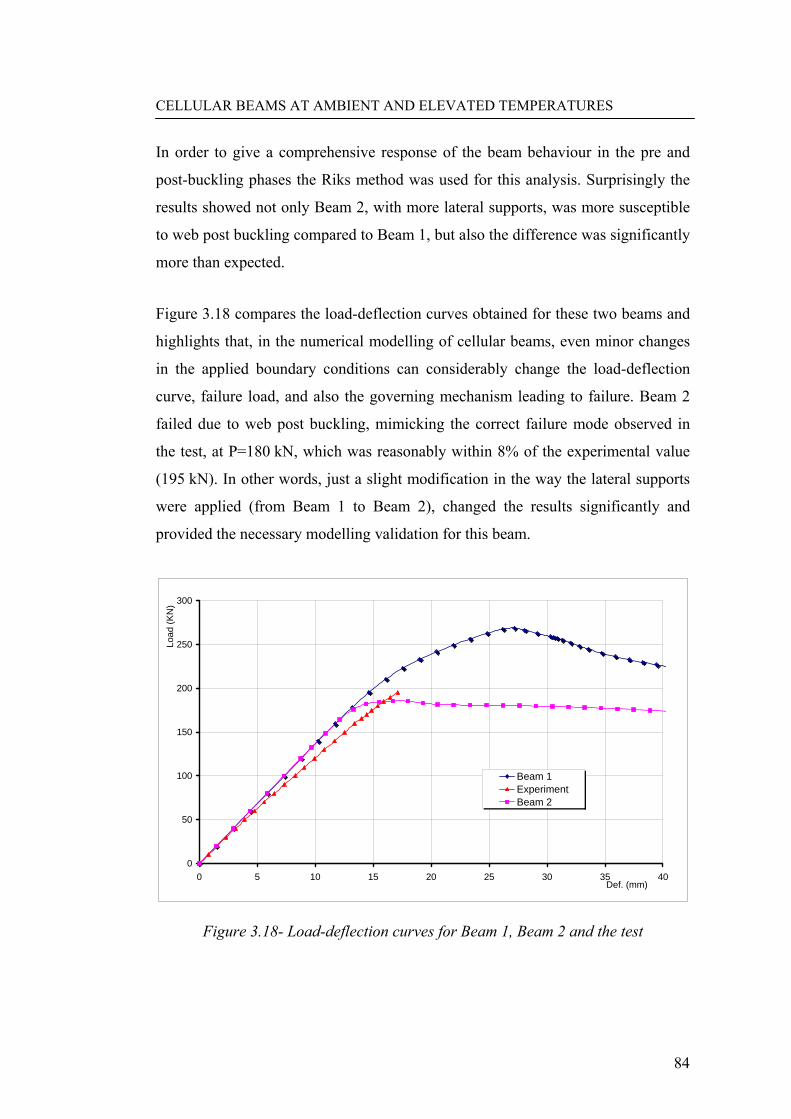
CELLULAR BEAMS AT AMBIENT AND ELEVATED TEMPERATURES
84
In order to give a comprehensive response of the beam behaviour in the pre and
post-buckling phases the Riks method was used for this analysis. Surprisingly the
results showed not only Beam 2, with more lateral supports, was more susceptible
to web post buckling compared to Beam 1, but also the difference was significantly
more than expected.
Figure 3.18 compares the load-deflection curves obtained for these two beams and
highlights that, in the numerical modelling of cellular beams, even minor changes
in the applied boundary conditions can considerably change the load-deflection
curve, failure load, and also the governing mechanism leading to failure. Beam 2
failed due to web post buckling, mimicking the correct failure mode observed in
the test, at P=180 kN, which was reasonably within 8% of the experimental value
(195 kN). In other words, just a slight modification in the way the lateral supports
were applied (from Beam 1 to Beam 2), changed the results significantly and
provided the necessary modelling validation for this beam.
0
50
100
150
200
250
300
0 5 10 15 20 25 30 35 40Def. (mm)
Load
(KN
)
Beam 1ExperimentBeam 2
Figure 3.18- Load-deflection curves for Beam 1, Beam 2 and the test

CELLULAR BEAMS AT AMBIENT AND ELEVATED TEMPERATURES
85
This notable sensitivity of the models developed for beams with web openings, to
lateral supports was also observed in the previous investigations of the author into
the behaviour of castellated beams (Bake, 2004). Figure 3.19 shows three similar
beams with different support conditions applied to the top flange which were
investigated in these investigations by the author. Amongst these three models, the
one with full lateral support along the top flange (Model 3 in Figure 3.19) failed
due to web post buckling (Figure 3.20) whereas the other two models failed due to
excessive shear deformations in the weakest section of the web post which is
shown in Figure 3.21.
Figure 3.19-Models developed to investigate the influence of the boundary
condition of the top flange on the behaviour of castellated beams

CELLULAR BEAMS AT AMBIENT AND ELEVATED TEMPERATURES
86
Figure 3.20- Failure due to excessive shear deformation of the web post in Model 1
and Model 2
Figure 3.21- Failure due to S-shaped web post buckling in Model 3
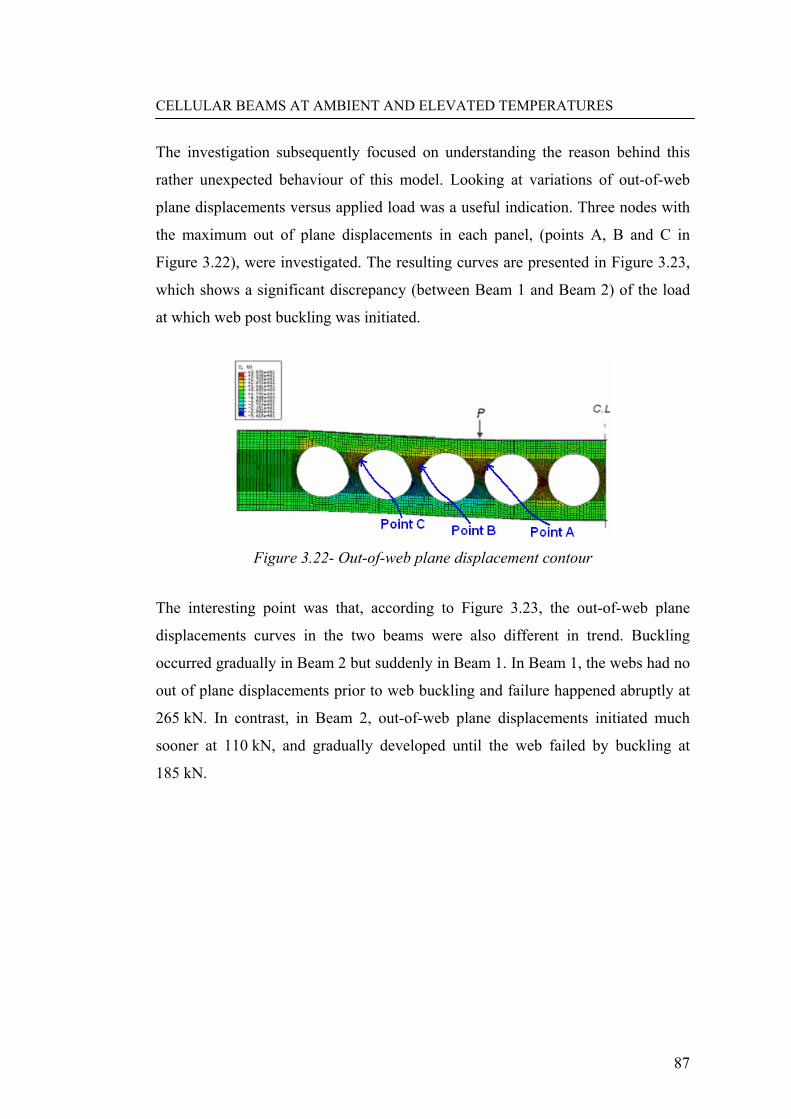
CELLULAR BEAMS AT AMBIENT AND ELEVATED TEMPERATURES
87
The investigation subsequently focused on understanding the reason behind this
rather unexpected behaviour of this model. Looking at variations of out-of-web
plane displacements versus applied load was a useful indication. Three nodes with
the maximum out of plane displacements in each panel, (points A, B and C in
Figure 3.22), were investigated. The resulting curves are presented in Figure 3.23,
which shows a significant discrepancy (between Beam 1 and Beam 2) of the load
at which web post buckling was initiated.
Figure 3.22- Out-of-web plane displacement contour
The interesting point was that, according to Figure 3.23, the out-of-web plane
displacements curves in the two beams were also different in trend. Buckling
occurred gradually in Beam 2 but suddenly in Beam 1. In Beam 1, the webs had no
out of plane displacements prior to web buckling and failure happened abruptly at
265 kN. In contrast, in Beam 2, out-of-web plane displacements initiated much
sooner at 110 kN, and gradually developed until the web failed by buckling at
185 kN.

CELLULAR BEAMS AT AMBIENT AND ELEVATED TEMPERATURES
88
0
50
100
150
200
250
300
0 5 10 15 20 25Dis. (mm)
Load
(KN
)
Beam 1- Point ABeam 2- Point ABeam 1- Point CBeam 2- Point BBeam 2- Point CBeam 1- Point B
Figure 3.23- Displacements of points A, B and C of Beam 1 and Beam 2
Further investigations conducted on this beam were helpful in identifying the
reason behind this rather unexpected but interesting phenomenon in numerical
modelling of CBs.
In the first step to have a better understanding of how the CB behaves under the
applied load, four identical beams were modelled (based on Beam 2) with different
material properties. Elastic and elastic-plastic materials were considered for the
web and flange to cover all four possible cases and provide a better insight into the
behaviour of the web and flange.
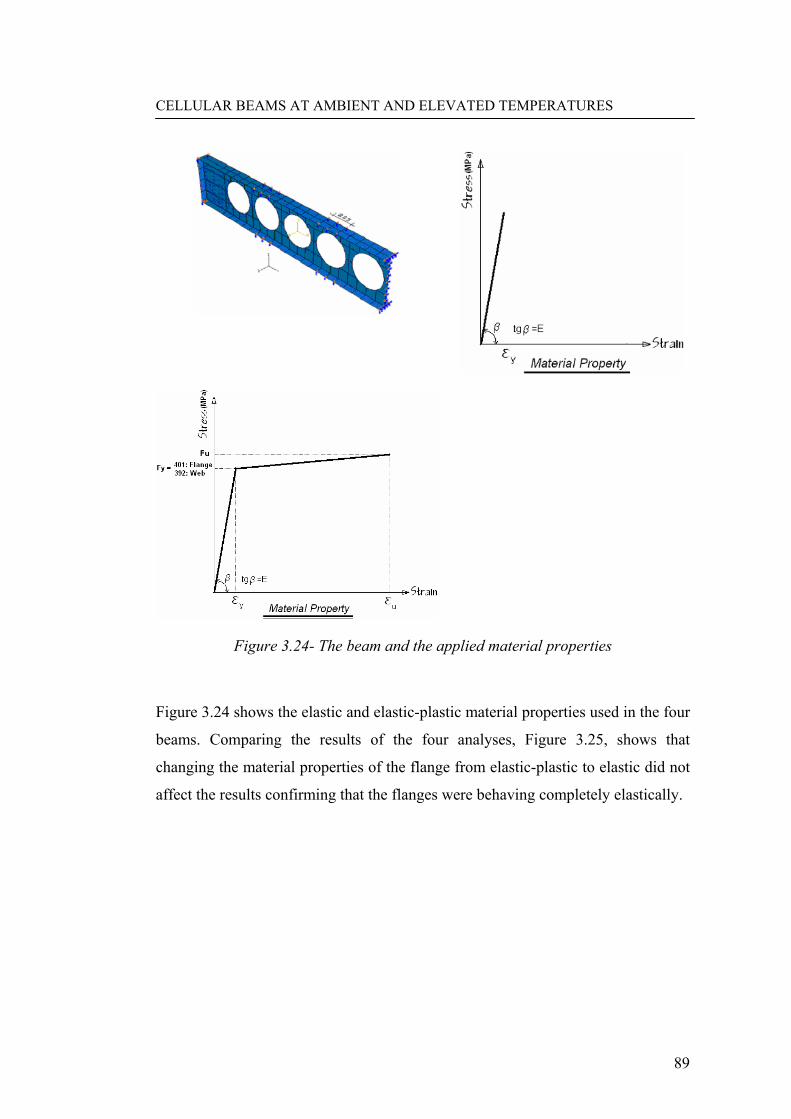
CELLULAR BEAMS AT AMBIENT AND ELEVATED TEMPERATURES
89
Figure 3.24- The beam and the applied material properties
Figure 3.24 shows the elastic and elastic-plastic material properties used in the four
beams. Comparing the results of the four analyses, Figure 3.25, shows that
changing the material properties of the flange from elastic-plastic to elastic did not
affect the results confirming that the flanges were behaving completely elastically.

CELLULAR BEAMS AT AMBIENT AND ELEVATED TEMPERATURES
90
0
50
100
150
200
250
300
350
400
450
500
0 5 10 15 20 25 30 35 40 45Def. (mm)
Load
(KN
)
Experiment
Web: E.P., Flange: E.P.
Elastic Beam
Web: E.P., Flange: E
Web: E., Flange: E.P.
Figure 3.25- Load-displacement comparison for different cases
In the second step to investigate the reason why negligible changes in boundary
conditions ended up in significant changes in results, the exaggeration approach
was used. In other words, to magnify the difference caused by the two types of
lateral supports, a third and forth boundary conditions (Beam 3 and Beam 4 as
shown in Figure 3.26) were introduced and compared to Beam 1 and Beam 2 to
facilitate understanding the mechanics and causes behind this notable sensitivity
Figure 3.26- Boundary conditions applied to beams 3 and 4
Beam 3 had full lateral support at the top and bottom flanges and in Beam 4 they
were kept to a minimum and were just provided at mid-span to prevent overall
lateral-torsional buckling of the beam.

CELLULAR BEAMS AT AMBIENT AND ELEVATED TEMPERATURES
91
Figure 3.27 compares the load-deflection curves obtained for these four beams and
highlights an interesting trend in the load-deflection curves. In fact, higher lateral
supports resulted in lower ultimate load resistance and promoted the web post
buckling. In particular, Beam 4, with the minimum lateral support carried the
highest load while Beam 3, which was the most laterally restrained one, buckled
first.
0
50
100
150
200
250
300
0 5 10 15 20 25 30 35 40Def. (mm)
Load
(KN
)
Beam 1ExperimentBeam 2Beam 3Beam 4
Figure 3.27- Comparison of the load-deflection curves for the four beams
This suggests that although increasing the lateral support, in numerical modelling
of CBs, delays overall lateral-torsional buckling (global buckling), it can be
detrimental when considering web post buckling (local bucking) which is
governing the ultimate loading capacity.
Further studies were carried out on Beam 3 and Beam 4, the two beams with
extreme boundary conditions, and deflections were investigated in the two critical
zones where web buckling initiated. In particular, the vertical deflection of the
nodes at the top flange, and the horizontal deformation of the mid-web in critical
zones 1 and 2 (Figure 3.28) were investigated in both beams.
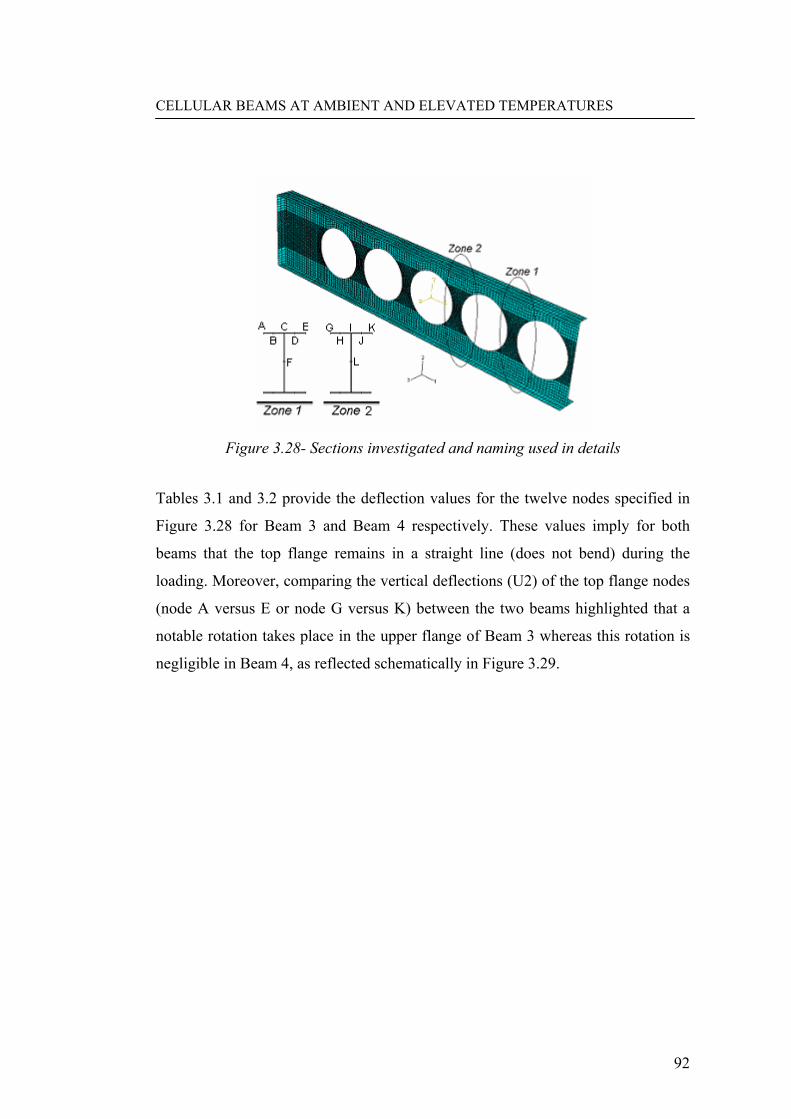
CELLULAR BEAMS AT AMBIENT AND ELEVATED TEMPERATURES
92
Figure 3.28- Sections investigated and naming used in details
Tables 3.1 and 3.2 provide the deflection values for the twelve nodes specified in
Figure 3.28 for Beam 3 and Beam 4 respectively. These values imply for both
beams that the top flange remains in a straight line (does not bend) during the
loading. Moreover, comparing the vertical deflections (U2) of the top flange nodes
(node A versus E or node G versus K) between the two beams highlighted that a
notable rotation takes place in the upper flange of Beam 3 whereas this rotation is
negligible in Beam 4, as reflected schematically in Figure 3.29.
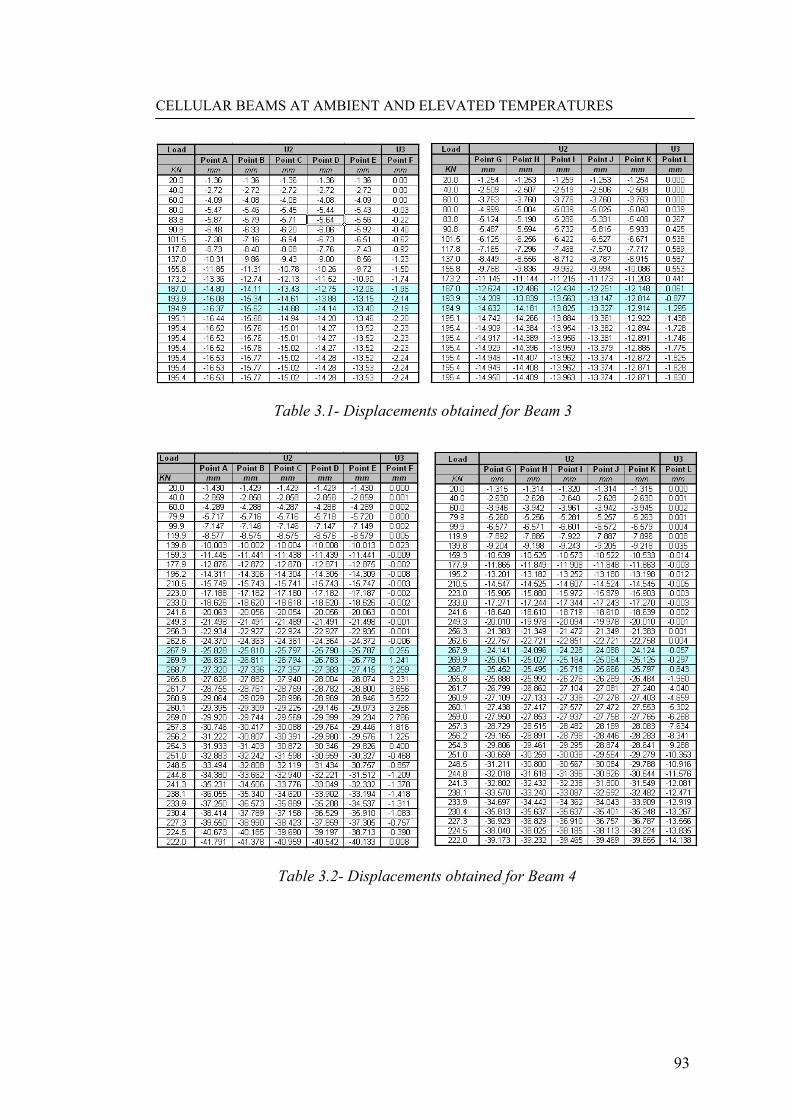
CELLULAR BEAMS AT AMBIENT AND ELEVATED TEMPERATURES
93
Table 3.1- Displacements obtained for Beam 3
Table 3.2- Displacements obtained for Beam 4

CELLULAR BEAMS AT AMBIENT AND ELEVATED TEMPERATURES
94
Figure 3.29 Rotation of the top flange in Beam 3 (continuous restrain) compared to Beam 4 (two point restraints)
The reaction force of the lateral supports at the top flange of Beam 4 was
subsequently investigated. This compressive reaction force was directly
proportional to the applied load ending up in rather high values, depending on the
location on the selected node.
Figure 3.30 is the reaction forces induced at two of the lateral supports (denoted
node 1 and node 2) at different locations which shows this reaction force reached a
high value of 8 kN per restrained node.
The cause of such notable action and reaction forces between the top flange and
lateral supports was due to the lateral expansion of the top flange plate (depending
on the Possion’s ratio) while the applied vertical load causes compression in the
top flange. The resulting strain (also action and reaction force) depends on the
Poisson’s ratio and increases with the vertical load.

CELLULAR BEAMS AT AMBIENT AND ELEVATED TEMPERATURES
95
0
2
4
6
8
10
0 50 100 150 200 250
Total Vertical applied load (kN)
Late
ral s
uppo
rt R
eact
ion
(kN
)Reaction force of lateral support at Node 1
Reaction force of lateral support at Node 2
Figure 3.30-Two samples of reaction compressive force applied by lateral supports per node
This justification is well endorsed by looking at the lateral reaction forces in the
bottom flange which was under tension. Unlike the top flange, the reaction forces
applied from the supports to the bottom flange plate were tensile, supporting the
assumed behaviour.
The conclusion of all these investigations was that the internal forces induced in
the CBs with increasing loading, resulted in the unexpected significant effect of
lateral supports on the performance of CBs, in numerical modelling. Figure 3.31
shows the internal forces in the CB where the black arrows (in the left figure)
represent the force applied to lateral supports.
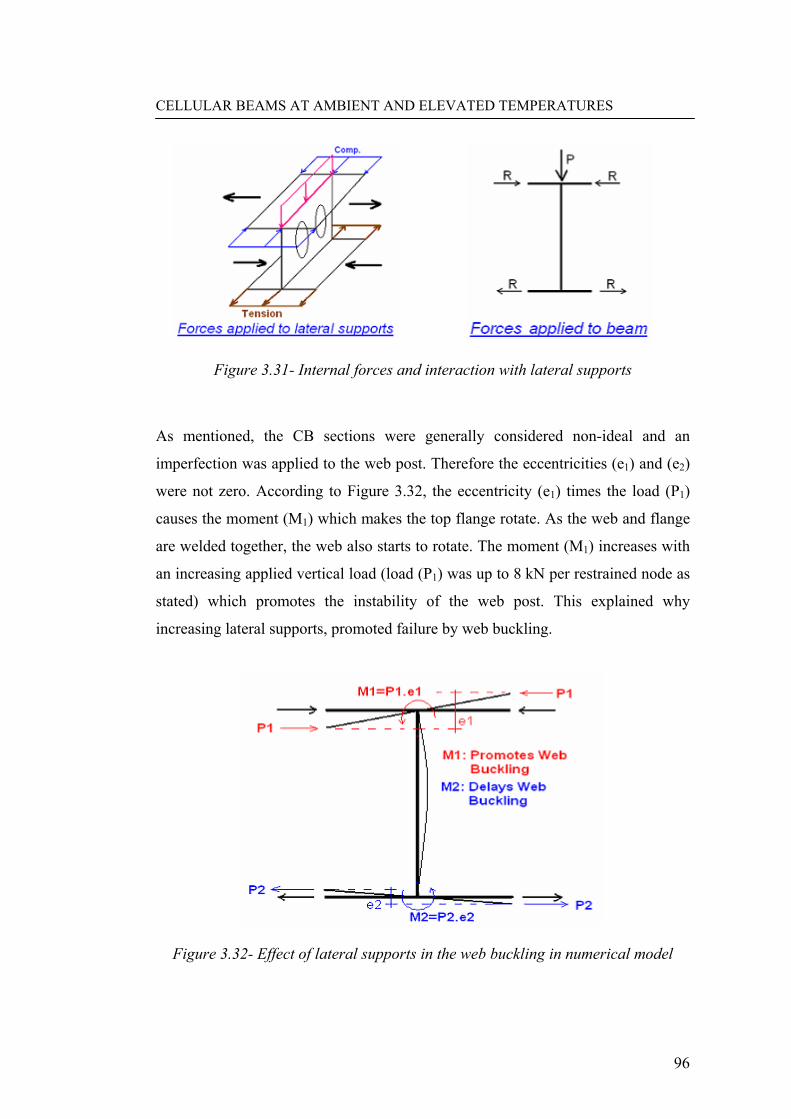
CELLULAR BEAMS AT AMBIENT AND ELEVATED TEMPERATURES
96
Figure 3.31- Internal forces and interaction with lateral supports
As mentioned, the CB sections were generally considered non-ideal and an
imperfection was applied to the web post. Therefore the eccentricities (e1) and (e2)
were not zero. According to Figure 3.32, the eccentricity (e1) times the load (P1)
causes the moment (M1) which makes the top flange rotate. As the web and flange
are welded together, the web also starts to rotate. The moment (M1) increases with
an increasing applied vertical load (load (P1) was up to 8 kN per restrained node as
stated) which promotes the instability of the web post. This explained why
increasing lateral supports, promoted failure by web buckling.
Figure 3.32- Effect of lateral supports in the web buckling in numerical model
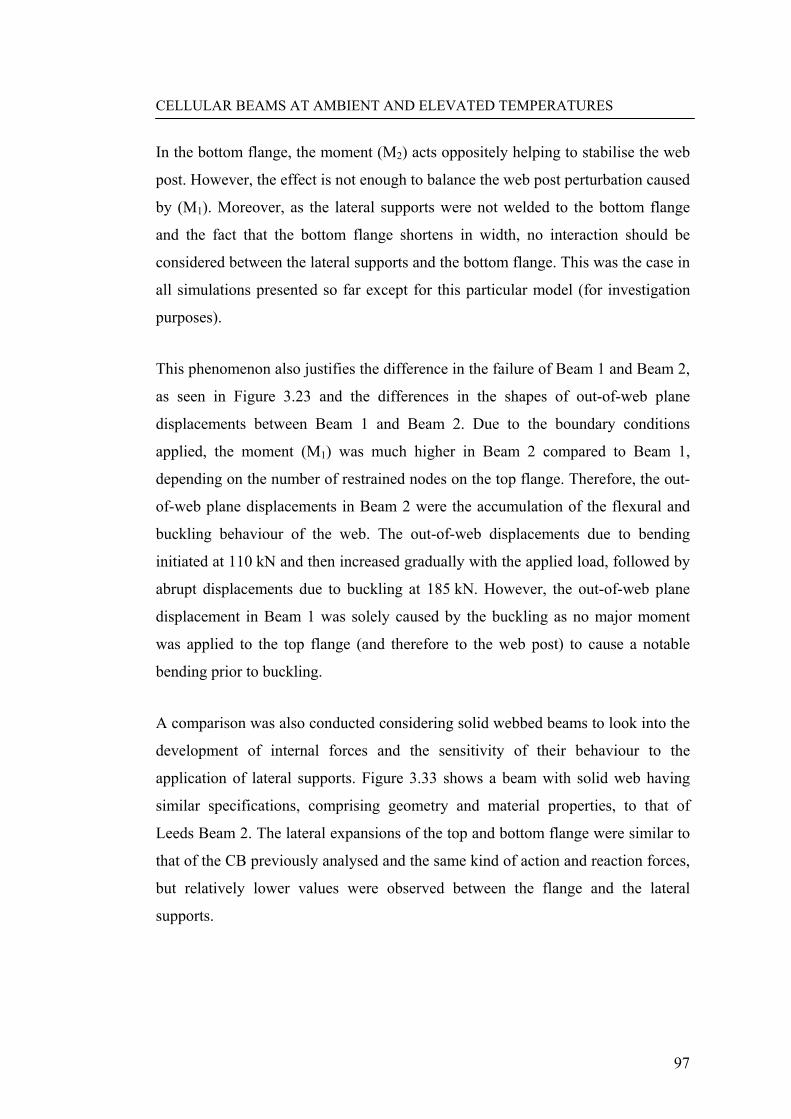
CELLULAR BEAMS AT AMBIENT AND ELEVATED TEMPERATURES
97
In the bottom flange, the moment (M2) acts oppositely helping to stabilise the web
post. However, the effect is not enough to balance the web post perturbation caused
by (M1). Moreover, as the lateral supports were not welded to the bottom flange
and the fact that the bottom flange shortens in width, no interaction should be
considered between the lateral supports and the bottom flange. This was the case in
all simulations presented so far except for this particular model (for investigation
purposes).
This phenomenon also justifies the difference in the failure of Beam 1 and Beam 2,
as seen in Figure 3.23 and the differences in the shapes of out-of-web plane
displacements between Beam 1 and Beam 2. Due to the boundary conditions
applied, the moment (M1) was much higher in Beam 2 compared to Beam 1,
depending on the number of restrained nodes on the top flange. Therefore, the out-
of-web plane displacements in Beam 2 were the accumulation of the flexural and
buckling behaviour of the web. The out-of-web displacements due to bending
initiated at 110 kN and then increased gradually with the applied load, followed by
abrupt displacements due to buckling at 185 kN. However, the out-of-web plane
displacement in Beam 1 was solely caused by the buckling as no major moment
was applied to the top flange (and therefore to the web post) to cause a notable
bending prior to buckling.
A comparison was also conducted considering solid webbed beams to look into the
development of internal forces and the sensitivity of their behaviour to the
application of lateral supports. Figure 3.33 shows a beam with solid web having
similar specifications, comprising geometry and material properties, to that of
Leeds Beam 2. The lateral expansions of the top and bottom flange were similar to
that of the CB previously analysed and the same kind of action and reaction forces,
but relatively lower values were observed between the flange and the lateral
supports.

CELLULAR BEAMS AT AMBIENT AND ELEVATED TEMPERATURES
98
Figure 3.33- Expansion and shortening of the top and bottom flange respectively in the solid webbed beam
Adding or eliminating the lateral supports did not notably alter the performance of
the solid-webbed beam. This seemed reasonable because the failure of this beam
was not governed by any kind of web instabilities or local buckling and therefore,
solid-webbed beams were not very sensitive to lateral supports. Moreover, these
exerted lateral forces were also relatively smaller in the solid-webbed beam as
previously mentioned. This is because in CBs, the web openings cause a behaviour
similar to Vierendeel truss which intensifies the compression in the top flange,
compared to solid beams, and therefore, increases the strains in the lateral direction
(reaction force and consequently moment M1).
3.4.6 Importance of load increments in modelling CBs
As mentioned, two common analysis types were mostly used in this numerical
modelling, namely the general method and Riks method. In the general method,
which is based on the Newton-Raphson algorithm to solve the equilibrium
equations, the maximum and minimum allowed increment size in each step was
given by the user. The software then increases the load at each stage within the
defined range.
The limitations on the increment size help prevent numerical convergence
problems of the solution. However, within the investigations carried out on Leeds

CELLULAR BEAMS AT AMBIENT AND ELEVATED TEMPERATURES
99
Beam 2, it was highlighted that inappropriate application of the load increments
and allowing relatively large load increments, could result in not only erroneous
load-deflection curves, but also capturing the wrong failure mode.
Figure 3.34 shows a comparison between two beams, based on Leeds Beam 2, both
analysed with the general solver method using ABAQUS. The only difference
between Beam 1 and Beam 2, was the maximum allowable added load in each
increment which was limited to 16 kN and 18 kN respectively.
After running both models, the output showed that in Beam 1, out-of-web plane
displacement (U3 at node A) reached 13 mm at a load of 240 kN whereas in Beam
2 (Node B) this value was almost zero for a higher load (260 kN). This means that
no buckling occurred in the web post. Figure 3.34 shows the contours for the out-
of-web plane in these beams. Figure 3.35 compares the load-deflection curves
certifying the notable difference in the behaviour of the two beams.

CELLULAR BEAMS AT AMBIENT AND ELEVATED TEMPERATURES
100
Figure 3.34- Out-of-web plane displacement contours indicating buckling and no buckling in Beam 1 and Beam 2 respectively
0
50
100
150
200
250
300
0 5 10 15 20 25 30 35Dis. (mm)
Load
(KN
)
Beam 2
Beam 1
Experiment
Figure 3.35- Load-deflections curves of beams one 1 and 2

CELLULAR BEAMS AT AMBIENT AND ELEVATED TEMPERATURES
101
In Beam 1, the critical buckling load of about 240 kN was identified in the analysis
and the load increments applied in the solution at that stage were small enough to
handle the large displacements while buckling. On the contrary, in Beam 2, the
buckling point was not identified by the model and only some plastic and
Vierendeel deformations (Chung et al., 2001) occurred.
This behaviour implies how critical it is to limit the maximum allowable load
increment when conducting the numerical analysis of CBs using the general
method, particularly when web post buckling is expected.
This behaviour could be justified with regard to the specific geometry of the CB
and therefore, development of various mechanisms and failure modes with increase
of load. In particular, the web post buckling and Vierendeel mechanism are the
most probable ones to happen in this beam. Occurrence of web buckling is abrupt
whereas plastic deflections, causing the Vierendeel mechanism, are gradual and
begin to develop much before the plastic hinges in the Tee section cause failure.
A bilinear stress to strain conversion was assumed for the steel material. The web
buckling is more dependent on the elastic and plastic modulus while the Vierendeel
deformation is more related to the yield stress and strains. Figure 3.36 shows the
bilinear curve used for steel material. The step from point A leads to B or C,
depending on the load increment. Whilst there is not much difference in stress
between points B and C (web buckling), the development of plastic strains at point
B and C (Vierendeel deformations) are notably different.

CELLULAR BEAMS AT AMBIENT AND ELEVATED TEMPERATURES
102
Figure 3.36- Typical bilinear curve for steel material and importance of load increment
In other words, it seems that in Beam 2, between two increments that buckling was
expected, occurrence of plastic deformations and stresses dissipated by the plastic
deformations, while solving the simultaneous equilibrium equations, has reduced
the share of the web post stress in a way that not enough stress was applied to the
web to initiate buckling. Figure 3.37 shows a schematic model which helps to
present the justification behind the belated buckling in Beam 2. In this figure, the
stiffness (K) and buckling capacity (Pcr) of the web decrease as the load increases.
For example, assume a slender rod fixed with sponges at both ends and the entire
system being under compression. A compressive force is applied to the rod through
the two sponges. The possibility of buckling of the rod decreases if the sponge is so
soft so that the rod can plunge into it and cause deformation in the sponges by
dissipating strain energy, and releasing some of the compression load applied to the
rod.
This could be the reason why there was a remarkable difference between the results
of two similar beams. The equilibrium equations, in Beam 2 were satisfied by
excessive plastic deformations as reflected in Figure 3.37 and web buckling was
notably delayed.

CELLULAR BEAMS AT AMBIENT AND ELEVATED TEMPERATURES
103
Figure 3.37- A conceptual model to look at web post buckling
3.5 MODELLING LEEDS BEAM 3
3.5.1 Introduction and modelling
Figure 3.38 shows half of the long span Leeds Beam 3, which was subject to four
point loads and modelled in ABAQUS as the last validation against CBs tested at
ambient temperature. The beam height and span were 564 mm and 12250 mm
respectively and the parent section of this symmetric beam was UB564×140×39.
The opening diameter and spacing were 350 mm and 455 mm respectively. Further
details can be found in the test report (Surtees and Li, 1995). The material
properties were taken from the test report, which includes actual recorded
dimensions. These data were used in the modelling.

CELLULAR BEAMS AT AMBIENT AND ELEVATED TEMPERATURES
104
Figure 3.38- Half of Leeds Beam 3 modelled in ABAQUS benefiting from symmetry
3.5.2 Numerical versus test results
According to the test report, the test was preceded by an initial loading increment
of about 5% of the predicted maximum load. This was conducted to absorb
bedding down movements of the sample, and to ensure the efficiency of the lateral
supports. Nevertheless, the load-deflection curve resulted from this test presented
in Figure 3.39, shows the 5% pre-loading has not been efficient in this case and
some settlements were observed while loading in the elastic part of the deflection
curve. Applying a cyclic load could have been a better option to avoid bedding
down movements that was not the case in this test.
Comparing the load-deflection curves as obtained in the experiment and as
obtained from the analysis run in ABAQUS (Figure 3.39) suggests that if the test
curve is modified and shifted to the left, in a way that the extension of the elastic
behaviour (dotted line in Figure 3.39) intersects the origin of axes then the curves
conform reasonably.

CELLULAR BEAMS AT AMBIENT AND ELEVATED TEMPERATURES
105
0
50
100
150
200
250
0 20 40 60 80 100 120 140Def. (mm)
Load
(KN
)
Experiment
ABAQUS
Figure 3.39- Experimental versus modelling results for Leeds Beam 3
The beam failed due to web post buckling in the test and this was correctly
predicted by the developed model as shown in Figure 3.40. Web post buckling is
generally expected in high shear regions (near supports) as discussed in Chapter 2.
This hypothesis was well certified in this long span beam where moment and shear
effects are more distinguishable.

CELLULAR BEAMS AT AMBIENT AND ELEVATED TEMPERATURES
106
Figure 3.40- Web Buckling of the web post near end support in the long span Leeds Beam 3
3.5.3 Internal stresses of web post while buckling
Distribution of internal stresses while buckling was investigated by looking at
principal stresses. Figure 3.41 shows the maximum principal stress in which red
regions of the contour palette present the regions with the maximum tension.
Tensile stresses developed along a diagonal of the web post and were higher in the
two web posts where buckling had taken place, i.e. between openings 1 and 2, and
2 and3.

CELLULAR BEAMS AT AMBIENT AND ELEVATED TEMPERATURES
107
Figure 3.41-Maximum principal stress which represent the tensile stress while buckling
Similarly, looking at minimum principal stresses gave a good indication of the
distribution of compressive stresses (Figure 3.42) which developed in the other
diagonal, but not as clearly as tension. Again, the compression was higher in the
buckled web posts rather than in those further away from the beam support.

CELLULAR BEAMS AT AMBIENT AND ELEVATED TEMPERATURES
108
Figure 3.42-Minimum principal stress which represents the developed compression stress while buckling
3.6 SUMMARY OF THE MODELLING OF CELLULAR BEAMS
AT AMBIENT TEMPERATURE
This chapter presented the numerical approach implemented within ANSYS and
ABAQUS packages to model some of the tests on CBs at ambient temperature.
There was generally a good agreement between the numerical models and the test
results in terms of the failure load and the failure mode.
Within the numerical validations, it was found that the failure mode (and failure
load) of CBs can be very sensitive to boundary conditions. In particular, a slight
change in the way the lateral supports were applied to the top flange, changed the
failure mode from Vierendeel mechanism to web post buckling and reduced the
failure load by almost 40%.
Moreover, it was noted that the failure of CBs by web post buckling can easily be
missed, by mistake, in the numerical models. Vierendeel mechanism took over the

CELLULAR BEAMS AT AMBIENT AND ELEVATED TEMPERATURES
109
failure in the case presented in this chapter where the load increments were not
small enough to allow the model to identify the web buckling mode of failure.

CELLULAR BEAMS AT AMBIENT AND ELEVATED TEMPERATURES
110
4 CELLULAR COMPOSITE BEAMS AT AMBIENT
TEMPERATURE
4.1 INTRODUCTION
Nowadays, cellular beams are widely used in conjunction with concrete slabs
where the resulted composite section benefits from the concrete’s compressive and
steel’s tensile strength. The increasing popularity of cellular composite beams has
led to extensive experimental and numerical investigations into various aspects of
their behaviour. The experimental data of these tests allows researchers to validate
their numerical approaches and employ them to advance their investigation.
Meanwhile the reliability of the simple design methods proposed for these beams
can also be assessed and improved where necessary.
However, numerical modelling of cellular composite beams is rather complex due
to modelling of the rather complicated concrete material, steel-concrete interaction,
occurrence of various failure mechanisms, and convergence problems.
This chapter presents the details of the numerical modelling approach used to
validate the finite element models against the test data for three cellular composite
beams at ambient temperature. In addition, this chapter presents the numerical
results, comparative to the test results, and discusses the results where necessary.
In particular, Section 4.2 of this chapter presents the generics of the approach used
to model concrete material, steel decking, reinforcing mesh of slab, interaction
between the slab and top flange, the issues raised in modelling, and the way they
were tackled. Employing a systematic approach was vital in order to mimic the
experimental results, obtain the required software, validation and fully understand
the structural behaviour.

CELLULAR BEAMS AT AMBIENT AND ELEVATED TEMPERATURES
111
The other three sections of this chapter present the details and results of the three
models developed for cellular composite beams based on the two tests conducted
on cellular composite beams at University of Ulster, in 2005 (Nadjai, 2005), and
one at University of Kaiserslautern in 2002 (RWTH, 2002).
4.2 MODELLING COMPOSITE SLABS USING ABAQUS
4.2.1 General
The numerical modelling was carried out using ABAQUS and validated against the
following experiments.
1) Ulster Beam A1 (Nadjai, 2005)
2) Ulster Beam B1 (Nadjai, 2005)
3) University of Kaiserslautern, RWTH Beam 3 (RWTH, 2002)
The nonlinear analysis on cellular composite beams was carried out on the
following bases:
• The general solver option, which uses an iterative approach based on the
Newton-Raphson method, was used in most of the cases. However, the
Riks method was also used in some cases to avoid divergence problems and
to investigate the post-buckling behaviour.
• Stress-strain relationship for steel and concrete in compression were taken
according to results of one-dimensional tensile or crushing tests and
BSEN1992-1-1 (BSI, 2004a) recommendations.
• Geometrical and material nonlinearities were included in the models
developed for composite slabs. Software manuals (ANSYS, 2003)
generally recommend to exclude the large deformation (P-∆) effects in
models which include concrete material to minimise the convergence
problems associated with modelling concrete. However, this
recommendation was not satisfied in these modelling as geometrical

CELLULAR BEAMS AT AMBIENT AND ELEVATED TEMPERATURES
112
nonlinearities have a vital role in progressive instabilities of web posts
leading to buckling.
4.2.2 Modelling concrete material
This section presents the approach used to introduce the granular concrete material
and associated modelling issues comprising, behaviour in compression, tension,
cracking, crushing and post cracking.
4.2.2.1 Concrete in compression
The uniaxial stress-strain relationship for the concrete, with siliceous aggregates,
was taken from BSEN1994-1-2 (BSI, 2005c) which introduces the following
formula (Equation 4-1) for concrete in compression up to the crushing point.
⎟⎟
⎠
⎞
⎜⎜
⎝
⎛
⎟⎟⎠
⎞⎜⎜⎝
⎛+
=3
,1,1
,
2
3
θθ
θ
εεε
εσ
cc
cf
Equation 4-1
This equation is general and was also used at elevated temperature with reduction
factors presented in BSEN1994-1-2 (BSI, 2005c). Figure 4.1 presents the generic
stress-strain relationship for concrete material in compression for concrete grade
C30/35 with cylinder strength of 28 N/mm2. BSEN1992-1-2 (BSI, 2004a) suggests
the ultimate compressive strain of 0.02, and the strain at the peak of compressive
stress to be 0.0025 for room temperature. ABAQUS manual (Hibbitt et al., 2004a)
clarifies that concrete material loses all of its shear strength after crushing in
compression.
4.2.2.2 Concrete in tension
The uniaxial behaviour of concrete is assumed to be linear up to the yield point.
Various stress-strains curves are proposed for the post-cracking behaviour of
concrete (tension softening). The lower bound is to consider a brittle performance
for concrete after cracking where the material loses all its stiffness in tension after

CELLULAR BEAMS AT AMBIENT AND ELEVATED TEMPERATURES
113
cracking (Figure 4.2). The upper bound is the ductile behaviour where no reduction
occurs in tensile strength after cracking and the strength never reaches zero (Figure
4.2). Other tension softening models have also been suggested such as the Hoerdjik
nonlinear tension softening model (Figure 4.2) for post cracking behaviour
(Hordijk D.A., Cornelissen H.A.W. et al. 1986).
0
5
10
15
20
25
30
0.00 0.01 0.02 0.03Total strain [%]
Stre
ss [N
/mm
2 ]
Figure 4.1 Typical Stress-strain relationship for concrete in compression to BSEN1994-1-2
Figure 4.2- Tension softening curves assumed for concrete
In this research, the post cracking behaviour of concrete was generally assumed to
be a linear reduction to zero (Figure 4.3), unless specifically mentioned. Sensitivity

CELLULAR BEAMS AT AMBIENT AND ELEVATED TEMPERATURES
114
of the behaviour of composite beam slabs to the tension softening, is investigated
in Section 5.4. These sensitivity studies were used to also justify some
manipulations of the post cracking behaviour, which were done to help resolve the
numerical problems associated with concrete cracking.
Figure 4.3- Concrete in tension and fracture energy
The mean value of concrete tensile strength was calculated based on BSEN1992-1-
2, according to Equation 4-2, for concretes with grade less than C50/60.
)3/2(3.0 ckcm ff ×= Equation 4-2
In the absence of experimental data, the fracture energy (Gf) concept (Telford,
1993) was used together with the crack band width theory, presented by Bazant
(Bazant, 1983), to determine the ultimate tensile strain of concrete. Fracture
energy, which is the energy required to propagate a tensile crack on unit area, was
calculated from Equation 4-3, in which the maximum aggregate size defines the
base value of fracture energy (G Fo) (Telford, 1993).
7.0)/( cmocmFof ffGG = Equation 4-3

CELLULAR BEAMS AT AMBIENT AND ELEVATED TEMPERATURES
115
Based on the crack band width theory for fracture of concrete, the ultimate tensile
strain can be worked out according to Equation 4-4.
cut
fu
hG×
=σ
ε2
Equation 4-4
Where hc is crack band width and is dependent on the element size, in particular
the distance between integration points. As mentioned, S4 shell elements were used
to model the concrete slab, which has four integration points. The square root of
the distance between the integration points was taken as the crack band width,
according to the ABAQUS manual recommendation which was based on Bazant’s
theory (Bazant, 1983).
As mentioned the tension softening model was used in this research to consider the
post cracking behaviour of concrete. However, the post cracking stress-strain
relationship of the reinforced concrete can also be represented by another
approach, so-called “tension stiffening” model. It depends on the effects of the
reinforcement/concrete interaction such as dowel action and bond slip. The way the
tension stiffening is defined can be important knowing the fact that using a strain
softening approach can cause an unreasonable sensitivity (of the numerical results
and solution convergence) to the concrete mesh size in the areas with no or low
reinforcement. Crisfield (Crisfield, 1986) addressed this issue and recommended
the Hillerborg's approach (Hillerborg, 1976) as a solution. In Hillerborg's approach,
the energy required to open a unit area of crack is specified as a material parameter
using brittle fracture concepts. Using Hillerborg's approach enables us to address
the brittle behaviour of concrete by a stress-displacement transform, instead of a
stress-strain one.

CELLULAR BEAMS AT AMBIENT AND ELEVATED TEMPERATURES
116
4.2.2.3 Modelling cracking and crushing of concrete in ABAQUS
There are two common approaches available in ABAQUS to simulate the cracking,
post cracking and crushing of concrete which are the smeared crack and damaged
plasticity models (ACI, 1998).
4.2.2.3.1 Concrete smeared cracking model
The concrete smeared cracking method uses oriented damaged elasticity concepts
for the reversible part of the material response after cracking. Cracking is assumed
to occur when the stress reaches a failure surface (crack detection surface) which is
a linear relationship between the equivalent pressure stress (p) and the Mises
equivalent deviatoric stress (q) as shown in Figure 4.4.
Figure 4.4- Crack detection surface in concrete model
In the smeared cracking method, cracks are irrecoverable and limited to three at
any integration point. The orientation of the crack is stored for subsequent
calculations and next cracks are limited to be orthogonal to this direction. It is
because the stress components associated with the open crack are not incorporated
in defining the failure surface used for picking the additional cracks. In this
method, the crack is assumed smeared which means it does not track macro cracks
individually and the effect of the cracking in each integration point enters into the
calculations by modifying the associated stress and material stiffness.
"Crack detection" surface
"Compression" surface
σ c u q
σ c u p
1
1 4 32
2

CELLULAR BEAMS AT AMBIENT AND ELEVATED TEMPERATURES
117
Regarding the plasticity model incorporated to simulate the plasticity of concrete,
the options are generally limited and plasticity models which are based on plane
stress or strain could not be used where stresses and strains are considerable in all
three directions. Simulating the behaviour of the concrete in modelling is based on
the yield surface of the Drucker-Prager (Doran and Koksal, 1998) plasticity. It
represents a 3-dimensional conical failure surface in the principal stresses space.
This failure surface is schematically represented in Figure 4.5 in two dimensions in
which the tensile crack is detected based on the maximum principal tensile stress.
However, the failure surface in compression is dependent on the relative values of
the principal stress.
-1.2 -1.0 -0.8 -0.6 -0.4 -0.2
-1.2
-1.0
-0.8
-0.6
-0.4
-0.2
0.2
0.2
σf c
1
σf c
2
Uniaxial compression
Biaxial compression
Biaxial tension
Uniaxial tensionTension failure
Drucker - Pragerfailure surface
Figure 4.5- Yield and failure surfaces defined for biaxial stress in concrete
Some ratios had to be introduced into ABAQUS models to define the failure
surface. These values were generally defined based on the ones recommended by
ABAQUS user’s manual (unless mentioned) which are as follows:
• For the ratio of the ultimate biaxial compressive stress to the ultimate
uniaxial stress, the recommended value was 1.16.

CELLULAR BEAMS AT AMBIENT AND ELEVATED TEMPERATURES
118
• The absolute value of the ratio of the uniaxial tensile stress at failure to the
ultimate compressive stress was based on the formulation presented in
BSEN1992-1-1 (BSI, 2004a).
• The ratio of the magnitude of a principal component of plastic strain at
ultimate stress in biaxial compression to the plastic strain at ultimate stress
in uniaxial compression was assumed to be 1.28.
4.2.2.3.2 Concrete damaged plasticity model
The damaged plasticity model generally uses the concept of isotropic damaged
elasticity in combination with isotropic tensile and compressive plasticity to
express the inelastic behaviour of concrete. Unlike the smeared crack approach, it
assumes that the material properties after cracking degrade uniformly in all the
directions, regardless of the crack direction and pattern. More details about this
approach could be found in the ABAQUS materials manual (Hibbitt et al., 2004a).
In this research the smeared crack model (which is numerically more stable) was
the default approach for modelling the concrete material. The shear strength of
concrete after the crack is defined as the “shear retention” factor and relates the
shear stiffness of an open crack linearly to the magnitude of the crack opening. The
default value of 1, which means no reduction in shear resistance of concrete after
cracking, was used in modelling. This factor, and also the tension softening
behaviour of concrete, did not affect the results of modelling cellular composite
beams at ambient temperature (refer to Section 5.3) as most of the tension, if not
all, is resisted by the steel beam and concrete does not participate notably.
However, considering no decrease in shear stiffness after cracking was helpful in
avoiding convergence problems.
The following sections present the modelling details and results for the two cellular
composite beams tested by the University of Ulster (Nadjai, 2005) at ambient
temperature and one which was carried out by the Kaiserslautern University
(RWTH, 2002).

CELLULAR BEAMS AT AMBIENT AND ELEVATED TEMPERATURES
119
4.3 MODELLING ULSTER BEAM A1
4.3.1 Introduction and objectives
A total of six full-scale cellular composite beams were tested on behalf of Westok
(Westok, 1985) at University of Ulster in 2006, two at ambient and four at elevated
temperature. Two ambient tests were used to assess the analytical models for
cellular beams, Cellbeam V.5 (Simms, 2005) software and its accuracy in
predicting the failure mode and load, and finally calibrate numerical models for
further studies. The ambient tests also aimed to prepare the basis for the four fire
tests, on similar geometries, to investigate the critical temperature (the minimum
temperature which causes the failure) of web post and finally establish fire
protection recommendations. These destructive tests were carried out because of
the lack of data to validate models and design methods.
4.3.2 Details of the modelling approach
This section describes the details of the modelling of symmetric Beam A1 which
was subjected to two point loads. In addition, this section presents the numerical
results and compares them against the experimental data. Figure 4.6 shows the
geometry of Beam A1 spanning 4500 mm in which the opening diameter was
375 mm at 500 mm centres with a minimum web post width of 125 mm. The cell
diameter to pitch ratio was 1.33 having a slenderness ratio of d/t = 83.9 with a Tee
which satisfied the geometric limits recommended by SCI publication P355
(Lawson and Hicks, 2009) for cellular beams. Details about this test could be found
in the test report (Nadjai, 2005).

CELLULAR BEAMS AT AMBIENT AND ELEVATED TEMPERATURES
120
150 mm thick slab
4500mm
Detailing of Symmetric Composite Celluar Beam (A1, A2 and A3)
375 mm dia. cells at 500 mm centres
UB 406X140X39 Top & Btm Tee
3
Figure 4.6- Details of the symmetric beam A1
4.3.2.1 Steel beam
Top and bottom Tee sections of Beam A1 were produced from a section size
UB406×140×39, steel grade S355 with the finished depth of 575 mm. Table 4.1
shows the tensile test results carried out by Corus which were compared against the
results of the tensile tests conducted by the University of Ulster (Nadjai, 2005).
There was a good correlation between the two material tests and these values were
averaged and introduced to the ABAQUS model in accordance with the bilinear
stress-strain relationship proposed by BSEN1993-1-1 (BSI, 2005a) for structural
steel.
Table 4.1- Tensile test results for Beam A1

CELLULAR BEAMS AT AMBIENT AND ELEVATED TEMPERATURES
121
4.3.2.2 Concrete slab
The concrete slab was nominally 150 mm thick and 1200 mm wide and constructed
with normal weight concrete. The characteristic compressive strength of the
concrete was tested by three concrete cube samples, at the time of testing, which
gave an average strength of 35 N/mm2. The cylindrical strength is a better
representative of the actual strength as it excludes the stiffening effect due the
corners of the cube. The cylinder strength of 28.6 N/mm2 was considered in the
numerical model.
A composite shell element, incorporating the smeared crack approach for concrete,
was used to model the concrete slab. Using a composite shell to model the slab
enabled both the steel deck, as a bottom layer, and reinforcing mesh, as a layer
within the concrete layers, to be considered in this composite shell element.
Sections 4.3.2.3 and 4.3.2.4 discuss the modelling of the mesh and steel deck in
more detail. The fracture energy concept, as explained earlier, was used for post
cracking and ultimate tensile strain of concrete.
4.3.2.3 Steel reinforcing mesh
The slab reinforcement consisted of typical welded wire mesh reinforcement A142
(7 mm bars at 200 mm centres) with yield strength of 500 N/mm2. In order to
incorporate the reinforcing mesh into the shell element to model the slab, the
approach was to introduce the mesh as a mid-layer with an equivalent thickness
based on the diameter and spacing of the bars. Therefore, the composite shell for
the slab constituted of four layers, from the top concrete, reinforcing mesh,
concrete and finally the steel decking.
4.3.2.4 Steel deck
The steel decking used in the test was a Holorib (HR 51/150) with a thickness of
1.25 mm and yield stress of Fy=327 N/mm2 measured from a tensile test (Nadjai,
2005). Using a composite (layered) shell to model the slab gave the ability to
integrate the effect of the strength of the steel deck within the numerical model.

CELLULAR BEAMS AT AMBIENT AND ELEVATED TEMPERATURES
122
The deficiency of using shell elements (instead of solid elements) to model the slab
was that it did not allow the exact geometry of the deck to be modelled. However,
BSEN1994-1-2 (BSI, 2005c) states that the effective structural depth of a slab with
steel decking should be taken as the net concrete depth, when deck troughs are
oriented perpendicular to the beam direction.
4.3.2.5 Shear studs
Full interaction between the slab and beam was ensured by the use of a high
density of shear connectors (19 mm diameter studs at height 120 mm), as shown in
Figure 4.7. Shear studs were equally distributed in one row with a spacing of
150 mm over the beam length.
Figure 4.7- Providing high density of shear connectors to ensure 100% steel-concrete interaction (Source: the test report (Nadjai, 2005))
Therefore, full interaction was considered between the top flange and concrete slab
in the modelling. This assumption was well justified by the fact that no stud failure

CELLULAR BEAMS AT AMBIENT AND ELEVATED TEMPERATURES
123
occurred prior to overall failure of the beam due to web post buckling, according to
the test report (Nadjai, 2005).
4.3.2.6 Testing procedure
Load cycles at a load level of 20% and 60% of the pre-design load predicted by
Westok software were applied to the beam to avoid the slippage of the load cells
and bedding down of the supports. Each load step with a value of 10 (kN/step) was
kept for 3 minute intervals and a “Restraint frame” blocked the lateral deflection of
the test specimen as shown in Figure 4.8.
Figure 4.8- Test set up for Beam A1(Source: the test report (Nadjai, 2005))
4.3.3 Numerical results for the Beam A1
As mentioned, two numerical models were generally developed and run for each
beam. The first one was to do a linear buckling analysis to obtain the buckling
modes to allow an imperfection to be applied to the initial geometry by introducing
a reasonable buckling amplitude. This was then followed by the second model to
do the main nonlinear analysis.
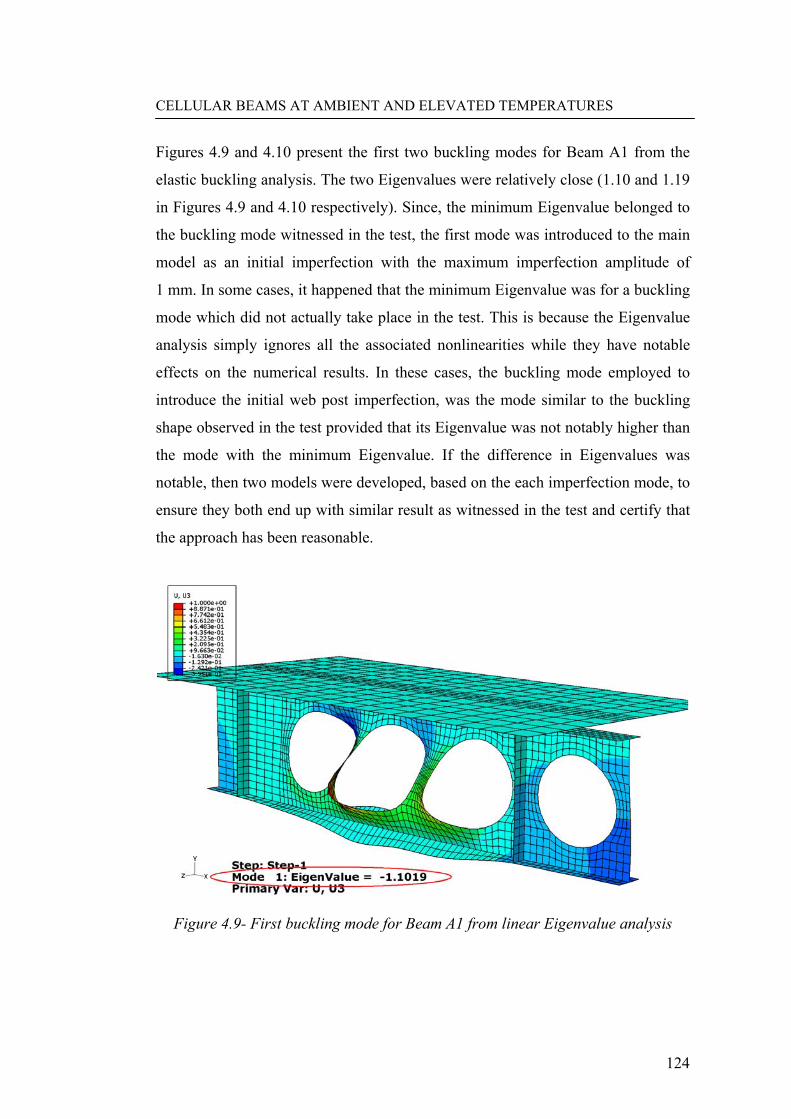
CELLULAR BEAMS AT AMBIENT AND ELEVATED TEMPERATURES
124
Figures 4.9 and 4.10 present the first two buckling modes for Beam A1 from the
elastic buckling analysis. The two Eigenvalues were relatively close (1.10 and 1.19
in Figures 4.9 and 4.10 respectively). Since, the minimum Eigenvalue belonged to
the buckling mode witnessed in the test, the first mode was introduced to the main
model as an initial imperfection with the maximum imperfection amplitude of
1 mm. In some cases, it happened that the minimum Eigenvalue was for a buckling
mode which did not actually take place in the test. This is because the Eigenvalue
analysis simply ignores all the associated nonlinearities while they have notable
effects on the numerical results. In these cases, the buckling mode employed to
introduce the initial web post imperfection, was the mode similar to the buckling
shape observed in the test provided that its Eigenvalue was not notably higher than
the mode with the minimum Eigenvalue. If the difference in Eigenvalues was
notable, then two models were developed, based on the each imperfection mode, to
ensure they both end up with similar result as witnessed in the test and certify that
the approach has been reasonable.
Figure 4.9- First buckling mode for Beam A1 from linear Eigenvalue analysis

CELLULAR BEAMS AT AMBIENT AND ELEVATED TEMPERATURES
125
Figure 4.10- Second buckling mode for Beam A1 from linear Eigenvalue analysis
Figure 4.11 compares the load-deflection curves for numerical and test results for
Beam A1. The numerical model developed for this beam reached its ultimate
capacity at 415 kN, within 11% percent of the test result where failure occurred at
370 kN. Moreover, the numerical model developed for Beam A1 also predicted the
correct failure mode of web post buckling certifying the validity of the numerical
approach used to model this beam. Figure 4.12 shows the occurrence of the S-
shaped web post bucking in Beam A1 and Figure 4.13 shows the correct prediction
of the governing failure mechanism by the developed FE model. More pictures of
the tests carried out at the University of Ulster are available in Appendix A of this
thesis.

CELLULAR BEAMS AT AMBIENT AND ELEVATED TEMPERATURES
126
0
100
200
300
400
500
600
0 50 100 150 200Deflection (mm)
Load
(kN
)
Experiment
ABAQUS
WPB at 370 kN
WPB at 415 kN
Figure 4.11- Load-deflection comparison for Beam A1, FE model versus test
Figure 4.12- S-Shaped web post buckling of Beam A1 (Source: the test report (Nadjai, 2005))

CELLULAR BEAMS AT AMBIENT AND ELEVATED TEMPERATURES
127
Figure 4.13- The web post bucking of the Beam A1
The contour plot in Figure 4.14 shows the Von Mises stress distribution of this
beam while buckling. Investigating the Von Mises stress at critical bottom Tees
shows that the Vierendeel mechanism was not imminent.
Figure 4.14- Von Mises stress contour plot to check Vierendeel mechanism

CELLULAR BEAMS AT AMBIENT AND ELEVATED TEMPERATURES
128
4.3.4 Investigating stress distribution at failure
Figure 4.15 is the plot of maximum principal stresses (which represents tension)
while buckling, which shows tensile stresses have developed diagonally across the
openings. According to this figure, the maximum principal stress has been zero in
the opposite diagonal which means all principal stresses have been negative i.e.
compressive.
Figure 4.15- Max principal stress representing tensile stresses
The graph presented in Figure 4.16 is the maximum principal stress for the three
nodes of the two tensile diagonals addressed in Figure 4.15 (Nodes A to F).
Interestingly, the maximum tensile stress was higher in top web nodes A and D
than the bottom nodes C and F and this shows how dominant the secondary
moments (due to Vierencdeel action) can be compared to primary moments (due to
global bending). Expectedly, the ends of these diagonals experienced notably
higher tensile stresses than mid nodes B and E. In all six nodes, tension increased
smoothly until web buckling. At this stage, a sudden change was observed in these
curves associated with a new pattern of stresses distribution.

CELLULAR BEAMS AT AMBIENT AND ELEVATED TEMPERATURES
129
0
100
200
300
400
500
0 100 200 300 400 500Load (kN)
Max
Prin
cipa
l Stre
ssNode ANode BNode CNode DNode ENode F
Figure 4.16- Maximum principal stress in tensile diagonals
This developed tension helps stabilising the other diagonal (strut) which is under
compression (Figure 4.17) and acts to delay the web buckling. However, the
buckling resistance of the web post in the simple design methods is currently
formulated just based on the compression force (C) applied to the strut ends and
any effects of tension force (T) are conservatively ignored
Figure 4.17- Compressive force in the strut and tension in the opposite diagonal

CELLULAR BEAMS AT AMBIENT AND ELEVATED TEMPERATURES
130
Similarly, Figure 4.18 shows the distribution of minimum principal stresses, to
present the compressive stresses which are again developed in a diagonal pattern.
Six nodes are addressed in the strut in compression to look into their stresses
during and after buckling.
Figure 4.18- Min principal stress representing the compressive stress
According to Figure 4.19, which presents the minimum principal stresses, two ends
of the strut have experienced similar compressive stresses in the early stages of
loading, being notably higher than compression at the mid nodes B and E.
However, initiation of buckling was associated with a sudden reduction of
compressive stress at the bottom end of the strut (nodes H and J) and increase at
top end (nodes G and I) certifying a notable stress redistribution while buckling.

CELLULAR BEAMS AT AMBIENT AND ELEVATED TEMPERATURES
131
-500
-400
-300
-200
-100
0
100
0 100 200 300 400 500
Node H
Node B
Node G
Node J
Node E
Node I
Figure 4.19- Min Principal stresses in compressive strut for Beam A1
Figure 4.20 shows the stress distribution after the buckling which shows that the
diagonal stretch of compression and tension stresses has changed to high
compressive and tensile stresses at the top and bottom half of the web post
accordingly.

CELLULAR BEAMS AT AMBIENT AND ELEVATED TEMPERATURES
132
Figure 4.20- Stress distribution after web buckling
4.4 MODELLING ULSTER BEAM B1
4.4.1 Modelling
The same studies were conducted on the highly asymmetric Beam B1 spanning
4500 mm, in which the top Tee section was based on UB 406×140×39, the bottom
Tee was based on UB 457×152×52 and the beam had a finished depth of 630 mm
(Figure 4.21). This beam was subjected to one point load. The diameter of the
cellular openings was 450 mm, at 630 mm centres, with a minimum web post
width of 180 mm. Therefore, the cell diameter to pitch ratio was 1.4 (the minimum
permitted), and the ratio of the top to bottom Tee area was 1 to 1.43. Material
properties and other test details for this beam were identical to Beam A1 and more
details about this test could be found in the test report (Nadjai, 2005).

CELLULAR BEAMS AT AMBIENT AND ELEVATED TEMPERATURES
133
450 mm dia. cell at 630 mm centres
4500mm
150 mm thick slab
406x140UB39 Top & 457x152UB52 Btm Tee
Detailing of Asymmetric Composite Celluar Beam (B1, B2 and B3)
Figure 4.21- Details of the asymmetric beam B1
4.4.2 Results of modelling for Beam B1
The preliminary buckling analysis provided the two modes presented in Figures
4.22 and 4.23 as the ones with least Eigenvalues. In Beam B1, unlike Beam A1,
both modes induce the imperfection shape which was consistent with the buckling
mode observed in the test, and therefore could be used. The second mode was
employed to introduce an imperfection with a maximum amplitude of 1 mm.

CELLULAR BEAMS AT AMBIENT AND ELEVATED TEMPERATURES
134
Figure 4.22- First buckling mode for Beam B1 based on linear Eigenvalue analysis
Figure 4.23- Second buckling mode for Beam B1 based on linear Eigenvalue analysis
The nonlinear analysis was then followed after the Eigenvalue analysis. Figure
4.24 shows the occurrence of the web post buckling in the test which was correctly
predicted by the developed finite element model, as presented in Figure 4.25.

CELLULAR BEAMS AT AMBIENT AND ELEVATED TEMPERATURES
135
Figure 4.24- S-shaped web buckling as the governing failure mode of Beam B1(Source: the test report (Nadjai, 2005))
Figure 4.25- Occurrence of the S-shaped web buckling of Beam B1 in the ABQAUS model
Figure 4.26 reflects the out-of-web plane displacements for nodes A and B which
shows a sudden increase in the lateral displacements of the web post due to

CELLULAR BEAMS AT AMBIENT AND ELEVATED TEMPERATURES
136
buckling. This figure also shows that the S-shaped buckling mode has gradually
and constantly been forming from the first stages of loading.
-40
-30
-20
-10
0
10
20
30
40
50
60
0 100 200 300 400 500
Load (kN)
Out
of w
eb p
lane
Dis
. (m
m)
Node A
Node B
Figure 4.26- Out-of-web plane displacement of the buckled web post
Figure 4.27 compares the load-deflection curves for the experiment versus the
modelling results which shows the reasonable difference of 10% in predicting the
failure load.

CELLULAR BEAMS AT AMBIENT AND ELEVATED TEMPERATURES
137
0
100
200
300
400
500
600
0 50 100 150 200 250 300 350 400 450 500Def. (mm)
Load
(kN
)
Experiment
Numerical Model
Figure 4.27- Numerical and experimental results for Beam B1
Validation of the numerical models developed for Beam A1 and Beam B1 was
vital in the sense that they could be reasonably used for further parametric studies
not only to investigate, and compare, the behaviour of symmetric and asymmetric
beams, but also to compare their performance at ambient against elevated
temperature.
Figure 4.28 presents the contour plot for the minimum principal stress while
buckling which shows that development of compression at the two ends and along
the length of strut in asymmetric Beam B1 was not as obvious as that of Beam A1.
It also shows that bottom end of the strut experienced higher compressions than the
top end, while buckling.
Appendix B of this thesis presents the input file to model this beam using the
ABAQUS package.

CELLULAR BEAMS AT AMBIENT AND ELEVATED TEMPERATURES
138
Figure 4.28-Plot of minimum principal stresses in Beam B1 while buckling
4.5 MODELLING RWTH BEAM 3
4.5.1 Details of the test
A total of 4 composite beams were tested by the Institute of Steel Construction
(RWTH) in the University of Kaiserslautern (2002). These perforated composite
beams were particularly constructed to look into the composite action in the end
cell, behaviour of elongated openings, design of highly asymmetric sections and
the behaviour of stiffened web openings (RWTH, 2002).
As the main focus of this research was neither elongated openings nor stiffened
web openings, only Beam 3 of the four RWTH’s tested beams was modelled as the
last validation of composite beam slabs at ambient temperature. This beam was a
highly asymmetrical steel section and failed due to web post buckling. Figure 4.29
shows the general scope of this asymmetric beam in which the area ratio of the
bottom to top flange was 4, greater than the limit allowed in the BSEN1994-1-1,
which is 3. Moreover, the concrete slab was not taken to the support at one end, to
check the composite action in the end panel, and therefore, the full length of the

CELLULAR BEAMS AT AMBIENT AND ELEVATED TEMPERATURES
139
beam was modelled because of unsymmetrical geometry. More details about the
test is available in the RWTH test report (RWTH, 2002).
1800
484.
6 614.
6
130
Based on IPE300
Based on HEB340
Figure 4.29- Geometric details of RWTH Beam 3
4.5.2 Numerical model
This section covers the details of the approach used to model RWTH Beam 3 in
ABAQUS.
4.5.2.1 Steel beam
The actual section dimensions and thicknesses of the steel beam were measured in
the test and these values were considered in the numerical model, instead of
nominal values.

CELLULAR BEAMS AT AMBIENT AND ELEVATED TEMPERATURES
140
The upper and lower Tees were produced based on IPE300 and HEB340 steel
sections correspondingly, both with steel grade S355. Tensile tests were carried out
on the web and flange of the beam (two samples of the flange and one of the web)
and ultimate strains, ultimate strength and yield strength of the section were
derived from the test report to define the bilinear stress-strain curves. Table 4.2
shows the values used in modelling which were the averages of the data achieved
from the tensile test. The only value missing in the report was the yield strength of
the web of HEB340, highlighted with a “?” mark in the table. This value was
estimated based on the other available values measured at other sections which
suggested Fu/Fy~1.20 to estimate the missing value. The modulus of elasticity (E)
was not available in the report. It was initially assumed 210 kN/mm2 and then
reduced to 195 kN/mm2 for a better fit with the initial elastic part of load-deflection
curve.
Table 4.2- Average values gained from the tensile test and used in modelling
4.5.2.2 Steel decking
The overall thickness of the slab was 130 mm and Holorib sheets HR 51/150
(Figure 4.30) with a thickness of 1.25 mm were used as steel decking. The
measured yield stress was fy= 327 N/mm2 and deck troughs were oriented
perpendicular to the beam direction.

CELLULAR BEAMS AT AMBIENT AND ELEVATED TEMPERATURES
141
Figure 4.30-- Steel sheeting used in the RWTH Beam 3
The slab and Holorib heights were 130 mm and 51 mm respectively. Therefore, the
thickness of the concrete slab in modelling was reduced to an equivalent thickness
of 79 mm plus 1.25 mm, similar to the Ulster beams, to consider the contribution
of the steel decking. It should be noted that by default, the thickness of the shell
element in ABAQUS extends equally from both sides of the mid-shell plane.
Therefore, the position of the composite shell, relative to the top flange, was
adjusted to end up with an overall composite beam depth equal to that of the actual
beam (Figure 4.31).
Figure 4.31- The approach used for the slab thickness and steel decking

CELLULAR BEAMS AT AMBIENT AND ELEVATED TEMPERATURES
142
4.5.2.3 Reinforcement
The minimum isotropic mesh reinforcement of 0.4% in longitudinal and transverse
direction was provided in the slab which was located at 20 mm from top of the
concrete face. Reinforcing mesh bars were again considered as a layer in the
composite shell used to model the concrete slab.
4.5.2.4 Concrete
The concrete grade was C25/30 with the concrete cubic strength of 30.2 N/mm2.
The characteristic cylindrical strength of 25 N/mm2 was introduced into the
numerical model. The ultimate tensile strength of concrete was assumed 2.5
N/mm2 based on Equation 4-2. The post cracking behaviour of the concrete was
again based on the fracture energy with regard to maximum aggregate (16 mm) and
element size (distance between integration points) as explained in Section 4.2.2.2.
4.5.2.5 Shear studs
Full steel-concrete shear interaction was provided in the test by using sufficient
welded type of studs. Therefore, the degree of shear connection in modelling was
set to 100%, i.e. no slippage. There was no shear stud failure, prior to beam failure
by web post buckling, which justified assuming the full beam-slab interaction in
the model.
4.5.3 Numerical results against the test results
Figure 4.32 shows the full-length model developed for this beam. The web post
buckling between the openings 11 and 12 (where the slab was not taken) governed
the ultimate loading capacity in the developed model which conformed with the
test observations (see Figure 4.33).
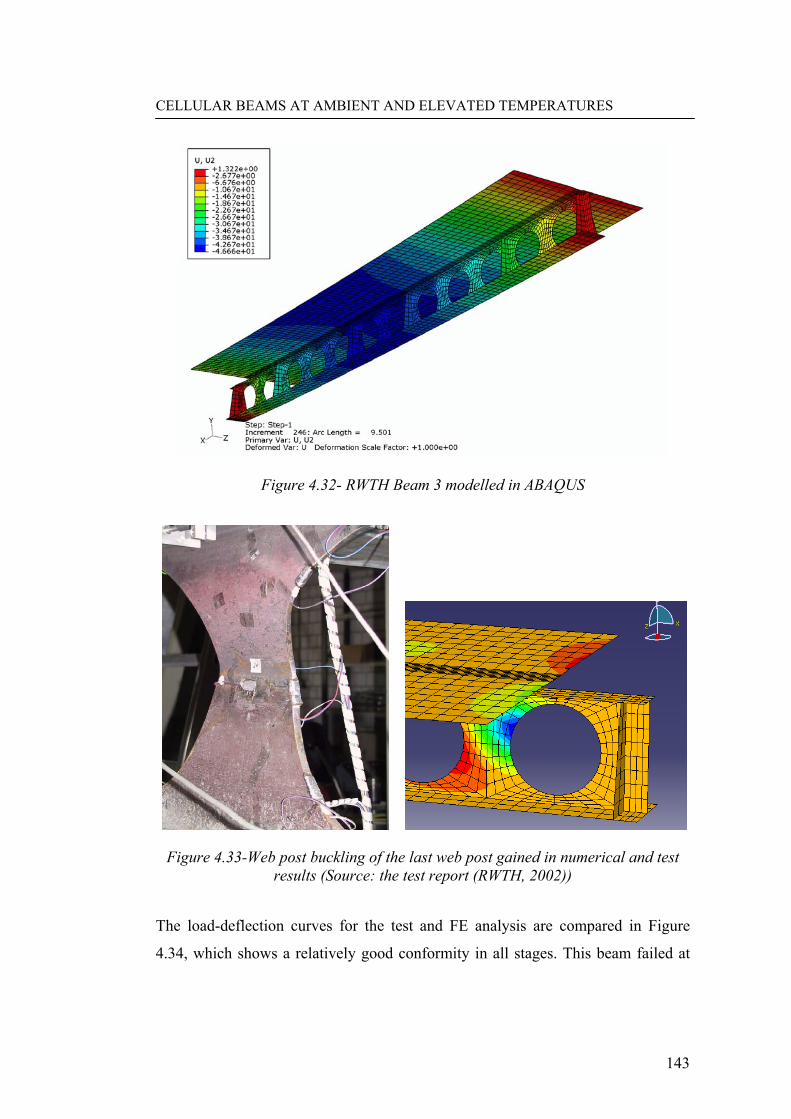
CELLULAR BEAMS AT AMBIENT AND ELEVATED TEMPERATURES
143
Figure 4.32- RWTH Beam 3 modelled in ABAQUS
Figure 4.33-Web post buckling of the last web post gained in numerical and test results (Source: the test report (RWTH, 2002))
The load-deflection curves for the test and FE analysis are compared in Figure
4.34, which shows a relatively good conformity in all stages. This beam failed at

CELLULAR BEAMS AT AMBIENT AND ELEVATED TEMPERATURES
144
680 kN in the numerical model which was within 4% of the 658 kN observed in
the test.
0
100
200
300
400
500
600
700
800
0 10 20 30 40 50Deflection (mm)
Load
(kN
)
Test
ABAQUS Model
Figure 4.34- Comparison of the model and test Load-Deflection curves for RWTH Beam 3
4.6 SUMMARY OF THE MODELLING OF CELLULAR
COMPOSITE BEAMS AT AMBIENT TEMPERATURE
The ABAQUS package was used to model the two composite beams tested at
University of Ulster and Beam 3 of RWTH tests at ambient temperature. There was
a good correlation between the numerical results and the test results in terms of the
failure mode and the failure load. This calibration allowed these models to be used
for some case studies, which are presented in Chapter 5.

CELLULAR BEAMS AT AMBIENT AND ELEVATED TEMPERATURES
145
5 PARAMETRIC STUDIES ON CELLULAR COMPOSITE
BEAMS AT AMBIENT TEMPERATURE
5.1 INTRODUCTION
This chapter presents the findings from the parametric studies conducted on
validated models for cellular composite beams at ambient temperature. In
particular, the symmetric Ulster Beam A1 and asymmetric Beam B1 were
employed to investigate the influence of web post imperfections, concrete tensile
behaviour, web stiffeners and finally loading type, in the performance of cellular
composite beams at ambient temperature.
5.2 EFFECT OF LOADING TYPE
Cellular beams are normally used as secondary beams in structures and mostly
experience distributed loads, rather than point loads. Therefore, it was important to
look into their performance under a distributed load (UDL). Examining Beam A1
and A2 under a UDL was not only useful in enlightening how different they
behave under a UDL as opposed to point loads, but also in providing the failure
load of these two beams which was necessary to apply the correct load ratio
(utilisation factor) for similar case studies in fire conditions.
5.2.1 Effect of loading type on symmetric beam
In this case study the loading type was changed from a point load to distributed
load and the two web stiffeners, located under the two point loads, were
eliminated. Figure 5.1 shows the occurrence of web buckling as the failure mode of
this beam. This was clearly more dominant in the end panel, which had the highest
combination of shear and moment.

CELLULAR BEAMS AT AMBIENT AND ELEVATED TEMPERATURES
146
Figure 5.1- Web post buckling of Beam A1 without web stiffeners, under a UDL at ambient temperature
However, similar studies conducted at elevated temperature, which are presented
later in Section 7.4, showed that eliminating the web stiffeners considerably
reduced the beam’s resistance against fire as the beam tends to fail notably sooner
than expected due to distorsional buckling (Bradford, 1992), instead of web
buckling. Re-adding the eliminated web stiffeners (returning to the original
geometry) proved very useful in avoiding the distorsional buckling at elevated
temperature.
Therefore, a UDL was also introduced to the original geometry (including web
stiffeners) to see the impact of web stiffeners at ambient temperature and to also
provide the failure load for future investigations in fire condition. Figure 5.2 shows
the failed shape of this beam, again due to web buckling and Figure 5.3 compares
the load-deflection curve between the beams with and without web stiffeners,
which underlines 14% difference between the failure loads. The beam without
stiffeners failed at a 126 kN/m while the beam with web stiffeners failed at
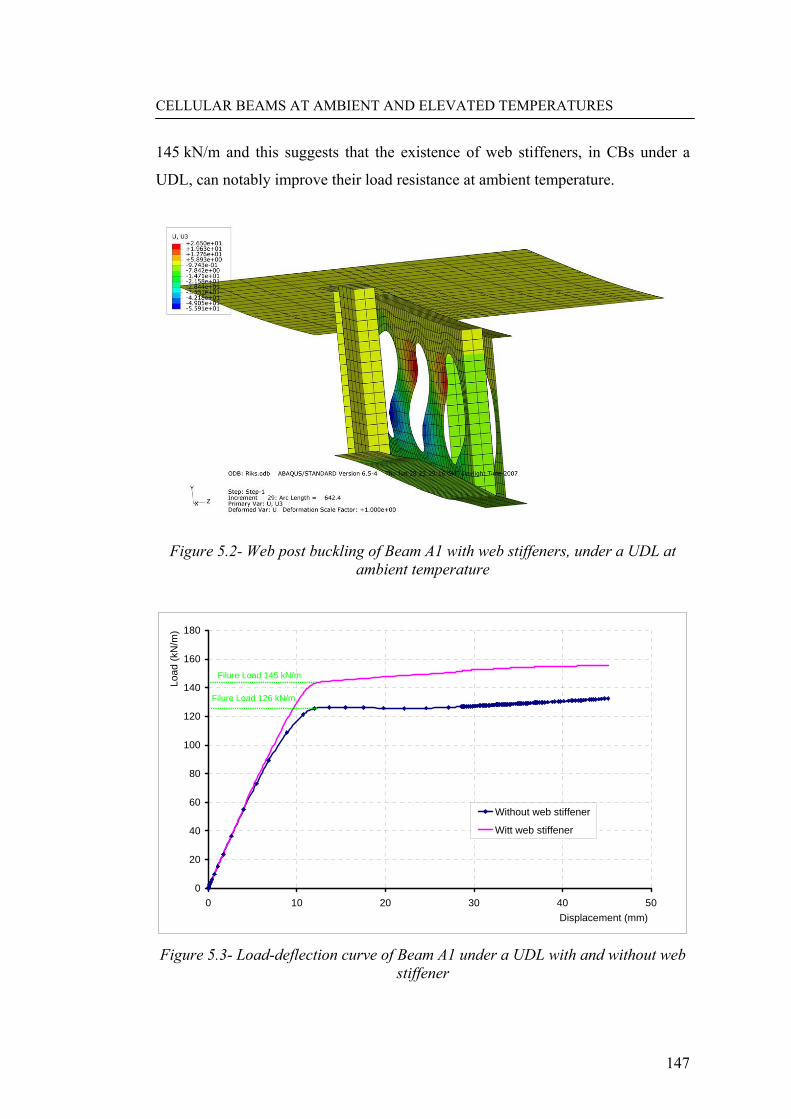
CELLULAR BEAMS AT AMBIENT AND ELEVATED TEMPERATURES
147
145 kN/m and this suggests that the existence of web stiffeners, in CBs under a
UDL, can notably improve their load resistance at ambient temperature.
Figure 5.2- Web post buckling of Beam A1 with web stiffeners, under a UDL at ambient temperature
0
20
40
60
80
100
120
140
160
180
0 10 20 30 40 50Displacement (mm)
Load
(kN
/m)
Without web stiffener
Witt web stiffener
Filure Load 145 kN/m
Filure Load 126 kN/m
Figure 5.3- Load-deflection curve of Beam A1 under a UDL with and without web
stiffener

CELLULAR BEAMS AT AMBIENT AND ELEVATED TEMPERATURES
148
5.2.2 Effect of loading type on asymmetric beam
Similar studies were conducted on applying a UDL this time on the asymmetric
Beam B1, with and without a web stiffener. This beam only had one stiffener,
located at the mid-span where the point load was applied.
Figure 5.4 shows the failed shape of the beam without a stiffener in which the web
post buckling is associated with some distorsional buckling at the bottom Tee.
Figure 5.5 presents the final deformed shape of the beam with a web stiffener in
which web post buckling dominated the failure. Finally, Figure 5.6 compares the
load-deflection curves for the cases without and with a web stiffener (original
geometry) in which the beam failed at 154 kN/m and 159 kN/m respectively.
Figure 5.4- Web post buckling of Beam B1 without web stiffeners, under a UDL and at ambient temperature

CELLULAR BEAMS AT AMBIENT AND ELEVATED TEMPERATURES
149
Figure 5.5- Web post buckling of Beam B1 with web stiffeners, under a UDL and at ambient temperature
0
20
40
60
80
100
120
140
160
180
0 5 10 15 20 25 30
Displacement (mm)
Load
(kN
/m)
Without Web Stiffener
With Web Stiffener
159 kN/m154 kN/m
Figure 5.6- Load-deflection curve of Beam B1 under a UDL with and without web stiffener
In brief, a full-height web stiffener notably affected the load capacity of these
beams. The influence of existence or non-existence of web stiffeners, on the

CELLULAR BEAMS AT AMBIENT AND ELEVATED TEMPERATURES
150
loading capacity of Beam B1 was not as much as Beam A1 (affected by 3% and
14% respectively). This could be due to Beam B1 having 1 stiffener while Beam
A1 had 2 stiffeners. Excluding web stiffeners allows for the development of
relative displacements between the top and bottom Tees, in the out-of-web plane
direction. This case was more evident in the asymmetric beam in which stronger
bottom Tees resists higher vertical loads (P), transferred through web posts.
Therefore, the associated P-∆ effects between the top and bottom Tees become
more dominant. However, these displacements were not significant enough to
result in purely distorsional buckling at ambient temperature. Similar studies at
elevated temperature are presented later in Section 7.4 where distorsional buckling
completely dominated the failure.
5.3 EFFECT OF TENSILE BEHAVIOUR OF CONCRETE
Based on the fact that in cellular composite beams, most of tensile force, if not all,
is resisted by the steel beam, the tensile characteristics of concrete were not
expected to play a critical role in the overall behaviour of these beams at ambient
temperature.
The model was run twice to compare the influence of assuming brittle or ductile
behaviour for the post-cracking phase of concrete. Figure 5.7 compares the results,
which shows minimal difference between the two cases. Similar curves were
repeated for the case study on the shear retention factor of concrete (described in
Section 4.2.2.3.2) which shows the behaviour was not notably dependent on this
factor.

CELLULAR BEAMS AT AMBIENT AND ELEVATED TEMPERATURES
151
0
100
200
300
400
500
600
0 50 100 150 200Deflection (mm)
Load
(kN
)
Experiment
Brittle post cracking
Ductile post cracking
Figure 5.7- Comparing the load-deflection curves for Beam A1 assuming ductile and brittle behaviour for concrete after cracking in tension
5.4 EFFECT OF WEB IMPERFECTIONS
The impact of the web post imperfections on the performance of cellular beams at
ambient temperature was investigated by applying various imperfection amplitudes
to models developed for Beam A1 and Beam B1.
5.4.1 On symmetric Beam A1
Figure 5.8 compares the load-deflection curves resulting for various imperfection
amplitudes which shows that the load-deflection curve was slightly affected by the
magnitude of the imperfection value. This figure also highlights how important it is
to apply a reasonable web imperfection to the model. In particular, the model with
“Imp= 0.02 mm” has not still buckled in notably higher loads which shows how
this can cause notable differences between modelling and test results.

CELLULAR BEAMS AT AMBIENT AND ELEVATED TEMPERATURES
152
0
100
200
300
400
500
600
0 40 80 120 160 200Deflection (mm)
Load
(kN
)
Experiment
Imp=.02 mm
Imp=10 mm
Imp=1 mm
Figure 5.8-Effect of web post imperfection in the load-deflection curve for Beam A1
5.4.2 On asymmetric Beam B1
Similar studies were conducted on the asymmetric Beam B1 and the diagram in
Figure 5.9 presents these results for a wide range of imperfection amplitudes,
between 0.02 to 5 mm. This figure clearly shows that the load in which the beam
buckled has been notably affected by the imperfection amplitude. Comparing
Figure 5.9 with Figure 5.8 reveals that the ultimate loading capacity of the
asymmetric beam was more sensitive to web imperfections than the symmetric
one. This could be explained by the higher dependency of the ultimate capacity of
asymmetric (as opposed to symmetric) beams to the bottom Tee while the
contribution of the bottom Tee is through the web post. Therefore, an increase of
the web post imperfection affects the ultimate loading capacity of asymmetric
beams more than symmetric ones.

CELLULAR BEAMS AT AMBIENT AND ELEVATED TEMPERATURES
153
0
100
200
300
400
500
600
0 100 200 300 400 500Def. (mm)
Load
(kN
)
ExperimentImp=2 mmImp=0.2 mmImp=0.02 mmImp=5 mm
Figure 5.9- Effect of web post imperfection in the load-deflection curve for Beam B1
The importance of web imperfections at elevated temperature is investigated later
in Chapter 7, where comparisons are also made to see how important imperfections
are at elevated compared to ambient temperature.
5.5 SUMMARY OF THE CASE STUDIES ON THE CELLULAR
COMPOSITE BEAMS AT AMBIENT TEMPERATURE
This chapter presented the case studies on symmetric and asymmetric composite
beams at ambient temperature. The loading type was changed from point loads to a
UDL. This was associated with removing the web stiffeners, which resulted in the
asymmetric beam failing due to distorsional buckling. Re-adding the full-height
web stiffeners avoided the occurrence of distorsional buckling, by preventing the
relative displacements of the top to bottom Tee, and increased the loading capacity
by up to 14%.

CELLULAR BEAMS AT AMBIENT AND ELEVATED TEMPERATURES
154
Investigations also covered the role of web imperfections on the performance of
cellular composite beams at ambient temperature. Although the post failure
performance of the beam was almost unaffected by the imperfection amplitude, the
buckling (failure) load was found to be dependent to the imperfection amplitude.

CELLULAR BEAMS AT AMBIENT AND ELEVATED TEMPERATURES
155
6 CELLULAR COMPOSITE BEAMS AT ELEVATED
TEMPERATURE
6.1 INTRODUCTION
The great practicality and increasing use of cellular beams together with lack of
codified and robust design guides on the design of CBs at elevated temperature,
has underlined the necessity of further investigations in this regard. One of the
controversial issues has been the requirements for intumescent protection for these
beams. A rather unreasonable rule (ASFP et al., 1992) for beams with web
openings, asked for 20% extra coating thickness compared to solid-web beams,
which has been subjected to criticisms.
Researchers have also been trying to develop a simple but reliable design model for
these beams at elevated temperature. Meanwhile the experimental data have had a
critical and inevitable role in evaluation and validation of these approaches.
Only very limited experiments were carried out by 2006 on cellular composite
beams at elevated temperature. As explained in Section 2.4.3, the only
experimental data was from the two fire tests conducted by CTICM in 2002 and
one fire test by the University of Manchester. All three fire tests were carried out
on fire protected beams to investigate the efficiency and effect of fire protection
material rather than the performance of the beam itself.
In 2006, four unprotected cellular composite beams were tested at elevated
temperature at University of Ulster. In these tests, symmetric and asymmetric
cellular beams were tested under one and two point loads and two fire curves.
In brief, following is the list of fire tests which were carried out on cellular
composite beams by the time this research was carried out.

CELLULAR BEAMS AT AMBIENT AND ELEVATED TEMPERATURES
156
1. CTICM cellular composite beam P1 (Metz) (2003)
2. CTICM cellular composite beam P2 (Metz)
3. University of Manchester (2003)
4. Ulster Beam A2 (2006)
5. Ulster Beam B2
6. Ulster Beam A3
7. Ulster Beam B3
Among these fire tests, only the tests at University of Ulster were conducted on
unprotected steel sections. The results of these four fire tests were used to calibrate
the numerical models developed in this research for cellular composite beams at
elevated temperature. This chapter describes the details of these fire tests and
presents the details of the numerical modelling approach to model these four
beams. Finally, numerical results are presented and compared against the test
results to investigate the validity of the developed models for case studies at
elevated temperature.
6.2 ULSTER FIRE TESTS
Unlike the CTICM and Manchester fire tests, the purpose of the Ulster tests was
not to evaluate the performance of the intumescent coating. It was to provide data
on the web post failure temperature. Among the four fire tests on unprotected
symmetric and asymmetric composite beams, Beam A2 and Beam A3 were based
on the same geometry and loading as Beam A1. Similarly, Beam B2 and Beam B3
were based on Beam B1. Beam A2 and B2 were tested under a slow fire curve
shown in Figure 6.1 while Beam A3 and Beam B3 were tested under a standard
fire curve ISO-834 (Figure 6.1).
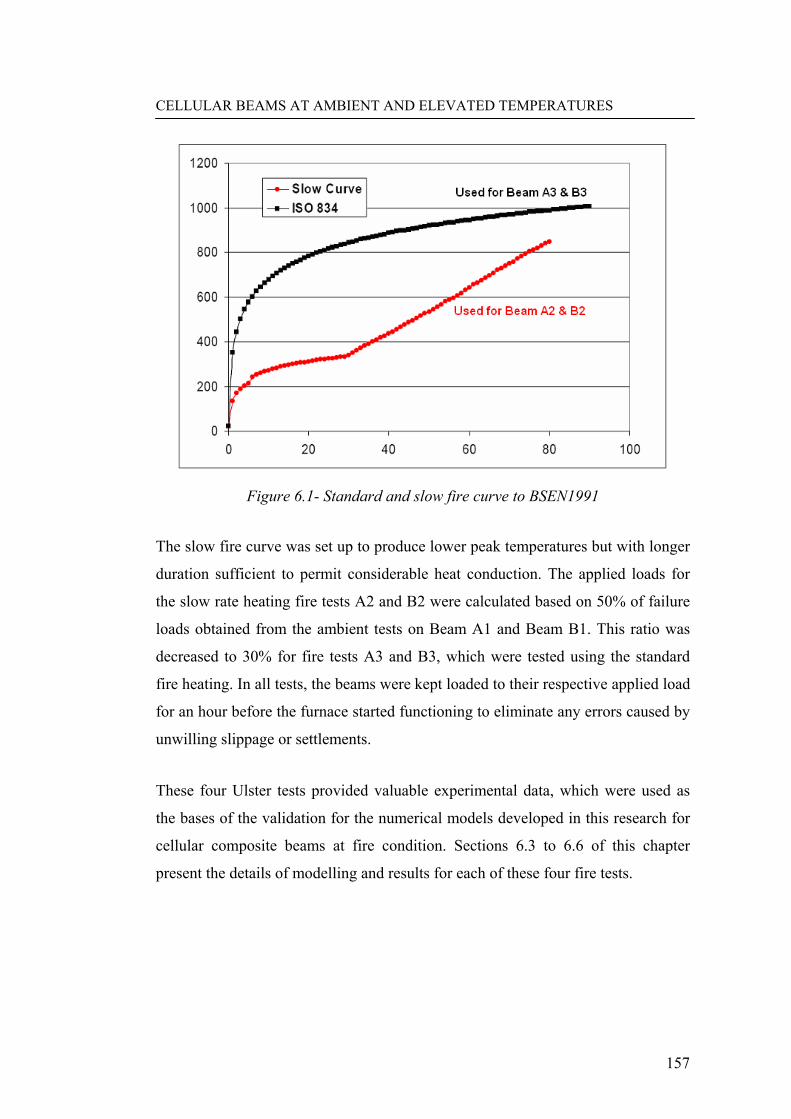
CELLULAR BEAMS AT AMBIENT AND ELEVATED TEMPERATURES
157
Figure 6.1- Standard and slow fire curve to BSEN1991
The slow fire curve was set up to produce lower peak temperatures but with longer
duration sufficient to permit considerable heat conduction. The applied loads for
the slow rate heating fire tests A2 and B2 were calculated based on 50% of failure
loads obtained from the ambient tests on Beam A1 and Beam B1. This ratio was
decreased to 30% for fire tests A3 and B3, which were tested using the standard
fire heating. In all tests, the beams were kept loaded to their respective applied load
for an hour before the furnace started functioning to eliminate any errors caused by
unwilling slippage or settlements.
These four Ulster tests provided valuable experimental data, which were used as
the bases of the validation for the numerical models developed in this research for
cellular composite beams at fire condition. Sections 6.3 to 6.6 of this chapter
present the details of modelling and results for each of these four fire tests.

CELLULAR BEAMS AT AMBIENT AND ELEVATED TEMPERATURES
158
6.3 NUMERICAL MODELLING AND RESULTS FOR ULSTER
BEAM A2
6.3.1 Modelling
The geometry of the Beam A2 was similar to that of Beam A1 (see Figure 6.2).
The fire tests were carried out in two steps. The mechanical load was applied in the
first step and the fire load in the second step and this procedure was also applied in
the numerical modelling approach.
The following sections describe the details of the modelling approach for each
section at elevated temperature.
150 mm thick slab
4500mm
Detailing of Symmetric Composite Celluar Beam (A1, A2 and A3)
375 mm dia. cells at 500 mm centres
UB 406X140X39 Top & Btm Tee
Figure 6.2- Geometry of Beam A2 (Also Beam A1 and Beam A3)
6.3.1.1 Modelling the steel beam and reinforcing mesh
The stress-strain relationship for structural steel and mesh reinforcement at
elevated temperature were based on the BSEN1994-1-2 (BSI, 2005c)
recommendations and Figure 6.3 shows the generic curves for steel grade S355
with the yield strength of 442 N/mm2.

CELLULAR BEAMS AT AMBIENT AND ELEVATED TEMPERATURES
159
0
50
100
150
200
250
300
350
400
450
500
0.00 0.02 0.04 0.06 0.08 0.10 0.12 0.14 0.16 0.18 0.20Total strain [%]
Stre
ss [N
/mm
2 ]
20 C 100 C 200 C 300 C 400 C 500 C 600 C700 C 800 C 900 C 1000 C 1100 C 1200 C
Figure 6.3- Stress- strain transform of steel at elevated temperature
6.3.1.2 Modelling the concrete slab
The compressive part of stress-strain curve for concrete at elevated temperature
was again based on Equation 6-1 and applying the reduction factors defined in
BSEN1994-1-2 (BSI, 2005c). Figure 6.4 shows the generic stress-strains
conversion curves of concrete in compression (based on measured value on 28
N/mm2) for different temperatures.
⎟⎟
⎠
⎞
⎜⎜
⎝
⎛
⎟⎟⎠
⎞⎜⎜⎝
⎛+
=3
,1,1
,
2
3
θθ
θ
εεε
εσ
cc
cf
Equation 6-1

CELLULAR BEAMS AT AMBIENT AND ELEVATED TEMPERATURES
160
0
5
10
15
20
25
30
0.00 0.01 0.02 0.03 0.04 0.05Total strain [%]
Stre
ss [N
/mm2 ]
20 C 100 C 200 C 300 C 400 C 500 C600 C 700 C 800 C 900 C 1000 C 1100 C
Figure 6.4- Stress- strain transform of concrete in compression at elevated temperature
A similar approach to ambient temperature was generally used to consider the post
cracking of concrete at elevated temperature in which the tension softening was
assumed as a linear decrease of stress to zero after cracking (Figure 6.5).
Figure 6.5- Stress-Strain relationship of concrete in tension at elevated temperature

CELLULAR BEAMS AT AMBIENT AND ELEVATED TEMPERATURES
161
The Drucker-Prager yield surface was used to define the failure surface for
concrete material at elevated temperature, similar to ambient temperature, with
Figure 6.6 showing the yield surface for various temperatures.
-1.2 -1.0 -0.8 -0.6 -0.4 -0.2
-1.2
-1.0
-0.8
-0.6
-0.4
-0.2
0.2
0.2
20-200 C
400 C
600 C
σf c
1
σf c
2
800 C
Tension failure
Drucker - Pragerfailure surface
Figure 6.6- Drucker-Prager failure surfaces for different temperatures
6.3.1.3 Applying temperatures
Thermocouples positioned in the top, middle and bottom of the concrete slab
recorded the relevant temperatures (see Figure 6.7) and these were applied to the
model directly by defining temperature points through the thickness of the shell
elements representing the concrete slab.

CELLULAR BEAMS AT AMBIENT AND ELEVATED TEMPERATURES
162
0
50
100
150
200
250
300
350
400
450
0 10 20 30 40 50 60 70 80 90
Time (mins)
Tem
pera
ture
in C
oncr
ete
( o C)
Mid-depth of the slab
Bottom face of slab
Top face of slab
Figure 6.7- Temperatures at bottom, middle and top of the concrete slab
In a fire test, the temperature distribution can be notably non-uniform across the
length and height of the steel beam. Changes of temperature through the height of
the steel beam are mainly a function of section thicknesses (section factors) and
fire exposure while the unavoidable non-uniform distribution of heat inside the
furnace, increases the temperature differences along the height of the section. This
implied having thermocouples all over the beam length and section with the most
focus in the critical regions where failure was expected.
Figure 6.8 shows the position of the thermocouples (1 mm sheathed Type K) on the
steel beam where a higher density of thermocouples was provided in the four
critical web posts expected to buckle. These recorded temperatures were averaged
and applied to the numerical model in limited areas.
Various approaches were used to calculate and introduce the temperatures to the
beam and the full length of the beam was modelled in some of these approaches
where the effect of temperature variations along the beam length was to be
considered in the model.

CELLULAR BEAMS AT AMBIENT AND ELEVATED TEMPERATURES
163
Figure 6.8- Position of the thermocouples on steel Beam A2 (Nadjai, 2007)
Zon
e 8
Zon
e 1
Zon
e 2
Zon
e 3
Zon
e 4
Zon
e 5
Zon
e 6
Zon
e 7
c d
e,f
g,h
ij
op
k r
s,t
lm
n
a,b 1
12
34
56
78
c
ab
gh
d
ef
stj m p
100
575 x
140 C
UB 3
9 k
g/m
Wes
tok
Fire
Tes
ting
The
rmoc
oupl
e Po
sition
sTes
t Bea
m 1
Sym
met
ic C
ompo
site
20
20
100
Zon
e 9
Zon
e 10
Zon
e 8
Zon
e 1
Zon
e 2
Zon
e 3
Zon
e 4
Zon
e 5
Zon
e 6
Zon
e 7
c d
e,f
g,h
ij
op
k r
s,t
lm
n
a,b 1
12
34
56
78
c
ab
gh
d
ef
stj m p
100
575 x
140 C
UB 3
9 k
g/m
Wes
tok
Fire
Tes
ting
The
rmoc
oupl
e Po
sition
sTes
t Bea
m 1
Sym
met
ic C
ompo
site
20
20
100
Zon
e 9
Zon
e 10

CELLULAR BEAMS AT AMBIENT AND ELEVATED TEMPERATURES
164
Some heat loss occurred through an observation window in the last minutes of this
test which affected the temperatures recorded by the thermocouples. Figure 6.9 is
an example of the temperatures recorded by thermocouples (zone 4 defined in
Figure 6.8) which clearly shows the thermocouples have been affected by this heat
loss. According to Figure 6.9, temperatures started to decrease at roughly 70
minutes of the test and then increased again. According to ABAQUS manual
(Hibbitt et al., 2004a), the smeared crack model which was used to model the
concrete, is only recommended for monotonic strains and is not very accurate in
unloading. To overcome this issue a second approach was also used in considering
the temperatures in the last minutes of the test. In this approach, temperatures were
linearly extrapolated for the last minutes as the gas temperature increased linearly
(10 Co/min, see Figure 6.1) and this was associated with a similar linear increase of
temperature in different sections of the beam before the heat loss (see Figure 6.9).
The numerical model was run for both cases with recorded and extrapolated
temperatures introduced into the model to give an upper and lower bound. The
numerical outputs are presented for these cases and compared against test results in
Figure 6.14.

CELLULAR BEAMS AT AMBIENT AND ELEVATED TEMPERATURES
165
0
100
200
300
400
500
600
700
0 10 20 30 40 50 60 70 80 90
Time (mins)
Tem
pera
ture
(C)
4a
4b
4c
4d
4e
4f
Extrapolation
Figure 6.9- Temperatures recorded by thermocouples 4a to 4f in zone 4 of Beam A2
Applying a slow fire curve (compared to fire curve ISO 834) for this beam allowed
for more heat transfer and balance of temperature along the length and through the
section of the composite beam. This implied lower thermal gradient and a more
uniform temperature distribution and justified one of the two approaches used to
apply the recorded temperatures to numerical models. In particular, in this
approach (also used for Beam A2) a weighted average (based on the area) was
taken of the recorded temperatures for each minute of the test, at the bottom flange,
bottom web, top flange and top web, and applied over the whole length of the
beam. This approach is schematically shown in Figure 6.10 in which areas with
similar colour had identical temperatures at a time. Only half of the beam was
modelled in this approach and there was no need to model the full length.

CELLULAR BEAMS AT AMBIENT AND ELEVATED TEMPERATURES
166
Figure 6.10-Temperatures averaged and applied equally all over the beam length
The averaging was based on excluding the end panels (panel 1 and 9 in Figure 6.8)
because temperatures were notably lower in these two panels, due to the non-
uniform distribution of temperature in the furnace.
Figures 6.11 and 6.12 show the temperature profile along the beam length at 45
and 55 minutes into the test which illustrate that the temperature at the critical web
post was not more than 35oC different from the calculated average temperature
(which was uniformly applied to the model).

CELLULAR BEAMS AT AMBIENT AND ELEVATED TEMPERATURES
167
300
350
400
450
500
0 1 2 3 4 5 6 7 8 9Opening Number
Tem
p. (C
)
Average of Bottom Web
Average of Top Web
Point Load
Point Load
Critcal Web
Critical Web
Figure 6.11- Temperature profile over the length of Beam A2 at 45 minutes
350
400
450
500
550
0 1 2 3 4 5 6 7 8 9Opening number
Tem
p. (C
)
Average of Bottom Web
Average of Top Web
Point Load
Point Load
Critical Web
Critical Web
Figure 6.12- Temperature profile over the length of Beam A2 at 55 minutes
Figure 6.13 shows the consequent average temperature-time curves applied to
Beam A2.

CELLULAR BEAMS AT AMBIENT AND ELEVATED TEMPERATURES
168
0
100
200
300
400
500
600
700
800
0 10 20 30 40 50 60 70 80 90Time (min)
Tem
p (c
)
Top Flange
Bot Flange
Web
Concrete
Extrapolation for last minutes
Figure 6.13-Time- temperature curves resulted from averaging in all over the beam length
6.3.2 Comparing modelling and test results for Beam A2
Figure 6.14 compares the test versus the numerical results for Beam A2 (Nadjai et
al., 2006) for the two cases when the recorded temperatures were applied to the
model in the first case, and in the other recorded temperatures were extrapolated in
the last minutes of the test. According to Figure 6.14, there was a very good
agreement between the test and numerical results in terms of the failure load and
overall behaviour of this composite beam in different stages of fire loading.

CELLULAR BEAMS AT AMBIENT AND ELEVATED TEMPERATURES
169
0
50
100
150
200
250
0 10 20 30 40 50 60 70 80 90
Time (Min)
Def
. (m
m)
Experiment
Recorded Temps
Extrapolated Temps
Figure 6.14- Test results against the numerical results of Beam A2 considering the recorded and extrapolated temperatures
According to Figure 6.15, which shows the initiation of the web buckling at 50
minutes into the test, web post buckling initiated from the web posts located in the
high shear zone. The mid panel, under high bending moments, had no signs of any
instabilities.

CELLULAR BEAMS AT AMBIENT AND ELEVATED TEMPERATURES
170
Figure 6.15- Initiation of buckling at 50 minutes
Figure 6.16 shows the final deformed shape of the beam where the double
curvature S-shaped buckling of the web posts was evident. Interestingly, this figure
shows that the web post in the middle of the beam has finally buckled as well but
in a different mode. It has buckled with a single curvature as the beam is subjected
to two point loads and therefore there is no shear force in the mid web posts to
cause an S-shaped buckling mode. However, the buckling mode of the end web
posts is S-shaped as it is dominated by the shear.
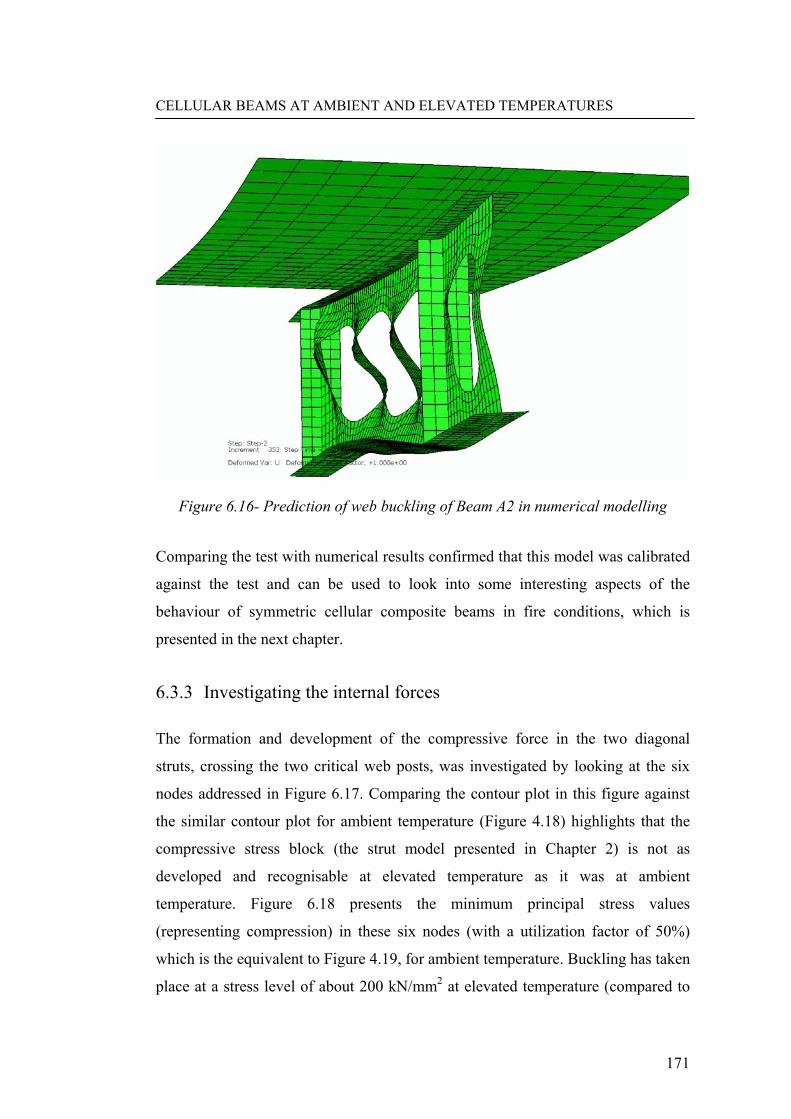
CELLULAR BEAMS AT AMBIENT AND ELEVATED TEMPERATURES
171
Figure 6.16- Prediction of web buckling of Beam A2 in numerical modelling
Comparing the test with numerical results confirmed that this model was calibrated
against the test and can be used to look into some interesting aspects of the
behaviour of symmetric cellular composite beams in fire conditions, which is
presented in the next chapter.
6.3.3 Investigating the internal forces
The formation and development of the compressive force in the two diagonal
struts, crossing the two critical web posts, was investigated by looking at the six
nodes addressed in Figure 6.17. Comparing the contour plot in this figure against
the similar contour plot for ambient temperature (Figure 4.18) highlights that the
compressive stress block (the strut model presented in Chapter 2) is not as
developed and recognisable at elevated temperature as it was at ambient
temperature. Figure 6.18 presents the minimum principal stress values
(representing compression) in these six nodes (with a utilization factor of 50%)
which is the equivalent to Figure 4.19, for ambient temperature. Buckling has taken
place at a stress level of about 200 kN/mm2 at elevated temperature (compared to

CELLULAR BEAMS AT AMBIENT AND ELEVATED TEMPERATURES
172
300 kN/mm2 at ambient condition) which is mainly due to deterioration of the
material properties, in particular modulus of elasticity which define the resistance
against buckling, at high temperatures.
Similar to ambient conditions, the two nodes at the middle of the struts (nodes B
and E) had less compressive stresses than the other four nodes, before forming a
new stress distribution pattern due to web buckling.
In Chapter 4, it was observed that nodes G, H, I and J, experienced similar
compressive stresses prior to buckling at ambient temperature (see Figure 4.19).
However, investigating the compressive stresses at these nodes at elevated
temperature (Figure 6.18) showed that these stresses were not similar before and
during the buckling stages (unlike ambient conditions). These compressive stresses
were even notably different between nodes H and J (about 9%) or I and G (about
18%) which had rather similar conditions in terms of shear force (due to
mechanical loading), or applied temperatures (up to 20oC difference).
These differences between the behaviour at ambient and elevated temperatures,
which may possibly be due to redistribution of stresses based on temperature
distribution, adds to the complexity and uncertainty of developing a simple design
method for the cellular beams at elevated temperature. This also justifies
employing a more conservative approach in developing simple design models to
check the web post buckling (or possibly other failure modes) of cellular beams at
elevated temperature.

CELLULAR BEAMS AT AMBIENT AND ELEVATED TEMPERATURES
173
Figure 6.17- The struts in compression to investigate the internal stresses
-250
-200
-150
-100
-50
00 10 20 30 40 50 60 70 80
Time (min)
Stre
ss (N
/mm
^2)
Node I
Node E
Node G
Node J
Node B
Node H
Figure 6.18- Minimum principal stresses (representing compression) in the six nodes

CELLULAR BEAMS AT AMBIENT AND ELEVATED TEMPERATURES
174
6.4 NUMERICAL MODELLING AND RESULTS FOR ULSTER
BEAM B2
6.4.1 Introduction
The second fire test was conducted on asymmetric Beam B2 with the geometric
details presented in Figure 6.19.
This beam was also tested under the slow rate heating and with a utilization factor
of 50%, with an applied point load of 210 kN at the mid-span of the beam before
the fire loading.
Thermocouples were again positioned along the beam length, height and through
the depth of the concrete slab to record the temperatures. Figure 6.20 shows the
details of the position of these thermocouples, which were mostly focused in the
critical web posts, expected to buckle.
450 mm dia. cell at 630 mm centres
4500mm
150 mm thick slab
406x140UB39 Top & 457x152UB52 Btm Tee
Detailing of Asymmetric Composite Celluar Beam (B1, B2 and B3)
Figure 6.19- Geometric details of asymmetric Beam B2

CELLULAR BEAMS AT AMBIENT AND ELEVATED TEMPERATURES
175
Zon
e 8
Zon
e 1
Zon
e 2
Zon
e 3
Zon
e 4
Zon
e 5
Zon
e 6
Zon
e 7
Figure 6.20- Position of thermocouples for Beam B2 (Nadjai, 2007)

CELLULAR BEAMS AT AMBIENT AND ELEVATED TEMPERATURES
176
6.4.2 Modelling and results
Beam B2 was modelled based on the similar approach to Beam A2. Again
observations from the test showed that the beam and concrete slab acted fully
compositely with no sign of slippage. Therefore, the model was based on full shear
connection.
This asymmetric beam failed due to web post buckling in the test and Figure 6.21
shows the final deformed shape of this beam. The model developed in ABAQUS
also failed due to web buckling as shown in Figure 6.22. More importantly, the
numerical results showed very good conformity with the test data in all stages of
the fire test as well as the failure time (temperature) (Nadjai et al., 2007). Figure
6.23 shows this conformity by comparing the load-deflection curves from the
model against the test.
Figure 6.21- Web post buckling in the Beam B2 (Source: The test report of the Ulster fire tests on cellular composite beams (Nadjai et al., 2007))

CELLULAR BEAMS AT AMBIENT AND ELEVATED TEMPERATURES
177
Figure 6.22- Web buckling of Beam B2 predicted by the developed numerical model
0
50
100
150
200
250
300
350
60 70 80 90 100 110 120 130 140 150 160Time(mins)
Def
lect
ion
(mm
)
Experiment
Numerical Model
Figure 6.23- Comparison of load-deflection curves for the test against numerical model

CELLULAR BEAMS AT AMBIENT AND ELEVATED TEMPERATURES
178
Therefore, the numerical model developed for the fire test on Beam B2 could also
meet the necessary validation requirements to be used for parametric studies which
are presented in detail in the next chapter.
6.5 MODELLING AND RESULTS OF FIRE TEST FOR ULSTER
BEAM A3
6.5.1 Introduction
The two fire tests presented so far were based on a slow rate heating curve. For the
fire tests on Beam A3 and Beam B3 the standard heating rate ISO-834 (BSI,
2002b) to investigate how the rate in temperature increase, influences the
performance of cellular beams.
The symmetric Beam A3 was geometrically similar to Beam A2 (refer to Figure
6.2), but experienced the ISO-834 (BSI, 2002b) fire curve with the load factor of
30% and finally failed due to web post buckling in the test.
Heating according to ISO-834 increased temperatures in a considerably faster rate
so that Beam A3 and Beam B3 failed much sooner than Beam A2 and Beam B2 in
the fire test, even though the loading ratio was reduced from 50% to 30%. Figure
6.24 compares the average temperatures of the critical web post located at zone 3
in Beam A2 and A3 to give an idea of how different the rate of temperature
increase was in the two fire scenarios and how influential this has been in the fire
resistance period of this beam.

CELLULAR BEAMS AT AMBIENT AND ELEVATED TEMPERATURES
179
0
100
200
300
400
500
600
700
800
0 10 20 30 40 50 60 70 80 90Time (Min)
Avr
age
Web
Tem
p (C
)
Beam A3
Beam A2
Web Buckling
Web Buckling
Figure 6.24- Average of the temperatures recorded in the critical web post in Tests A2 and A3
The higher heating rate meant that the role of thermal conduction was not as
dominant in balancing the temperatures. Therefore, the thermal gradients were
expected to be higher along the height of the section. Moreover, local effects due to
non-uniform temperature distribution in the furnace, and of course along the beam
length, were expected to be more influential.
6.5.2 Numerical modelling of Beam A3
The generics of the numerical approach used to model Beam A3 was similar to the
two beams already explained. However, comparing the temperatures certified that
in Beam A3, which experienced the fast growing fire, the variation of measured
temperatures in different sections of the beam were notably more than Beam A2.
This suggested employing a more detailed approach in applying the temperatures.
Therefore, the main difference in modelling this beam was to minimise the error
caused by averaging the temperatures for which notably smaller areas were
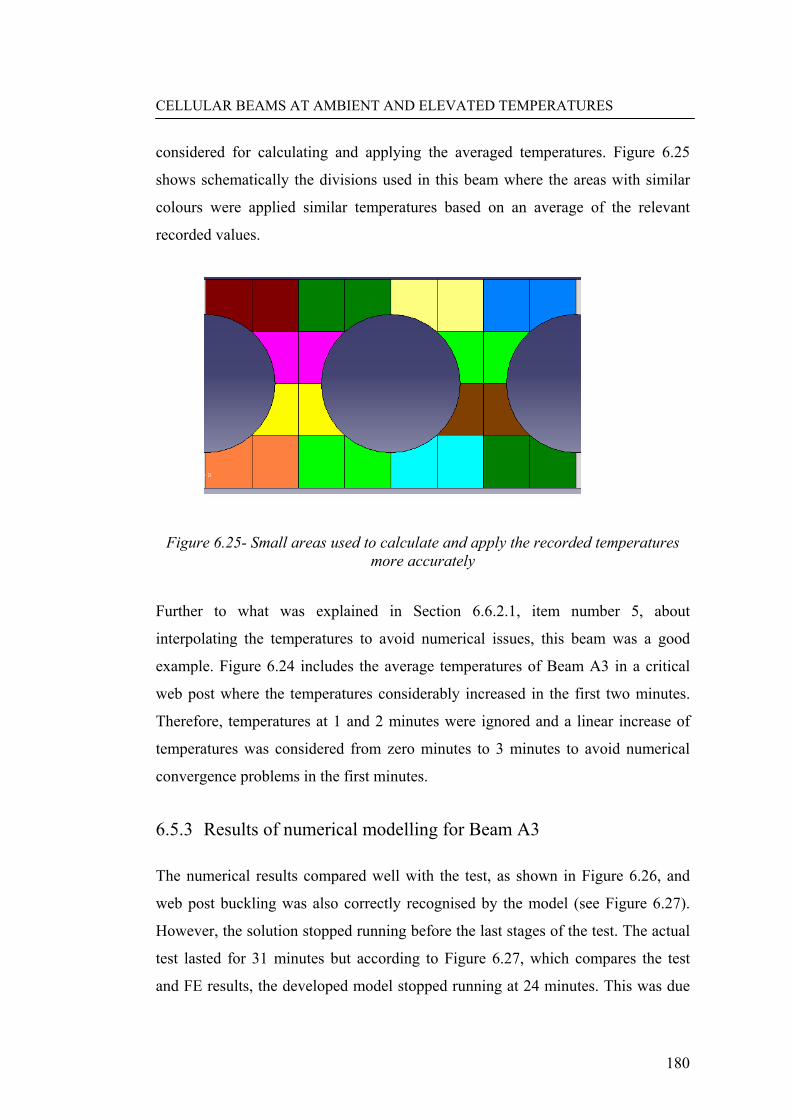
CELLULAR BEAMS AT AMBIENT AND ELEVATED TEMPERATURES
180
considered for calculating and applying the averaged temperatures. Figure 6.25
shows schematically the divisions used in this beam where the areas with similar
colours were applied similar temperatures based on an average of the relevant
recorded values.
Figure 6.25- Small areas used to calculate and apply the recorded temperatures more accurately
Further to what was explained in Section 6.6.2.1, item number 5, about
interpolating the temperatures to avoid numerical issues, this beam was a good
example. Figure 6.24 includes the average temperatures of Beam A3 in a critical
web post where the temperatures considerably increased in the first two minutes.
Therefore, temperatures at 1 and 2 minutes were ignored and a linear increase of
temperatures was considered from zero minutes to 3 minutes to avoid numerical
convergence problems in the first minutes.
6.5.3 Results of numerical modelling for Beam A3
The numerical results compared well with the test, as shown in Figure 6.26, and
web post buckling was also correctly recognised by the model (see Figure 6.27).
However, the solution stopped running before the last stages of the test. The actual
test lasted for 31 minutes but according to Figure 6.27, which compares the test
and FE results, the developed model stopped running at 24 minutes. This was due

CELLULAR BEAMS AT AMBIENT AND ELEVATED TEMPERATURES
181
to an abrupt local instability in one of the critical bottom Tees. The sequence of
sudden formation of this local buckling is shown in Figures 6.27 and 6.28, where
the web post clearly started to buckle at load increment number 262 (24 minutes).
However, a local buckling in one of the critical Tees, at load increment 263 (the
same 24 minutes) caused abrupt deformations which the ABAQUS solver was not
able to handle. This local buckling again took place at the high compression
diagonal but in the web post which was supported by the web stiffener.
0
40
80
120
160
200
240
0 4 8 12 16 20 24 28 32Time (Min)
Def
lect
ion
(mm
)
Experiment
Numerical Model
Solution terminated due to local instability
Figure 6.26- Numerical versus experimental results for Beam A3

CELLULAR BEAMS AT AMBIENT AND ELEVATED TEMPERATURES
182
Figure 6.27- Deformation at Time=24.16, Load increment number 262, web buckling is developing
Figure 6.28- Deformation at Time=24.16, Load increment number 263, Sudden local buckling in the bottom Tee
In order to overcome this issue, various options were explored. Among which,
slight changes in the amplitude and direction of the web imperfection, and refining

CELLULAR BEAMS AT AMBIENT AND ELEVATED TEMPERATURES
183
the areas used to apply the temperatures (around the buckled region) allowed the
model to pass this critical stage and run to the last minutes of the test.
This shows occurrence of various buckling modes could be competitive and close
together, especially at elevated temperature, and it is not always the web post
which is first to experience instabilities. However, it will be presented later in
Chapter 7 that such local instabilities in top and bottom Tees did not govern the
overall failure of these beams in most of the cases, as stresses redistribute. The
overall failure mode remained the web post buckling, in most of these cases.
However, web buckling was, of course, promoted by such preliminary instabilities.
Figure 6.29 shows the final numerical results against the test results, which
correlated relatively well. Moreover, the web post buckling again dominated the
failure mode of this beam (see Figure 6.30), which was also witnessed in the test.
0
40
80
120
160
200
240
0 4 8 12 16 20 24 28 32Time (Min)
Def
lect
ion
(mm
)
Experiment
FE Model
Figure 6.29- Load-deflection curves by experiment and numerical model

CELLULAR BEAMS AT AMBIENT AND ELEVATED TEMPERATURES
184
Figure 6.30- Final deformed shape of Beam A3 in ABAQUS
6.6 NUMERICAL MODELLING AND RESULTS FOR ULSTER
BEAM B3
6.6.1 Introduction
The last of the six Ulster beams was the asymmetric Beam B3 with a similar
geometry to Beam B2 (refer to Figure 6.19). This Beam was also tested under the
fast heating fire curve (ISO-834) and a load ratio of 30%.
6.6.2 Numerical modelling and results for Ulster Beam B3
This beam was modelled with an approach similar to Beam A3. Figure 6.31 shows
the failed shape of Beam B3 in the developed model which again matched well
with the web buckling observed in the test.

CELLULAR BEAMS AT AMBIENT AND ELEVATED TEMPERATURES
185
However, the load-deflection curve gained from the model did not match very well
with the test results. Figure 6.32 compares the two curves in which the developed
model has started to increase in deflection at about 12 minutes, whereas this
increase started notably later in the test (17 minutes).
Figure 6.31- Final deformed shape of Beam B3

CELLULAR BEAMS AT AMBIENT AND ELEVATED TEMPERATURES
186
0
50
100
150
200
250
0 4 8 12 16 20 24 28 32
Time (Min)
Def
lect
ion
(mm
) Experiment
Model
Figure 6.32- Load-deflection curves of Beam B3 resulted from experiment and model
As temperatures were already applied in detail, a wide range of studies were
conducted on some other factors aiming to improve the results and resolve the
validation issue for this beam by looking into some reasonable modifications.
Among these approaches it was tried to reduce the amplitude and change the shape
of the imperfection initially imposed to the beam geometry (approach one in Figure
6.33). In other approach (approach 2), the interaction between the top Tee and
concrete slab was changed in the model from two surfaces being in contact to two
lines. Another approach was to limit the lateral displacement and rotation of the
slab, where the point loads were applied, to see if any of these changes in the
model delayed the occurrence of web post buckling. Unfortunately, none of the
approaches, and their combinations, were notably helpful in reducing the gap
between the numerical and test curves (Figure 6.33).

CELLULAR BEAMS AT AMBIENT AND ELEVATED TEMPERATURES
187
0
50
100
150
200
250
0 4 8 12 16 20 24 28 32Time (Min)
Def
lect
ion
(mm
)
Test
Numerical Approach 1
Numerical Approach 2
Numerical Approach 3
Figure 6.33- Time-deflection curves resulted from some of the approaches to calibrate the numerical model for Beam B3
The following explains some of the main reasons behind this inaccuracy of the
numerical prediction, and pinpoint some of the differences that could negatively
affect the numerical results:
1. As mentioned the temperatures recorded by thermocouples at steel and
concrete sections were averaged and introduced to the numerical model
directly. On the other hand, the higher rate of fire growth is associated
with higher thermal gradients throughout the section, as transfer of the
heat due to conduction within the section becomes less dominant in
balancing the temperatures. Therefore, higher rate of temperature rise
increases the inaccuracies in the numerical model. This effect was more
influential in the concrete slab where the temperatures were recorded in
only one location of the slab (at three different depths) and there was no
record of the temperature variations over the length and width of the slab.
2. Eight thermocouples recorded the furnace temperature at different
locations to assess the performance of the furnace (in fire test on Beam

CELLULAR BEAMS AT AMBIENT AND ELEVATED TEMPERATURES
188
B3) in terms of the uniformity of temperature distribution (Figure 6.34).
The maximum values were up to about 100o C higher than the minimum
recorded temperatures. Although it has been tried to minimise the error by
refining the areas used to apply the temperatures, it still reduces the
accuracy.
3. The section sizes and thicknesses were based on the nominal ones (as no
measured values were available) which could have been different from
the actual thicknesses.
0
200
400
600
800
1000
0 5 10 15 20 25 30 35Time (Minute)
Furn
ace
Tem
pera
ture
(C)
Furnace Temp. 1
Furnace Temp. 2
Furnace Temp. 3
Furnace Temp. 4
Furnace Temp. 5
Furnace Temp. 6
Furnace Temp. 7
Furnace Temp. 8
Figure 6.34- Furnace temperatures recorded by eight thermocouples for fire test on Beam B3
6.6.2.1 Some empirical approaches used to tackle the convergence problems
It should be note that in some models developed for the furnace tests and for the
case studies (presented in Chapter 7), the numerical results were finally achieved
after various tries to overcome the solution convergence problems. Various reasons
caused these models to stop running due to numerical convergence problems

CELLULAR BEAMS AT AMBIENT AND ELEVATED TEMPERATURES
189
before the actual structural failure takes place. Some of these reasons are addressed
here:
• Accurate modelling of concrete, to include the cracking and crushing
behaviour, and the limited ability of the software to handle the occurrence
of cracking and crushing in one increment
• The interaction between the top flange and concrete slab as well as the local
stress concentrations caused by temperature gradients in different sections
of the composite beam
• Occurrence of high strains and deformations in the steel beam and concrete
slab due to fire and instabilities by web post or other sorts of buckling
The following empirical approaches were found useful to tackle the convergence
problems of the solution in the modelling of these beams:
1. Increasing the number of elements and integration points in the places
causing numerical failure (mostly in the concrete slab), was helpful in
overcoming the numerical issues. This is also recommended by the
software manual (Hibbitt et al., 2004b)
2. Sometimes manipulation of the maximum, minimum and starting time
increment in the automatic time stepping proved useful in letting the
model run further. It is commonly known that defining relatively high
maximum limits could cause problems because if the solution does not
converge, then the next increment will be half of the previous one.
Therefore, high maximum limits might not allow the load increment to
become small enough to satisfy the convergence criteria. This mostly
happened at increments associated with simultaneous cracking or
crushing of concrete material at many integration points, or at large
deformations during web buckling. Lowering the amplitude of the
minimum increment limit was also found helpful in cases where very
small increments were needed to let the solution run further.

CELLULAR BEAMS AT AMBIENT AND ELEVATED TEMPERATURES
190
3. Changing the starting load increment also affected how far the model runs
in some cases. This was to do with the iterative algorithm in the Newton-
Raphson to solve the simultaneous equilibrium equations, explained in
Chapter 3.
4. To ensure point loads were applied in an area as opposed to a node. This
was also helpful to avoid convergence problems knowing that these high
loads were applied to the concrete material, which is vulnerable to
crushing.
5. In some cases, there were notable fluctuations in temperature recorded by
thermocouples in a limited time, especially in the first couple of minutes
of the test. It was found useful to exclude these temperature impulses by
interpolating the temperatures in these specific cases, before inputting
them into the model.
6. Moreover, increasing the convergence criteria and the points already
mentioned in this regard, such as slight changes to the fracture energy of
the concrete also helped overcoming convergence problems.
6.7 SUMMARY OF THE MODELLING AT ELEVATED
TEMPERATURE
This chapter presented the details of the numerical modelling of the furnace tests
on four cellular composite beams carried out at University of Ulster. Two of the
fire tests were based on the ISO-834 fire and the other two were based on slow fire
rate of 10oC/min. The numerical results generally had a good agreement with the
test results in terms of failure mode, time (temperature) and overall performance.
The agreement of the numerical with test results was better in the two tests
subjected to slow fire. The calibration of the models against the fire tests allowed
these models to be used in some parametric studies, which are presented in Chapter
7.

CELLULAR BEAMS AT AMBIENT AND ELEVATED TEMPERATURES
191
7 PARAMETRIC STUDIES ON CELLULAR COMPOSITE
BEAMS AT ELEVATED TEMPERATURE
7.1 INTRODUCTION
There is still no simple design method available in the Eurocodes for cellular
beams. This highlights the necessity of carrying out numerical and experimental
investigations into the performance of these beams and implementing a robust
simple, but reliable, design method.
Therefore, in this research, a series of parametric studies were conducted on the
validated model to look at the sensitivity of the certain parameters and also to get a
better understanding of how these beams behave in fire. These parametric studies
investigated the influence of web imperfections, web stiffener, temperature
distributions, load ratios, loading types and finally support conditions, on the
performance of CBs at elevated temperature. This chapter focuses on these
investigations.
7.2 WEB IMPERFECTIONS
The sensitivity of the behaviour of cellular composite beams to web imperfections,
during fire conditions, was investigated by carrying out a series of analyses
introducing web imperfection amplitudes ranging from .001 mm to an
unreasonably high value of 10 mm. Figure 7.1 presents the results for the
symmetric Beam A2 and Figure 7.2 reflects the results for asymmetric Beam B2.
Comparing these results against the results of similar studies on these beams at
ambient temperature (refer to Chapter 5), highlights that web imperfections are
notably more influential at ambient temperature and their effect can reasonably be
ignored at elevated temperature. The reason why web imperfections are not as
dominant at elevated temperature as they are at ambient temperature can be

CELLULAR BEAMS AT AMBIENT AND ELEVATED TEMPERATURES
192
justified based on the fact that at elevated temperature, deformations (local and
global imperfections) due to different heat scenarios in different sections of the
beam are notably higher than the effect of the limited web imperfections.
0
20
40
60
80
100
120
140
160
180
200
0 10 20 30 40 50 60 70 80 90Time (Min)
Def
. (m
m)
ExperimentImp=0.001 mmImp= 0.1 mmImp=5 mmImp=10 mm
Figure 7.1- Investigating the influence of web imperfection for Beam A2 at fire conditions

CELLULAR BEAMS AT AMBIENT AND ELEVATED TEMPERATURES
193
0
50
100
150
200
250
300
350
60 80 100 120 140 160
Time (Min)
Def
lect
ion
(mm
)
ExperimentImp=2 mmImp=0.1 mmImp=-2 mmImp= 10 mm
Figure 7.2- Investigating the influence of web imperfection for Beam B2 at fire conditions
However, this contradicted the current method for designing cellular beams at
elevated temperature which is described in SCI report RT1187 (Simms, 2008).
This method bases the web post buckling strength on an equivalent strut, as
mentioned in Chapter 2, and the following equations are introduced to calculate the
buckling strength of the web post at ambient and elevated temperatures
accordingly:
yb ff χ= Equation 7-1
yθy,fi, fkfb ⋅⋅= χθ Equation 7-2
where: χ is the buckling coefficient
fiχ is the buckling coefficient at temperature θ
ky,θ is the strength reduction factor for steel at temperature θ

CELLULAR BEAMS AT AMBIENT AND ELEVATED TEMPERATURES
194
fb is the buckling strength of the web post
fb,θ is the buckling strength of the web post at temperature θ
Imperfection parameters for the strut are adopted depending on the web
slenderness.
The χ and χfi are calculated similarly as a function of non-dimensional slenderness
λfi (Equation 7-3) and the depth over thickness ratio (d/t).
cr,θ
pl,θfi N
N=λ Equation 7-3
To include the effect of an imperfection factor, this method introduces the buckling
curves “d” and “c” in BSEN1993-1-1 (BSI, 2005a), Section 6.3.1.2, for d/t ratios
higher and lower than 85 accordingly.
It seems reasonable to use two different buckling curves to include the effect of
web imperfections at ambient temperature as the parametric studies on symmetric
and asymmetric cellular beams, which failed due to web buckling, showed that the
web post capacity is dependent on imperfections at ambient temperature. However,
this was not the case at elevated temperature. The overall behaviour and failure
time (critical temperature) of the critical web post remained unaffected by web
imperfections. This suggests that it is not a very reasonable to introduce the two
buckling curves “c” and “d”, which give up to 9% difference in the reduction factor
(χ), to calculate the buckling capacity of the web post (strut) at elevated
temperature since, the failure due to web buckling was not affected by web
imperfections
7.3 TEMPERATURE DISTRIBUTION
In order to investigate the significance of the temperature distribution on the
behaviour of cellular beams two different temperature distributions, based on the

CELLULAR BEAMS AT AMBIENT AND ELEVATED TEMPERATURES
195
same fire curve, were applied to the validated models and the results were
compared (Bake and Bailey, 2007b). The total applied heating energy was constant
for both approaches (as explained later in Section 7.3.1), to have a reasonable
comparison, and the only difference was the way the temperatures were distributed
along the beam length.
7.3.1 Effect on symmetric beam
In the first approach, which is shown in Figure 7.3, the temperatures recorded by
the thermocouples were averaged and applied along the beam length. The
averaging was conducted within the areas with the same colour (Figure 7.3). As the
areas with the same colour also had the same areas quantity-wise, the averaging
was in fact the weighted average, which kept the total applied heat constant.
It should be noted that the end sections of the beam were defined with different
colours in Figure 7.3 as they were not taken into account in the averaging. This was
because firstly, the end sections were considerably colder and secondly, only one
thermocouple was positioned to record the temperatures in the two beam ends as
they were less critical.
In the second approach, the temperatures were averaged and applied to limited
regions as reflected schematically in Figure 7.4. Therefore, the full length of the
beam was modelled in this approach to consider the variations of the temperatures
along the length.
The difference of the response of Beam A2 to these approaches depended on the
temperature profile along the beam length. Figures 6.11 and 6.12 presented the
temperature variations of the top and bottom web posts, along the beam length, at
45 and 55 minutes of the test. Investigating the temperature profiles showed that
temperatures were generally slightly higher in the critical web post (up to about
30oC) than the average value. This meant that the second approach applied slightly
higher temperatures to the critical web post than the first approach.

CELLULAR BEAMS AT AMBIENT AND ELEVATED TEMPERATURES
196
It should also be noted that the critical web posts for Beam A2 and Beam B2
(shown in Figure 7.5) were specified with regard to the dominancy of shear in web
post buckling and also the influence of moment-shear interaction. Between the two
critical web posts defined for each beam in Figure 7.5, only the one that
experienced higher temperatures was considered as the dominant critical web post
to compare its temperatures against the average value. This approach was justified
based on the fact that in the fire tests, one side of beam failed while the other side
had not failed yet. This is clearly shown in Figure 6.21 where half of Beam B2
completely failed due to web buckling in the test but the other half did not show
any sign of failure.
Figure 7.3- Averaging the Temperatures along the beam length
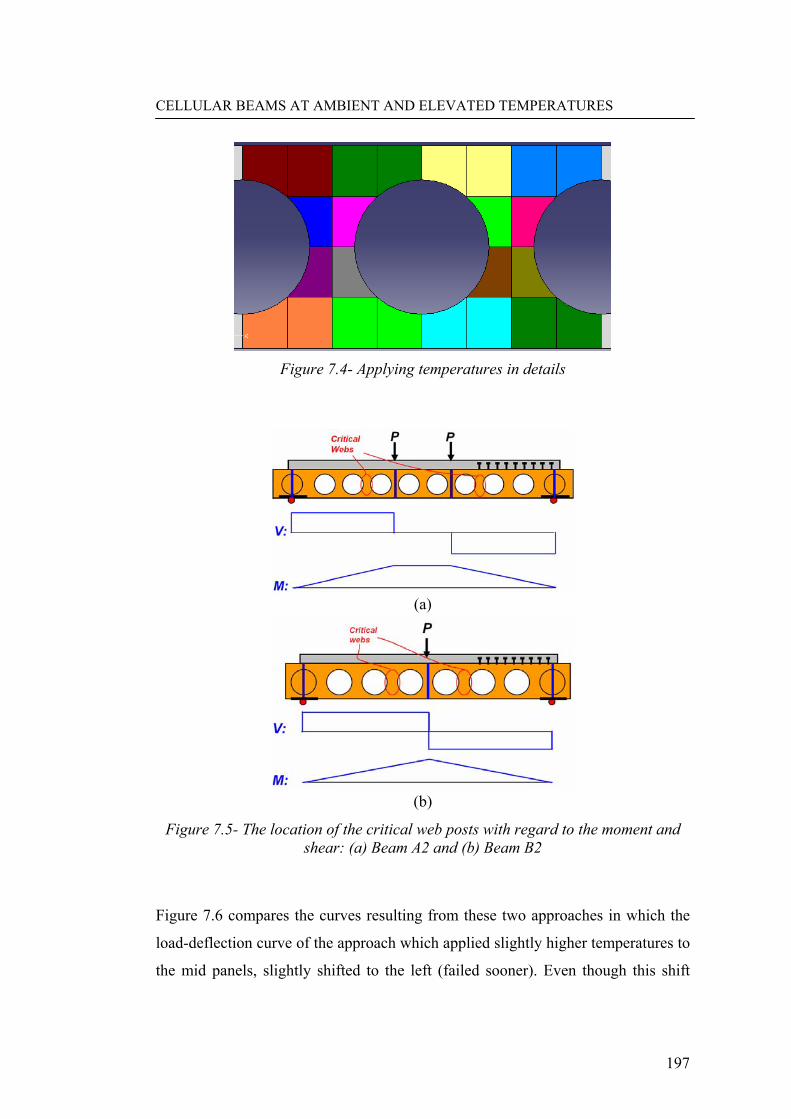
CELLULAR BEAMS AT AMBIENT AND ELEVATED TEMPERATURES
197
Figure 7.4- Applying temperatures in details
(a)
(b)
Figure 7.5- The location of the critical web posts with regard to the moment and shear: (a) Beam A2 and (b) Beam B2
Figure 7.6 compares the curves resulting from these two approaches in which the
load-deflection curve of the approach which applied slightly higher temperatures to
the mid panels, slightly shifted to the left (failed sooner). Even though this shift

CELLULAR BEAMS AT AMBIENT AND ELEVATED TEMPERATURES
198
was nominal in this case, it still could be a trend suggesting high temperatures are
more decisive in the critical panels (particularly web posts).
Comparing the two approaches of applying the temperatures was also useful in
justifying the reasonability of the first approach of applying the average
temperatures for this beam.
0
50
100
150
200
250
0 10 20 30 40 50 60 70 80 90Time (Min)
Def
. (m
m)
Experiment
Temperatures Averaged
Temps Applied in Detail
Figure 7.6- Comparing the time deflection curves resulted from employing the two
approaches to Beam A2
7.3.2 Effect on asymmetric beam
The two approaches of introducing the temperatures were also applied to the
asymmetric Beam B2. Figures 7.7 and 7.8 present the temperature profile along the
beam length at 50 and 65 minutes respectively. According to these graphs,
considering the accurate temperatures applied slightly higher temperatures (up to
about 35oC difference) to the critical web posts, as opposed to applying the average
temperature. Figure 7.9 compares the time-deflection curves resulting from the two
approaches for this asymmetric beam where again (similar to the symmetric beam),

CELLULAR BEAMS AT AMBIENT AND ELEVATED TEMPERATURES
199
higher temperatures in the critical web posts shifted the time-deflection curve to
the left (beam failed sooner), this time more clearly.
250
300
350
400
450
500
0 1 2 3 4 5 6 7Opening Number
Tem
p. (C
)
Average of Bottom Web
Average of Top Web
Critical Web
Critical Web
Point Load
Figure 7.7- Temperature profile along the length of Beam B2 at 50 minutes
450
500
550
600
650
0 1 2 3 4 5 6 7Opening Number
Tem
p. (C
)
Average of Bottom Web
Average of Top Web
Critical Web
Point Load
Critical Web
Figure 7.8- Temperature profile along the length of Beam B2 at 65 minutes

CELLULAR BEAMS AT AMBIENT AND ELEVATED TEMPERATURES
200
0
50
100
150
200
250
300
350
0 10 20 30 40 50 60 70 80 90 100
Time (Min)
Def
lect
ion
(mm
)
ExperimentAveraged temps
Accurate temps
Figure 7.9- Comparing the time deflection curves resulted from employing the two
approaches to Beam B2
This certifies that the performance of cellular composite beams is sensitive to the
temperatures at critical web posts and applying even slightly higher temperatures to
critical web posts visibly promoted the failure by web buckling.
7.4 LOADING TYPE AND WEB STIFFENER
Parametric studies were conducted on both symmetric and asymmetric geometries
of Beams A1 and B1 to look into their performance in fire conditions under a
UDL. The load ratio was again set to 50%, similar to the point load case, to allow a
valid comparison between the two cases.
7.4.1 Effect on symmetric beam
The results at elevated temperature are presented in two sections, with and without
web stiffeners, where the beam experienced two different failure modes depending
on the existence of the web stiffeners.

CELLULAR BEAMS AT AMBIENT AND ELEVATED TEMPERATURES
201
7.4.1.1 Without web stiffeners
This beam without web stiffeners failed at 126 kN/m at ambient temperature and
the mechanical load for the fire analysis was based on this load and the load ratio
of 50%. Figure 7.10 shows the contour palette presenting out-of-web plane
displacements at 48 minutes which shows high out-of-web plane displacements
were not just limited to web posts. This was also the case in the bottom Tee, with
higher values toward the mid-span of the beam.
Figure 7.11 is the similar output for 63 minutes which shows how the development
of web post buckling turned to distorsional buckling (Santiago et al., 2008) of the
beam. Finally, Figure 7.12 presents the final deformed shape of the beam where the
beam has failed due to distorsional buckling.
Figure 7.10- Out-of-web plane displacements for Beam A2 without stiffeners at 48
minutes

CELLULAR BEAMS AT AMBIENT AND ELEVATED TEMPERATURES
202
Figure 7.11- Out-of-web plane displacements for Beam A2 without stiffeners at 63
minutes
Figure 7.12- Final deformed shape showing the distorsional buckling at 75
minutes
The occurrence of the distorsional buckling seems to be initiated by some lateral
displacement of the bottom Tee and intensified due to P-∆ effects (see Figure 7.13)
leading to failure. Lateral displacements of the bottom Tee could be due to the
warping effect caused by higher temperatures of the top compared to the bottom

CELLULAR BEAMS AT AMBIENT AND ELEVATED TEMPERATURES
203
Tee, non-uniform temperature distribution in different sections along the beam
length and height, and finally local compression forces in the bottom Tee (due to
Vierendeel moments).
The load-deflection curve for this case is presented in Figure 7.17 where it is also
compared against the case with web stiffeners, and also the case where point loads
were applied, to allow an overall comparison.
Figure 7.13- A section of the mid-span of the beam at 61 minutes to schematically
present the P-∆ effect causing distorsional buckling
7.4.1.2 With web stiffeners
Similar studies were conducted on Beam A2 under a UDL but this time with
stiffeners (original geometry). The mechanical load was calculated by applying the
utilization factor of 50% to a failure load of 145 kN/m at ambient temperature
(refer to Section 5.2).
Figure 7.14 is the out-of-web plane displacements at the early stages of the test (21
minutes) which shows slight lateral deformation of the bottom Tee at mid-span.
Figure 7.15 is the same contour palette at a later stage of the test (49 minutes)
which highlights the critical role of web stiffeners in limiting the lateral
displacement of the bottom Tee and avoiding distorsional buckling. Figure 7.16 is
the final deformed shape of this beam, failed due to web buckling, in which the
axes of the bottom and top Tees are still in a straight line. Figure 7.10 can be

CELLULAR BEAMS AT AMBIENT AND ELEVATED TEMPERATURES
204
compared against Figure 7.15, as both are at 49 minutes. The same applies to
Figures 7.12 and 7.16 as both present the last minutes of the test.
Figure 7.14- Slight out-of-web plane displacements of the bottom Tee at the mid-
span at 21 minutes
Figure 7.15- Out-of-web plane displacements at 49 minutes highlighting the critical role of web stiffener to limit the lateral displacement in bottom Tee

CELLULAR BEAMS AT AMBIENT AND ELEVATED TEMPERATURES
205
Figure 7.16-Final deformed shape of the beam failed due to web buckling in which
bottom and top Tees are still in a straight line
Figure 7.17 presents the time-deflection curve for symmetric Beam A2 under a
UDL, with and without web stiffeners, and also compares these curves against the
similar curve obtained for the point load, presented earlier.
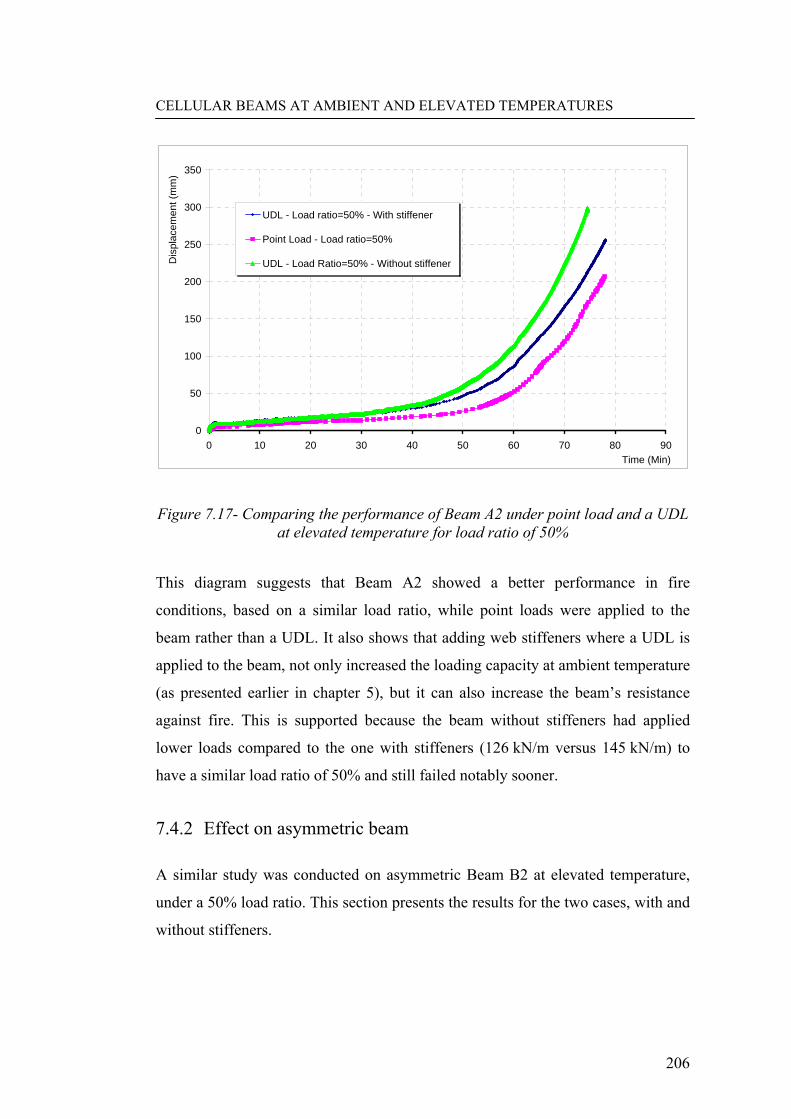
CELLULAR BEAMS AT AMBIENT AND ELEVATED TEMPERATURES
206
0
50
100
150
200
250
300
350
0 10 20 30 40 50 60 70 80 90Time (Min)
Dis
plac
emen
t (m
m)
UDL - Load ratio=50% - With stiffener
Point Load - Load ratio=50%
UDL - Load Ratio=50% - Without stiffener
Figure 7.17- Comparing the performance of Beam A2 under point load and a UDL at elevated temperature for load ratio of 50%
This diagram suggests that Beam A2 showed a better performance in fire
conditions, based on a similar load ratio, while point loads were applied to the
beam rather than a UDL. It also shows that adding web stiffeners where a UDL is
applied to the beam, not only increased the loading capacity at ambient temperature
(as presented earlier in chapter 5), but it can also increase the beam’s resistance
against fire. This is supported because the beam without stiffeners had applied
lower loads compared to the one with stiffeners (126 kN/m versus 145 kN/m) to
have a similar load ratio of 50% and still failed notably sooner.
7.4.2 Effect on asymmetric beam
A similar study was conducted on asymmetric Beam B2 at elevated temperature,
under a 50% load ratio. This section presents the results for the two cases, with and
without stiffeners.
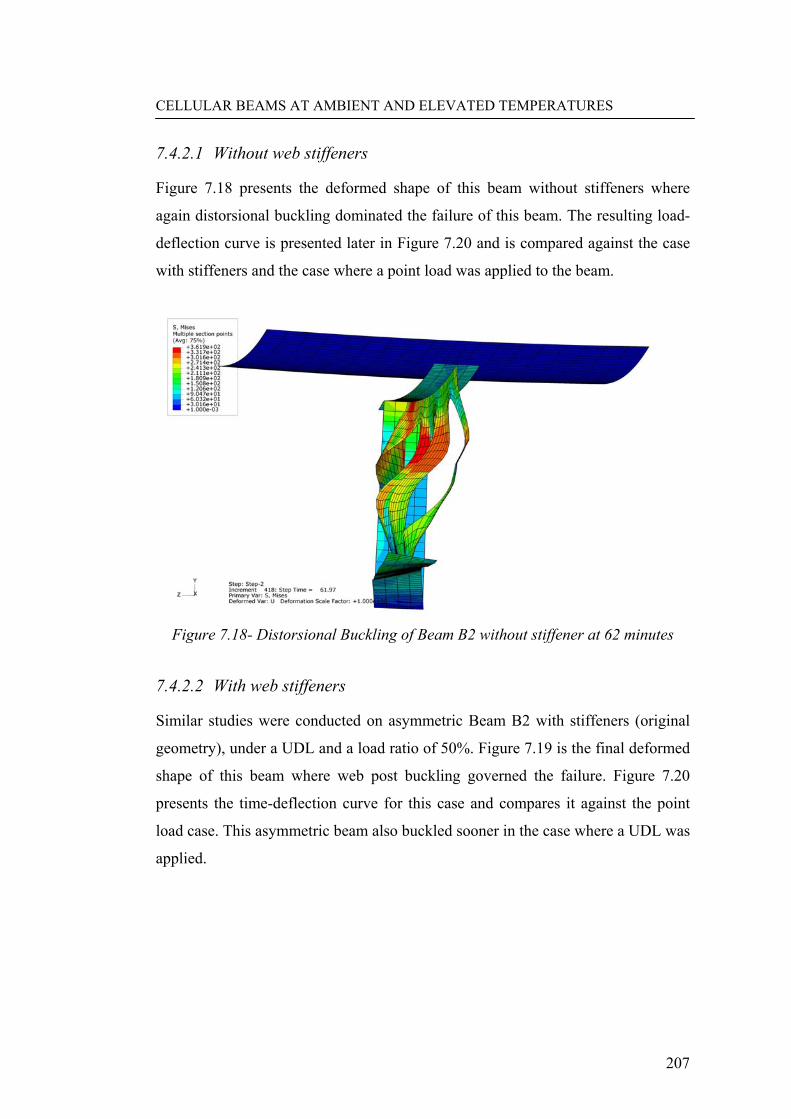
CELLULAR BEAMS AT AMBIENT AND ELEVATED TEMPERATURES
207
7.4.2.1 Without web stiffeners
Figure 7.18 presents the deformed shape of this beam without stiffeners where
again distorsional buckling dominated the failure of this beam. The resulting load-
deflection curve is presented later in Figure 7.20 and is compared against the case
with stiffeners and the case where a point load was applied to the beam.
Figure 7.18- Distorsional Buckling of Beam B2 without stiffener at 62 minutes
7.4.2.2 With web stiffeners
Similar studies were conducted on asymmetric Beam B2 with stiffeners (original
geometry), under a UDL and a load ratio of 50%. Figure 7.19 is the final deformed
shape of this beam where web post buckling governed the failure. Figure 7.20
presents the time-deflection curve for this case and compares it against the point
load case. This asymmetric beam also buckled sooner in the case where a UDL was
applied.

CELLULAR BEAMS AT AMBIENT AND ELEVATED TEMPERATURES
208
Figure 7.19-Final deformed shape of Beam B2 with stiffener under a UDL
0
50
100
150
200
250
0 10 20 30 40 50 60 70 80 90Time (Min)
Def
lect
ion.
(mm
)
UDL with Stiffener ( Load Ratio = 50%)
Point Load ( Load Ratio = 50%)
UDL without Stiffener ( Load Ratio = 50%)
Figure 7.20- Comparing the performance of Beam B2 under a point load and a
UDL at elevated temperature for load ratio of 50%
Repeating similar results and trend for the two beams supports this hypothesis that
in the fire conditions and for a constant utilization ratio (50%), the web post
buckling occurred first in the beams subjected to UDLs (mostly the case in

CELLULAR BEAMS AT AMBIENT AND ELEVATED TEMPERATURES
209
practice) than point loads (mostly the case in furnace tests). Therefore, it is non-
conservative to simply rely on the performance of these beams on fire tests. This is
especially the case where no stiffeners are used in beams under a UDL and needs
to be considered while developing design guides for these beams at elevated
temperature.
7.5 LOAD RATIO
The load ratio was 50% for the point loads applied in the fire tests on Beam A2 and
Beam B2. In this case study, load ratios varying between 10% to 85% were applied
to the models developed for Beam A2 and Beam B2 to investigate the sensitivity of
varying to load ratio at elevated temperature. Figures 7.21 and 7.22 reflect the
resulted time-deflection curves for the symmetric Beam A2 and Asymmetric Beam
B2 where a reasonable trend was observed in both cases.
0
50
100
150
200
250
300
0 10 20 30 40 50 60 70 80 90Time (Min)
Def
lect
ion
(mm
)
Experiment (Load Ratio=50%)Load Ratio=30%Load Ratio=70%Load Ratio=10%Load Ratio=50%
Figure 7.21- Sensitivity of symmetric Beam A2 to load ratio at elevated
temperature

CELLULAR BEAMS AT AMBIENT AND ELEVATED TEMPERATURES
210
0
50
100
150
200
250
300
350
0 10 20 30 40 50 60 70 80 90Time (min)
Def
. (m
m)
Experiment (Load Ratio=50%)
Load Ratio=30%
Load Ratio=70%
Load Ratio=10%
Load Ratio=85%
Load Ratio=50%
Figure 7.22- Sensitivity of asymmetric Beam B2 to load ratio at elevated
temperature
However, comparing the sensitivity of the time-deflection curves to the load ratio
in the two diagrams highlights that asymmetric Beam B2 was more sensitive to
load ratio, compared to symmetric Beam A2. This could be justified based on the
fact that the bottom Tee plays a more significant role in the ultimate load capacity
of asymmetric cellular composite beams compared to symmetric beams, at room
temperatures. Deterioration of the steel material is higher than concrete at elevated
temperature, which means that asymmetric composite beams loses greater overall
strength compared to symmetric beams. Moreover, the bottom Tee of CBs
experience higher temperatures than the top Tee and this also causes composite
asymmetric beams to lose strength and stiffness at a higher rate compared to
symmetric beams. Therefore, asymmetric beams are more sensitive to the
magnitude of the load ratios at elevated temperature. In other words, generally in
steel-concrete composite members, the higher the role of steel in the ultimate load
capacity of the composite member, the higher the rate of stiffness and strength loss
in the event of fire which results in more sensitivity to the load ratio.

CELLULAR BEAMS AT AMBIENT AND ELEVATED TEMPERATURES
211
7.6 THICKNESS OF WEB STIFFENER
The model developed for Beam A2 was employed to investigate the impact of web
stiffeners on web buckling of cellular beams at fire conditions. Various thicknesses
were considered for the web stiffeners within the study. The reason to select this
geometry was because in Beam A2 (refer to Figure 7.5), the critical web posts,
with the highest shear and moment combination, were located next to the web
stiffener, unlike Beam B2 (see Figure 7.5), Therefore web buckling was expected
to be influenced more notably by web stiffeners. Figure 7.23 shows the results of
this case study for the stiffener thickness varying between 5 mm to 25 mm.
According to this figure, even unreasonably high web stiffener thicknesses did not
delay the web post buckling and beam failure.
0
20
40
60
80
100
120
140
160
180
0 10 20 30 40 50 60 70 80 90Time (min)
Def
lect
ion
(mm
)
Web Stiffener Th.= 25 mm
Web Stiffener Th.= 10 mm
Web Stiffener Th.= 5 mm
Web Stiffener Th.= 8 mm
Figure 7.23- Effect of web stiffener thickness on performance of cellular beams in
fire

CELLULAR BEAMS AT AMBIENT AND ELEVATED TEMPERATURES
212
7.7 SUPPORT CONDITIONS
Another case study investigated the influence of support conditions in the
performance of cellular composite beams at elevated temperature by introducing
some linear springs to the beam-ends to apply various axial stiffnesses. Figure 7.24
shows schematically the sensitivity studies presented in this section. The stiffness
of the springs (represented by ‘K’ in Figure 7.24) was based on ratios (5% to
100%) of the total axial stiffness (EA/L) of a cellular composite beam at room
temperatures. Springs were introduced to symmetric and asymmetric beams, each
under point load and a UDL (four cases). This section presents and compares the
results obtained from these four cases.
It should be noted that both point loads and UDL were applied to the original
geometry to avoid the possible distorsional buckling and thus focus on web post
buckling.
Figure 7.24- Sensitivity studies carried out on the loading type and support
restraints at elevated temperature
7.7.1 Effect on symmetric beams under point load
Figure 7.25 shows the load-deflection curves for symmetric Beam A2 while
springs with various stiffnesses were applied to the beam-ends. According to the
results of these parametric studies, higher ‘K’ values resulted in slightly less

CELLULAR BEAMS AT AMBIENT AND ELEVATED TEMPERATURES
213
deflections in the pre-buckling as well as the post buckling phases of the load-
defection curve. However, the buckling phase of the load-deflection curves and the
fire resistance period of this beam were not affected by changes in the K value.
0
50
100
150
200
250
0 10 20 30 40 50 60 70 80 90
Time (Min)
Def
lect
ion
(mm
)
K=100%
K=15%
K=50%
EXPERIMENT
Pre Buckling
Buckling
Post Buckling
Figure 7.25- Load-deflection curves for the Beam A2 under point load and various
axial end support stiffness
Generally, these changes to the load-deflection curve, due to changes to the support
conditions from free horizontal restraint to full restraint, could be justified by
referring to the three factors, which generally affect the load-deflection curve in
this case. In other words, the changes in pre-buckling, buckling and post-buckling
stages of this curve (Figure 7.25) and similar curves for the other similar case
studies presented later, were influenced by the resultant of these three factors and
their dominancy at each stage of the test.
The first factor acts similar to ambient temperature while higher values of spring
stiffness, provides more restraint at the beam ends resulting in less deflections.
This effect is more dominant in the pre-buckling phase and could also be
influential in the post buckling face.

CELLULAR BEAMS AT AMBIENT AND ELEVATED TEMPERATURES
214
The second factor is caternary action, which plays a major role in the post-buckling
phase of the curve. Section 7.7.5 of this chapter looks into this in more detail and
presents the associated results. The catenary action (Yu and Liew, 2005) refers to
conditions where the flexural behaviour of CBs which is usually governed by the
web post resistance and Vierendeel actions, turns into tensile behaviour to sustain
the applied load, after web buckling. Investigations have shown that this
phenomena plays a critical role in the performance of steel beams in fire and
efforts have been made trying to utilise the catenary action to eliminate fire
protection of steel beams (Wang et al., 2005). Although this phenomenon is long
known, utilising it within fire design calculations of CBs is not as easy as it is for
common solid webbed beams. This is because after web posts has buckled, the
bottom Tee will not fully contribute to the beam resistance. Especially after the
full-scale fire test in Belfast (presented in Section 2.4.3.5) where bottom Tee
moved considerably out of web plane due to distorsional buckling (see Figure
7.36), researchers are also considering to conservatively include only the effect of
the top Tee in the calculations of the catenary action.
On the other hand, applying higher K values (end restraints), increases the axial
compressive force applied to the beam (reaction against the longitudinal thermal
expansion), especially in the bottom Tee which is hotter and also not constrained to
the concrete slab. This causes P-∆ effects, decreases the beam stiffness, especially
in the bottom Tee, and in some cases causes instabilities, comprising local
instabilities in the Tees or distortional buckling, which results in higher deflections
and quicker failure. This effect is counted as the third factor. Figure 7.26 presents
the maximum lateral deflection of the bottom flange of Beam A2 against time for
three different K values. It shows that the development of distortional buckling,
which has been followed by the web buckling, was accelerated by the increase of
the K value.

CELLULAR BEAMS AT AMBIENT AND ELEVATED TEMPERATURES
215
0
10
20
30
40
50
60
70
80
0 10 20 30 40 50 60 70 80 90Time (Min)
Late
ral D
efle
ctio
n of
Bot
tom
Fla
nge
(mm
)
K=15%
K=50%
K=0 %
Figure 7.26- The maximum lateral deflection of the bottom flange of the Beam A2
versus time for three different K values
These three factors can justify the behaviour observed in different phases of the
load-deflection curve for Beam A2.
7.7.2 Effect on symmetric beams under a UDL
The same case studies on the role of end restraint conditions were carried out on
Beam A2 but under a UDL and Figure 7.27 compares the resulting load-deflection
curves. This chart again highlighted that increasing the stiffness of the springs
resulted in slightly less deflection in the pre and post-buckling phases, but not in
the buckling phase.

CELLULAR BEAMS AT AMBIENT AND ELEVATED TEMPERATURES
216
0
50
100
150
200
250
300
0 10 20 30 40 50 60 70 80 90Time (Min)
Dis
plac
emen
t (m
m)
K=0%
K=75%
K=5%
Figure 7.27- Load-deflection curves for Beam A2 under distributed load and
various K values
Consequently, the two case studies on Beam A2, Figures 7.25 and 7.27, suggest
that the overall behaviour of symmetric cellular beams in fire was not greatly
affected by the K value, compared to asymmetric Beam B2, which is presented in
the next section.
7.7.3 Effect on asymmetric beams under point load
The same studies on end restraints were conducted on asymmetric Beam B2 and
major differences were noticed between the behaviour of asymmetric against the
symmetric beams in this respect. Imposing a higher K value to springs resulted in
lower deflections in pre and post-buckling phases, similar to the symmetric beam.
However, the web post buckling was notably and critically accelerated. This is
shown in Figure 7.28, which compares the load-deflection curves for different
support conditions and indicates that the buckling phase has initiated notably
earlier with the increase of K values.

CELLULAR BEAMS AT AMBIENT AND ELEVATED TEMPERATURES
217
0
50
100
150
200
250
0 10 20 30 40 50 60 70 80 90Time (min)
Def
lect
ion
(mm
)
K=12.5%K=50%K=100% K=75%ExperimentK=0%K=5%
Pre Buckling
Post Buckling
Buckling
Figure 7.28- Load-deflection curve for Beam B2 under point load and
experiencing various axial restraints
The interesting point is that providing higher support rigidities promoted the web
post buckling by up to about 10% in terms of time. According to Figure 7.28, the
mid-span deflection of 100 mm occurred at 67 and 59 minutes for 0% and 50% of
axial stiffness (K) respectively, which shows a relatively notable difference in the
buckling phase. This chart also shows that the buckling phase was relatively
sensitive to the existence, or non-existence of some axial restraint (shown by
curves for K=0% and K=5%). However, this sensitivity faded for higher K values
whilst the curves for K=50% and K=100% hardly diverged from each other.
One of the major reasons why the performance of asymmetric beams is more
sensitive to end restraint is again hidden behind the fact that the bottom Tee plays a
more critical role in the ultimate loading capacity of these beams as opposed to
symmetric beams. Experiencing the high temperatures in the bottom Tee and
excessive compressive forces applied by end supports is more influential in
reducing the loading capacity of asymmetric beams, which is more dependent on
the bottom Tee. This leaves the asymmetric beam more sensitive to support
conditions (K value).

CELLULAR BEAMS AT AMBIENT AND ELEVATED TEMPERATURES
218
7.7.4 Effect on asymmetric beams under a UDL
A similar case study was conducted on the asymmetric Beam B2 under a UDL and
Figure 7.29 presents the results, which show a similar trend to that obtained for the
asymmetric beam under a point load.
0
50
100
150
200
250
0 10 20 30 40 50 60 70 80 90Time (Min)
Def
lect
ion.
(mm
)
K=0%
K=50%
K=75%
K=25%
Figure 7.29- Load-deflection curve for Beam B2 under line load experiencing
various axial restraints
The presented results at elevated temperature shows that asymmetric beams are
more vulnerable to support conditions, in terms of failure by web post buckling,
compared to symmetric beams. This needs to be considered in the design methods
proposed for asymmetric cellular beams. Moreover, this underlines the fact that it
is not conservative for asymmetric beams to develop calculation methods relying
on their performance in fire tests as in practice CBs are ideally connected to
primary beams which means some axial restraint is applied to the ends.
Finally, it is critical to note that the investigations presented in this section were all
based on one particular form of variation of support stiffness (K) though the beam
height, in which the stiffness was assumed to be relatively uniform through the

CELLULAR BEAMS AT AMBIENT AND ELEVATED TEMPERATURES
219
height of the composite beam. In practice, the stiffness of the support could vary
through the height, depending on the torsional stiffness of the primary beams,
whether the main beam is on the edge of the floor slab or internal, and the
distribution of the fire load. This means more critical conditions could also be
expected in accelerating the buckling of the beam and more research could be done
in this regard.
7.7.4.1 Some observations within carrying out case studies on support conditions
The case studies to increase the restraint stiffness (K) were associated with some
local buckling in the Tees in some of the models (see Figure 7.30a). Moreover,
some models experienced distortional buckling of the bottom Tee (see Figure
7.30b) prior to web post buckling (Figure 7.30c). As explained before, these
instabilities prior to web buckling were intensified by high compression forces
applied to the beam by end supports due to restrained thermal expansion.
(a) Local buckling (b) Distortional
buckling
(c) Web post buckling
Figure 7.30- Local flange buckling, distortional buckling and web post buckling of CBs

CELLULAR BEAMS AT AMBIENT AND ELEVATED TEMPERATURES
220
Top Tees generally experience lower temperatures than the bottom Tees, and
therefore lower compression due to thermal expansion which was restrained.
Nevertheless, local instabilities were not always limited to the bottom Tee. They
also occurred in the top Tees as they already experience lower tension due to
overall bending compared to the bottom Tee. Moreover, an additional compression
is also applied to the top Tee due to considering the full shear interaction between
the slab and the top flange knowing that the concrete slab has lower temperatures
and thermal expansion than the top Tee.
The local instabilities of the top flange occurred in the relatively early stages of fire
loading when flexural behaviour was still the dominant load bearing mechanism.
Figures 7.31 and 7.32 present a good example in which the first figure shows the
last panel of Beam A2 with excessive local compressive force (at 35 minutes), and
the next figure shows the local buckling of the top Tee at the next loading stage
(again 35 minutes).
Figure 7.31- Minimum in-plane principal stress representing the compressive
stresses

CELLULAR BEAMS AT AMBIENT AND ELEVATED TEMPERATURES
221
Figure 7.32-Local buckling of the Top Tee of the last opening
Nevertheless, in none of the case studies on axial restraint, presented in this section
(where the beams were modelled with web stiffeners), local buckling or
distorsional buckling, governed the ultimate loading capacity, as stresses
redistributed, and web post buckling dominated the overall load capacity in all
cases. However, these events were not totally independent and interactions were
evident in some cases. In other words, the web post buckling was promoted by the
occurrence of these instabilities. Figures 7.33, 7.34 and 7.35 present the gradual
formation of distorsional buckling of the bottom Tee in Beam A2 when K=100%
(as explained in section 7.7.1) and how the instability of the web post is promoted
resulting in earlier web buckling.
The fact that in none of these case studies distorsional buckling governed the
overall beam’s failure, emphasises the critical role of web stiffeners on avoiding
distorsional buckling. This is achieved by limiting the lateral drifts of the bottom
Tee, even when high K values increases instability of bottom Tee (as explained)
and its tendency to move out of the web plane.

CELLULAR BEAMS AT AMBIENT AND ELEVATED TEMPERATURES
222
Figure 7.33-Uz plot at 15 minutes which shows shaping of overall distorsional buckling in Beam A2, due to high end restraints (K=100%)
Figure 7.34- Uz plot at 24 minutes, which shows development of the overall distorsional buckling in Beam A2 and how it perturbed the web post

CELLULAR BEAMS AT AMBIENT AND ELEVATED TEMPERATURES
223
Figure 7.35- Shaping of the overall distorsional buckling in Beam A2, at 61
minutes, (K=100%)
It should be noted that the effect of end-restraints in changing the failure mode
from web post to distorsional buckling (in cellular beams with no web stiffeners)
was observed in the recent full-scale fire test conducted by the University of Ulster
in 2010 (report to be published). In this fire test both of the internal unprotected
cellular beams, which were restrained at the beam-ends by protected primary
beams, failed clearly due to distorsional buckling. Figure 7.36 shows the final
deformed shape of the two internal beams showing distorsional buckling.

CELLULAR BEAMS AT AMBIENT AND ELEVATED TEMPERATURES
224
Figure 7.36- Failure of the internal cellular beams due to distorsional buckling at the full-scale fire test carried out by University of Ulster in 2010
7.7.5 Interaction between cellular beam and end supports (catenary
action)
The axial displacement of Beam A2 and Beam B2, was also investigated at the
beam-ends to see how any of these beams interacted with the end supports and how
this relates to the development of catenary action. This has been carried out by
looking at five nodes through the beam height which are highlighted in Figure
7.37.
7.7.5.1 Interaction between the symmetric Beam A2 and end-supports
Figures 7.38, 7.39 and 7.40 show the axial displacements (also the spring forces as
springs were linear) of the five nodes for Beam A2, under a point load, for K=0%,
K=5% and K=75% respectively. According to these figures, the axial deformation

CELLULAR BEAMS AT AMBIENT AND ELEVATED TEMPERATURES
225
of the top Tee (Point E) was governed by the interaction of the concrete slab with
the top flange. As concrete material is less sensitive to temperatures and loses its
axial stiffness at a lower rate than steel, the top Tee experienced similar axial
deflections in all cases, regardless of the K value.
However, the axial deflection of the other nodes through the beam height and
development of catenary action at elevated temperature, particularly in the bottom
Tee, was greatly affected by the K values. Figures 7.38, 7.39 and 7.40 show that
catenary action becomes more dominant, and also started to develop earlier, with
higher axial restraints. In particular, catenary action started at 68, 58 and 25
minutes for K=0%, K=5% and K=75%, respectively, which shows higher end
restraints were associated with a earlier web buckling (as explained) and earlier
development of catenary action (in the post-buckling phase). These figures also
show that catenary action was initiated first in the bottom Tee and then developed
in the top Tee.
These studies were conducted for both loading types (UDL and point loads) and no
major difference was observed.
Figure 7.37-Position of the nodes through the beam height

CELLULAR BEAMS AT AMBIENT AND ELEVATED TEMPERATURES
226
-30
-25
-20
-15
-10
-5
00 10 20 30 40 50 60 70 80 90 100
Time (Min)A
xial
Dis
plac
emen
t (m
m) Point A
Point BPoint CPoint DPoint E
Domination of catenary action
Figure 7.38- Axial Deflection of the nodes through the height of Beam A2 for
K=0%
-30
-25
-20
-15
-10
-5
00 10 20 30 40 50 60 70 80 90
Time (Min)
Axi
al D
efle
ctio
n (m
m)
Point APoint BPoint CPoint DPoint E
Domination of catenary action
Figure 7.39- Axial Deflection of the nodes through the height of Beam A2 for
K=5%

CELLULAR BEAMS AT AMBIENT AND ELEVATED TEMPERATURES
227
-30
-25
-20
-15
-10
-5
00 10 20 30 40 50 60 70 80 90
Time (Min)A
xial
Def
lect
ion
(mm
) Point APoint BPoint CPoint DPoint E
Domination of catenary action
Figure 7.40- Axial Deflection of the nodes through the height of Beam A2 for
K=75%
7.7.5.2 Interaction between the asymmetric Beam B2 and end-supports
The same studies were conducted on the asymmetric Beam B2 and Figures 7.41,
7.42 and 7.43 presents the results for this beam for K=25%, K=50% and K=75%
respectively. These figures show a trend in asymmetric beams, which is very
similar to what was observed for the symmetric beam.

CELLULAR BEAMS AT AMBIENT AND ELEVATED TEMPERATURES
228
-14
-12
-10
-8
-6
-4
-2
0
2
0 10 20 30 40 50 60 70 80 90
Time (Min.)A
xial
Dis
plac
emen
t (m
m)
Point APoint BPoint DPoint E
Domination of catenary action
Figure 7.41- Axial Deflection of the nodes through the height of Beam B2 for
K=25%
-9
-8
-7
-6
-5
-4
-3
-2
-1
00 10 20 30 40 50 60 70
Time (Min)
Axia
l Dis
plac
emen
t (m
m)
Point APoint BPoint CPoint DPoint E
Domination of catenary action
Figure 7.42- Axial Deflection of the nodes through the height of Beam B2 for
K=50%

CELLULAR BEAMS AT AMBIENT AND ELEVATED TEMPERATURES
229
-7
-6
-5
-4
-3
-2
-1
0
1
0 10 20 30 40 50 60 70 80 90
Time (Min)
Axi
al D
ispl
acem
ent (
mm
)
Point APoint BPoint CPoint DPoint E Domination of
catenary action
Figure 7.43- Axial Deflection of the nodes through the height of Beam B2 for
K=75%
7.8 SUMMARY OF THE CASE STUDIES ON CELLULAR
COMPOSITE BEAMS AT ELEVATED TEMPERATURE
This chapter presented the parametric studies conducted on models validated at
elevated temperature. It was shown that the magnitude of web imperfection does
not affect the performance of these beams at elevated temperature (unlike ambient
temperature). Therefore, the current approach by the “Strut” model, which
calculates the web buckling resistance at ambient and elevated temperatures
similarly, is not very reasonable at elevated temperature.
Case studies also presented the effect of loading type (a UDL as opposed to point
loads) and excluding the full height web stiffeners on the performance of cellular
composite beams at fire conditions. For a constant utilization factor, beams
performed better against fire when they were subjected to point loads, as opposed
to a UDL. In some cases excluding the web stiffeners (for beams subjected to a
UDL) resulted in distorsional buckling which promoted the failure of the beam.

CELLULAR BEAMS AT AMBIENT AND ELEVATED TEMPERATURES
230
Moreover, the sensitivity of cellular beams to the utilization factor and support
conditions was investigated at elevated temperature for both symmetric and
asymmetric sections. Asymmetric beams were found to be more sensitive and
vulnerable to the utilization factor than symmetric beams as explained in Section
7.5. Increasing the end-restraints caused local and global instabilities and promoted
the failure by either web post or distorsional buckling. However, increasing the
end-restraints was also associated with a better post failure performance, which
was dominated by the catenary action.

CELLULAR BEAMS AT AMBIENT AND ELEVATED TEMPERATURES
231
8 CONCLUSIONS & RECOMMENDATIONS
After an extended review of the literature and an in depth investigation into the
behaviour of cellular beams and cellular composite beams at ambient and elevated
temperatures, conclusions could be made and future investigations recommended.
8.1 CONCLUSIONS
1. Two of the well-known commercial finite element packages, ANSYS and
ABAQUS were initially used and their capabilities were compared in
modelling cellular composite beams. ABAQUS was proved notably more
equipped and capable in modelling the complex concrete material and the
associated numerical problems. ANSYS, only allows to introduce concrete
material to a particular solid element whereas ABAQUS enables the user
to incorporate the concrete material to solids as well as shell and beam
elements. Besides, ABAQUS benefits from three material models to
represent the concrete performance while these options are limited to only
one in ANSYS. Finally, ABAQUS enables the user to manipulate the post
cracking behaviour of concrete, whereas ANSYS leaves no options. This
was critical to overcome the associated convergence problems.
2. The numerical models developed for cellular beams at ambient
temperature showed a good conformity with the test results in terms of
failure mode, failure load and load-deflection behaviour. However,
validation of the numerical models for cellular beams against test results
can be difficult when the two common failure modes, web post buckling
and Vierendeel bending were both imminent. In such cases, recognizing
the correct failure mode by numerical models can be very sensitive to
boundary conditions and load increment. In particular, supports applied to
restrain the lateral displacement of top flange also apply an additional

CELLULAR BEAMS AT AMBIENT AND ELEVATED TEMPERATURES
232
moment to web post. This moment, which depends on the number of
supports and increases with vertical load, promotes the misbalancing and
therefore buckling of the web post. This can be very decisive in
modelling the correct behaviour by numerical models. In the case
presented in this research, slight modifications of the lateral supports
applied to top flange, in particular changing the lateral restraint from
being applied to a node to being applied over a limited length of flange,
changed the failure mechanism from Vierendeel bending to web buckling.
Subsequent to this change, the failure load was also reduced by 45% and
the numerical model was validated against the test results.
Moreover, if load increments are not small enough at the loads which
buckling is expected to happen, web post buckling could be easily missed
by the software and Vierendeel mechanism takes over the failure. This
mistake in the numerical modelling can happen due to the dependency of
Vierendeel action to yield stress, and web buckling to elastic and plastic
modulus while stress-strain transform was almost an elastic-fully plastic
bilinear curve for structural steel (based on the BSEN1993-1-1).
3. The numerical models developed for cellular composite beams generally
had a very good conformity with the results of the tests conducted at
ambient temperature. This agreement between the numerical and test
results was also good at elevated temperature in terms of the load-
deflection curve, failure mode and failure load (temperature). This
calibration of the numerical models allowed these models to be used for
case studies on cellular composite beams at ambient and elevated
temperatures.
4. Various amplitudes of web imperfections were introduced to symmetric
and asymmetric cellular composite beams at ambient and elevated
temperatures that had failed due to web buckling. Comparing the failure

CELLULAR BEAMS AT AMBIENT AND ELEVATED TEMPERATURES
233
loads underlined that imperfections could have an impact at ambient
temperature but they were not influential at elevated temperature. This
suggests that the current method to calculate the buckling strength of web
posts at elevated temperature (SCI publication RT1187), does not seem
reasonable. In particular, this method makes the web buckling capacity at
elevated temperature dependent on web imperfections (similar to ambient
temperature), by introducing the two different buckling curves “c” and
“d" (BSEN1993-1-1) which gives up to 9% difference in the reduction
factor (χ) of the web post (strut). However, this approach is incorrect as
the case studies showed that failure due to web buckling at elevated
temperature remained unaffected by web imperfections.
5. Case studies on the performance of cellular composite beams under a
UDL showed that their resistance against web buckling at ambient
temperature can significantly increase by adding web stiffeners. In the
absence of web stiffeners, some relative displacements were witnessed
between the top and bottom Tees, in the out-of-web plane direction.
However, they were not major enough to cause distorsional buckling and
web post buckling was the dominant failure mode in all case studies at
ambient temperature.
The performance of cellular composite beams at elevated temperature
was investigated under point loads and UDLs, based on a slow fire curve
of 10oC/min, and fixed load ratio of 50%, which showed that they resisted
notably higher temperatures when point loads were applied, rather than a
UDL. In all cases where a UDL was applied, excessive relative
displacements took place between the top and bottom Tees, which caused
failure due to distorsional buckling (and not web buckling). Adding web
stiffeners, which although increased the applied load (to keep the load
ratio constant), avoided distorsional buckling and enhanced the overall
resistance of beam against high temperature.

CELLULAR BEAMS AT AMBIENT AND ELEVATED TEMPERATURES
234
This hypothesis that these beams are more vulnerable against fire
conditions if they are designed based on UDLs (which is mostly the case
in practice) than point loads (mostly the case in experiments) emphasises
that it is non-conservative to rely on performance of these beams on fire
tests as is the case in current design methods. This seeks particular
attention in fire design of these beams remembering that web stiffeners
are not normally used when beams are subjected to a UDL. These results
also recommend the use of web stiffeners in cellular beams, not only to
notably increase their resistance at ambient temperature but also to avoid
the distorsional buckling and a better overall performance at elevated
temperature.
6. Parametric studies were conducted on the role of different temperature
distributions along the beam length, based on the same fire curve and a
constant heating energy. It was found essential to apply the temperatures
accurately in critical web posts to achieve the required validation against
experimental data, especially in fast growing fires. Moreover, the ultimate
loading capacity was found to be sensitive to even slight changes in
distribution of temperature along the beam length. In particular, higher
temperatures in critical panels, where the shear and its interaction with the
moment were highest, promoted web buckling.
7. The asymmetric cellular beam showed a higher sensitivity and
vulnerability to the magnitude of the load ratio compared to the
symmetric beam. For a similar load ratio (utilization factor), a symmetric
beam resisted higher temperatures before failure and this seeks further
research and prudency in fire design of asymmetric cellular beams. This
was justified based on the fact that generally in steel-concrete composite
members, the higher the role of steel in the ultimate load capacity of the
composite member, the higher the rate of stiffness and strength loss in the

CELLULAR BEAMS AT AMBIENT AND ELEVATED TEMPERATURES
235
event of fire. This results in more sensitivity to the load ratio.
Experiencing the highest temperatures in bottom Tee, compared to other
sections also contributes to this result.
8. Applying semi-restraints at beam-ends (by introducing linear springs to
apply a uniform stiffness based on percentages of overall axial stiffness of
the beam) in the fire situation decreased the initial and also final
deflections of CBs which was governed by catenary action. On the other
hand, applying higher restraints constantly promoted the failure due to
web buckling and reduced the resistance duration compared to simply
supported beams. In some cases with increasing the end-restraints, the
web buckling was followed after the occurrence of distortional buckling
(which did not govern the failure unless in beams with no web stiffener)
or local buckling in the bottom or top Tees, caused by high axial forces
due to thermal expansion. These instabilities interacted with web posts
towards destabilising it and promoted web buckling. This effect was
again more evident in asymmetric cellular beams. This is especially
critical since relying on the findings from standard fire tests (in which
beams are mostly simply supported) to propose general fire design guides
for these beams is non-conservative, and these beams can be more
vulnerable to web post buckling in fire conditions in practice compared to
test conditions.
9. Although applying restraints at the beam-ends promoted failure due to
web post buckling (especially in asymmetric beams) it also allowed for
the development of catenary action in the post failure phase. Catenary
action was more dominant when higher restraints were provided at the
beam-ends. The axial displacement (catenary action) in the bottom Tee,
within the thermal loading, was quite dependent on the K value (axial
stiffness), while the top Tee did not show much sensitivity to K values
and was mostly dominated by the full interaction with the concrete slab.

CELLULAR BEAMS AT AMBIENT AND ELEVATED TEMPERATURES
236
8.2 RECOMMENDATIONS AND FUTURE WORK
The author would like to make to following recommendations on the basis of this
research.
• It was observed that adding full-height web stiffeners to cellular composite
beams subjected to a UDL, improved the web buckling resistance at
ambient temperature by up to 14%. However, this was just examined in two
geometries. The author recommends investigating this on beams with
various spans and geometric details and looking at how the stiffener affects
the stress distribution and delays the web buckling. At elevated
temperature, cellular composite beams subjected to a UDL (with no web
stiffener) tend to fail due to distorsional buckling as opposed to web
buckling. This tendency became more dominant when some restraints were
applied at beam supports. It was only when the web stiffeners were added
that beams became equipped to resist the distorsional buckling. Based on
this, the author recommends adding full-height web stiffeners to cellular
beams under a UDL to improve their performance at both ambient and
elevated temperatures. However, these investigations are only conducted
for two geometries and investigating a wide range of geometers and spans
will assess the justifiability of this design recommendation.
• This research was based on fire curves used with the Ulster tests. It would
be interesting to investigate the performance of the same beams when they
are subjected to other fire scenarios. In addition, future research can focus
on considering a part of the beam length being subjected to fire, as opposed
to the whole beam length, and investigating whether changing the fire
exposure conditions notably delays the failure of the beam.
• It was presented that the current “Strut” model to estimate the buckling
resistance of the web post (using buckling curves “c” and “d”) is not very
reasonable at elevated temperature as this model makes the buckling
resistance dependent on web imperfections which is not reasonable at

CELLULAR BEAMS AT AMBIENT AND ELEVATED TEMPERATURES
237
elevated temperature. However, more research needs to be done in this
regard to specify the best buckling curve to be used in the “Strut” model to
estimate the web buckling capacity at elevated temperature.
• Finally, future research needs to also focus on implementing a simple but
reliable design model, which can predict the failure mode and load
(temperature) of cellular beams and cellular composite floors at elevated
temperature. The way to validate this analytical model would be to
numerically model a single web post (2 half-panels) of one beam, apply the
critical loads and moments proposed by the analytical model for each
failure mode, and calibrate it against the numerical results of the full-length
beam.

CELLULAR BEAMS AT AMBIENT AND ELEVATED TEMPERATURES
238
REFERENCES
ACI (1998) Finite Element Analysis of Fracture in Concrete structures. IN 446, A. C. (Ed.) USA.
ANSYS (2003) ANSYS V5.6 help documentation, Elements. ARCELORMITTAL (2001) Luxembourg, 19 avenue de la Liberté, L-2930
Luxembourg, Germany. ASFP, SCI & FTSG (1992) Fire Protection for Structural Steel in Buildings BAILEY, C. G. (2001) Steel structures supporting composite floor slabs: design for
fire- BRE Digest 462. BRE. BAILEY, C. G. (2003a) Indicative fire test on a cellular and solid web steel beam.
Manchester, UMIST. BAILEY, C. G. (2003b) Indicative fire tests on cellualar and solid beams with
intumescent coatings. Manchester. BAILEY, C. G. (2004) Indicative Fire Tests to Investigate the Behaviour of
Cellular Beams Protected with Intumescent Coatings. Fire Safety Journal, 39, 689-709.
BAILEY, C. G. (2006) Recent Developments in Structural Fire Safety. International Congress on Fire Safety in Tall Buildings. Santander, Spain.
BAILEY, C. G. (2008) One Stop Shop in Structural Fire Engineering. University of Manchester.
BAILEY, C. G., LENNON, T. & MOORE, D. B. (1999) The Behaviour of Full-Scale Steel-Framed Buildings Subjected to Compartment Fires. The Structural Engineer, 8, 15-21.
BAILEY, C. G. & MOORE, D. (2000a) The Structural behaviour of steel frames with composite floorslabs subject to fire: Part 1: Theory. The Structural Engineer, 78, 19-27.
BAILEY, C. G. & MOORE, D. (2000b) The Structural behaviour of steel frames with composite floorslabs subject to fire: Part 2: Design. The Structural Engineer, 78, pp 28-33.
BAKE, S. (2004) Investigation of the effective parameters on Lateral-torsional buckling of web post of castellated beams. University of Tehran, Iran.
BAKE, S. & BAILEY, C. G. (2007a) Numerical modeling of cellular composite beams at elevated temperature. ICASS'07- Adnances in Steel Structures. Singapore.
BAKE, S. & BAILEY, C. G. (2007b) Performance of cellular steel beams at ambient and elevated temperatures. SEMC 2007- The Third International Conference on Structural Engineering, Mechanics and Computation. Cape Town, University of, South Africa.
BARBOSA, A. F. & RIBERIO, G. O. (1998) Analysis of reinforced concrete structures using reinforced concrete model. Computational mechanics. Spain.

CELLULAR BEAMS AT AMBIENT AND ELEVATED TEMPERATURES
239
BAZANT, B. H. O. A. Z. P. (1983) Crack band theory for fracture of concrete. Materiaux et Constructions, 16(93), 155-177.
BITAR, D., DEMARCO, T. & MARTIN, P. O. (2005) Steel and non-composite cellular beams—novel approach for design based on experimental studies and numerical investigations. Brochure EUROSTEEL.
BRADFORD, M. A. (1992) Lateral-Distortional buckling of steel I--Section members. Journal of Constructional Steel Research, 23, 97-116.
BSI (1987) BS476-20, Fire tests on building materials and structures. Part 20:Method for determination of the fire resistance of elements of construction, British Standards Institution.
BSI (1998) ENV 1993-1-1:1992/A2:1998: Design for openings in web. BSI (2000) BS 5950-1:Structural use of steelwork in building —Part 1: Code of
practice for design —Rolled and welded sections. BSI (2002a) EN1990- Basis of structural design. BSI (2002b) EN1991-1-2: Actions on structures exposed to fire. BSI (2003a) BS5950- Part 8: Structural use of steelwork in building —Part 8:
Code of practice for fire resistant design, UK. BSI (2003b) BS PD 7974-1-Application of fire safety engineering principles to the
design of buildings. BSI (2003c) PD 7974-1: Application of fire safety engineering principles to the
design of buildings. Initiation and development of fire within the enclosure of origin.
BSI (2004a) EN1992-1-1: Design of concrete structures. BSI (2004b) EN1992-1-2: Design of concrete structures, General rules- Structural
fire design. BSI (2004c) EN1994-1-1: Design of Composite Structures. BSI (2005a) EN1993-1-1: Design of steel structures. BSI (2005b) EN1993-1-2: Design of steel structures- Part 1-2: General rules-
Structural fire design. BSI (2005c) EN1994-1-2: Design of composite steel and concrete structures in fire. BSP (1999) Cardington Fire Test- The behaviour of the multi-storey Steel Framed
Buildings in fire. Moorgate, British Steel Place. CHUNG, K. F. (2002) Composite beams and floor systems fully integrated with
building services. Prog. Struct. Engng Mater. (DOI: 10.1002/pse.116) 169-178.
CHUNG, K. F. & LAWSON, R. M. (2001) Simplified design of composite beams with large web openings to Eurocode 4. Journal of Constructional Steel Research, 57, 135-164.
CHUNG, K. F., LIU, C. H. & KO, A. C. H. (2003) Steel beams with large web openings of various shapes and sizes: an empirical design method using a generalised moment-shear interaction curve. Journal of Constructional Steel Research, 59, 1177-1200.
CHUNG, K. F., LIU, T. C. H. & KO, A. C. H. (2001) Investigation on Vierendeel mechanism in steel beams with circular web openings. Journal of Constructional Steel Research, 57, 467-490.

CELLULAR BEAMS AT AMBIENT AND ELEVATED TEMPERATURES
240
CRISFIELD, M. A. (1986) Snap-Through and Snap-Back Response in Concrete Structures and the Dangers of Under-Integration,” International Journal for Numerical Methods in Engineering. vol. 22, pp. 751-767.
CTICM (1962) Espace technologique-Lorme des merisiers-Immeuble Apollo-91193 Saint-Aubin-Paris.
CTICM (2008) Test Report Number: 08- G- 399- Fire resistance of cellular beams. CTICM.
DARWIN, D. (1990) Design of steel and composite beams with web openings. Steel design guide series American Institute of Steel Construction, 2.
DAS, P. K. & SEIMAINI, S. L. (1985) Handbook for the Design of castelletad Beams.
DORAN, B. & KOKSAL, H. O. (1998) Use of 'Drucker-Prager criterion' in the analysis of reinforced concrete members by finite elements. Journal of Turkish Chamber of Civil Engineers 9, 9, 489-493.
DRYSDALE, D. (1999) An Introduction to fire Dynamics, Chichester, John Wiley. ECSC (2003) ECSC 7210-PR-315. “Large Web Openings for Service Integration
in Composite Floors”. Final report, Part 2: evaluations and design models. FABSEC (2004), Fabsec Ltd. Brooklands Courst, Tunstall Road. Leeds LS11 5HL. FAGAN, M. J. (1992) Finite Element Analysis - Theory and practice, London. FANNING, P. (2001) Nonlinear models of reinforced and post-tensioned concerete
beams. Electronic Journal of Structural Engineering, 2. FTA (2008) Building Regulations, Approved Document B (Fire Safety). HIBBITT, D., KARLSSON, B. & SORENSEN, P. (2004a) ABAQUS/ Standard
Users Manual,Version 6.5, HKS. HIBBITT, D., KARLSSON, B. & SORENSEN, P. (2004b) ABAQUS/ Standard
Users Manual,Version 6.5, HKS. HILLERBORG, A., M. MODEER, AND P. E. PETERSSON (1976) Analysis of
Crack Formation and Crack Growth in Concrete by Means of Fracture Mechanics and Finite Elements,” Cement and Concrete Research. vol. 6,, pp. 773-782.
HOSAIN, M. U. & SPEIRS, W. G. (1973) Experiments on castellated steel beams. Journal of the American Welding Society, 52, 329-342.
I.S. (1985) ISO834- Fire Resistance Tests – Elements of building construction, . JOYEUX, D. (2003) Fire behaviour of beas with large web openings. Metz,
CTICM. KARLSSON, B. & QUINTIERE, J. G. (2000) Enclosure Fire Dynamics. Boca
Raton: CRC Press. KERDAL, D. & NETHERCOT, D. A. (1984) Failure modes for castellated beams.
Journal of Constructional Steel Research, 4, 295-315. KNOWLES, P. R. (1991) Castellated beams. Institution of the Civil Engineering KOLOSOWSKI, J. (1964) Stresses and deflection in castelllated beams. The
Structural Engineer, 42, 19-24. LAWSON, R. M. & CHUNG, K. P. (1992) Tests on composite beams with large
web openings to justify existing design methods. . The Structural Engineer, 70(1).
CELLULAR BEAMS AT AMBIENT AND ELEVATED TEMPERATURES
241
LAWSON, R. M. & HICKS, S. J. (2009) P355- Design of Composite Beams with Large Openings to Eurocode 4, SCI.
LAWSON, R. M., LIM, J., HICKS, S. J. & SIMMS, W. I. (2006) Design of composite asymmetric cellular beams and beams with large web openings. Journal of Constructional Steel Research, 62, 614-629.
LAWSON, R. M., M, N. G. & D., O. (2002) Design of FABSEC Beams in Non-Composite and Composite Applications (including Fire).
LIU, T. C. H. & CHUNG, K. F. (1999) Practical design of universal steel beams with single web openigs of different shapes. Proceedings of the second European conference on steel structures- Eurosteel 99. Prague.
LIU, T. C. H. & CHUNG, K. F. (2003) Steel beams with large web openings of various shapes and sizes: finite element investigation. Journal of Constructional Steel Research, 59, 1159-1176.
MACKERLE, J. (2002) Material and geometrical nonlinearities FEM and BEM analyses: A bibliography (1998-2000). Finite Elements in Analysis and Design, 38, 307-317.
NADJAI, A. (2005) Performance of Cellular Composite Floor Beams at Ambient Temperature. Ulster University.
NADJAI, A. (2007) TEST REPORT FOR WESTOK Ltd- Behaviour of Composite Floor Cellular Steel Beams at Elevated Temperatures. Belfast, Ulster University.
NADJAI, A., BAILEY, C. G., BAKE, S., ALI, F., TALAMONA, D. & ALLAM, A. (2006) Behaviour of composite Floor Cellular Steel Beams at Elevated Temperatures. International Congress on Fire Safety in Tall Buildings. Spain.
NADJAI, A., GOODFELLOW, N., TALAMONA, D., ALI, F., BAILEY, C. G. & BAKE, S. (2007) Experimental and numerical investigation on composite floor cellular steel beams in fire. 3rd International Conference on Steel and Composite Structures (ICSCS07). Manchester.
NADJAI, A., GOODFELLOW, N. & VASSART, O. (2008) Simple calculation method of composite cellular beams at elevated temperatures Fifth International Conference on Structures in Fire (SiF’08).
NETHERCOT, D. A. & KERDAL, D. (1982) Lateral torsional buckling of castellated beams. The Structural Engineer, 60B, 53-61.
NEWMAN, G. M., ROBINSON, J. T. & BAILEY, C. G. (2006) Fire safe design: a new approach to multi-storey steel-framed buildings- P288 Second Edition, Ascot, SCI
NOTE, T. (2002) Technical note: Fire engineering of cellular beams using intumescent coatings. Struct Eng 2002; 24–5. The Structural Engineer, 22-24.
PEIJUN, W., LI, G. & GUO, S. (2008) Effects of the cooling phase of a fire on steel structures. Fire Safety Journal, 43, 451-458.
PELOSI, G. (2007) The Finite-Element Method, Part I: R.L.Courant. Antenna's and Propagation Magazine, 180-183.
PURKISS, J. A. (2007) Fire Safety Engineering Design of Structures- Second Edition.

CELLULAR BEAMS AT AMBIENT AND ELEVATED TEMPERATURES
242
RADIĆ, I. & MARKULAK, D. (2007) LATERAL BUCKLING OF CASTELLATED BEAMS. TECHNICAL GAZETTE 14 25-35.
REDWOOD, R. G. & DEMIRDJIAN, S. (1998) Castellated beam web buckling in shear. Journal of Structural Engineering, 124, 1202-1207.
RIKS, E. (1984) Some computational aspects of the stability analysis of nonlinear structures. Computer Methods in Applied Mechanics and Engineering, 47, 219-259.
RWTH (2002) Large web openings for service integration in composite floors. Kaiserslautern, Institute of Steel Construction.
SANTIAGO, A., DA SILVA, L. S., REAL, P. V. & VELJKOVIC, M. (2008) Numerical study of a steel sub-frame in fire. Computers & Structures, 86, 1619-1632.
SCHAFER, B. W. & PEKOZ, T. (1998) Computational modeling of cold-formed steel: Characterizing geometric imperfections and residual stresses. Journal of Constructional Steel Research, 47, 193-210.
SCI (1985), Silwood Park, Ascot, UK, SL5 7QN. SERVICE, P. (2003) Products & Services article: Composite cellular beam-fire
engineering design using intumescent coating. The Structural Engineer. SHERBOURNE, A. N. & OOSTROM, J. V. (1972) Plastic analysis of castellated
beams - Interaction of moment, shear and axial force. Computers & Strucrures, 2, 79-109.
SIMMS, W. I. (2004a) RT1006 - Fire Design of Cellular beams with Slender Web Posts, Ascot, SCI.
SIMMS, W. I. (2004b) RT1025: Evaluation of cellular beam test data at normal temperatures. SCI.
SIMMS, W. I. (2005) Cellbeam fire module technical specification. SCI. SIMMS, W. I. (2007) RT1085- Guidance on the use of intumescent coatings for the
fire protection of beams with web openings, Ascot, SCI. SIMMS, W. I. (2008) Guidance on fire protection of beams with web openings.
RT1187. SCI. SURTEES, J. O. & LI, Z. (1995) Loading tests on cellform beams. Leeds,
University of Leeds. TELFORD, T. (1993) CEB-FIP Model Code 1990- Design Code. VASSART, O., BOUCHER, A., MUZEAU, J.-P. & NADJAI, A. (2008)
ANALYTICAL MODEL FOR THE WEB POST BUCKLING IN CELLULAR BEAMS UNDER FIRE. Proceedings of the Fifth International Conference on Structures in Fire (SiF’08).
WANG, Y. C. (2000) An Analysis of the Global Structural Behaviour of the Cardington Steel-Framed Building during the two BRE fire Tests. . Engineering Structures, 401-412.
WANG, Y. C., YIN, Y. Z., SHEN, Z. Y., LI, G. Q. & CHAN, S. L. (2005) Feasibility of utilising catenary action to eliminate fire protection to steel beams. Fourth International Conference on Advances in Steel Structures. Oxford, Elsevier Science Ltd.
WARD, J. (1990) P100 - Design of composite and non-composite cellular beams, Ascot, SCI.
CELLULAR BEAMS AT AMBIENT AND ELEVATED TEMPERATURES
243
WARREN, J. (2001) Ultimate load and deflection behaviour of cellular beams. School of Civil Engineering. Durban, University of Natal.
WESTOK (1985) Westok Ltd. Hobury Junction Industrial Estate, Horbury Junction, Wakefield, WF4 5ER.
YANDZIO, E., DOWLING, J. J. & NEWMAN, G. M. (1996) P160 - Structural Fire Design: Off-Site Applied Thin Film Intumescent Coatings – Part 1: Design Guidance and Part 2: Model Specification, Steel Construction Institute.
YU, H. X. & LIEW, J. Y. R. (2005) Considering catenary action is designing End-restrained steel beams in fire. Advances in Structural Engineering.
ZAAROUR, W. & REDWOOD, R. G. (1996) Web buckling in thin webbed castellated beams. Journal of Structural Engineering, 860-866.
ZIENKIEWICZ, O. C. & HINTON, E. (1976) Reduced integration, function smoothing and non-conformity in finite element analysis (with special reference to thick plates). Journal of the Franklin Institute, 302, 443-461.

CELLULAR BEAMS AT AMBIENT AND ELEVATED TEMPERATURES
244
Appendix A Some pictures of the tests carried out by the University of Ulster on cellular composite beams
This appendix presents some pictures of the failure of the Ulster beams at ambient
and elevated temperatures.
Figure A.1- Failure of the Ulster Beam A1 at ambient temperature
Figure A.2- Failure of the Ulster Beam B1 at ambient temperature

CELLULAR BEAMS AT AMBIENT AND ELEVATED TEMPERATURES
245
Figure A.3- Failure of the Ulster Beam B1 at ambient temperature
Figure A.4- Failure of the Ulster Beam A2 at elevated temperature

CELLULAR BEAMS AT AMBIENT AND ELEVATED TEMPERATURES
246
Figure A.5- Failure of the Ulster Beam B2 at elevated temperature
Figure A.6- Failure of the Ulster Beam B2 at elevated temperature

CELLULAR BEAMS AT AMBIENT AND ELEVATED TEMPERATURES
247
Figure A.7- Rupture taking place in the test on Beam B3 at elevated temperature within the cooling phase
Figure A.8- The other half of the Beam B3 which did not fail in the fire test

CELLULAR BEAMS AT AMBIENT AND ELEVATED TEMPERATURES
248
Figure A.9- Thermocouples positioned to record temperatures and occurrence of web buckling and rupture

CELLULAR BEAMS AT AMBIENT AND ELEVATED TEMPERATURES
249
Appendix B ABAQUS input file for Beam A1
This appendix includes the input file to produce the numerical model for Beam A1
within ABAQUS at ambient temperature.
*Heading ** Job name: Beam1AAmb Model name: Model-1 *Preprint, echo=NO, model=NO, history=NO, contact=NO ** ** PARTS ** *Part, name=Final *End Part ** ** ** ASSEMBLY ** *Assembly, name=Assembly ** *Instance, name=Final-1, part=Final *Node 1, -2250., 143.100006, 0. ! The rest of the nodes until 2064, -2137.5, 641.200012, -494.179993 *Element, type=S4 1, 1, 190, 1107, 197 ! The rest of the elements until 1880, 2064, 1083, 188, 1084 *Nset, nset=_PickedSet2, internal, generate 1, 2064, 1 *Elset, elset=_PickedSet2, internal, generate 1, 1880, 1 *Nset, nset=_PickedSet3, internal 180, 181, 182, 183, 184, 185, 186, 187, 188, 189, 992, 993, 994, 995, 996, 997 998, 999, 1000, 1001, 1002, 1003, 1004, 1005, 1006, 1007, 1008, 1009, 1010, 1011, 1012, 1013 1014, 1015, 1016, 1017, 1018, 1019, 1020, 1021, 1022, 1023, 1024, 1025, 1026, 1027, 1028, 1029 1030, 1031, 1032, 1033, 1034, 1035, 1036, 1037, 1038, 1039, 1040, 1041, 1042, 1043, 1044, 1045 1046, 1047, 1048, 1049, 1050, 1051, 1052, 1053, 1054, 1055, 1056, 1057, 1058, 1059, 1060, 1061 1062, 1063, 1064, 1065, 1066, 1067, 1068, 1069, 1070, 1071, 1072, 1073, 1074, 1075, 1076, 1077 1078, 1079, 1080, 1081, 1082, 1083, 1084, 1085, 1086, 1087, 1088, 1089, 1090, 1091, 1092, 1093 1094, 1095, 1096, 1097, 1098, 1099, 1100, 1101, 1102, 1103, 1104, 1105, 1106, 1875, 1876, 1877 1878, 1879, 1880, 1881, 1882, 1883, 1884, 1885, 1886, 1887, 1888, 1889, 1890, 1891, 1892, 1893

CELLULAR BEAMS AT AMBIENT AND ELEVATED TEMPERATURES
250
1894, 1895, 1896, 1897, 1898, 1899, 1900, 1901, 1902, 1903, 1904, 1905, 1906, 1907, 1908, 1909 1910, 1911, 1912, 1913, 1914, 1915, 1916, 1917, 1918, 1919, 1920, 1921, 1922, 1923, 1924, 1925 1926, 1927, 1928, 1929, 1930, 1931, 1932, 1933, 1934, 1935, 1936, 1937, 1938, 1939, 1940, 1941 1942, 1943, 1944, 1945, 1946, 1947, 1948, 1949, 1950, 1951, 1952, 1953, 1954, 1955, 1956, 1957 1958, 1959, 1960, 1961, 1962, 1963, 1964, 1965, 1966, 1967, 1968, 1969, 1970, 1971, 1972, 1973 1974, 1975, 1976, 1977, 1978, 1979, 1980, 1981, 1982, 1983, 1984, 1985, 1986, 1987, 1988, 1989 1990, 1991, 1992, 1993, 1994, 1995, 1996, 1997, 1998, 1999, 2000, 2001, 2002, 2003, 2004, 2005 2006, 2007, 2008, 2009, 2010, 2011, 2012, 2013, 2014, 2015, 2016, 2017, 2018, 2019, 2020, 2021 2022, 2023, 2024, 2025, 2026, 2027, 2028, 2029, 2030, 2031, 2032, 2033, 2034, 2035, 2036, 2037 2038, 2039, 2040, 2041, 2042, 2043, 2044, 2045, 2046, 2047, 2048, 2049, 2050, 2051, 2052, 2053 2054, 2055, 2056, 2057, 2058, 2059, 2060, 2061, 2062, 2063, 2064 *Elset, elset=_PickedSet3, internal, generate 1601, 1880, 1 *Nset, nset=_PickedSet4, internal 5, 6, 9, 10, 15, 16, 19, 20, 23, 25, 28, 30, 31, 32, 33, 34 35, 36, 37, 38, 39, 40, 41, 42, 49, 50, 51, 52, 54, 56, 57, 59 60, 62, 63, 64, 65, 66, 67, 68, 71, 73, 74, 75, 76, 81, 82, 83 84, 85, 86, 87, 89, 91, 92, 94, 95, 97, 98, 99, 100, 101, 102, 103 106, 108, 109, 110, 111, 116, 117, 118, 119, 120, 121, 122, 124, 125, 127, 128 130, 131, 132, 133, 134, 137, 139, 140, 141, 142, 145, 146, 147, 148, 150, 151 153, 154, 156, 157, 158, 159, 160, 161, 162, 165, 166, 168, 169, 171, 172, 173 174, 179, 201, 215, 230, 244, 256, 261, 273, 278, 282, 283, 284, 285, 286, 287 288, 289, 290, 291, 292, 293, 294, 295, 296, 297, 298, 299, 300, 301, 302, 303 304, 305, 306, 307, 308, 309, 310, 311, 312, 313, 314, 315, 316, 317, 318, 319 320, 321, 322, 323, 324, 325, 368, 369, 370, 371, 372, 373, 374, 375, 379, 380 381, 388, 389, 390, 391, 392, 396, 397, 398, 405, 406, 407, 408, 409, 410, 411 412, 413, 414, 415, 416, 417, 418, 419, 420, 421, 422, 423, 424, 428, 429, 430 437, 438, 439, 440, 444, 445, 446, 450, 451, 452, 453, 454, 455, 456, 457, 458 459, 460, 461, 492, 493, 494, 495, 496, 497, 498, 499, 503, 504, 505, 506, 507 508, 509, 510, 511, 512, 513, 514, 518, 519, 520, 521, 522, 523, 524, 528, 529
CELLULAR BEAMS AT AMBIENT AND ELEVATED TEMPERATURES
251
530, 531, 532, 533, 534, 535, 539, 540, 541, 548, 549, 550, 551, 552, 556, 557 558, 565, 566, 567, 568, 569, 570, 571, 572, 573, 574, 575, 576, 577, 578, 579 580, 581, 582, 583, 584, 588, 589, 590, 597, 598, 599, 600, 604, 605, 606, 610 611, 612, 613, 614, 615, 616, 617, 618, 619, 620, 621, 652, 653, 654, 655, 656 657, 658, 659, 663, 664, 665, 666, 667, 668, 669, 670, 671, 672, 673, 674, 678 679, 680, 681, 682, 683, 684, 688, 689, 690, 691, 692, 693, 694, 695, 699, 700 701, 705, 706, 707, 708, 709, 713, 714, 715, 722, 723, 724, 725, 726, 727, 728 729, 730, 731, 732, 733, 734, 735, 736, 737, 738, 739, 740, 744, 745, 746, 753 754, 755, 756, 760, 761, 762, 766, 767, 768, 769, 770, 771, 772, 773, 774, 775 776, 777, 802, 803, 804, 805, 806, 807, 811, 812, 813, 814, 815, 816, 817, 818 819, 820, 821, 822, 826, 827, 828, 829, 830, 831, 832, 833, 834, 835, 836, 837 838, 839, 843, 844, 845, 849, 850, 851, 852, 853, 857, 858, 859, 866, 867, 868 869, 870, 871, 872, 873, 874, 875, 876, 877, 878, 879, 880, 881, 882, 883, 884 885, 889, 890, 891, 898, 899, 900, 901, 902, 906, 907, 908, 915, 916, 917, 918 919, 920, 921, 922, 923, 924, 925, 926, 927, 958, 959, 960, 961, 962, 963, 967 968, 969, 970, 971, 972, 976, 977, 978, 979, 980, 981, 982, 986, 987, 988, 989 990, 991, 1155, 1156, 1157, 1158, 1159, 1160, 1161, 1162, 1163, 1164, 1165, 1166, 1167, 1168 1169, 1170, 1171, 1172, 1173, 1174, 1175, 1176, 1177, 1178, 1251, 1252, 1253, 1263, 1264, 1265 1275, 1276, 1277, 1278, 1279, 1280, 1281, 1282, 1283, 1293, 1294, 1295, 1305, 1306, 1307, 1308 1309, 1310, 1347, 1348, 1349, 1350, 1351, 1352, 1362, 1363, 1364, 1365, 1366, 1367, 1377, 1378 1379, 1380, 1381, 1382, 1392, 1393, 1394, 1395, 1396, 1397, 1407, 1408, 1409, 1419, 1420, 1421 1431, 1432, 1433, 1434, 1435, 1436, 1437, 1438, 1439, 1449, 1450, 1451, 1461, 1462, 1463, 1464 1465, 1466, 1503, 1504, 1505, 1506, 1507, 1508, 1518, 1519, 1520, 1521, 1522, 1523, 1533, 1534 1535, 1536, 1537, 1538, 1548, 1549, 1550, 1551, 1552, 1553, 1563, 1564, 1565, 1575, 1576, 1577 1587, 1588, 1589, 1590, 1591, 1592, 1593, 1594, 1595, 1605, 1606, 1607, 1617, 1618, 1619, 1620 1621, 1622, 1659, 1660, 1661, 1662, 1663, 1664, 1674, 1675, 1676, 1677, 1678, 1679, 1689, 1690 1691, 1692, 1693, 1694, 1704, 1705, 1706, 1707, 1708, 1709, 1719, 1720, 1721, 1731, 1732, 1733 1743, 1744, 1745, 1746, 1747, 1748, 1749, 1750, 1751, 1761, 1762, 1763, 1773, 1774, 1775, 1776

CELLULAR BEAMS AT AMBIENT AND ELEVATED TEMPERATURES
252
1777, 1778, 1815, 1816, 1817, 1818, 1819, 1820, 1830, 1831, 1832, 1833, 1834, 1835, 1845, 1846 1847, 1848, 1849, 1850, 1860, 1861, 1862, 1863, 1864, 1865 *Elset, elset=_PickedSet4, internal 129, 130, 131, 132, 133, 134, 135, 136, 137, 138, 139, 140, 141, 142, 143, 144 145, 146, 147, 148, 149, 150, 151, 152, 153, 154, 155, 156, 157, 158, 159, 160 161, 162, 163, 164, 165, 166, 167, 168, 169, 170, 171, 172, 173, 174, 175, 176 177, 178, 179, 180, 181, 182, 183, 184, 185, 186, 187, 188, 189, 190, 191, 192 321, 322, 323, 324, 325, 326, 327, 328, 345, 346, 347, 348, 349, 350, 351, 352 369, 370, 371, 372, 373, 374, 375, 376, 377, 378, 379, 380, 381, 382, 383, 384 385, 386, 387, 388, 389, 390, 391, 392, 409, 410, 411, 412, 413, 414, 415, 416 433, 434, 435, 436, 437, 438, 439, 440, 441, 442, 443, 444, 445, 446, 447, 448 513, 514, 515, 516, 517, 518, 519, 520, 521, 522, 523, 524, 525, 526, 527, 528 545, 546, 547, 548, 549, 550, 551, 552, 553, 554, 555, 556, 557, 558, 559, 560 577, 578, 579, 580, 581, 582, 583, 584, 585, 586, 587, 588, 589, 590, 591, 592 609, 610, 611, 612, 613, 614, 615, 616, 617, 618, 619, 620, 621, 622, 623, 624 641, 642, 643, 644, 645, 646, 647, 648, 665, 666, 667, 668, 669, 670, 671, 672 689, 690, 691, 692, 693, 694, 695, 696, 697, 698, 699, 700, 701, 702, 703, 704 705, 706, 707, 708, 709, 710, 711, 712, 729, 730, 731, 732, 733, 734, 735, 736 753, 754, 755, 756, 757, 758, 759, 760, 761, 762, 763, 764, 765, 766, 767, 768 833, 834, 835, 836, 837, 838, 839, 840, 841, 842, 843, 844, 845, 846, 847, 848 865, 866, 867, 868, 869, 870, 871, 872, 873, 874, 875, 876, 877, 878, 879, 880 897, 898, 899, 900, 901, 902, 903, 904, 905, 906, 907, 908, 909, 910, 911, 912 929, 930, 931, 932, 933, 934, 935, 936, 937, 938, 939, 940, 941, 942, 943, 944 961, 962, 963, 964, 965, 966, 967, 968, 985, 986, 987, 988, 989, 990, 991, 992 1009, 1010, 1011, 1012, 1013, 1014, 1015, 1016, 1017, 1018, 1019, 1020, 1021, 1022, 1023, 1024 1025, 1026, 1027, 1028, 1029, 1030, 1031, 1032, 1049, 1050, 1051, 1052, 1053, 1054, 1055, 1056 1073, 1074, 1075, 1076, 1077, 1078, 1079, 1080, 1081, 1082, 1083, 1084, 1085, 1086, 1087, 1088 1153, 1154, 1155, 1156, 1157, 1158, 1159, 1160, 1161, 1162, 1163, 1164, 1165, 1166, 1167, 1168 1185, 1186, 1187, 1188, 1189, 1190, 1191, 1192, 1193, 1194, 1195, 1196, 1197, 1198, 1199, 1200

CELLULAR BEAMS AT AMBIENT AND ELEVATED TEMPERATURES
253
1217, 1218, 1219, 1220, 1221, 1222, 1223, 1224, 1225, 1226, 1227, 1228, 1229, 1230, 1231, 1232 1249, 1250, 1251, 1252, 1253, 1254, 1255, 1256, 1257, 1258, 1259, 1260, 1261, 1262, 1263, 1264 1281, 1282, 1283, 1284, 1285, 1286, 1287, 1288, 1305, 1306, 1307, 1308, 1309, 1310, 1311, 1312 1329, 1330, 1331, 1332, 1333, 1334, 1335, 1336, 1337, 1338, 1339, 1340, 1341, 1342, 1343, 1344 1345, 1346, 1347, 1348, 1349, 1350, 1351, 1352, 1369, 1370, 1371, 1372, 1373, 1374, 1375, 1376 1393, 1394, 1395, 1396, 1397, 1398, 1399, 1400, 1401, 1402, 1403, 1404, 1405, 1406, 1407, 1408 1473, 1474, 1475, 1476, 1477, 1478, 1479, 1480, 1481, 1482, 1483, 1484, 1485, 1486, 1487, 1488 1505, 1506, 1507, 1508, 1509, 1510, 1511, 1512, 1513, 1514, 1515, 1516, 1517, 1518, 1519, 1520 1537, 1538, 1539, 1540, 1541, 1542, 1543, 1544, 1545, 1546, 1547, 1548, 1549, 1550, 1551, 1552 1569, 1570, 1571, 1572, 1573, 1574, 1575, 1576, 1577, 1578, 1579, 1580, 1581, 1582, 1583, 1584 *Nset, nset=_PickedSet5, internal 1, 2, 3, 4, 5, 6, 7, 8, 9, 10, 11, 12, 13, 14, 15, 16 17, 18, 19, 20, 21, 22, 23, 24, 25, 26, 27, 28, 29, 30, 190, 191 192, 193, 194, 195, 196, 197, 198, 199, 200, 201, 202, 203, 204, 205, 206, 207 208, 209, 210, 211, 212, 213, 214, 215, 216, 217, 218, 219, 220, 221, 222, 223 224, 225, 226, 227, 228, 229, 230, 231, 232, 233, 234, 235, 236, 237, 238, 239 240, 241, 242, 243, 244, 245, 246, 247, 248, 249, 250, 251, 252, 253, 254, 255 256, 257, 258, 259, 260, 261, 262, 263, 264, 265, 266, 267, 268, 269, 270, 271 272, 273, 274, 275, 276, 277, 278, 279, 280, 281, 1107, 1108, 1109, 1110, 1111, 1112 1113, 1114, 1115, 1116, 1117, 1118, 1119, 1120, 1121, 1122, 1123, 1124, 1125, 1126, 1127, 1128 1129, 1130, 1131, 1132, 1133, 1134, 1135, 1136, 1137, 1138, 1139, 1140, 1141, 1142, 1143, 1144 1145, 1146, 1147, 1148, 1149, 1150, 1151, 1152, 1153, 1154 *Elset, elset=_PickedSet5, internal, generate 1, 128, 1 ** Region: (Stiffener:Picked) *Elset, elset=_PickedSet5, internal, generate 1, 128, 1 ** Section: Stiffener *Shell Section, elset=_PickedSet5, material=Web 10., 5 ** Region: (FLANGE:Picked) *Elset, elset=_PickedSet4, internal 129, 130, 131, 132, 133, 134, 135, 136, 137, 138, 139, 140, 141, 142, 143, 144 145, 146, 147, 148, 149, 150, 151, 152, 153, 154, 155, 156, 157, 158, 159, 160
CELLULAR BEAMS AT AMBIENT AND ELEVATED TEMPERATURES
254
161, 162, 163, 164, 165, 166, 167, 168, 169, 170, 171, 172, 173, 174, 175, 176 177, 178, 179, 180, 181, 182, 183, 184, 185, 186, 187, 188, 189, 190, 191, 192 321, 322, 323, 324, 325, 326, 327, 328, 345, 346, 347, 348, 349, 350, 351, 352 369, 370, 371, 372, 373, 374, 375, 376, 377, 378, 379, 380, 381, 382, 383, 384 385, 386, 387, 388, 389, 390, 391, 392, 409, 410, 411, 412, 413, 414, 415, 416 433, 434, 435, 436, 437, 438, 439, 440, 441, 442, 443, 444, 445, 446, 447, 448 513, 514, 515, 516, 517, 518, 519, 520, 521, 522, 523, 524, 525, 526, 527, 528 545, 546, 547, 548, 549, 550, 551, 552, 553, 554, 555, 556, 557, 558, 559, 560 577, 578, 579, 580, 581, 582, 583, 584, 585, 586, 587, 588, 589, 590, 591, 592 609, 610, 611, 612, 613, 614, 615, 616, 617, 618, 619, 620, 621, 622, 623, 624 641, 642, 643, 644, 645, 646, 647, 648, 665, 666, 667, 668, 669, 670, 671, 672 689, 690, 691, 692, 693, 694, 695, 696, 697, 698, 699, 700, 701, 702, 703, 704 705, 706, 707, 708, 709, 710, 711, 712, 729, 730, 731, 732, 733, 734, 735, 736 753, 754, 755, 756, 757, 758, 759, 760, 761, 762, 763, 764, 765, 766, 767, 768 833, 834, 835, 836, 837, 838, 839, 840, 841, 842, 843, 844, 845, 846, 847, 848 865, 866, 867, 868, 869, 870, 871, 872, 873, 874, 875, 876, 877, 878, 879, 880 897, 898, 899, 900, 901, 902, 903, 904, 905, 906, 907, 908, 909, 910, 911, 912 929, 930, 931, 932, 933, 934, 935, 936, 937, 938, 939, 940, 941, 942, 943, 944 961, 962, 963, 964, 965, 966, 967, 968, 985, 986, 987, 988, 989, 990, 991, 992 1009, 1010, 1011, 1012, 1013, 1014, 1015, 1016, 1017, 1018, 1019, 1020, 1021, 1022, 1023, 1024 1025, 1026, 1027, 1028, 1029, 1030, 1031, 1032, 1049, 1050, 1051, 1052, 1053, 1054, 1055, 1056 1073, 1074, 1075, 1076, 1077, 1078, 1079, 1080, 1081, 1082, 1083, 1084, 1085, 1086, 1087, 1088 1153, 1154, 1155, 1156, 1157, 1158, 1159, 1160, 1161, 1162, 1163, 1164, 1165, 1166, 1167, 1168 1185, 1186, 1187, 1188, 1189, 1190, 1191, 1192, 1193, 1194, 1195, 1196, 1197, 1198, 1199, 1200 1217, 1218, 1219, 1220, 1221, 1222, 1223, 1224, 1225, 1226, 1227, 1228, 1229, 1230, 1231, 1232 1249, 1250, 1251, 1252, 1253, 1254, 1255, 1256, 1257, 1258, 1259, 1260, 1261, 1262, 1263, 1264 1281, 1282, 1283, 1284, 1285, 1286, 1287, 1288, 1305, 1306, 1307, 1308, 1309, 1310, 1311, 1312 1329, 1330, 1331, 1332, 1333, 1334, 1335, 1336, 1337, 1338, 1339, 1340, 1341, 1342, 1343, 1344

CELLULAR BEAMS AT AMBIENT AND ELEVATED TEMPERATURES
255
1345, 1346, 1347, 1348, 1349, 1350, 1351, 1352, 1369, 1370, 1371, 1372, 1373, 1374, 1375, 1376 1393, 1394, 1395, 1396, 1397, 1398, 1399, 1400, 1401, 1402, 1403, 1404, 1405, 1406, 1407, 1408 1473, 1474, 1475, 1476, 1477, 1478, 1479, 1480, 1481, 1482, 1483, 1484, 1485, 1486, 1487, 1488 1505, 1506, 1507, 1508, 1509, 1510, 1511, 1512, 1513, 1514, 1515, 1516, 1517, 1518, 1519, 1520 1537, 1538, 1539, 1540, 1541, 1542, 1543, 1544, 1545, 1546, 1547, 1548, 1549, 1550, 1551, 1552 1569, 1570, 1571, 1572, 1573, 1574, 1575, 1576, 1577, 1578, 1579, 1580, 1581, 1582, 1583, 1584 ** Section: FLANGE *Shell Section, elset=_PickedSet4, material=Flange 8.6, 5 ** Region: (WEB:Picked) *Elset, elset=_I3, internal 193, 194, 195, 196, 197, 198, 199, 200, 201, 202, 203, 204, 205, 206, 207, 208 209, 210, 211, 212, 213, 214, 215, 216, 217, 218, 219, 220, 221, 222, 223, 224 225, 226, 227, 228, 229, 230, 231, 232, 233, 234, 235, 236, 237, 238, 239, 240 241, 242, 243, 244, 245, 246, 247, 248, 249, 250, 251, 252, 253, 254, 255, 256 257, 258, 259, 260, 261, 262, 263, 264, 265, 266, 267, 268, 269, 270, 271, 272 273, 274, 275, 276, 277, 278, 279, 280, 281, 282, 283, 284, 285, 286, 287, 288 289, 290, 291, 292, 293, 294, 295, 296, 297, 298, 299, 300, 301, 302, 303, 304 305, 306, 307, 308, 309, 310, 311, 312, 313, 314, 315, 316, 317, 318, 319, 320 329, 330, 331, 332, 333, 334, 335, 336, 337, 338, 339, 340, 341, 342, 343, 344 353, 354, 355, 356, 357, 358, 359, 360, 361, 362, 363, 364, 365, 366, 367, 368 393, 394, 395, 396, 397, 398, 399, 400, 401, 402, 403, 404, 405, 406, 407, 408 417, 418, 419, 420, 421, 422, 423, 424, 425, 426, 427, 428, 429, 430, 431, 432 449, 450, 451, 452, 453, 454, 455, 456, 457, 458, 459, 460, 461, 462, 463, 464 465, 466, 467, 468, 469, 470, 471, 472, 473, 474, 475, 476, 477, 478, 479, 480 481, 482, 483, 484, 485, 486, 487, 488, 489, 490, 491, 492, 493, 494, 495, 496 497, 498, 499, 500, 501, 502, 503, 504, 505, 506, 507, 508, 509, 510, 511, 512 529, 530, 531, 532, 533, 534, 535, 536, 537, 538, 539, 540, 541, 542, 543, 544 561, 562, 563, 564, 565, 566, 567, 568, 569, 570, 571, 572, 573, 574, 575, 576 593, 594, 595, 596, 597, 598, 599, 600, 601, 602, 603, 604, 605, 606, 607, 608 625, 626, 627, 628, 629, 630, 631, 632, 633, 634, 635, 636, 637, 638, 639, 640

CELLULAR BEAMS AT AMBIENT AND ELEVATED TEMPERATURES
256
649, 650, 651, 652, 653, 654, 655, 656, 657, 658, 659, 660, 661, 662, 663, 664 673, 674, 675, 676, 677, 678, 679, 680, 681, 682, 683, 684, 685, 686, 687, 688 713, 714, 715, 716, 717, 718, 719, 720, 721, 722, 723, 724, 725, 726, 727, 728 737, 738, 739, 740, 741, 742, 743, 744, 745, 746, 747, 748, 749, 750, 751, 752 769, 770, 771, 772, 773, 774, 775, 776, 777, 778, 779, 780, 781, 782, 783, 784 785, 786, 787, 788, 789, 790, 791, 792, 793, 794, 795, 796, 797, 798, 799, 800 801, 802, 803, 804, 805, 806, 807, 808, 809, 810, 811, 812, 813, 814, 815, 816 817, 818, 819, 820, 821, 822, 823, 824, 825, 826, 827, 828, 829, 830, 831, 832 849, 850, 851, 852, 853, 854, 855, 856, 857, 858, 859, 860, 861, 862, 863, 864 881, 882, 883, 884, 885, 886, 887, 888, 889, 890, 891, 892, 893, 894, 895, 896 913, 914, 915, 916, 917, 918, 919, 920, 921, 922, 923, 924, 925, 926, 927, 928 945, 946, 947, 948, 949, 950, 951, 952, 953, 954, 955, 956, 957, 958, 959, 960 969, 970, 971, 972, 973, 974, 975, 976, 977, 978, 979, 980, 981, 982, 983, 984 993, 994, 995, 996, 997, 998, 999, 1000, 1001, 1002, 1003, 1004, 1005, 1006, 1007, 1008 1033, 1034, 1035, 1036, 1037, 1038, 1039, 1040, 1041, 1042, 1043, 1044, 1045, 1046, 1047, 1048 1057, 1058, 1059, 1060, 1061, 1062, 1063, 1064, 1065, 1066, 1067, 1068, 1069, 1070, 1071, 1072 1089, 1090, 1091, 1092, 1093, 1094, 1095, 1096, 1097, 1098, 1099, 1100, 1101, 1102, 1103, 1104 1105, 1106, 1107, 1108, 1109, 1110, 1111, 1112, 1113, 1114, 1115, 1116, 1117, 1118, 1119, 1120 1121, 1122, 1123, 1124, 1125, 1126, 1127, 1128, 1129, 1130, 1131, 1132, 1133, 1134, 1135, 1136 1137, 1138, 1139, 1140, 1141, 1142, 1143, 1144, 1145, 1146, 1147, 1148, 1149, 1150, 1151, 1152 1169, 1170, 1171, 1172, 1173, 1174, 1175, 1176, 1177, 1178, 1179, 1180, 1181, 1182, 1183, 1184 1201, 1202, 1203, 1204, 1205, 1206, 1207, 1208, 1209, 1210, 1211, 1212, 1213, 1214, 1215, 1216 1233, 1234, 1235, 1236, 1237, 1238, 1239, 1240, 1241, 1242, 1243, 1244, 1245, 1246, 1247, 1248 1265, 1266, 1267, 1268, 1269, 1270, 1271, 1272, 1273, 1274, 1275, 1276, 1277, 1278, 1279, 1280 1289, 1290, 1291, 1292, 1293, 1294, 1295, 1296, 1297, 1298, 1299, 1300, 1301, 1302, 1303, 1304 1313, 1314, 1315, 1316, 1317, 1318, 1319, 1320, 1321, 1322, 1323, 1324, 1325, 1326, 1327, 1328 1353, 1354, 1355, 1356, 1357, 1358, 1359, 1360, 1361, 1362, 1363, 1364, 1365, 1366, 1367, 1368 1377, 1378, 1379, 1380, 1381, 1382, 1383, 1384, 1385, 1386, 1387, 1388, 1389, 1390, 1391, 1392

CELLULAR BEAMS AT AMBIENT AND ELEVATED TEMPERATURES
257
1409, 1410, 1411, 1412, 1413, 1414, 1415, 1416, 1417, 1418, 1419, 1420, 1421, 1422, 1423, 1424 1425, 1426, 1427, 1428, 1429, 1430, 1431, 1432, 1433, 1434, 1435, 1436, 1437, 1438, 1439, 1440 1441, 1442, 1443, 1444, 1445, 1446, 1447, 1448, 1449, 1450, 1451, 1452, 1453, 1454, 1455, 1456 1457, 1458, 1459, 1460, 1461, 1462, 1463, 1464, 1465, 1466, 1467, 1468, 1469, 1470, 1471, 1472 1489, 1490, 1491, 1492, 1493, 1494, 1495, 1496, 1497, 1498, 1499, 1500, 1501, 1502, 1503, 1504 1521, 1522, 1523, 1524, 1525, 1526, 1527, 1528, 1529, 1530, 1531, 1532, 1533, 1534, 1535, 1536 1553, 1554, 1555, 1556, 1557, 1558, 1559, 1560, 1561, 1562, 1563, 1564, 1565, 1566, 1567, 1568 1585, 1586, 1587, 1588, 1589, 1590, 1591, 1592, 1593, 1594, 1595, 1596, 1597, 1598, 1599, 1600 ** Section: WEB *Shell Section, elset=_I3, material=Web 6.4, 5 ** Region: (CONCRETE:Picked) *Elset, elset=_PickedSet3, internal, generate 1601, 1880, 1 ** Section: CONCRETE *Shell Section, elset=_PickedSet3, material=Concrete 150., 5 *Rebar Layer BAR1, 28.27, 200., -40., Reineforcement, 90., 1 BAR2, 28.27, 200., -40., Reineforcement, 0., 1 *End Instance ** *Nset, nset=_PickedSet119, internal, instance=Final-1 161, 169, 170, 175, 178, 181, 182, 185, 186, 189, 909, 910, 911, 928, 929, 930 955, 956, 957, 973, 974, 975, 1011, 1051, 1052, 1053, 1054, 1079, 1103, 1104, 1105, 1106 *Elset, elset=_PickedSet119, internal, instance=Final-1 1389, 1390, 1391, 1392, 1412, 1416, 1420, 1424, 1457, 1461, 1465, 1469, 1533, 1534, 1535, 1536 1620, 1640, 1660, 1680, 1700, 1720, 1740, 1741, 1761, 1781, 1801, 1821, 1841, 1861 *Nset, nset=_PickedSet120, internal, instance=Final-1 5, 6, 28, 201, 273 *Elset, elset=_PickedSet120, internal, instance=Final-1 15, 16, 111, 112 *Nset, nset=_PickedSet123, internal, instance=Final-1, generate 186, 189, 1 *Nset, nset=_PickedSet127, internal, instance=Final-1 20, *Elset, elset=__PickedSurf115_E3, internal, instance=Final-1 63, 64, 95, 96 *Surface, type=ELEMENT, name=_PickedSurf115, internal __PickedSurf115_E3, E3 *Elset, elset=__PickedSurf116_E3, internal, instance=Final-1 63, 64 *Surface, type=ELEMENT, name=_PickedSurf116, internal __PickedSurf116_E3, E3 *Elset, elset=__PickedSurf124_SPOS, internal, instance=Final-1

CELLULAR BEAMS AT AMBIENT AND ELEVATED TEMPERATURES
258
1601, 1602, 1603, 1604, 1605, 1606, 1607, 1608, 1609, 1610, 1611, 1612, 1613, 1614, 1615, 1616 1617, 1618, 1619, 1620, 1621, 1622, 1623, 1624, 1625, 1626, 1627, 1628, 1629, 1630, 1631, 1632 1633, 1634, 1635, 1636, 1637, 1638, 1639, 1640, 1741, 1742, 1743, 1744, 1745, 1746, 1747, 1748 1749, 1750, 1751, 1752, 1753, 1754, 1755, 1756, 1757, 1758, 1759, 1760, 1761, 1762, 1763, 1764 1765, 1766, 1767, 1768, 1769, 1770, 1771, 1772, 1773, 1774, 1775, 1776, 1777, 1778, 1779, 1780 *Surface, type=ELEMENT, name=_PickedSurf124, internal __PickedSurf124_SPOS, SPOS *Elset, elset=__PickedSurf126_E3, internal, instance=Final-1 95, 96 *Surface, type=ELEMENT, name=_PickedSurf126, internal __PickedSurf126_E3, E3 *Elset, elset=__PickedSurf130_E3, internal, instance=Final-1 63, 64 *Surface, type=ELEMENT, name=_PickedSurf130, internal __PickedSurf130_E3, E3 *Elset, elset=__PickedSurf135_SPOS, internal, instance=Final-1 161, 162, 163, 164, 165, 166, 167, 168, 185, 186, 187, 188, 189, 190, 191, 192 321, 322, 323, 324, 325, 326, 327, 328, 345, 346, 347, 348, 349, 350, 351, 352 385, 386, 387, 388, 389, 390, 391, 392, 409, 410, 411, 412, 413, 414, 415, 416 513, 514, 515, 516, 517, 518, 519, 520, 521, 522, 523, 524, 525, 526, 527, 528 545, 546, 547, 548, 549, 550, 551, 552, 553, 554, 555, 556, 557, 558, 559, 560 641, 642, 643, 644, 645, 646, 647, 648, 665, 666, 667, 668, 669, 670, 671, 672 705, 706, 707, 708, 709, 710, 711, 712, 729, 730, 731, 732, 733, 734, 735, 736 833, 834, 835, 836, 837, 838, 839, 840, 841, 842, 843, 844, 845, 846, 847, 848 865, 866, 867, 868, 869, 870, 871, 872, 873, 874, 875, 876, 877, 878, 879, 880 961, 962, 963, 964, 965, 966, 967, 968, 985, 986, 987, 988, 989, 990, 991, 992 1025, 1026, 1027, 1028, 1029, 1030, 1031, 1032, 1049, 1050, 1051, 1052, 1053, 1054, 1055, 1056 1153, 1154, 1155, 1156, 1157, 1158, 1159, 1160, 1161, 1162, 1163, 1164, 1165, 1166, 1167, 1168 1185, 1186, 1187, 1188, 1189, 1190, 1191, 1192, 1193, 1194, 1195, 1196, 1197, 1198, 1199, 1200 1281, 1282, 1283, 1284, 1285, 1286, 1287, 1288, 1305, 1306, 1307, 1308, 1309, 1310, 1311, 1312 1345, 1346, 1347, 1348, 1349, 1350, 1351, 1352, 1369, 1370, 1371, 1372, 1373, 1374, 1375, 1376 1473, 1474, 1475, 1476, 1477, 1478, 1479, 1480, 1481, 1482, 1483, 1484, 1485, 1486, 1487, 1488 1505, 1506, 1507, 1508, 1509, 1510, 1511, 1512, 1513, 1514, 1515, 1516, 1517, 1518, 1519, 1520 *Surface, type=ELEMENT, name=_PickedSurf135, internal __PickedSurf135_SPOS, SPOS

CELLULAR BEAMS AT AMBIENT AND ELEVATED TEMPERATURES
259
** Constraint: Constraint-1 *Tie, name=Constraint-1, adjust=yes _PickedSurf135, _PickedSurf124 *End Assembly *Imperfection, file=beam1abuckle , step=1 1, 1 ** ** MATERIALS ** *Material, name=Concrete *Concrete 0.1, 0. 4.199, 0.0002 7.34, 0.00035 10.458, 0.0005 13.531, 0.00065 16.529, 0.0008 19.417, 0.00095 22.156, 0.0011 24.706, 0.00125 27.027, 0.0014 29.084, 0.00155 30.85, 0.0017 32.305, 0.00185 33.439, 0.002 34.256, 0.00215 34.765, 0.0023 35., 0.0025 0., 0.02 *Failure Ratios 1.16, 0.2, 1.28, 0.3333 *Tension Stiffening 1., 0. 0., 0.004 *Density 2.3544e-05, *Elastic 20000., 0.2 *Material, name=Flange *Density 7.7e-05, *Elastic 210000., 0.3 *Plastic 265.2, 0. 305.177, 0.000637143 323.268, 0.00123714 334.889, 0.00173714 379.95, 0.00473714 406.751, 0.00773714 424.281, 0.0107371 435.288, 0.0137371 440.942, 0.0167371 442., 0.0187371 442., 0.0287371 442., 0.0487371 442., 0.0687371

CELLULAR BEAMS AT AMBIENT AND ELEVATED TEMPERATURES
260
442., 0.0887371 442., 0.108737 442., 0.128737 442., 0.148737 353.6, 0.158737 265.2, 0.168737 176.8, 0.178737 88.4, 0.188737 0.001, 0.198737 *Material, name=Reinforcement *Elastic 210000., 0.3 *Plastic 265.2, 0. 305.177, 0.000637143 323.268, 0.00123714 334.889, 0.00173714 379.95, 0.00473714 406.751, 0.00773714 424.281, 0.0107371 435.288, 0.0137371 440.942, 0.0167371 442., 0.0187371 442., 0.0287371 442., 0.0487371 442., 0.0687371 442., 0.0887371 442., 0.108737 442., 0.128737 442., 0.148737 353.6, 0.158737 265.2, 0.168737 176.8, 0.178737 88.4, 0.188737 0.001, 0.198737 *Material, name=Web *Density 7.70085e-05, *Elastic 210000., 0.3 *Plastic 265.2, 0. 305.177, 0.000637143 323.268, 0.00123714 334.889, 0.00173714 379.95, 0.00473714 406.751, 0.00773714 424.281, 0.0107371 435.288, 0.0137371 440.942, 0.0167371 442., 0.0187371 442., 0.0287371 442., 0.0487371 442., 0.0687371 442., 0.0887371 442., 0.108737 442., 0.128737

CELLULAR BEAMS AT AMBIENT AND ELEVATED TEMPERATURES
261
442., 0.148737 353.6, 0.158737 265.2, 0.168737 176.8, 0.178737 88.4, 0.188737 0.001, 0.198737 ** ---------------------------------------------------------------- ** ** STEP: Step-1 ** *Step, name=Step-1, nlgeom=YES, inc=1000 *Static, riks 5., 20., 0.0002, , , ** ** BOUNDARY CONDITIONS ** ** Name: BC-1 Type: Symmetry/Antisymmetry/Encastre *Boundary _PickedSet119, XSYMM ** Name: BC-2 Type: Displacement/Rotation *Boundary _PickedSet120, 2, 2 _PickedSet120, 3, 3 ** Name: BC-3 Type: Displacement/Rotation *Boundary _PickedSet123, 3, 3 ** ** LOADS ** ** Name: Load-1 Type: Concentrated force *Cload _PickedSet127, 2, -500. ** ** OUTPUT REQUESTS ** *Restart, write, frequency=0 ** ** FIELD OUTPUT: F-Output-1 ** *Output, field, variable=PRESELECT ** ** HISTORY OUTPUT: H-Output-2 ** *Output, history, variable=PRESELECT *End Step