Embed Size (px)
Citation preview
Policy ReseaRch WoRking PaPeR 4506
Measuring the Performance and Achievement of Social Objectives of Development Finance Institutions
Manuela FranciscoYira Mascaró
Juan Carlos MendozaJacob Yaron
The World BankLatin America and the Caribbean RegionPoverty Reduction and Economic Management DepartmentFebruary 2008
WPS4506P
ublic
Dis
clos
ure
Aut
horiz
edP
ublic
Dis
clos
ure
Aut
horiz
edP
ublic
Dis
clos
ure
Aut
horiz
edP
ublic
Dis
clos
ure
Aut
horiz
edP
ublic
Dis
clos
ure
Aut
horiz
edP
ublic
Dis
clos
ure
Aut
horiz
edP
ublic
Dis
clos
ure
Aut
horiz
edP
ublic
Dis
clos
ure
Aut
horiz
ed
Produced by the Research Support Team
Abstract
The Policy Research Working Paper Series disseminates the findings of work in progress to encourage the exchange of ideas about development issues. An objective of the series is to get the findings out quickly, even if the presentations are less than fully polished. The papers carry the names of the authors and should be cited accordingly. The findings, interpretations, and conclusions expressed in this paper are entirely those of the authors. They do not necessarily represent the views of the International Bank for Reconstruction and Development/World Bank and its affiliated organizations, or those of the Executive Directors of the World Bank or the governments they represent.
Policy ReseaRch WoRking PaPeR 4506
This paper develops and tests a proposed methodology that puts forward a new integrated method for evaluating the performance of development finance institutions. This methodology applies assessment criteria that take into account both the social objective that the development finance institution addresses and the subsidies it received in order to achieve such an objective. This methodology is applied to two pilot case studies—Banadesa (Honduras) and Banrural (Guatemala). The authors calculate the previously tested subsidy dependence index, which measures the degree of an institution’s subsidy dependence. The paper develops and estimates a new measure—the output index— which
This paper—Finance and Private Sector Unit, Poverty Reduction and Economic Management Department in Latin America and the Caribbean Region—is part of a larger effort in the department to contribute to research, disseminate knowledge, and provide policy options to client countries on financial sector development. Policy Research Working Papers are also posted on the Web at http://econ.worldbank.org. The author may be contacted at ymascaro @worldbank.org.
indicates the level to which the institution fulfills the social objectives of the state. The analysis integrates the subsidy dependence index and the output index to assess the effectiveness associated with meeting the social objective. The findings suggest that the integration of the two indexes can constitute the basis of a meaningful evaluation framework for the performance of development finance institutions. This new methodology can also be a useful metric for policy makers who are seeking to decide on an optimal allocation of scarce funds for development finance institutions that pursue social goals and for management that seeks improved performance outcomes.
Measuring the Performance and Achievement of Social Objectives
of Development Finance Institutions
Manuela Francisco, Yira Mascaró, Juan Carlos Mendoza, and Jacob Yaron1
Key Words: Metrics, Performance, State-Owned Banks
JEL: G21, H23
The views expressed in this working paper are those of the authors and do not necessarily represent those of the World Bank or World Bank policy.
1 The authors are thankful for earlier inputs by Ilias Skamnelos, Radwa El-Swaify, and, more recently, Marco Arena. Also, this document benefits from useful comments from participants to the presentation to LCSFF and from peer reviewers.
1. Introduction During the 1960s and 1970s, development finance institutions (DFIs) proliferated around the world as financial intermediaries that aimed to improve social welfare. Those institutions2 had been established and financially supported by governments and donors. Their intent was to serve underprivileged segments of the population and economic sectors that had an unmet demand for credit, thus operating under the rationale that improving access to financial services is critical for economic growth. To the extent that DFIs act as the government’s means to promote its social objectives, they seek to serve those segments that—as a consequence of their location, risk, poor and volatile income, or information opacity (all of which are associated with substantial transaction costs and information asymmetry problems)—are typically not financially attractive to private banks.
The reliance on DFIs to ensure that priority sectors and underprivileged clientele were provided with financial services, particularly credit, was the dominant practice in the development finance paradigm until the start of the 1990s. According to Yaron (2006), DFIs were considered essential to finance economically “warranted” operations that were not financially attractive to financial institutions (FIs) that are private and for-profit.
In the 1990s, as a consequence of growing concerns regarding the DFIs’ poor performance (in terms of efficiency, profitability, and achievement of their social objectives) and as a result of the ensuing doubts regarding the justification for the DFIs’ mere existence, a wave of privatizations, liquidations, reduction of resources available to DFIs, and efforts to improve governance and supervision of the remaining DFIs3 took place. Yet, in 2002, there were 80 DFIs in Latin America and the Caribbean (LAC), with Brazil having the largest number (11), followed by Argentina (9) (ALIDE 2002).4
As DFIs continue to have a substantial share of the financial sector assets in the region, it is very important to assess their performance. This assessment is relevant regardless of whether governments should be direct providers of financial services, which is a discussion beyond the scope of this paper, yet is briefly summarized herein. Therefore, policy makers and bank managers need assessment criteria and metrics that help them to establish performance indicators that guide both day-to-day management and broader strategic decisions.
DFIs are financial institutions that benefit from (typically) concessionary financial resources and aim to improve social welfare. In this paper, we focus only on DFIs that have a large share of government ownership. However, irrespective of the ownership of the FI, the methodology offered can be used for institutions that benefit from concessionary financial
2 For the purposes of this paper, the focus is on DFIs with a substantial share of government ownership and that benefit from concessionary resources. 3 However, the introduction of governance and supervision that are subject to private regulatory standards may force DFIs to deviate from their social mandate, thereby leading them to mimic private banks in their allocation criteria and to generate mission diversion. This has been called the Sisyphus syndrome, following De la Torre (2002). 4 See Annex 1 for a summary of the key characteristics of DFIs in LAC.
2
resources to deliver financial products to a government’s chosen target clientele that would otherwise not have access to such services.
The clients that the DFI serves (or claims to serve) are usually underprivileged clients, sectors, or regions. The concessionary financial resources that are usually made available to DFIs vary and include, among others, cheap borrowing, under-priced guarantees, exemption from reserve requirements and taxes, coverage by the government of partial or all operational costs, loan losses, and the transfer of funds to create a capital endowment.
The paper does not cover government-owned commercial banks that neither serve nor claim to serve any underprivileged segment of the population or an economic “priority” sector (that is, government-owned banks that in their strategy and operations are indistinguishable from private banks, such as Banco Costa Rica). For this category of purely state-owned FIs, the subsidy dependence index (SDI) might be an adequate tool for evaluating their performance, particularly if their profitability—despite of their commercial orientation—is lower than the profitability of private, profit-maximizing banks that serve (or could serve) the same clientele, or if the profitability of state-owned FIs is lower than the opportunity cost of the government’s funds. However, using the output index (OI) for these commercial banks would not add any important relevant information because they lack a “social” mission.
In most cases, public funds entrusted to DFIs are subsidized by definition. The unfettered market would have charged higher rates. If public funds were not subsidized, the DFI would refuse the funds and go to the market on its own. Likewise, a DFI subsidizes its clients, who would not demand DFI’s services if they were costlier than identical services from a for-profit FI. Some exceptions exist. By law, certain DFIs have been recently prohibited from seeking funding directly in the financial markets and thus, must rely on public funds (for example, Finrural in Mexico). Clients may be required to use public banks to get another benefit (for example, farmers may be required to use a public agricultural bank to be eligible for technical assistance). In fact, particularly in rural areas, DFI financing could be the only option available.
DFIs that serve social objectives or that claim to do so will usually differ substantially with respect to their cost structure, cost-effectiveness, clientele served, loan losses, and other important efficiency and profitability factors. However, all of them can benefit from introducing the OI and the SDI when evaluating and measuring their performance. According to the Inter-American Development Bank (1994), “Measurement forces DFIs and their sponsors to discuss their goals. Foggy goals wither under attempts at measurement. Buzzwords lose punch unless grounded in the nuts-and-bolts problems of measurement.”
In response to the need for assessing DFI performance, a growing body of literature has emerged during the past two decades. However, most studies that aimed to evaluate DFIs’ performance have relied, for instance, on traditional accounting profitability measurements such as return on assets (ROA) or return on equity (ROE), which are not adequate to assess DFIs’ performance because they disregard DFIs that seek to maximize a social objective and that often benefit from large subsidies. The literature that has analyzed whether DFIs fulfill their social objectives consists mostly of cross-country analyses of aggregated data with a focus on macroeconomic variables. These analyses have the limitation of ignoring important
3
outcomes due to the heterogeneity across and within countries. Thus, they fail to evaluate whether DFIs or governments achieve their various and diversified social objectives.
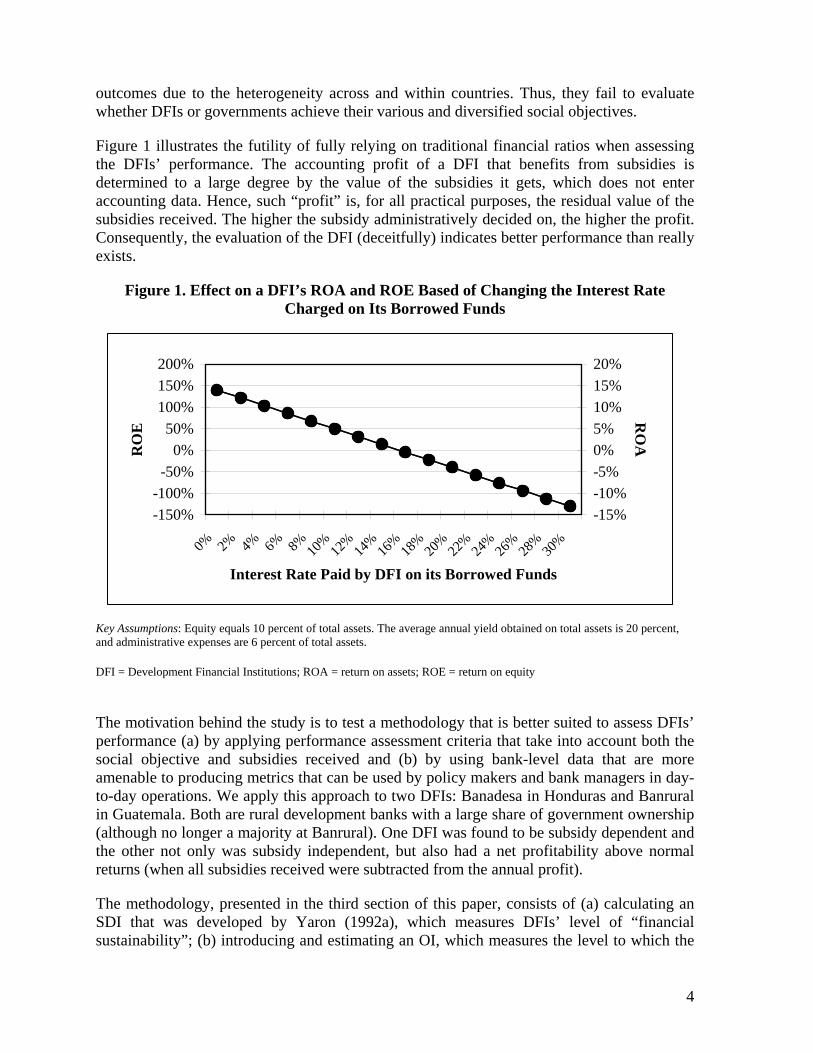
Figure 1 illustrates the futility of fully relying on traditional financial ratios when assessing the DFIs’ performance. The accounting profit of a DFI that benefits from subsidies is determined to a large degree by the value of the subsidies it gets, which does not enter accounting data. Hence, such “profit” is, for all practical purposes, the residual value of the subsidies received. The higher the subsidy administratively decided on, the higher the profit. Consequently, the evaluation of the DFI (deceitfully) indicates better performance than really exists.
Figure 1. Effect on a DFI’s ROA and ROE Based of Changing the Interest Rate Charged on Its Borrowed Funds
-150%-100%
-50%0%
50%100%150%200%
0% 2% 4% 6% 8% 10%
12%
14%
16%
18%
20%
22%
24%
26%
28%
30%
Interest Rate Paid by DFI on its Borrowed Funds
RO
E
-15%-10%-5%0%5%10%15%20%
RO
A
Key Assumptions: Equity equals 10 percent of total assets. The average annual yield obtained on total assets is 20 percent, and administrative expenses are 6 percent of total assets.
DFI = Development Financial Institutions; ROA = return on assets; ROE = return on equity
The motivation behind the study is to test a methodology that is better suited to assess DFIs’ performance (a) by applying performance assessment criteria that take into account both the social objective and subsidies received and (b) by using bank-level data that are more amenable to producing metrics that can be used by policy makers and bank managers in day-to-day operations. We apply this approach to two DFIs: Banadesa in Honduras and Banrural in Guatemala. Both are rural development banks with a large share of government ownership (although no longer a majority at Banrural). One DFI was found to be subsidy dependent and the other not only was subsidy independent, but also had a net profitability above normal returns (when all subsidies received were subtracted from the annual profit).
The methodology, presented in the third section of this paper, consists of (a) calculating an SDI that was developed by Yaron (1992a), which measures DFIs’ level of “financial sustainability”; (b) introducing and estimating an OI, which measures the level to which the
4
social objective of the government is fulfilled by the DFI; and (c) integrating both indices to assess the related cost-effectiveness of the DFI with respect to the subsidies received and the achievement of social goals assigned to the DFI.
On the basis of the case studies prepared, our main conclusion is that the SDI and the OI proved to be meaningful performance assessments of DFIs and can provide useful information even in poor data environments. The SDI can provide a measure of the financial costs to society of DFI activities and can be a quantifiable parameter that indicates the degree of subsidy dependence. The OI can help DFIs undertake a cost-effectiveness analysis of their activities by measuring the degree of fulfillment of their social objectives. In an appropriate data environment to which most DFIs currently aspire, these metrics can be used to assess performance at the business unit, product, or branch level.
Obviously, the use of the OI and the SDI should be only the start of the performance analysis that is suitable for development banks; not the end. Banks should follow quantified findings of subsidy dependence by computing the SDI through analyzing the factors (components) that contribute to subsidy dependence, such as excessive loan losses, high transaction cost per unit of outstanding loan, and the like. It is necessary for benchmarks to be established for each of these factors. This analysis will be more meaningful when reference data of other DFIs and FIs that serve similar clientele become available to use as benchmarks. Similarly, development banks should follow an OI calculation by analyzing the obstacles to achieving the DFI’s objectives. Sensitivity analysis of reducing or increasing cost factors and their expected effect on the SDI and the OI should be considered as essential managerial tools.
For policy makers at the government level and for donors, this approach provides answers to basic questions such as the following: “What are the revenue, costs, and subsidy per financial product rendered to different income groups’ borrowers?” Such basic information can contribute substantially to improving resource allocation and to optimizing the use of subsidies. Presently, the decision makers possess little knowledge of the outcomes regarding the overall performance of the DFI involved.
The paper is structured as follows. The next section provides a brief literature review, the third section describes the methodology, the fourth section applies the methodology to the case studies, and the fifth section presents the conclusions.
2. Literature Review
Debate about State-Owned Banks The debate concerning the role of state-owned banks is framed along four main theories: development, social, agency, and political. Although the development and social views are supportive of state-owned banks, the political view argues against state ownership. The agency view falls between the social development and social views supporting state ownership of banks and the political view that is skeptical of state ownership.
During the 1950s and 1960s, a number of development economists—most notably Gerschenkron (1962), Myrdal (1960), and Lewis (1955)—advocated government ownership of banks as part of a broader sentiment that defended public ownership of strategic economic sectors. This stream of thought, often called the development view, stresses the need for
5
public intervention in economies where the scarcity of capital, public mistrust, and extensive fraudulent practices among debtors would discourage long-term credit, thus affecting the economic growth prospective. This dominant thinking brought about a proliferation of DFIs around the world, including LAC, with various purposes such as ensuring a credit supply to priority sectors as part of a broader industrial development strategy, or as in the case of rural banks, promoting food self-sufficiency arguments.
More recently, the social view—prominently defended by Atkinson and Stiglitz (1980)—argues that the existence of market failures in the financial market justifies creating and supporting DFIs. According to this view, since an expansion of financial services supports economic growth, DFIs should be created to address prevailing market failures and reach underserved segments. The social view states that market failures occur because private banks maximize profit, thus having either low or no interest in offering services to low-income individuals, remote communities (where it is not profitable to open branches), or more generally, in financing unprofitable projects with positive social externalities.
Moreover, private banks may have low incentives to lend to small businesses that lack traditional collateral or are too risky, such as agriculture5, because the costs of administering and monitoring those loans are high and because default rates are substantial.6 Therefore, both the development and social views ultimately argued for an interventionist role of the state in the financial sector. However, the role was intended to be temporary, which would be similar to the well-known “infant-industry” argument for intervention in other sectors.
The lack of evidence that DFIs were effectively fulfilling their social objective supported the argument that banks were not necessarily different from other businesses and that the case for financial market imperfection was overstated. Thus, market failures could be better addressed with regulations and subsidies to for-profit private financial institutions that would serve the target clientele, rather than with direct state ownership of banks. This line of reasoning led to a paradigm shift toward a more laissez-faire stance, which argued for limiting or eliminating the role of the government in the direct provision of financial services. Instead, according to this new view, the state’s efforts should concentrate on developing an adequate enabling environment,7 in which private financial institutions can thrive. This approach motivated a wave of privatizations, limitation of activities (primarily the shift from direct lending to beneficiaries to second tier banking), and liquidation of DFIs around the world. As a result, at least 250 financial institutions were privatized between 1987 and 2003.
In this context, the political view argues that DFIs were not created to channel funds to unserved and socially desirable projects, but rather to pursue the individual goals of
5 Many public banks in Latin America focus on specific sectors, such as agriculture, at least in their design. 6 Theoretically, public banks could have fewer principal-agent problems and lower transaction costs compared to private banks, because it might be easier for them to have access to information and to exploit economies of scale (Stiglitz 1994). In financial markets, when information is available, it is incomplete and subject to asymmetries between suppliers and users. Because of the “public good” nature of information, banks have difficulty appropriating returns from information; thus private banks have little incentive to incur transaction costs in acquiring information. 7 The enabling environment includes enhancing creditor and shareholder rights, upgrading prudential regulation, modernizing accounting practices, and promoting more reliable systems of information on debtors (De la Torre 2005).
6
politicians (Shleifer and Vishny 1994; La Porta, López-de-Silanes, and Shleifer 2002). A somewhat in-between argument is found in the agency view, which recognizes that DFIs can be important means to pursue the government’s social mandates. Such means can fulfill social policies through the selective allocation of credit (De la Torre 2005).8 However, the agency view also considers that DFIs are prone to generate corruption and misallocation (Banerjee 1997) and that agency costs within government bureaucracies can result in weak managerial practices.
Assessment of DFI Performance The need to assess DFIs’ role has led to an evaluation of their financial performance and of the fulfillment of their social objective. This need emerged because of a growing concern that the subsidies provided to DFIs were being misused, given the small amount of evidence that those institutions were serving their clientele as expected. Also, worrisome trends emerged regarding their financial performance, as evidenced by their mounting losses, poor loan recovery, and continued dependence on subsidies for operational purposes.
Recent studies have corroborated that DFIs have not mitigated market failures but have actually led to inefficient allocation of resources. Furthermore, a number of studies found little evidence that state ownership of banks promotes economic growth (La Porta, López-de-Silanes, and Shleifer 2002; Levy-Yeyati, Micco, and Panizza 2004) or financial depth (Barth et al. 2001) views argued by proponents of creating DFIs.
In addition, distorting effects on the allocation of financial resources were found, for example, in Italy (Sapienza 2004) and in Brazil (Kumar and Francisco 2005).9 Both studies show that public banks not only do not lend more to small firms than private banks do, but they actually favor large firms. Moreover, Galindo and Micco (2003) report that public banks do not differ from private banks regarding the provision of credit to firms lacking collateral. Other studies, however, point out some success stories such as the Village Bank system of Bank Rayat in Indonesia (Charitonenko, Benjamin, and Yaron 1998) or the Bank for Agriculture and Agricultural Cooperatives in Thailand (Townsend and Yaron 2001).10
Regarding the assessment of DFIs’ “accounting profitability” performance, most of the studies use standard indicators of bank profitability such as return on assets (ROA), return on equity (ROE), interest margins, and nonperforming loan ratios. DFIs are generally found to perform worse in terms of standard financial accounting ratios than private banks (Micco,
8 The description of the alternative views concerning the role of state-owned banks presented earlier is broadly in line with De la Torre (2005), which categorizes the government’s role in reducing the problem of access (that is, unmet demand, rather than lack of use of financial services) into three views: (a) the traditional bi-polar stance, (b) the interventionist, and (c) the laissez-faire, plus a more recent pro-market view, which favors direct government interventions in nontraditional and market friendly ways. 9An illustration of this phenomenon can be found in Brazil’s political economy, which years ago, during a period of hyperinflation, introduced of a two-month CPI indexation waiver for agricultural loans. In light of the hyperinflation, this measure drastically reduced the real value of the country’s agricultural outstanding loan portfolio by one-third. However, the amount of credit extended and the subsidy involved were highly correlated to the size of land ownership. Thus, in Brazil, where 1 percent of the farming households own about one-half of the arable land, the main beneficiaries of such a regressive income distribution measure were obviously large-scale farmers, including the “urban cowboys.” 10 Their success may derive from their lending technology and from following best practices in microfinance.
7
Panizza, and Yañez 2004 and Messouri 1999, among others). It is unclear whether DFIs’ worse performance stems, at least partially, from the fact that they primarily serve social objectives (which are difficult to quantify), rather than maximize profits—in which case financial performance is bound to suffer. Alternate explanations for DFIs’ poor performance could be that they face lower incentives or indeed have poor governance structure and weak management.
As a consequence, the evaluation of DFIs’ performance cannot rely on traditional measures. Traditional approaches are suitable for commercial banking but fail to capture explicit costs and benefits associated with DFIs’ operations, such as the subsidies that are embedded in most DFIs’ “products” or the fulfillment of social welfare objectives. Seeking to overcome these limitations, Yaron (1992a)11 developed a performance evaluation framework that uses as its primary assessment criteria the “self–sustainability” of DFIs measured through the SDI. This framework was introduced in the early 1990s for assessing the performance of rural banks, microfinance institutions, and others. It has gained wide acceptance among practitioners and academics. Apart from improvements in the effectiveness of those types of measures, a need remains for developing a methodology to assess the extent to which DFIs (a) are reaching their social goals or (b) are effectively using their subsidies to achieve those goals. As stated earlier, these two aspects are the main subject of this paper and are explored in the next sections.
3. Methodology Our methodology consists of applying the already-tested SDI, developing and implementing the OI, and integrating both the SDI and OI concepts. This methodology is tested on two case studies: Banadesa in Honduras and Banrural in Guatemala. These two DFIs lie at opposite ends of the spectrum in terms of operational and institutional strength, and they were chosen deliberately to show the usefulness of the methodology by illustrating its effectiveness in institutions with substantial differences in levels of cost-effectiveness.
The SDI reveals the increase in annual yield on the DFI’s loan portfolio that would be necessary if full subsidy independence is to be reached. Specifically, the SDI quantifies the total explicit and implicit subsidies to a DFI, thereby allowing cost comparisons with other social programs. This indicator can be used to track subsidy dependence over time. Thus, it can be used as a planning and monitoring tool, as well as to compare the subsidy dependence of different DFIs, in the same or different countries that serve similar clientele.
The OI is custom-designed depending on the policy objective that the DFI may have (for example, lend to the rural poor, or support fledging micro-enterprises). The OI requires choosing explicitly quantifiable output variables that are related to the subsidized intervention and agreement on the relative weights of each variable. The main advantage of the OI is that it provides policy makers with a metric that addresses their prioritized social objectives, especially for reaching the target customer base of the DFI. The specific parameters of this metric can be adjusted depending on the particular objective a DFI may
11 There are other tools to measure the subsidy dependence such as the financial self-sustainability (FSS) that was developed later. The transformation from the SDI to the FSS and vice versa is simple.
8
pursue (for example, outreach to the poor, women, rural nonagricultural activities, growth in lending in a post conflict region, etc.).
The integration of the SDI and OI concepts assists in evaluating the cost of providing subsidies to DFIs with the benefit of achieving their social objectives (for example, lending to low-income borrowers), thus more effectively measuring the social benefits of the subsidy.12
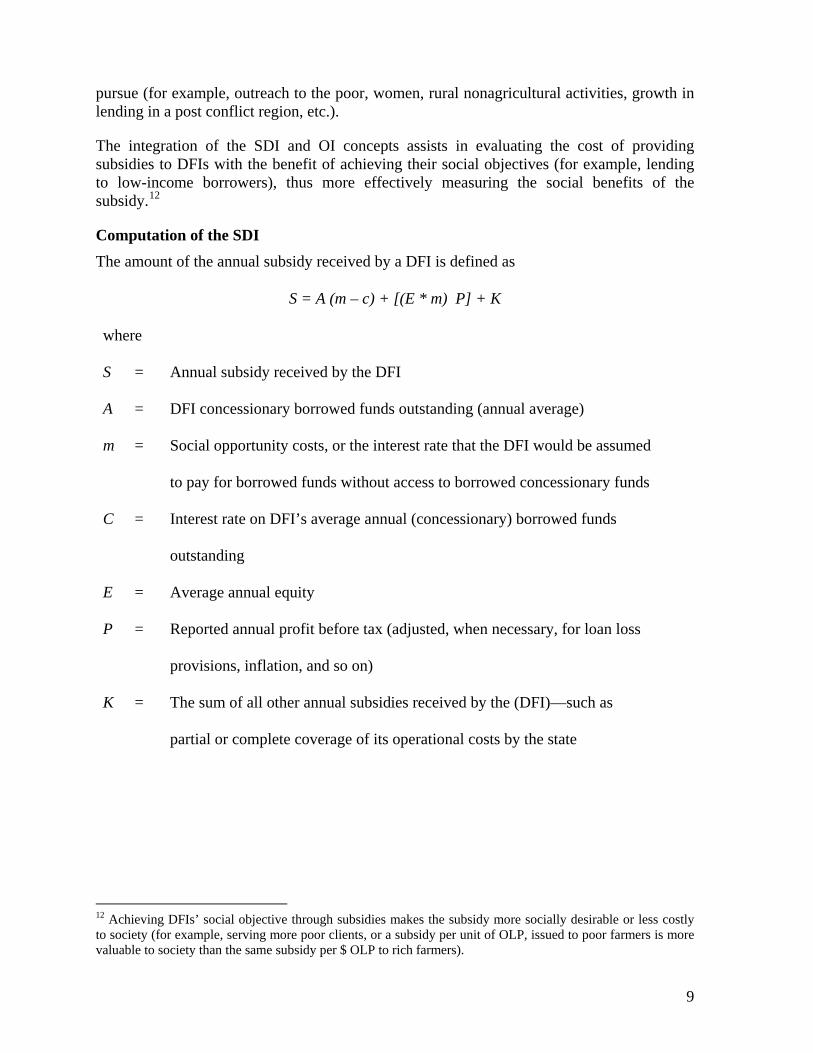
Computation of the SDI The amount of the annual subsidy received by a DFI is defined as
S = A (m – c) + [(E * m) P] + K
where
S = Annual subsidy received by the DFI
A = DFI concessionary borrowed funds outstanding (annual average)
m = Social opportunity costs, or the interest rate that the DFI would be assumed
to pay for borrowed funds without access to borrowed concessionary funds
C = Interest rate on DFI’s average annual (concessionary) borrowed funds
outstanding
E = Average annual equity
P = Reported annual profit before tax (adjusted, when necessary, for loan loss
provisions, inflation, and so on)
K = The sum of all other annual subsidies received by the (DFI)—such as
partial or complete coverage of its operational costs by the state
12 Achieving DFIs’ social objective through subsidies makes the subsidy more socially desirable or less costly to society (for example, serving more poor clients, or a subsidy per unit of OLP, issued to poor farmers is more valuable to society than the same subsidy per $ OLP to rich farmers).
9
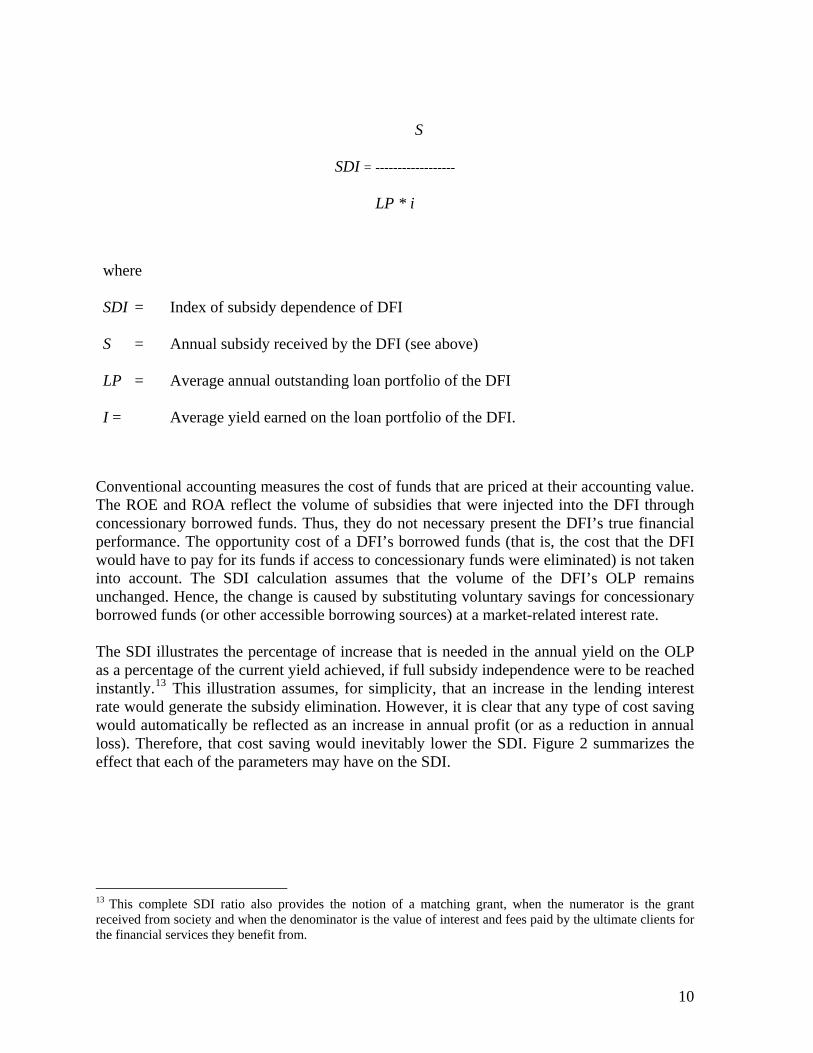
S
SDI = ------------------
LP * i
where
SDI = Index of subsidy dependence of DFI
S = Annual subsidy received by the DFI (see above)
LP = Average annual outstanding loan portfolio of the DFI
I = Average yield earned on the loan portfolio of the DFI.
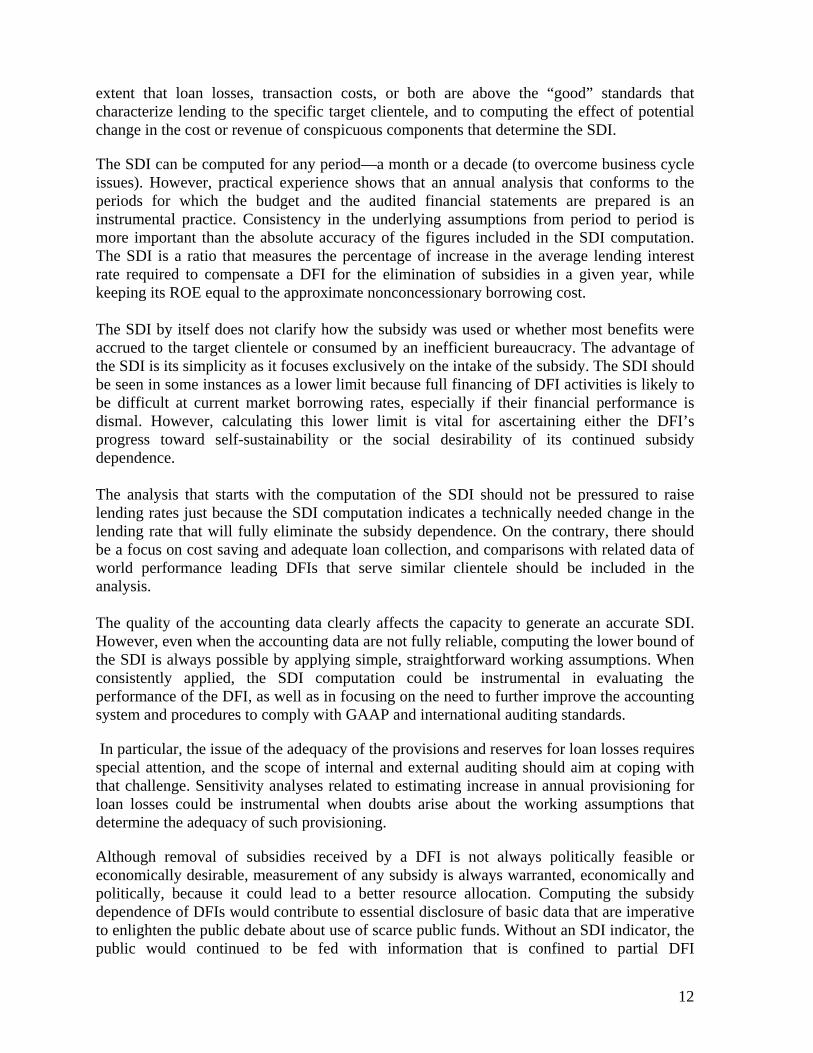
Conventional accounting measures the cost of funds that are priced at their accounting value. The ROE and ROA reflect the volume of subsidies that were injected into the DFI through concessionary borrowed funds. Thus, they do not necessary present the DFI’s true financial performance. The opportunity cost of a DFI’s borrowed funds (that is, the cost that the DFI would have to pay for its funds if access to concessionary funds were eliminated) is not taken into account. The SDI calculation assumes that the volume of the DFI’s OLP remains unchanged. Hence, the change is caused by substituting voluntary savings for concessionary borrowed funds (or other accessible borrowing sources) at a market-related interest rate. The SDI illustrates the percentage of increase that is needed in the annual yield on the OLP as a percentage of the current yield achieved, if full subsidy independence were to be reached instantly.13 This illustration assumes, for simplicity, that an increase in the lending interest rate would generate the subsidy elimination. However, it is clear that any type of cost saving would automatically be reflected as an increase in annual profit (or as a reduction in annual loss). Therefore, that cost saving would inevitably lower the SDI. Figure 2 summarizes the effect that each of the parameters may have on the SDI.
13 This complete SDI ratio also provides the notion of a matching grant, when the numerator is the grant received from society and when the denominator is the value of interest and fees paid by the ultimate clients for the financial services they benefit from.
10
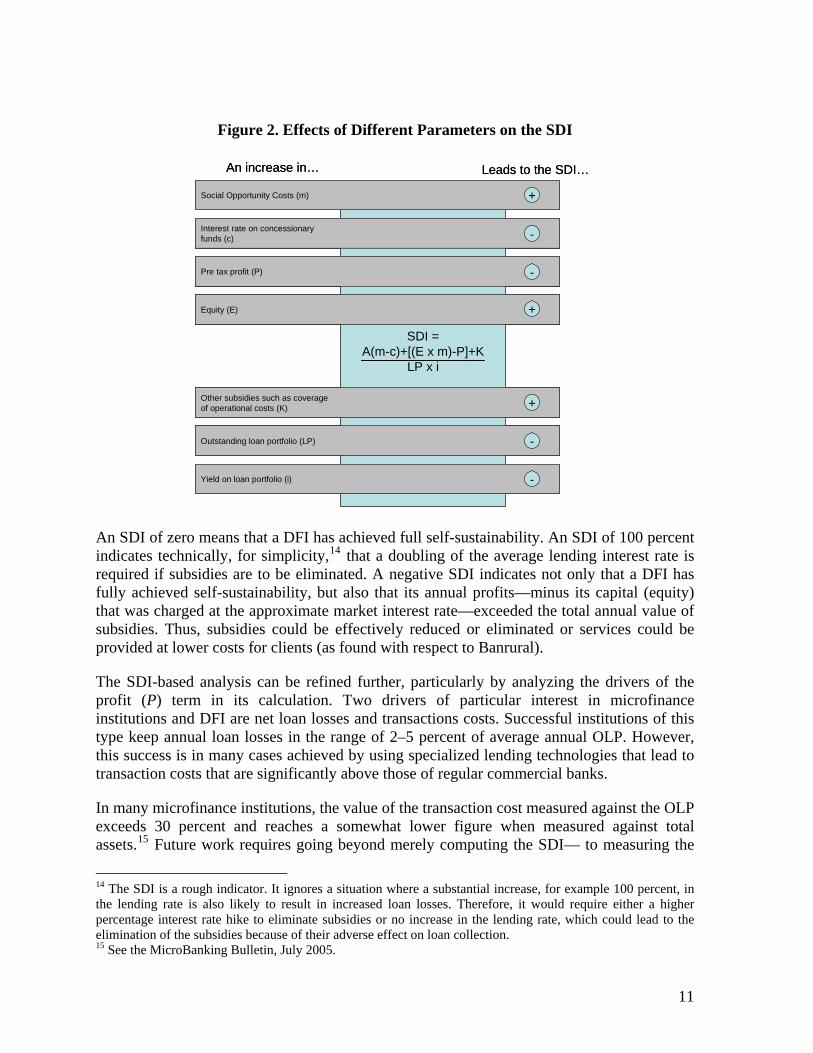
Figure 2. Effects of Different Parameters on the SDI
SDI =A(m-c)+[(E x m)-P]+K
LP x i
An increase in… Leads to the SDI…
Social Opportunity Costs (m)
Interest rate on concessionaryfunds (c)
Pre tax profit (P)
Equity (E)
Other subsidies such as coverageof operational costs (K)
Outstanding loan portfolio (LP)
Yield on loan portfolio (i)
+
-
-
+
+
-
-
SDI =A(m-c)+[(E x m)-P]+K
LP x i
An increase in… Leads to the SDI…
Social Opportunity Costs (m)
Interest rate on concessionaryfunds (c)
Pre tax profit (P)
Equity (E)
Other subsidies such as coverageof operational costs (K)
Outstanding loan portfolio (LP)
Yield on loan portfolio (i)
+
-
-
+
+
-
-
An SDI of zero means that a DFI has achieved full self-sustainability. An SDI of 100 percent indicates technically, for simplicity,14 that a doubling of the average lending interest rate is required if subsidies are to be eliminated. A negative SDI indicates not only that a DFI has fully achieved self-sustainability, but also that its annual profits—minus its capital (equity) that was charged at the approximate market interest rate—exceeded the total annual value of subsidies. Thus, subsidies could be effectively reduced or eliminated or services could be provided at lower costs for clients (as found with respect to Banrural).
The SDI-based analysis can be refined further, particularly by analyzing the drivers of the profit (P) term in its calculation. Two drivers of particular interest in microfinance institutions and DFI are net loan losses and transactions costs. Successful institutions of this type keep annual loan losses in the range of 2–5 percent of average annual OLP. However, this success is in many cases achieved by using specialized lending technologies that lead to transaction costs that are significantly above those of regular commercial banks.
In many microfinance institutions, the value of the transaction cost measured against the OLP exceeds 30 percent and reaches a somewhat lower figure when measured against total assets.15 Future work requires going beyond merely computing the SDI— to measuring the
14 The SDI is a rough indicator. It ignores a situation where a substantial increase, for example 100 percent, in the lending rate is also likely to result in increased loan losses. Therefore, it would require either a higher percentage interest rate hike to eliminate subsidies or no increase in the lending rate, which could lead to the elimination of the subsidies because of their adverse effect on loan collection. 15 See the MicroBanking Bulletin, July 2005.
11
extent that loan losses, transaction costs, or both are above the “good” standards that characterize lending to the specific target clientele, and to computing the effect of potential change in the cost or revenue of conspicuous components that determine the SDI.
The SDI can be computed for any period—a month or a decade (to overcome business cycle issues). However, practical experience shows that an annual analysis that conforms to the periods for which the budget and the audited financial statements are prepared is an instrumental practice. Consistency in the underlying assumptions from period to period is more important than the absolute accuracy of the figures included in the SDI computation. The SDI is a ratio that measures the percentage of increase in the average lending interest rate required to compensate a DFI for the elimination of subsidies in a given year, while keeping its ROE equal to the approximate nonconcessionary borrowing cost. The SDI by itself does not clarify how the subsidy was used or whether most benefits were accrued to the target clientele or consumed by an inefficient bureaucracy. The advantage of the SDI is its simplicity as it focuses exclusively on the intake of the subsidy. The SDI should be seen in some instances as a lower limit because full financing of DFI activities is likely to be difficult at current market borrowing rates, especially if their financial performance is dismal. However, calculating this lower limit is vital for ascertaining either the DFI’s progress toward self-sustainability or the social desirability of its continued subsidy dependence. The analysis that starts with the computation of the SDI should not be pressured to raise lending rates just because the SDI computation indicates a technically needed change in the lending rate that will fully eliminate the subsidy dependence. On the contrary, there should be a focus on cost saving and adequate loan collection, and comparisons with related data of world performance leading DFIs that serve similar clientele should be included in the analysis. The quality of the accounting data clearly affects the capacity to generate an accurate SDI. However, even when the accounting data are not fully reliable, computing the lower bound of the SDI is always possible by applying simple, straightforward working assumptions. When consistently applied, the SDI computation could be instrumental in evaluating the performance of the DFI, as well as in focusing on the need to further improve the accounting system and procedures to comply with GAAP and international auditing standards.
In particular, the issue of the adequacy of the provisions and reserves for loan losses requires special attention, and the scope of internal and external auditing should aim at coping with that challenge. Sensitivity analyses related to estimating increase in annual provisioning for loan losses could be instrumental when doubts arise about the working assumptions that determine the adequacy of such provisioning.
Although removal of subsidies received by a DFI is not always politically feasible or economically desirable, measurement of any subsidy is always warranted, economically and politically, because it could lead to a better resource allocation. Computing the subsidy dependence of DFIs would contribute to essential disclosure of basic data that are imperative to enlighten the public debate about use of scarce public funds. Without an SDI indicator, the public would continued to be fed with information that is confined to partial DFI
12
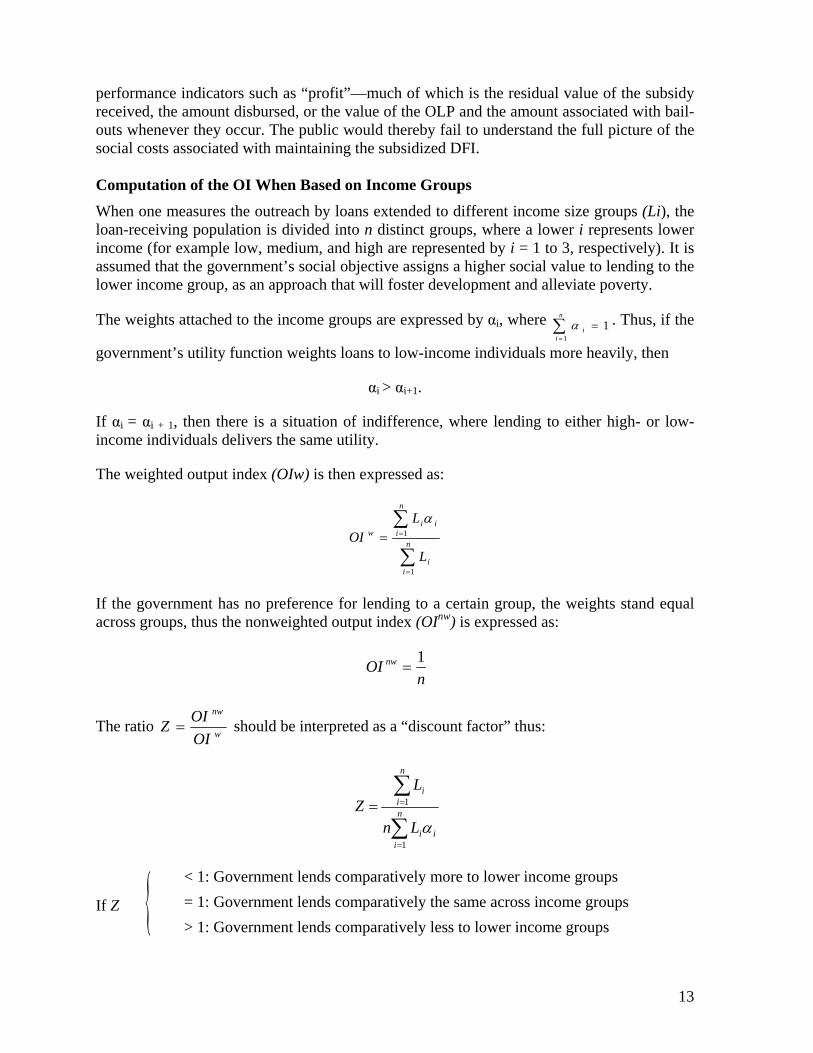
performance indicators such as “profit”—much of which is the residual value of the subsidy received, the amount disbursed, or the value of the OLP and the amount associated with bail-outs whenever they occur. The public would thereby fail to understand the full picture of the social costs associated with maintaining the subsidized DFI. Computation of the OI When Based on Income Groups When one measures the outreach by loans extended to different income size groups (Li), the loan-receiving population is divided into n distinct groups, where a lower i represents lower income (for example low, medium, and high are represented by i = 1 to 3, respectively). It is assumed that the government’s social objective assigns a higher social value to lending to the lower income group, as an approach that will foster development and alleviate poverty.
The weights attached to the income groups are expressed by αi, where ∑ . Thus, if the
government’s utility function weights loans to low-income individuals more heavily, then =
=n
ii
11α
αi > αi+1.
If αi = αi + 1, then there is a situation of indifference, where lending to either high- or low-income individuals delivers the same utility.
The weighted output index (OIw) is then expressed as:
∑
∑
=
== n
ii
n
iii
w
L
LOI
1
1α
If the government has no preference for lending to a certain group, the weights stand equal across groups, thus the nonweighted output index (OInw) is expressed as:
n
OI nw 1=
The ratio w
nw
OIOIZ = should be interpreted as a “discount factor” thus:
∑
∑
=
== n
iii
n
ii
Ln
LZ
1
1
α
< 1: Government lends comparatively more to lower income groups = 1: Government lends comparatively the same across income groups If Z {
> 1: Government lends comparatively less to lower income groups
13
Therefore, the weighted cost of subsidy is Cw = Z*C, where C is the actual cost of subsidy. When Cw < C, the society benefits from an enhanced social gain because of the greater allocation of subsidies to the lower income groups. Alternatively, the net cost of the subsidy to the society is lower. When Cw > C, the actual subsidy is higher and the net cost to society is higher. Thus, less lending reached the target segment of the population.
Although the OI can be used primarily for outreach measurement, it can also be adapted to other needs that reflect the government’s utility function (for example, if the goal is to target women, the portfolio could be divided by gender). Alternatively, the parameter L could be substituted for a different indicator that is not related to volume, such as the average spread of loan groups.
Applicability of SDI and OI to Different Types of DFIs The SDI and the OI can be used to assess the performance of different types of DFIs with a social objective.16 Annex 2 presents a typology of DFIs that can be assessed while using such metrics. The typology is arranged along two axes:
1. Service mechanism: It refers to whether the DFI provides services directly to final beneficiaries or acts as a second-tier institution. Additional care is needed when calculating the subsidy of a second-tier DFI to avoid either double counting of subsidies that in reality accrue only to the retail bank that the DFI serves or underestimating subsidies provided through such a bank.
2. Product focus: It refers to whether the institution concentrates on lending activities. Although the earlier discussion uses mostly lending examples, in practice the SDI may illustrate the additional amount that a DFI would need to charge for any of its nonlending services in order to make the subsidy necessary.
4. Two Pilot Case Studies
Banadesa
Background and Setting Banadesa is the Honduran state agricultural development bank. It has approximately US$50 millions in assets (about 1 percent of the total assets in the Honduran financial system), representing one of the smallest DFIs in the region. It is among the smallest 5 in a set of 80 DFIs identified in LAC.17
Banadesa’s performance reflects the characteristics of the old school of agricultural credit that reigned over development theories until the end of the 1980s. Those characteristics include (a) narrowly directed credit to agricultural producers—rather than to all other rural income–generating activities and rural consumption, (b) political intervention with respect to credit allocation and its terms, (c) poor financial discipline that eventually resulted in low loan recovery, (d) lack of comprehensive knowledge regarding the overall social cost of
16 As already mentioned, this paper does not consider publicly owned commercial banks that do not have a stated social objective because it would be meaningless to calculate the OI for those institutions. 17 The 2001 data were the latest available as of end-2004. The main sources were the websites of Alide and the Central Bank/Superintendency. The table includes only the first tier or mixed (first and second tier) DFIs, but data are available for second tier DFIs as well.
14
maintaining the DFI, and (e) lack of a clear internal view of its products’ cost and revenue structure.
Defining Banadesa’s Business Lines Banadesa finances all agricultural activities, focusing on small and medium producers, although the bank reports plans to diversify toward any rural income–generating activities. The key activities financed include the growing of grains, coffee, sugar cane, cotton, and fruits, a few agro-industrial and rural services activities, as well as cattle raising.
A recent innovation of Banadesa has been the Monedero Agrícola credit card, a particular form of credit disbursement that is subject to higher costs but that permits greater control over the ultimate use of funds. The agricultural producers are issued a card, a voucher, and a savings account, which is opened on their name. The producers can use the card only when dealing with specified input-selling companies and only for the goods listed on the voucher. The company then charges Banadesa directly for the purchase of such inputs.
Since there is a lack of detailed data regarding the revenue, cost, and profit margin for each business line, the breakdown of loans (total amount and number) by loan size—as well as by sectors—is not available. Therefore, we used loan sizes (as a proxy for clientele served) to define Banadesa’s products for the purpose of the analysis.
Banadesa’s SDI Banadesa has deficient financial reporting systems that lead to inaccurate financial statements, for which the external auditor (WB?) identified and recommended many substantial needed adjustments. A crucial data constraint faced when computing the SDI was the need for the consolidation of Banadesa’s Own Funds (Fondos Propios) and Trust Funds (Fideicomisos). Banadesa’s Trust Funds are not audited, although they account for about one-third of Banadesa’s consolidated loan portfolio.
Annex 3 summarizes the main deficiencies of Banadesa’s accounting system and its management information system (MIS), as well as the adjustments that the mission recommended Banadesa should carry out in order to calculate the SDI, OI, and related metrics.
Calculating the opportunity cost to society of public funds used. The most important parameter in measuring the subsidy is the opportunity cost to society of public funds compared with the actual accounting cost paid by Banadesa for the concessionary funds. The subsidy is the social opportunity cost that Banadesa would have to pay in the absence of subsidies, minus the price it actually pays for the concessionary funds. The proxy used for the opportunity cost of funds was based on the interest rate on deposits, as is the case for most examples of the SDI.18 The opportunity cost is then estimated as the
18 Another approach examined is applying the interest rate on bonds issued with a much higher yield by Fondo Nacional para la Producción y la Vivienda (FONAPROVI), which is a state-owned financial institution of the government of Honduras. This approach could more precisely reflect the marginal cost of funds that the state of Honduras faced.Using this method would have substantially increased the computed SDI.
15
rate paid for time deposits, plus a markup for the estimated cost of mobilizing and servicing such deposits, as well as the cost of holding the related reserve requirement.
For Banadesa, the social opportunity cost of public debt was estimated at about 14 percent nominal, or 6 percent real, in 2002, and at 12 percent nominal, or 5 percent real, in 2003 (percentages are based on data provided by the Banco Central de Honduras).
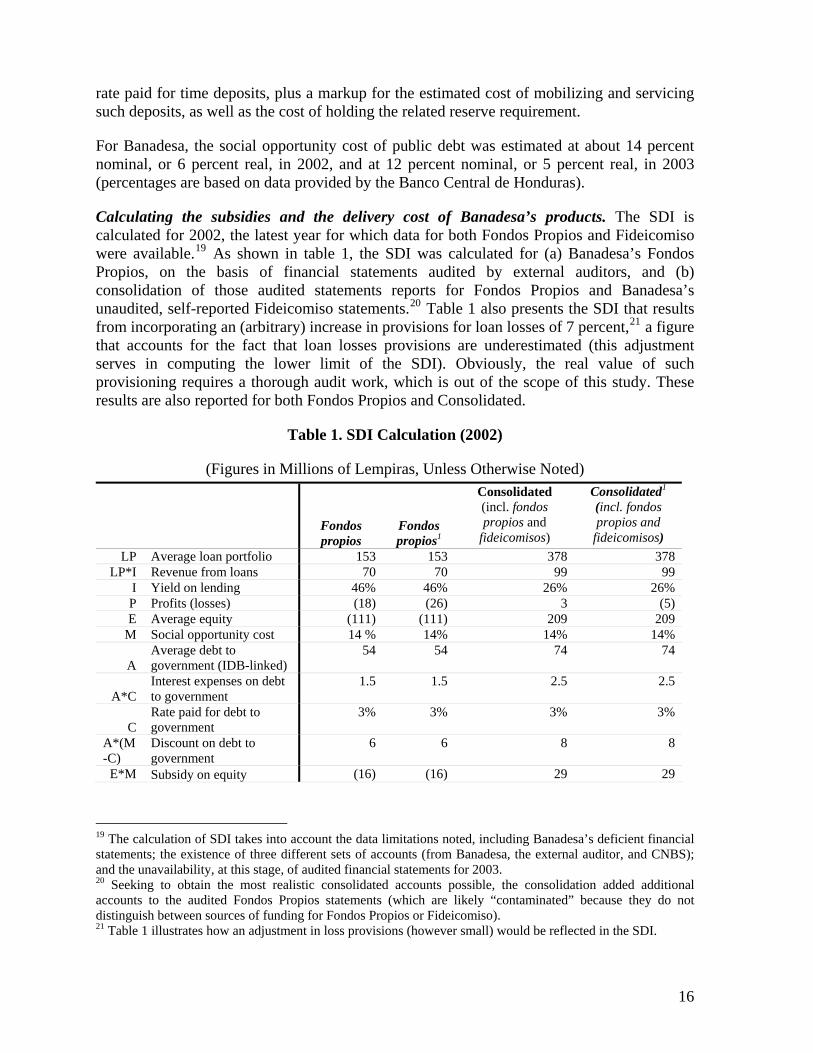
Calculating the subsidies and the delivery cost of Banadesa’s products. The SDI is calculated for 2002, the latest year for which data for both Fondos Propios and Fideicomiso were available.19 As shown in table 1, the SDI was calculated for (a) Banadesa’s Fondos Propios, on the basis of financial statements audited by external auditors, and (b) consolidation of those audited statements reports for Fondos Propios and Banadesa’s unaudited, self-reported Fideicomiso statements.20 Table 1 also presents the SDI that results from incorporating an (arbitrary) increase in provisions for loan losses of 7 percent,21 a figure that accounts for the fact that loan losses provisions are underestimated (this adjustment serves in computing the lower limit of the SDI). Obviously, the real value of such provisioning requires a thorough audit work, which is out of the scope of this study. These results are also reported for both Fondos Propios and Consolidated.
Table 1. SDI Calculation (2002)
(Figures in Millions of Lempiras, Unless Otherwise Noted)
Fondos propios
Fondos propios1
Consolidated (incl. fondos propios and
fideicomisos)
Consolidated1
(incl. fondos propios and
fideicomisos) LP Average loan portfolio 153 153 378 378
LP*I Revenue from loans 70 70 99 99 I Yield on lending 46% 46% 26% 26% P Profits (losses) (18) (26) 3 (5) E Average equity (111) (111) 209 209
M Social opportunity cost 14 % 14% 14% 14%
A Average debt to government (IDB-linked)
54 54 74 74
A*C Interest expenses on debt to government
1.5 1.5 2.5 2.5
C Rate paid for debt to government
3% 3% 3% 3%
A*(M-C)
Discount on debt to government
6 6 8 8
E*M Subsidy on equity (16) (16) 29 29
19 The calculation of SDI takes into account the data limitations noted, including Banadesa’s deficient financial statements; the existence of three different sets of accounts (from Banadesa, the external auditor, and CNBS); and the unavailability, at this stage, of audited financial statements for 2003. 20 Seeking to obtain the most realistic consolidated accounts possible, the consolidation added additional accounts to the audited Fondos Propios statements (which are likely “contaminated” because they do not distinguish between sources of funding for Fondos Propios or Fideicomiso). 21 Table 1 illustrates how an adjustment in loss provisions (however small) would be reflected in the SDI.
16
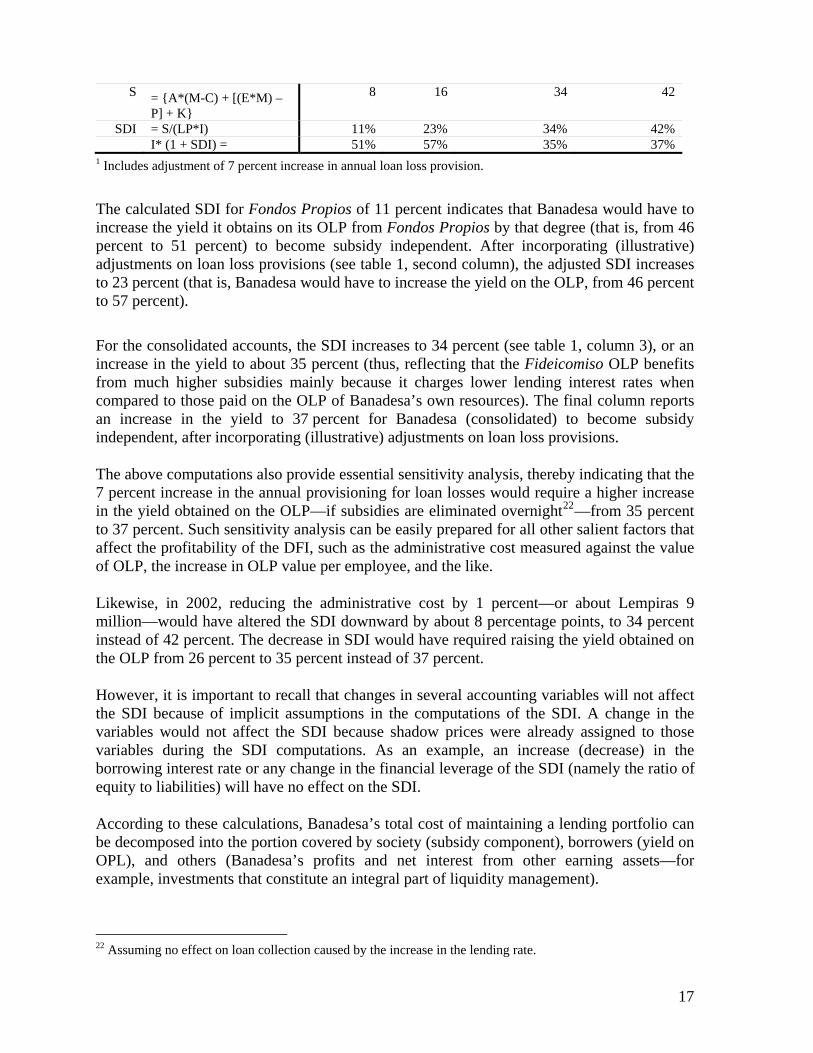
S = {A*(M-C) + [(E*M) – P] + K}
8 16 34 42
SDI = S/(LP*I) 11% 23% 34% 42% I* (1 + SDI) = 51% 57% 35% 37%
1 Includes adjustment of 7 percent increase in annual loan loss provision. The calculated SDI for Fondos Propios of 11 percent indicates that Banadesa would have to increase the yield it obtains on its OLP from Fondos Propios by that degree (that is, from 46 percent to 51 percent) to become subsidy independent. After incorporating (illustrative) adjustments on loan loss provisions (see table 1, second column), the adjusted SDI increases to 23 percent (that is, Banadesa would have to increase the yield on the OLP, from 46 percent to 57 percent). For the consolidated accounts, the SDI increases to 34 percent (see table 1, column 3), or an increase in the yield to about 35 percent (thus, reflecting that the Fideicomiso OLP benefits from much higher subsidies mainly because it charges lower lending interest rates when compared to those paid on the OLP of Banadesa’s own resources). The final column reports an increase in the yield to 37 percent for Banadesa (consolidated) to become subsidy independent, after incorporating (illustrative) adjustments on loan loss provisions.
The above computations also provide essential sensitivity analysis, thereby indicating that the 7 percent increase in the annual provisioning for loan losses would require a higher increase in the yield obtained on the OLP—if subsidies are eliminated overnight22—from 35 percent to 37 percent. Such sensitivity analysis can be easily prepared for all other salient factors that affect the profitability of the DFI, such as the administrative cost measured against the value of OLP, the increase in OLP value per employee, and the like.
Likewise, in 2002, reducing the administrative cost by 1 percent—or about Lempiras 9 million—would have altered the SDI downward by about 8 percentage points, to 34 percent instead of 42 percent. The decrease in SDI would have required raising the yield obtained on the OLP from 26 percent to 35 percent instead of 37 percent.
However, it is important to recall that changes in several accounting variables will not affect the SDI because of implicit assumptions in the computations of the SDI. A change in the variables would not affect the SDI because shadow prices were already assigned to those variables during the SDI computations. As an example, an increase (decrease) in the borrowing interest rate or any change in the financial leverage of the SDI (namely the ratio of equity to liabilities) will have no effect on the SDI.
According to these calculations, Banadesa’s total cost of maintaining a lending portfolio can be decomposed into the portion covered by society (subsidy component), borrowers (yield on OPL), and others (Banadesa’s profits and net interest from other earning assets—for example, investments that constitute an integral part of liquidity management).
22 Assuming no effect on loan collection caused by the increase in the lending rate.
17
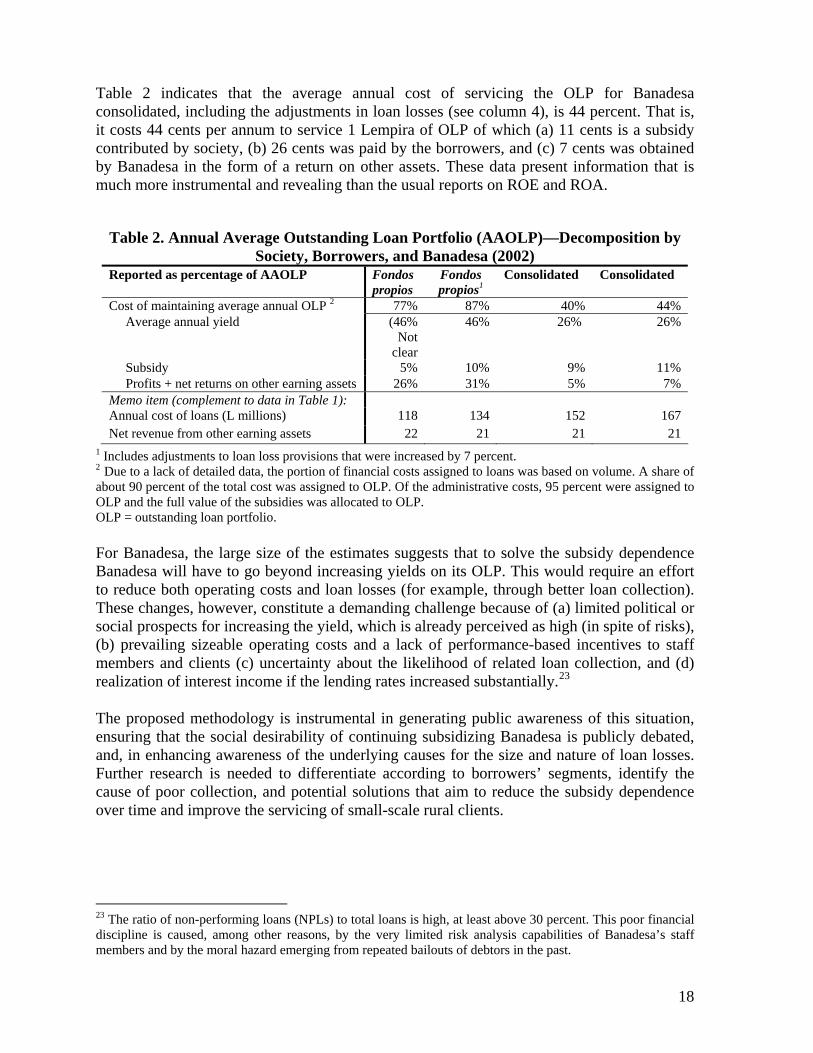
Table 2 indicates that the average annual cost of servicing the OLP for Banadesa consolidated, including the adjustments in loan losses (see column 4), is 44 percent. That is, it costs 44 cents per annum to service 1 Lempira of OLP of which (a) 11 cents is a subsidy contributed by society, (b) 26 cents was paid by the borrowers, and (c) 7 cents was obtained by Banadesa in the form of a return on other assets. These data present information that is much more instrumental and revealing than the usual reports on ROE and ROA.
Table 2. Annual Average Outstanding Loan Portfolio (AAOLP)—Decomposition by
Society, Borrowers, and Banadesa (2002) Reported as percentage of AAOLP Fondos
propios Fondos propios1
Consolidated Consolidated
Cost of maintaining average annual OLP 2 77% 87% 40% 44% Average annual yield (46%
Not clear
46% 26% 26%
Subsidy 5% 10% 9% 11% Profits + net returns on other earning assets 26% 31% 5% 7% Memo item (complement to data in Table 1): Annual cost of loans (L millions) 118 134 152 167 Net revenue from other earning assets 22 21 21 21
1 Includes adjustments to loan loss provisions that were increased by 7 percent. 2 Due to a lack of detailed data, the portion of financial costs assigned to loans was based on volume. A share of about 90 percent of the total cost was assigned to OLP. Of the administrative costs, 95 percent were assigned to OLP and the full value of the subsidies was allocated to OLP. OLP = outstanding loan portfolio.
For Banadesa, the large size of the estimates suggests that to solve the subsidy dependence Banadesa will have to go beyond increasing yields on its OLP. This would require an effort to reduce both operating costs and loan losses (for example, through better loan collection). These changes, however, constitute a demanding challenge because of (a) limited political or social prospects for increasing the yield, which is already perceived as high (in spite of risks), (b) prevailing sizeable operating costs and a lack of performance-based incentives to staff members and clients (c) uncertainty about the likelihood of related loan collection, and (d) realization of interest income if the lending rates increased substantially.23
The proposed methodology is instrumental in generating public awareness of this situation, ensuring that the social desirability of continuing subsidizing Banadesa is publicly debated, and, in enhancing awareness of the underlying causes for the size and nature of loan losses. Further research is needed to differentiate according to borrowers’ segments, identify the cause of poor collection, and potential solutions that aim to reduce the subsidy dependence over time and improve the servicing of small-scale rural clients.
23 The ratio of non-performing loans (NPLs) to total loans is high, at least above 30 percent. This poor financial discipline is caused, among other reasons, by the very limited risk analysis capabilities of Banadesa’s staff members and by the moral hazard emerging from repeated bailouts of debtors in the past.
18
Banadesa’s Output Index Given the data limitations in defining specific lines of business and in adequately allocating related costs and subsidies, the study measures the extent to which Banadesa meets broader social objectives, such as lending more to the poor rather than lending to specific subsectors of agriculture (for example, livestock) that do not necessarily correlate with low (or high) income borrowers groups. According to data provided for Fondos Propios in 2003, loan size is taken as a proxy for the borrowers’ income. Thus, assuming that loan size and borrower’s income are highly correlated smaller loans are being extended to poorer clients.
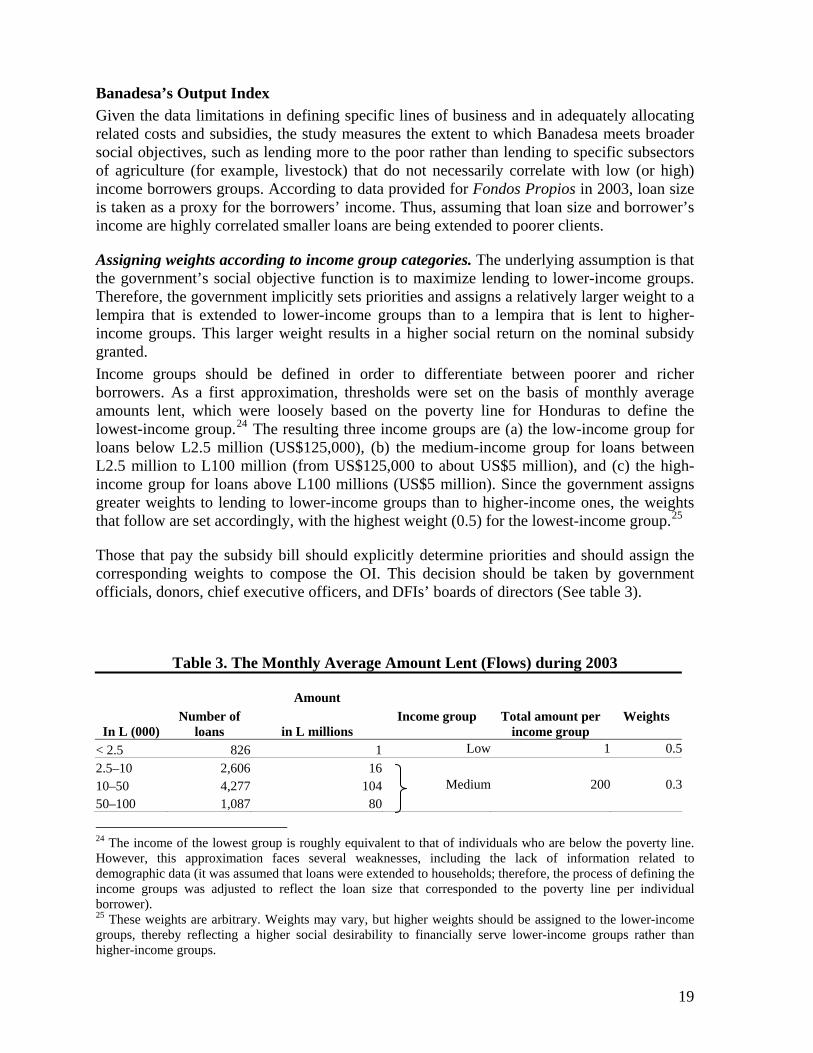
Assigning weights according to income group categories. The underlying assumption is that the government’s social objective function is to maximize lending to lower-income groups. Therefore, the government implicitly sets priorities and assigns a relatively larger weight to a lempira that is extended to lower-income groups than to a lempira that is lent to higher-income groups. This larger weight results in a higher social return on the nominal subsidy granted. Income groups should be defined in order to differentiate between poorer and richer borrowers. As a first approximation, thresholds were set on the basis of monthly average amounts lent, which were loosely based on the poverty line for Honduras to define the lowest-income group.24 The resulting three income groups are (a) the low-income group for loans below L2.5 million (US$125,000), (b) the medium-income group for loans between L2.5 million to L100 million (from US$125,000 to about US$5 million), and (c) the high-income group for loans above L100 millions (US$5 million). Since the government assigns greater weights to lending to lower-income groups than to higher-income ones, the weights that follow are set accordingly, with the highest weight (0.5) for the lowest-income group.25
Those that pay the subsidy bill should explicitly determine priorities and should assign the corresponding weights to compose the OI. This decision should be taken by government officials, donors, chief executive officers, and DFIs’ boards of directors (See table 3).
Table 3. The Monthly Average Amount Lent (Flows) during 2003
In L (000) Number of
loans
Amount
in L millions
Income group
Total amount per income group
Weights
< 2.5 826 1 Low 1 0.52.5–10 2,606 1610–50 4,277 104 Medium 200 0.350–100 1,087 80
24 The income of the lowest group is roughly equivalent to that of individuals who are below the poverty line. However, this approximation faces several weaknesses, including the lack of information related to demographic data (it was assumed that loans were extended to households; therefore, the process of defining the income groups was adjusted to reflect the loan size that corresponded to the poverty line per individual borrower). 25 These weights are arbitrary. Weights may vary, but higher weights should be assigned to the lower-income groups, thereby reflecting a higher social desirability to financially serve lower-income groups rather than higher-income groups.
19
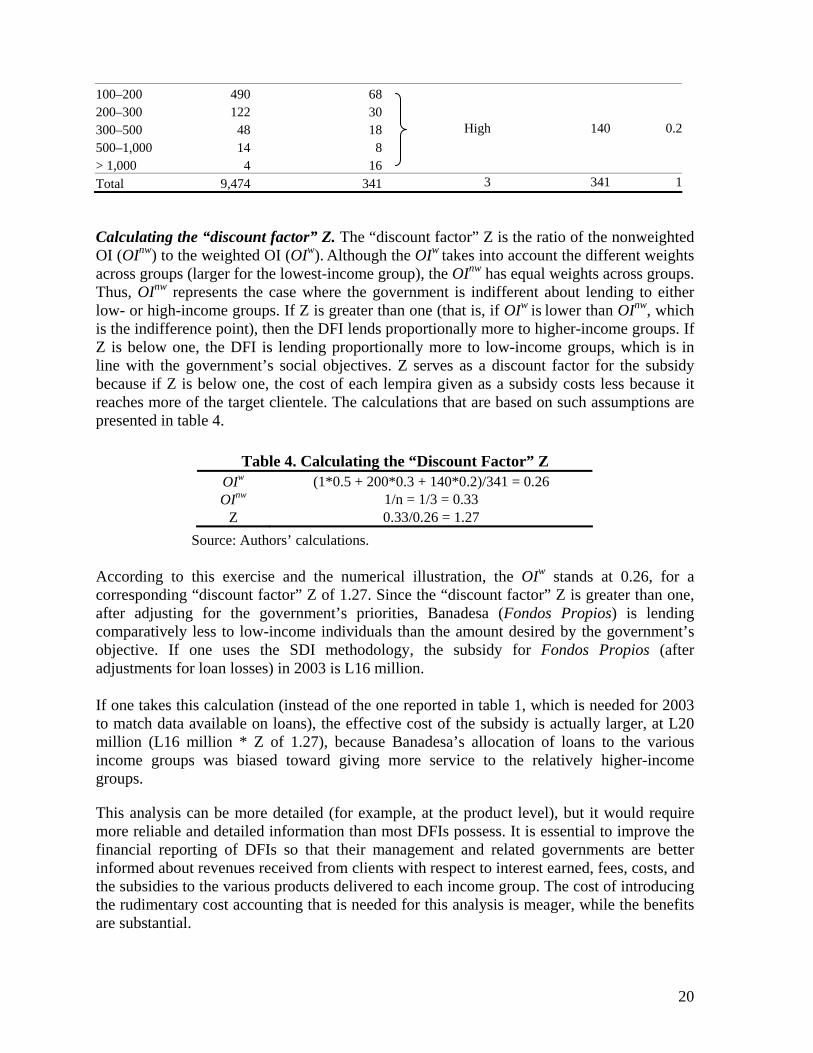
100–200 490 68200–300 122 30300–500 48 18 High 140 0.2500–1,000 14 8> 1,000 4 16Total 9,474 341 3 341 1
Calculating the “discount factor” Z. The “discount factor” Z is the ratio of the nonweighted OI (OInw) to the weighted OI (OIw). Although the OIw takes into account the different weights across groups (larger for the lowest-income group), the OInw has equal weights across groups. Thus, OInw represents the case where the government is indifferent about lending to either low- or high-income groups. If Z is greater than one (that is, if OIw is lower than OInw, which is the indifference point), then the DFI lends proportionally more to higher-income groups. If Z is below one, the DFI is lending proportionally more to low-income groups, which is in line with the government’s social objectives. Z serves as a discount factor for the subsidy because if Z is below one, the cost of each lempira given as a subsidy costs less because it reaches more of the target clientele. The calculations that are based on such assumptions are presented in table 4.
Table 4. Calculating the “Discount Factor” Z
OIw (1*0.5 + 200*0.3 + 140*0.2)/341 = 0.26 OInw 1/n = 1/3 = 0.33
Z 0.33/0.26 = 1.27 Source: Authors’ calculations.
According to this exercise and the numerical illustration, the OIw stands at 0.26, for a corresponding “discount factor” Z of 1.27. Since the “discount factor” Z is greater than one, after adjusting for the government’s priorities, Banadesa (Fondos Propios) is lending comparatively less to low-income individuals than the amount desired by the government’s objective. If one uses the SDI methodology, the subsidy for Fondos Propios (after adjustments for loan losses) in 2003 is L16 million.
If one takes this calculation (instead of the one reported in table 1, which is needed for 2003 to match data available on loans), the effective cost of the subsidy is actually larger, at L20 million (L16 million * Z of 1.27), because Banadesa’s allocation of loans to the various income groups was biased toward giving more service to the relatively higher-income groups.
This analysis can be more detailed (for example, at the product level), but it would require more reliable and detailed information than most DFIs possess. It is essential to improve the financial reporting of DFIs so that their management and related governments are better informed about revenues received from clients with respect to interest earned, fees, costs, and the subsidies to the various products delivered to each income group. The cost of introducing the rudimentary cost accounting that is needed for this analysis is meager, while the benefits are substantial.
20
Banrural S.A.
Background and Setting Banrural S.A. was formed in 1998 in Guatemala as a result of a transformation of its predecessor, Bandesa. Bandesa was a government-owned development bank founded in 1970. Its objective was to promote and manage the government of Guatemala’s credit programs for the farming sector. The transformation of Bandesa was part of the modernization process of the Guatemalan financial sector. The claimed mission of Bandesa in Guatemala was similar to that of Banadesa in Honduras, namely to deliver agricultural credit.
However, in contrast to most DFIs (including its predecessor), Banrural S.A. included in its mandate the goals of generating fair profitability while simultaneously adhering to its social goal, namely to promote the “integral development of the country ... with universal banking services and national covering, preferably directed toward farmers, merchants, artisans, and small- and medium-size entrepreneurs.”
The process of transformation of Bandesa into Banrural S.A. was exceptionally successful, yielding remarkable achievements when the outcomes are evaluated against the characteristics and background of the environment surrounding the economy and the financial sector in Guatemala. The entry of private capital and cooperatives into Banrural’s capital base has by now made the government a minority shareholder.
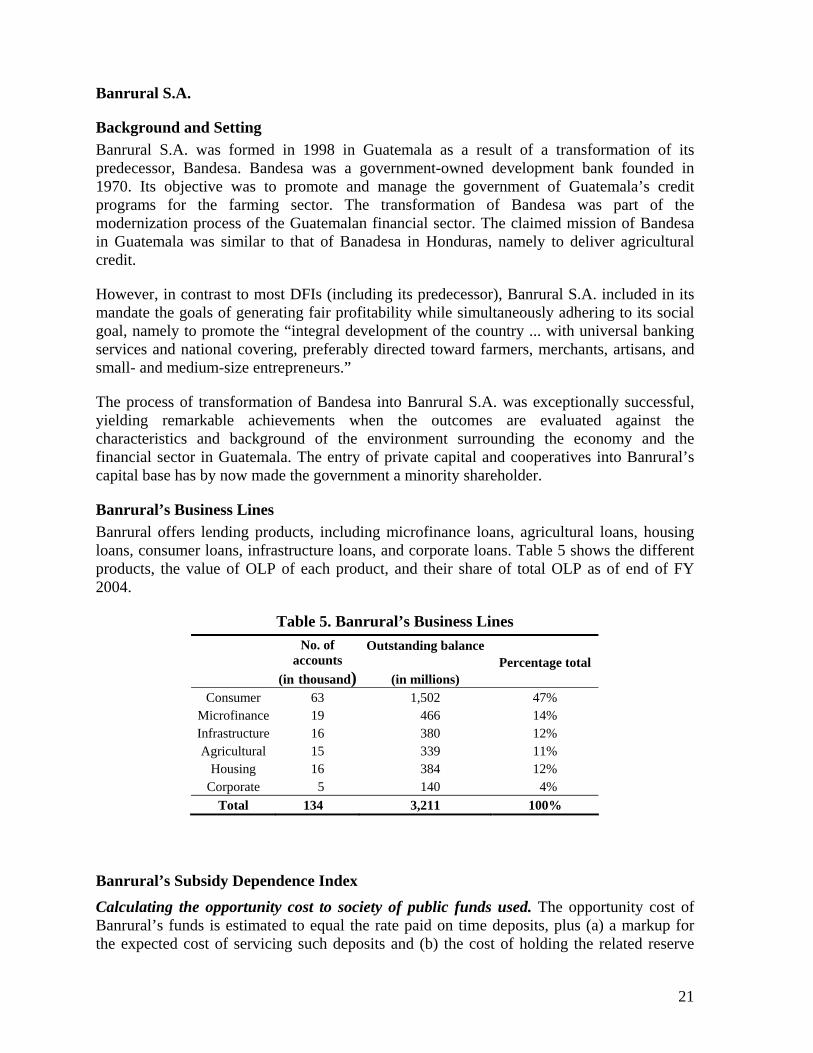
Banrural’s Business Lines Banrural offers lending products, including microfinance loans, agricultural loans, housing loans, consumer loans, infrastructure loans, and corporate loans. Table 5 shows the different products, the value of OLP of each product, and their share of total OLP as of end of FY 2004.
Table 5. Banrural’s Business Lines
No. of
accounts (in thousand)
Outstanding balance
(in millions) Percentage total
Consumer 63 1,502 47% Microfinance 19 466 14% Infrastructure 16 380 12% Agricultural 15 339 11%
Housing 16 384 12% Corporate 5 140 4%
Total 134 3,211 100%
Banrural’s Subsidy Dependence Index Calculating the opportunity cost to society of public funds used. The opportunity cost of Banrural’s funds is estimated to equal the rate paid on time deposits, plus (a) a markup for the expected cost of servicing such deposits and (b) the cost of holding the related reserve
21
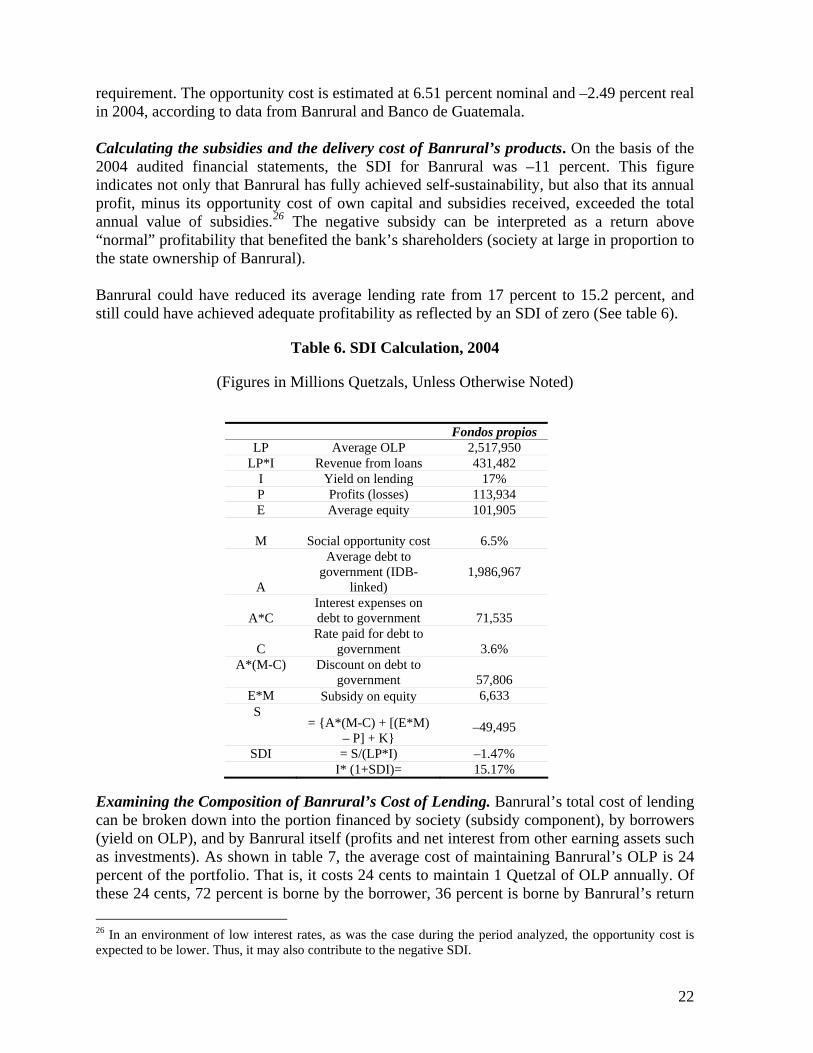
requirement. The opportunity cost is estimated at 6.51 percent nominal and –2.49 percent real in 2004, according to data from Banrural and Banco de Guatemala. Calculating the subsidies and the delivery cost of Banrural’s products. On the basis of the 2004 audited financial statements, the SDI for Banrural was –11 percent. This figure indicates not only that Banrural has fully achieved self-sustainability, but also that its annual profit, minus its opportunity cost of own capital and subsidies received, exceeded the total annual value of subsidies.26 The negative subsidy can be interpreted as a return above “normal” profitability that benefited the bank’s shareholders (society at large in proportion to the state ownership of Banrural). Banrural could have reduced its average lending rate from 17 percent to 15.2 percent, and still could have achieved adequate profitability as reflected by an SDI of zero (See table 6).
Table 6. SDI Calculation, 2004
(Figures in Millions Quetzals, Unless Otherwise Noted)
Fondos propios
LP Average OLP 2,517,950 LP*I Revenue from loans 431,482
I Yield on lending 17% P Profits (losses) 113,934 E Average equity 101,905
M Social opportunity cost
6.5%
A
Average debt to government (IDB-
linked)
1,986,967
A*C Interest expenses on debt to government
71,535
C Rate paid for debt to
government
3.6% A*(M-C) Discount on debt to
government
57,806 E*M Subsidy on equity 6,633 S
= {A*(M-C) + [(E*M) – P] + K}
–49,495
SDI = S/(LP*I) –1.47% I* (1+SDI)= 15.17%
Examining the Composition of Banrural’s Cost of Lending. Banrural’s total cost of lending can be broken down into the portion financed by society (subsidy component), by borrowers (yield on OLP), and by Banrural itself (profits and net interest from other earning assets such as investments). As shown in table 7, the average cost of maintaining Banrural’s OLP is 24 percent of the portfolio. That is, it costs 24 cents to maintain 1 Quetzal of OLP annually. Of these 24 cents, 72 percent is borne by the borrower, 36 percent is borne by Banrural’s return 26 In an environment of low interest rates, as was the case during the period analyzed, the opportunity cost is expected to be lower. Thus, it may also contribute to the negative SDI.
22
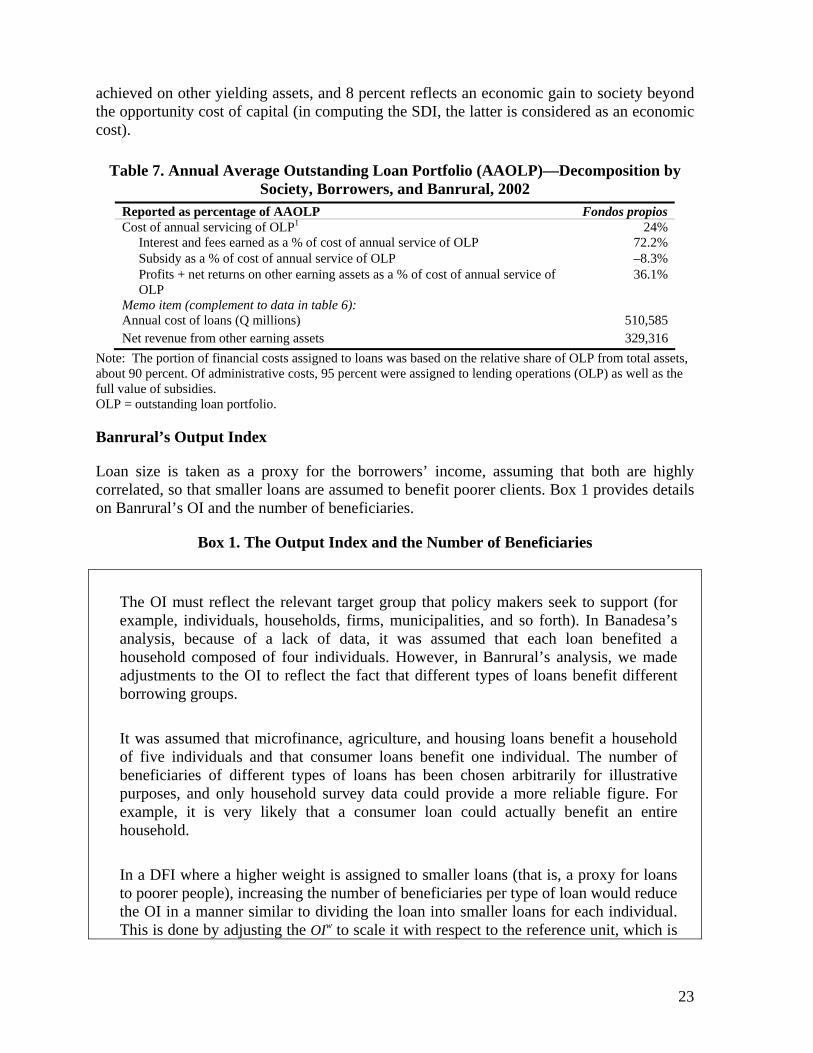
achieved on other yielding assets, and 8 percent reflects an economic gain to society beyond the opportunity cost of capital (in computing the SDI, the latter is considered as an economic cost).
Table 7. Annual Average Outstanding Loan Portfolio (AAOLP)—Decomposition by
Society, Borrowers, and Banrural, 2002 Reported as percentage of AAOLP Fondos propios Cost of annual servicing of OLP1 24% Interest and fees earned as a % of cost of annual service of OLP 72.2% Subsidy as a % of cost of annual service of OLP –8.3% Profits + net returns on other earning assets as a % of cost of annual service of
OLP 36.1%
Memo item (complement to data in table 6): Annual cost of loans (Q millions) 510,585 Net revenue from other earning assets 329,316
Note: The portion of financial costs assigned to loans was based on the relative share of OLP from total assets, about 90 percent. Of administrative costs, 95 percent were assigned to lending operations (OLP) as well as the full value of subsidies. OLP = outstanding loan portfolio.
Banrural’s Output Index
Loan size is taken as a proxy for the borrowers’ income, assuming that both are highly correlated, so that smaller loans are assumed to benefit poorer clients. Box 1 provides details on Banrural’s OI and the number of beneficiaries.
Box 1. The Output Index and the Number of Beneficiaries
The OI must reflect the relevant target group that policy makers seek to support (for example, individuals, households, firms, municipalities, and so forth). In Banadesa’s analysis, because of a lack of data, it was assumed that each loan benefited a household composed of four individuals. However, in Banrural’s analysis, we made adjustments to the OI to reflect the fact that different types of loans benefit different borrowing groups. It was assumed that microfinance, agriculture, and housing loans benefit a household of five individuals and that consumer loans benefit one individual. The number of beneficiaries of different types of loans has been chosen arbitrarily for illustrative purposes, and only household survey data could provide a more reliable figure. For example, it is very likely that a consumer loan could actually benefit an entire household. In a DFI where a higher weight is assigned to smaller loans (that is, a proxy for loans to poorer people), increasing the number of beneficiaries per type of loan would reduce the OI in a manner similar to dividing the loan into smaller loans for each individual. This is done by adjusting the OIw to scale it with respect to the reference unit, which is
23
the household. In our specific example, for consumer loans, the OIw is multiplied by 1/5 because the loan benefits one-fifth of a household.
On the one hand, for other types of loans such as corporate or small and medium enterprises, the reference unit is the firm, which raises the issue of comparing OIs between loans that have different reference units—a complex issue. On the other hand, policy objectives are also different. Normally, DFIs have a set of products targeted to reach poorer individuals and a different set of products to reach small firms. Thus, the level of fulfillment of those objectives can be measured with different types of OIs.
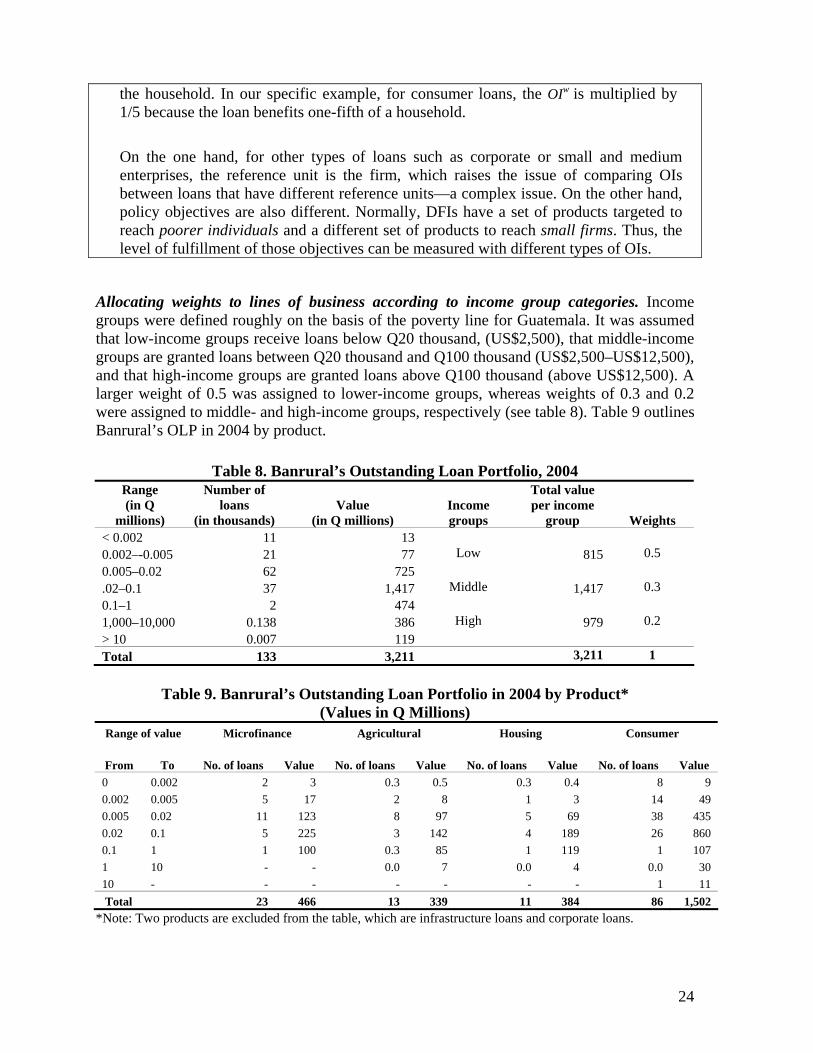
Allocating weights to lines of business according to income group categories. Income groups were defined roughly on the basis of the poverty line for Guatemala. It was assumed that low-income groups receive loans below Q20 thousand, (US$2,500), that middle-income groups are granted loans between Q20 thousand and Q100 thousand (US$2,500–US$12,500), and that high-income groups are granted loans above Q100 thousand (above US$12,500). A larger weight of 0.5 was assigned to lower-income groups, whereas weights of 0.3 and 0.2 were assigned to middle- and high-income groups, respectively (see table 8). Table 9 outlines Banrural’s OLP in 2004 by product.
Table 8. Banrural’s Outstanding Loan Portfolio, 2004
Range (in Q
millions)
Number of loans
(in thousands)
Value
(in Q millions)
Income groups
Total value per income
group
Weights < 0.002 11 13 0.002–-0.005 21 77 Low 815 0.5 0.005–0.02 62 725 .02–0.1 37 1,417 Middle 1,417 0.3 0.1–1 2 474 1,000–10,000 0.138 386 High 979 0.2 > 10 0.007 119 Total 133 3,211 3,211 1
Table 9. Banrural’s Outstanding Loan Portfolio in 2004 by Product*
(Values in Q Millions) Range of value Microfinance Agricultural Housing Consumer
From To No. of loans Value No. of loans Value No. of loans Value No. of loans Value 0 0.002 2 3 0.3 0.5 0.3 0.4 8 9 0.002 0.005 5 17 2 8 1 3 14 49 0.005 0.02 11 123 8 97 5 69 38 435 0.02 0.1 5 225 3 142 4 189 26 860 0.1 1 1 100 0.3 85 1 119 1 107 1 10 - - 0.0 7 0.0 4 0.0 30 10 - - - - - - - 1 11 Total 23 466 13 339 11 384 86 1,502
*Note: Two products are excluded from the table, which are infrastructure loans and corporate loans.
24
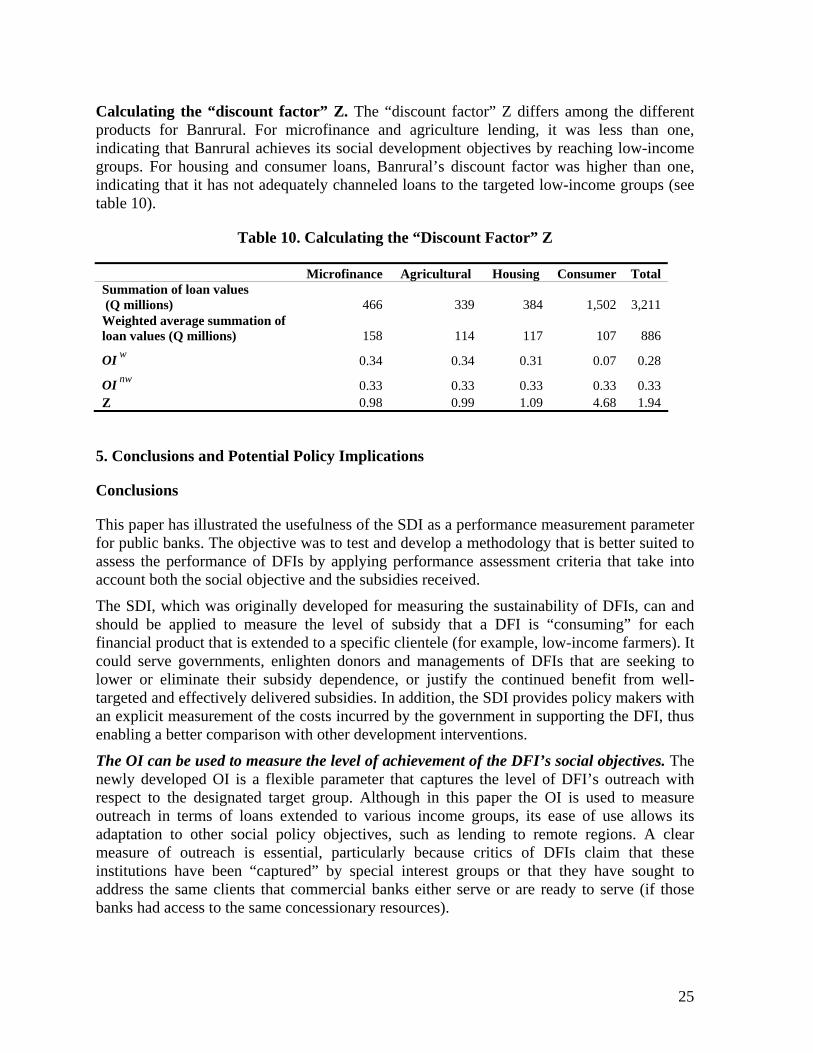
Calculating the “discount factor” Z. The “discount factor” Z differs among the different products for Banrural. For microfinance and agriculture lending, it was less than one, indicating that Banrural achieves its social development objectives by reaching low-income groups. For housing and consumer loans, Banrural’s discount factor was higher than one, indicating that it has not adequately channeled loans to the targeted low-income groups (see table 10).
Table 10. Calculating the “Discount Factor” Z
Microfinance Agricultural Housing Consumer Total Summation of loan values (Q millions) 466 339 384 1,502 3,211 Weighted average summation of loan values (Q millions) 158 114 117 107 886
OI w 0.34 0.34 0.31 0.07 0.28
OI nw 0.33 0.33 0.33 0.33 0.33 Z 0.98 0.99 1.09 4.68 1.94
5. Conclusions and Potential Policy Implications
Conclusions
This paper has illustrated the usefulness of the SDI as a performance measurement parameter for public banks. The objective was to test and develop a methodology that is better suited to assess the performance of DFIs by applying performance assessment criteria that take into account both the social objective and the subsidies received.
The SDI, which was originally developed for measuring the sustainability of DFIs, can and should be applied to measure the level of subsidy that a DFI is “consuming” for each financial product that is extended to a specific clientele (for example, low-income farmers). It could serve governments, enlighten donors and managements of DFIs that are seeking to lower or eliminate their subsidy dependence, or justify the continued benefit from well-targeted and effectively delivered subsidies. In addition, the SDI provides policy makers with an explicit measurement of the costs incurred by the government in supporting the DFI, thus enabling a better comparison with other development interventions.
The OI can be used to measure the level of achievement of the DFI’s social objectives. The newly developed OI is a flexible parameter that captures the level of DFI’s outreach with respect to the designated target group. Although in this paper the OI is used to measure outreach in terms of loans extended to various income groups, its ease of use allows its adaptation to other social policy objectives, such as lending to remote regions. A clear measure of outreach is essential, particularly because critics of DFIs claim that these institutions have been “captured” by special interest groups or that they have sought to address the same clients that commercial banks either serve or are ready to serve (if those banks had access to the same concessionary resources).
25
For example, agricultural DFIs are often criticized for concentrating on servicing high- income producers rather than small farmers. This tool allows unveiling the subsidy for each product that is reaching the specific target group. Currently, such information is rarely available. Thus, it is very difficult for decision makers to decide about how to use scarce resources, which segment of the target clientele will benefit from subsidies, and through which financial product.
The amount of information provided by integrating the SDI and the OI is as good as the underlying accounting systems and management information systems (MISs) of the DFI. The SDI and the OI can be applied even under adverse or rudimentary data quality environments by setting the lower limit of the SDI. However, availability of more granular information permits using the two parameters to measure performance at more disaggregated levels. In particular, better cost accounting systems could allow very detailed evaluating of the cost, revenue, and subsidy per product to a subset of clientele served (as was partially done for Banrural) or could allow applying the indices to evaluate branch-level performance.
Potential Policy Implications
The SDI components can inform policy decisions that seek to avoid distortions and unsustainable operations. Generally, governments should seek to have DFIs with SDIs close to zero. A large positive SDI typically reflects the need to enhance government intervention (for example, eliminate interest rate ceilings), while a negative SDI could imply that the government is potentially misplacing the subsidy (for example, the DFI, and hence the private sector may have achieved similar results without the subsidy). Thus, for DFIs with SDIs significantly different from zero, the government should review its policies (subsidies) and should adjust them as needed to achieve its objectives at the least cost to society, or it should consider if the DFIs are crowding out the private sector. To achieve that neutral SDI, the drivers illustrated in figure 2 can be used to decide what customer segments to serve and if the institution should move into customer segments that are more costly to serve and with higher credit risks.
If subsidizing a DFI is a formal policy decision, the OI should be used to monitor its effect. If only the financial sustainability of the DFI is assessed, it is impossible to know how its operations should be adjusted to ensure that the social objective of the institutions is being fulfilled. The definition of output dimensions of the OI should be reviewed periodically because the objective of the DFI may change to ensure that efforts are being targeted in the right direction.
Beyond the findings of this study, the next step would be the use of the SDI and the OI in a preliminary exercise of establishing performance benchmarks for DFIs. The two indices are very amenable to develop benchmarks for DFIs in the region. The development of these benchmarks would include reviewing and analyzing publicly available data (annual reports, mandates, target clientele served, and so forth) about DFIs in LAC to produce a database framework that would allow comparing performance of DFIs by relying on the methodologies of the SDI and the OI.
26
BIBLIOGRAPHY
Aiello, F., D. Silipo, and F. Trivieri. 2001. “Ownership Structure, Behaviour, and Performance of the Banking Industry.” Dipartimento di Economia e Statistics, Università della Calabria, Cosenza, Italy.
Altunbas, Y., L. Evans, and P. Molyneux. 2001. “Bank Ownership and Efficiency.” Journal of Money, Credit, and Banking 33(4): 926–54.
Asociación Latinoamericana de Instituciones Financieras para el Desarollo (ALIDE). 2002.
Atkinson, A., and J. Stiglitz. 1980. Lectures on Public Economics. London: McGraw-Hill.
Banerjee, A. 1997. “A Theory of Misgovernance.” Quarterly Journal of Economics 112: 1289–332.
Barth, James R. G Caprio Jr., R. Levine 2001. “Banking Systems Around the Globe: Do Regulation and Ownership Affect Performance and Stability?” in Mishkin, Frederic (ed.) Prudential Supervision: What Works and What Doesn’t, National Bureau of Economic Research Conference Report, Chicago: Univ. of Chicago Press.
Beck, T., A. Demirgüç -Kunt, and R. Levine. 2004. “Finance, Inequality, and Poverty: Cross-Country Evidence,” Policy Research Working Paper 3338, World Bank, Washington, DC.
Beck, T., A. Demirgüç-Kunt, and V. Maksimovic. 2002. “Financial and Legal Constraints to Firm Growth: Does Size Matter?” Policy Research Working Paper 2784, World Bank, Washington, DC.
Burgess, R., and R. Pande. 2004. “Do Rural Banks Matter? Evidence from the Indian Social Banking Experiment.” CEPR Discussion Paper 4211, Centre for Economic Policy Research, London.
Caprio, G., and P. Honohan. 2001. Finance for Growth: Policy Choices in a Volatile World, World Bank Policy Research Report. New York: Oxford University Press.
Caprio, G., and R. Levine. 2002. “Corporate Governance of Banks: Concepts and International Observation.” Global Corporate Governance Forum, Research Network Meeting, April 5, 2002. Mexico.
Claessens, S. 2005. “Universal Access to Financial Services: A Review of the Issues and Public Policy Objectives.” Policy Research Working Paper 3589, World Bank, Washington, DC.
De la Torre, A. 2002. “Reforming Development Banks: A Framework.” PowerPoint presentation given at the World Bank Staff Workshop on Reforming Public Sector Banks, December, Washington, DC.
27
———. 2005. “Innovative Experiences in Access to Finance: Market Friendly Roles for the Invisible Hand.” Latin America Regional Studies Series, Concept Paper, World Bank, Washington, DC.
De la Torre, A., and S. Schmukler. 2004. “Wither Latin American Capital Markets?” Regional Study, World Bank, Washington DC.
Dinç, I. 2002. “Politicians and Banks—Political Influences on Government-Owned Banks in Emerging Countries.” Ann Arbor, MI: University of Michigan Business School.
Galindo, A., and A. Micco. 2003. “Do State-Owned Banks Promote Growth? Cross-Country Evidence for Manufacturing Industries.” Research Department Working Paper 483, Inter-American Development Bank, Washington, DC.
Gerschenkron, A. 1962. Economic Backwardness in Historical Perspective. Cambridge, MA: Harvard University Press.
Greenwald, B., and J. Stiglitz. 1986. “Externalities in Economies with Imperfect Information and Incomplete Markets.” Quarterly Journal of Economics 101: 229–64.
Inter-American Development Bank, 1995. “Technical Guide for the Analysis of Microenterprises Finance Institutions.” Working Paper Series, Washington DC.
Jensen, M., and W. Meckling. 1976. “Theory of the Firm, Managerial Behavior, Agency Costs, and Ownership Structure.” Journal of Financial Economics 3: 305–60.
Kumar, A. 2005. Access to Financial Services in Brazil: A Study. Directions in Development Series. Washington, DC: World Bank.
Kumar, A., and M. Francisco. 2005. “Enterprise Size, Financing Patterns, and Credit Constraints in Brazil: Analysis of Data from the Investment Climate Assessment Survey.” Working Paper Series 49, World Bank, Washington, DC.
La Porta, R., F. López-de-Silanes, and A. Shleifer. 2002. “Government Ownership of Banks.” Journal of Finance 57: 265–301.
La Porta, R., F. Lopez-de-Silanes, A. Shleifer, and R. W. Vishny. 1999. “The Quality of Government.” Journal of Law, Economics, and Organization 15: 222–79.
Levine, R. 1997. “Financial Development and Growth: Views and Agenda.” Journal of Economic Literature 35: 688–726.
Levine, R., N. Loayza, and, T. Beck. 2000. “Financial Intermediation and Growth: Causality and Causes.” Journal of Monetary Economics 46 (1): 31–77.
Levy-Yeyati, E., A. Micco, and U. Panizza. 2004. “Should the Government Be in the Banking Business? The Role of State-Owned and Development Banks.” Research
28
Department Working Paper 517, Inter-American Development Bank, Washington, DC.
Lewis, W. A. 1955. The Theory of Economic Growth. Homewood, Ill: Irwin.
Meggison, W., and J. Netter. 2001. “From State to Market: A Survey of Empirical Studies on Privatization.” Journal of Economic Literature 39: 321–89.
Micco, A., and U. Panizza. 2004. “Bank Ownership and Lending Behavior.” Research Department Working Paper 520, Inter-American Development Bank, Washington, DC.
———. 2005. “Public Banks in Latin America.” Background paper prepared for the conference titled Public Banks in Latin America: Myth and Reality. February 25, 2005, Inter-American Development Bank, Washington, DC.
Micco, A., U. Panizza, and M. Yañez. 2004. “Bank Ownership and Performance.” Research Department Working Paper 518, Inter-American Development Bank, Washington, DC.
Myrdal, G. 1960. Beyond the Welfare State: Economic Planning and Its International Implications, New Haven, Connecticut: Yale University Press.
Pagano, M., F. Panetta, and L. Zingales. 1998. “Why Do Companies Go Public? An Empirical Analysis.” Journal of Finance 53: 27–64.
Rajan, R., and L. Zingales. 2001. “Financial Systems, Industrial Structure, and Growth.” Oxford Review of Economic Policy 17(4): 467–82.
———. 2003. “The Great Reversals: The Politics of Financial Development in the 20th Century.” Journal of Financial Economics 69: 5–50.
Sapienza, P. 2002a. “Lending Incentives of State-Owned Banks.” Northwestern University, Evanston, IL, and Centre for Economic Policy Research, London.
———. 2002b. “What Do State-Owned Firms Maximize? Evidence from the Italian Banks.” Discussion Paper 3168, Centre for Economic Policy Research, London.
———. 2004. “The Effects of Government Ownership on Bank Lending.” Journal of Financial Economics 72: 357–84.
Schreiner, M., and J. Yaron. 2001. Development Finance Institutions: Measuring Their Subsidy. Directions in Development Series. Washington, DC: World Bank.
Shleifer, A. 1998. “State Versus Private Ownership.” Journal of Economic Perspectives 12: 133–50.
29
30
Shleifer, A., and R. Vishny. 1994. “Politicians and Firms.” Quarterly Journal of Economics 109: 995–1025.
Stigler, G. 1967. “Imperfection in the Capital Market.” Journal of Political Economy 75: 287–92.
Stiglitz, J. 1994. “The Role of the State in Financial Markets.” Proceedings of the World Bank Annual Conference on Development Economics 1993, pp. 19–52, World Bank, Washington DC.
Stiglitz, J., and A. Weiss. 1981. “Credit Rationing in Markets with Imperfect Information.” American Economic Review 71(3): 393–410.
Townsend, R., and J. Yaron. 2001. “The Credit Risk-Contingency System of an Asian Development Bank.” Economic Perspectives, Federal Reserve Bank of Chicago.
Vogel, R., D. Adams, and J. Marthans. 1997. “Approaches to Rehabilitating Insolvent Government-Owned Banks.” Consulting Assistance on Economic Reform II, Discussion Paper 22, Harvard Institute for International Development, Cambridge.
Yaron, J. 1992a, “Successful Rural Finance Institutions.” Discussion Paper 150, World Bank, Washington, DC.
Yaron, J., B. McDonald, F. Charitonenko. 1998. “Promoting Efficient Rural Intermediation.” The World Bank Research Observer, 13: 147–70.
———. 1992b. “Assessing Development Financial Institutions: A Public Interest Analysis.” Discussion Paper 174, World Bank, Washington, DC.
Yaron, J.2004. “State-Owned Development Financial Institutions (SDFIs): Background, Political Economy, and Performance Assessment.” IADB Conference on Public Banks, February 25, 2005, Inter-American Development Bank, Washington, DC.
———. 2006. “State-Owned Development Finance Institutions (SDFI): The Political Economy and Performance Assessment.” Savings and Development, 30(1): 39-78.
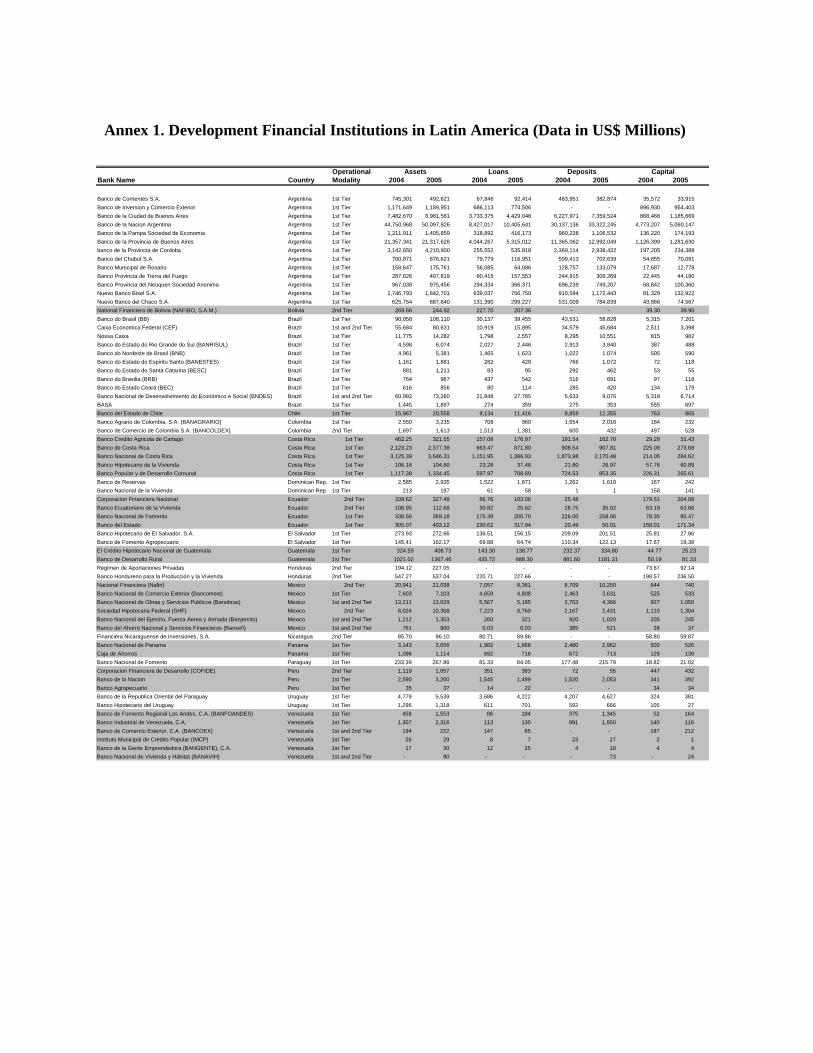
Annex 1. Development Financial Institutions in Latin America (Data in US$ Millions)
Operational Assets Loans Deposits CapitalBank Name Country Modality 2004 2005 2004 2005 2004 2005 2004 2005
Banco de Corrientes S.A. Argentina 1st Tier 745,301 492,621 67,846 92,414 483,951 382,874 35,572 33,915 Banco de Inversion y Comercio Exterior Argentina 1st Tier 1,171,649 1,189,951 686,113 774,506 - - 896,930 954,403 Banco de la Ciudad de Buenos Aires Argentina 1st Tier 7,482,670 8,981,581 3,733,375 4,429,046 6,227,971 7,359,524 868,466 1,185,669 Banco de la Nacion Argentina Argentina 1st Tier 44,750,968 50,097,826 8,427,017 10,405,641 30,137,136 33,322,245 4,773,207 5,060,147 Banco de la Pampa Sociedad de Economia Argentina 1st Tier 1,211,911 1,405,859 318,892 416,173 960,238 1,106,532 136,220 174,193 Banco de la Provincia de Buenos Aires Argentina 1st Tier 21,357,341 21,317,628 4,044,267 5,315,012 11,365,062 12,992,049 1,126,399 1,281,630 banco de la Provincia de Cordoba Argentina 1st Tier 3,142,650 4,210,900 255,552 535,818 2,369,114 2,938,432 197,205 234,388 Banco del Chubut S.A. Argentina 1st Tier 700,871 876,621 79,779 116,951 599,413 702,639 54,855 70,091 Banco Municipal de Rosario Argentina 1st Tier 158,647 175,761 56,085 64,086 128,757 133,079 17,687 12,778 Banco Provincia de Tierra del Fuego Argentina 1st Tier 287,026 407,819 90,415 157,553 244,915 309,269 22,445 44,180 Banco Provincia del Neuquen Sociedad Anonima Argentina 1st Tier 967,038 975,456 294,334 366,371 696,239 749,207 68,842 100,360 Nuevo Banco Bisel S.A. Argentina 1st Tier 1,746,793 1,842,701 639,037 756,750 910,594 1,172,443 81,329 132,922 Nuevo Banco del Chaco S.A. Argentina 1st Tier 625,754 887,840 131,390 299,227 531,009 784,839 43,866 74,567 National Financiera de Bolivia (NAFIBO, S.A.M.) Bolivia 2nd Tier 269.66 244.92 227.70 207.36 - - 39.30 39.90 Banco do Brasil (BB) Brazil 1st Tier 90,058 108,110 30,137 39,455 43,531 58,828 5,315 7,201 Caixa Economica Federal (CEF) Brazil 1st and 2nd Tier 55,684 80,631 10,919 15,895 34,579 45,684 2,511 3,398 Nossa Caixa Brazil 1st Tier 11,775 14,282 1,798 2,557 8,295 10,551 815 982 Banco do Estado do Rio Grande do Sul (BANRISUL) Brazil 1st Tier 4,598 6,074 2,027 2,446 2,913 3,840 387 488 Banco do Nordeste de Brasil (BNB) Brazil 1st Tier 4,961 5,381 1,465 1,623 1,022 1,074 505 590 Banco do Estado do Espiritu Santo (BANESTES) Brazil 1st Tier 1,161 1,881 282 428 766 1,072 72 118 Banco do Estado do Santa Catarina (BESC) Brazil 1st Tier 881 1,211 83 95 292 462 53 55 Banco do Brasilia (BRB) Brazil 1st Tier 764 967 437 542 516 691 97 118 Banco do Estado Ceará (BEC) Brazil 1st Tier 616 856 80 114 285 420 134 179 Banco Nacional de Desenvolvimiento do Económico e Social (BNDES) Brazil 1st and 2nd Tier 60,992 73,260 21,848 27,785 5,633 9,076 5,318 6,714 BASA Brazil 1st Tier 1,445 1,897 274 359 275 353 555 697 Banco del Estado de Chile Chile 1st Tier 15,967 20,558 9,134 11,416 8,859 12,355 763 865 Banco Agrario de Colombia, S.A. (BANAGRARIO) Colombia 1st Tier 2,550 3,235 708 960 1,654 2,016 184 232 Banco de Comercio de Colombia S.A. (BANCOLDEX) Colombia 2nd Tier 1,697 1,613 1,513 1,381 600 432 497 528 Banco Credito Agricola de Cartago Costa Rica 1st Tier 462.25 321.55 157.08 176.97 191.54 162.70 29.29 31.43 Banco de Costa Rica Costa Rica 1st Tier 2,123.23 2,377.38 663.47 871.80 908.54 907.81 225.08 273.68 Banco Nacional de Costa Rica Costa Rica 1st Tier 3,125.39 3,646.31 1,151.95 1,386.93 1,873.98 2,170.48 214.05 284.62 Banco Hipotecario de la Vivienda Costa Rica 1st Tier 106.16 104.60 23.28 37.48 21.80 26.97 57.76 60.89 Banco Popular y de Desarrollo Comunal Costa Rica 1st Tier 1,117.38 1,334.45 597.97 708.69 724.53 853.35 226.31 265.61 Banco de Reservas Dominican Rep. 1st Tier 2,585 2,935 1,522 1,671 1,262 1,610 167 242 Banco Nacional de la Vivienda Dominican Rep. 1st Tier 213 197 61 58 1 1 158 141 Corporacion Financiera Nacional Ecuador 2nd Tier 339.62 327.48 86.76 103.06 25.48 179.51 204.08 Banco Ecuatoriano de la Vivienda Ecuador 2nd Tier 108.95 112.68 30.82 25.62 28.75 35.02 63.19 63.66 Banco Nacional de Fomento Ecuador 1st Tier 338.56 369.18 175.39 200.70 226.00 258.06 78.35 85.47 Banco del Estado Ecuador 1st Tier 305.07 403.12 230.62 317.94 20.49 50.01 158.01 171.34 Banco Hipotecario de El Salvador, S.A. El Salvador 1st Tier 273.93 272.66 136.51 156.15 209.09 201.51 25.81 27.86 Banco de Fomento Agropecuario El Salvador 1st Tier 145.41 162.17 69.88 64.74 110.34 122.13 17.67 19.38 El Crédito Hipotecario Nacional de Guatemala Guatemala 1st Tier 324.59 408.73 143.30 138.77 232.37 334.80 44.77 25.23Banco de Desarrollo Rural Guatemala 1st Tier 1021.02 1367.46 435.72 688.30 881.60 1181.31 50.19 81.33Régimen de Aportaciones Privadas Honduras 2nd Tier 194.12 227.05 - - - - 73.67 92.14 Banco Hondureno para la Producción y la Vivienda Honduras 2nd Tier 547.27 537.04 220.71 227.66 - - 198.57 236.50 Nacional Financiera (Nafin) Mexico 2nd Tier 20,941 21,038 7,057 8,361 8,709 10,250 644 740 Banco Nacional de Comercio Exterior (Bancomext) Mexico 1st Tier 7,603 7,103 4,659 4,808 2,463 3,631 525 533 Banco Nacional de Obras y Servicios Publicos (Banobras) Mexico 1st and 2nd Tier 13,211 13,029 5,567 5,185 3,703 4,366 927 1,050 Sociedad Hipotecaria Federal (SHF) Mexico 2nd Tier 8,024 10,368 7,223 8,769 2,167 2,431 1,110 1,304 Banco Nacional del Ejercito, Fuerza Aerea y Armada (Banjercito) Mexico 1st and 2nd Tier 1,212 1,303 260 321 920 1,020 205 245 Banco del Ahorro Nacional y Servicios Financieros (Bansefi) Mexico 1st and 2nd Tier 761 900 0.03 0.03 385 521 38 37 Financiera Nicaraguense de Inversiones, S.A. Nicaragua 2nd Tier 85.70 96.10 80.71 89.86 - - 58.80 59.87 Banco Nacional de Panama Panama 1st Tier 3,143 3,656 1,982 1,868 2,480 2,962 500 526 Caja de Ahorros Panama 1st Tier 1,096 1,114 692 716 672 713 129 139 Banco Nacional de Fomento Paraguay 1st Tier 233.39 267.86 81.33 84.05 177.48 215.79 18.82 21.02 Corporacion Financiera de Desarrollo (COFIDE) Peru 2nd Tier 1,119 1,057 351 383 72 55 447 432 Banco de la Nacion Peru 1st Tier 2,590 3,200 1,545 1,499 1,520 2,053 341 392 Banco Agropecuario Peru 1st Tier 35 37 14 22 - - 34 34 Banco de la Republica Oriental del Paraguay Uruguay 1st Tier 4,779 5,539 3,686 4,222 4,207 4,627 324 381 Banco Hipotecario del Uruguay Uruguay 1st Tier 1,296 1,318 611 701 592 666 105 27 Banco de Fomento Regional Los Andes, C.A. (BANFOANDES) Venezuela 1st Tier 458 1,553 86 194 375 1,345 52 164 Banco Industrial de Venezuela, C.A. Venezuela 1st Tier 1,307 2,316 113 130 991 1,850 140 116 Banco de Comercio Exterior, C.A. (BANCOEX) Venezuela 1st and 2nd Tier 194 222 147 85 - - 187 212 Instituto Municipal de Crédito Popular (IMCP) Venezuela 1st Tier 26 29 8 7 23 27 2 1 Banco de la Gente Emprendedora (BANGENTE), C.A. Venezuela 1st Tier 17 30 12 25 4 10 4 4 Banco Nacional de Vivienda y Hábitat (BANAVIH) Venezuela 1st and 2nd Tier - 90 - - - 73 - 24
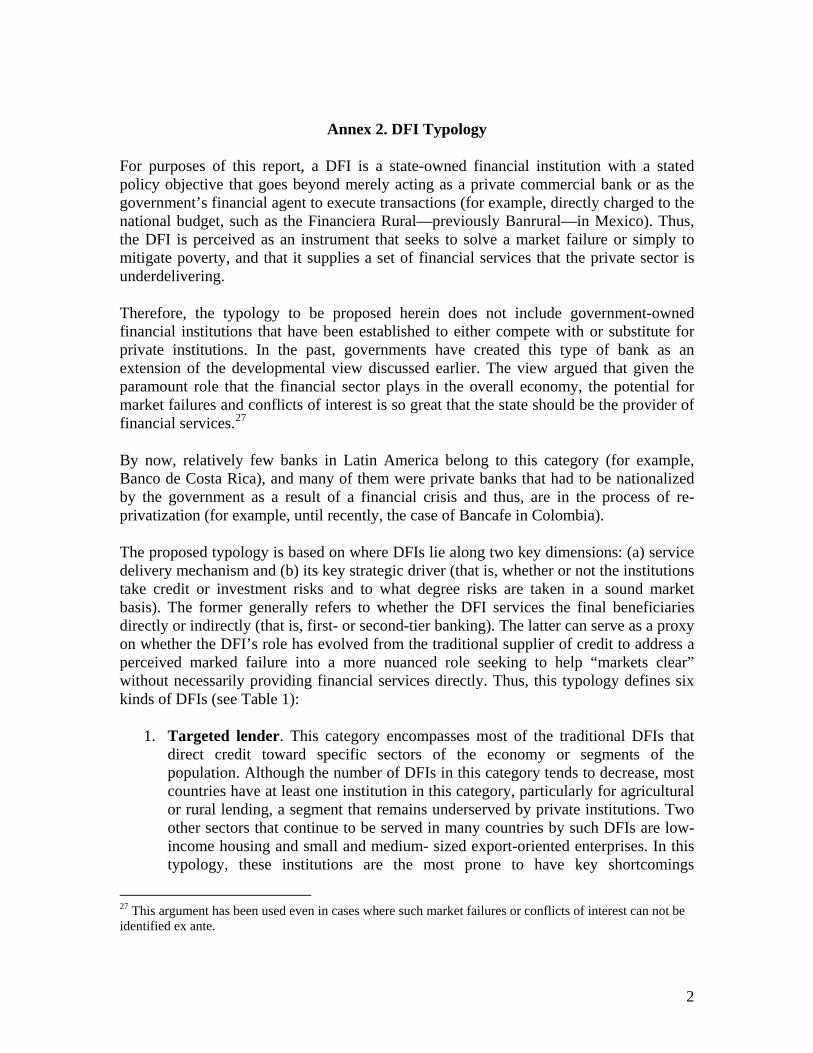
Annex 2. DFI Typology
For purposes of this report, a DFI is a state-owned financial institution with a stated policy objective that goes beyond merely acting as a private commercial bank or as the government’s financial agent to execute transactions (for example, directly charged to the national budget, such as the Financiera Rural—previously Banrural—in Mexico). Thus, the DFI is perceived as an instrument that seeks to solve a market failure or simply to mitigate poverty, and that it supplies a set of financial services that the private sector is underdelivering.
Therefore, the typology to be proposed herein does not include government-owned financial institutions that have been established to either compete with or substitute for private institutions. In the past, governments have created this type of bank as an extension of the developmental view discussed earlier. The view argued that given the paramount role that the financial sector plays in the overall economy, the potential for market failures and conflicts of interest is so great that the state should be the provider of financial services.27
By now, relatively few banks in Latin America belong to this category (for example, Banco de Costa Rica), and many of them were private banks that had to be nationalized by the government as a result of a financial crisis and thus, are in the process of re-privatization (for example, until recently, the case of Bancafe in Colombia).
The proposed typology is based on where DFIs lie along two key dimensions: (a) service delivery mechanism and (b) its key strategic driver (that is, whether or not the institutions take credit or investment risks and to what degree risks are taken in a sound market basis). The former generally refers to whether the DFI services the final beneficiaries directly or indirectly (that is, first- or second-tier banking). The latter can serve as a proxy on whether the DFI’s role has evolved from the traditional supplier of credit to address a perceived marked failure into a more nuanced role seeking to help “markets clear” without necessarily providing financial services directly. Thus, this typology defines six kinds of DFIs (see Table 1):
1. Targeted lender. This category encompasses most of the traditional DFIs that direct credit toward specific sectors of the economy or segments of the population. Although the number of DFIs in this category tends to decrease, most countries have at least one institution in this category, particularly for agricultural or rural lending, a segment that remains underserved by private institutions. Two other sectors that continue to be served in many countries by such DFIs are low-income housing and small and medium- sized export-oriented enterprises. In this typology, these institutions are the most prone to have key shortcomings
27 This argument has been used even in cases where such market failures or conflicts of interest can not be identified ex ante.
2
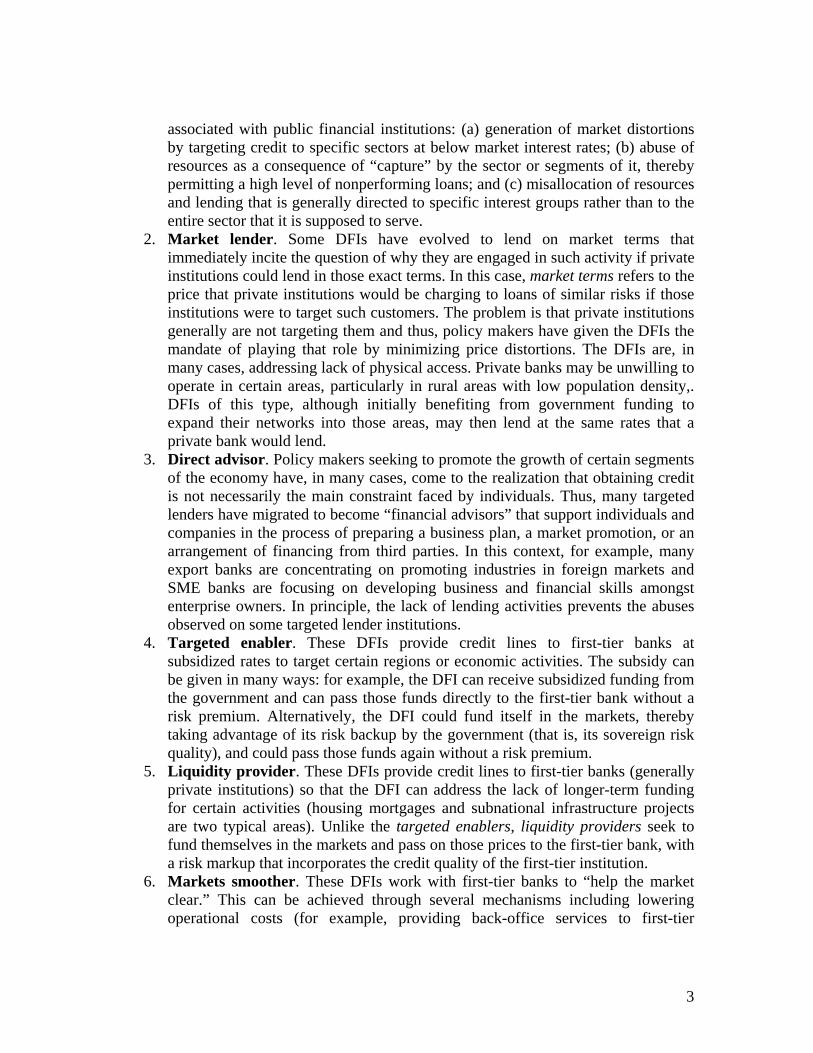
associated with public financial institutions: (a) generation of market distortions by targeting credit to specific sectors at below market interest rates; (b) abuse of resources as a consequence of “capture” by the sector or segments of it, thereby permitting a high level of nonperforming loans; and (c) misallocation of resources and lending that is generally directed to specific interest groups rather than to the entire sector that it is supposed to serve.
2. Market lender. Some DFIs have evolved to lend on market terms that immediately incite the question of why they are engaged in such activity if private institutions could lend in those exact terms. In this case, market terms refers to the price that private institutions would be charging to loans of similar risks if those institutions were to target such customers. The problem is that private institutions generally are not targeting them and thus, policy makers have given the DFIs the mandate of playing that role by minimizing price distortions. The DFIs are, in many cases, addressing lack of physical access. Private banks may be unwilling to operate in certain areas, particularly in rural areas with low population density,. DFIs of this type, although initially benefiting from government funding to expand their networks into those areas, may then lend at the same rates that a private bank would lend.
3. Direct advisor. Policy makers seeking to promote the growth of certain segments of the economy have, in many cases, come to the realization that obtaining credit is not necessarily the main constraint faced by individuals. Thus, many targeted lenders have migrated to become “financial advisors” that support individuals and companies in the process of preparing a business plan, a market promotion, or an arrangement of financing from third parties. In this context, for example, many export banks are concentrating on promoting industries in foreign markets and SME banks are focusing on developing business and financial skills amongst enterprise owners. In principle, the lack of lending activities prevents the abuses observed on some targeted lender institutions.
4. Targeted enabler. These DFIs provide credit lines to first-tier banks at subsidized rates to target certain regions or economic activities. The subsidy can be given in many ways: for example, the DFI can receive subsidized funding from the government and can pass those funds directly to the first-tier bank without a risk premium. Alternatively, the DFI could fund itself in the markets, thereby taking advantage of its risk backup by the government (that is, its sovereign risk quality), and could pass those funds again without a risk premium.
5. Liquidity provider. These DFIs provide credit lines to first-tier banks (generally private institutions) so that the DFI can address the lack of longer-term funding for certain activities (housing mortgages and subnational infrastructure projects are two typical areas). Unlike the targeted enablers, liquidity providers seek to fund themselves in the markets and pass on those prices to the first-tier bank, with a risk markup that incorporates the credit quality of the first-tier institution.
6. Markets smoother. These DFIs work with first-tier banks to “help the market clear.” This can be achieved through several mechanisms including lowering operational costs (for example, providing back-office services to first-tier
3
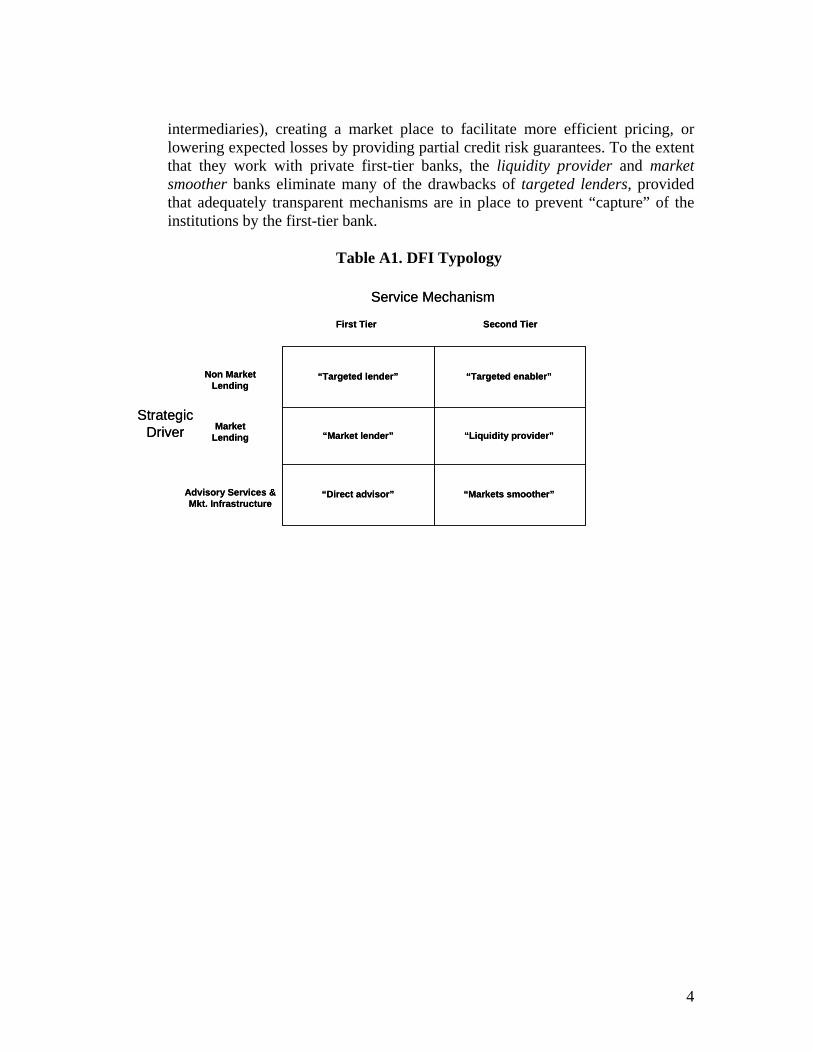
intermediaries), creating a market place to facilitate more efficient pricing, or lowering expected losses by providing partial credit risk guarantees. To the extent that they work with private first-tier banks, the liquidity provider and market smoother banks eliminate many of the drawbacks of targeted lenders, provided that adequately transparent mechanisms are in place to prevent “capture” of the institutions by the first-tier bank.
Table A1. DFI Typology
Service Mechanism
StrategicDriver
Non MarketLending
MarketLending
Advisory Services &Mkt. Infrastructure
First Tier Second Tier
“Targeted lender”
“Market lender”
“Direct advisor”
“Targeted enabler”
“Liquidity provider”
“Markets smoother”
Service Mechanism
StrategicDriver
Non MarketLending
MarketLending
Advisory Services &Mkt. Infrastructure
First Tier Second Tier
“Targeted lender”
“Market lender”
“Direct advisor”
“Targeted enabler”
“Liquidity provider”
“Markets smoother”
4
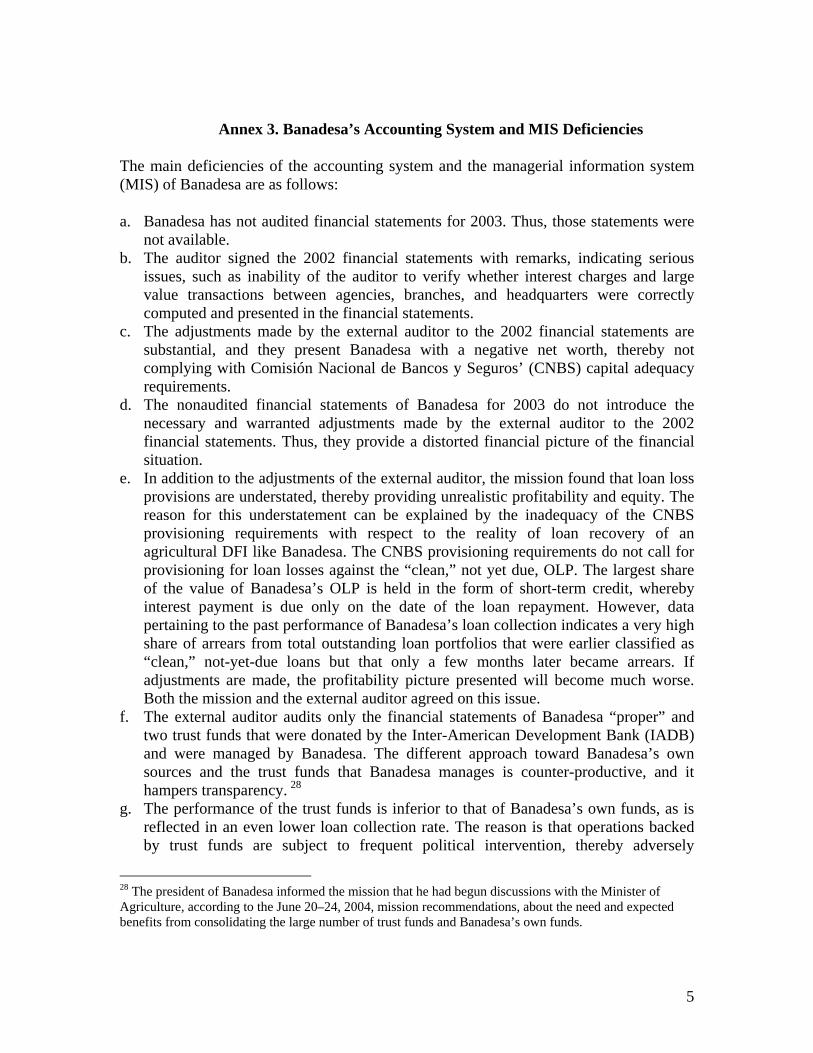
Annex 3. Banadesa’s Accounting System and MIS Deficiencies
The main deficiencies of the accounting system and the managerial information system (MIS) of Banadesa are as follows:
a. Banadesa has not audited financial statements for 2003. Thus, those statements were not available.
b. The auditor signed the 2002 financial statements with remarks, indicating serious issues, such as inability of the auditor to verify whether interest charges and large value transactions between agencies, branches, and headquarters were correctly computed and presented in the financial statements.
c. The adjustments made by the external auditor to the 2002 financial statements are substantial, and they present Banadesa with a negative net worth, thereby not complying with Comisión Nacional de Bancos y Seguros’ (CNBS) capital adequacy requirements.
d. The nonaudited financial statements of Banadesa for 2003 do not introduce the necessary and warranted adjustments made by the external auditor to the 2002 financial statements. Thus, they provide a distorted financial picture of the financial situation.
e. In addition to the adjustments of the external auditor, the mission found that loan loss provisions are understated, thereby providing unrealistic profitability and equity. The reason for this understatement can be explained by the inadequacy of the CNBS provisioning requirements with respect to the reality of loan recovery of an agricultural DFI like Banadesa. The CNBS provisioning requirements do not call for provisioning for loan losses against the “clean,” not yet due, OLP. The largest share of the value of Banadesa’s OLP is held in the form of short-term credit, whereby interest payment is due only on the date of the loan repayment. However, data pertaining to the past performance of Banadesa’s loan collection indicates a very high share of arrears from total outstanding loan portfolios that were earlier classified as “clean,” not-yet-due loans but that only a few months later became arrears. If adjustments are made, the profitability picture presented will become much worse. Both the mission and the external auditor agreed on this issue.
f. The external auditor audits only the financial statements of Banadesa “proper” and two trust funds that were donated by the Inter-American Development Bank (IADB) and were managed by Banadesa. The different approach toward Banadesa’s own sources and the trust funds that Banadesa manages is counter-productive, and it hampers transparency. 28
g. The performance of the trust funds is inferior to that of Banadesa’s own funds, as is reflected in an even lower loan collection rate. The reason is that operations backed by trust funds are subject to frequent political intervention, thereby adversely
28 The president of Banadesa informed the mission that he had begun discussions with the Minister of Agriculture, according to the June 20–24, 2004, mission recommendations, about the need and expected benefits from consolidating the large number of trust funds and Banadesa’s own funds.
5
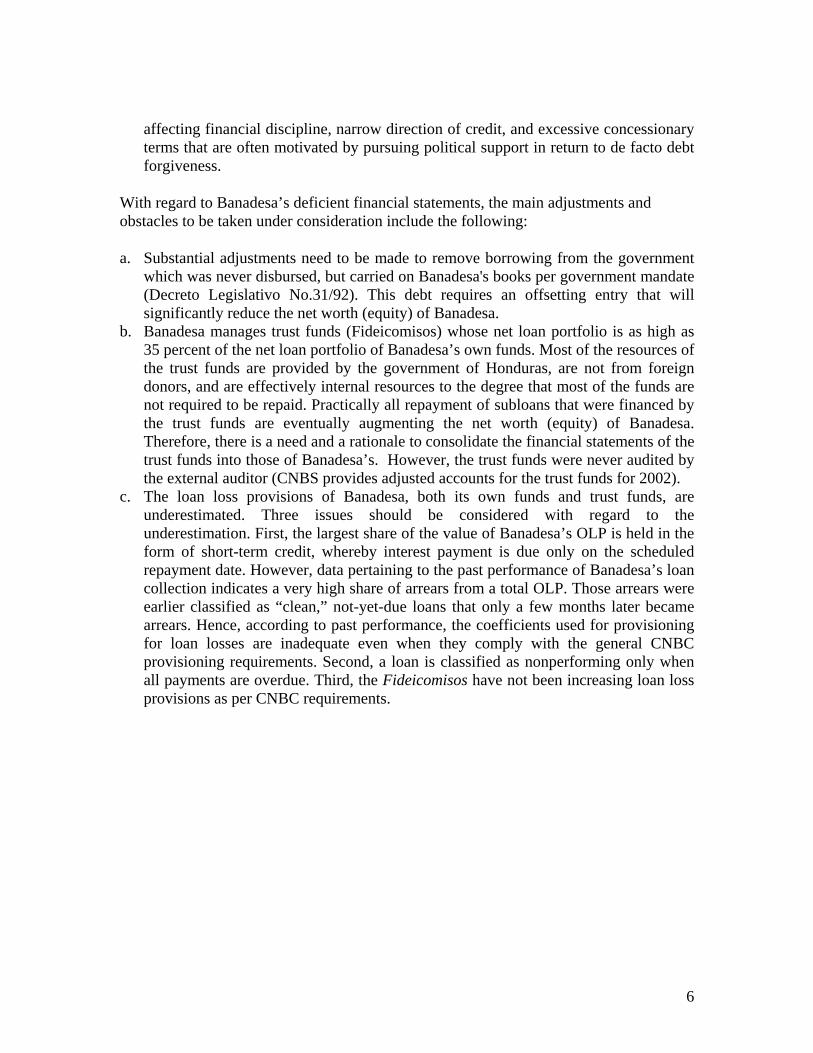
6
affecting financial discipline, narrow direction of credit, and excessive concessionary terms that are often motivated by pursuing political support in return to de facto debt forgiveness.
With regard to Banadesa’s deficient financial statements, the main adjustments and obstacles to be taken under consideration include the following:
a. Substantial adjustments need to be made to remove borrowing from the government which was never disbursed, but carried on Banadesa's books per government mandate (Decreto Legislativo No.31/92). This debt requires an offsetting entry that will significantly reduce the net worth (equity) of Banadesa.
b. Banadesa manages trust funds (Fideicomisos) whose net loan portfolio is as high as 35 percent of the net loan portfolio of Banadesa’s own funds. Most of the resources of the trust funds are provided by the government of Honduras, are not from foreign donors, and are effectively internal resources to the degree that most of the funds are not required to be repaid. Practically all repayment of subloans that were financed by the trust funds are eventually augmenting the net worth (equity) of Banadesa. Therefore, there is a need and a rationale to consolidate the financial statements of the trust funds into those of Banadesa’s. However, the trust funds were never audited by the external auditor (CNBS provides adjusted accounts for the trust funds for 2002).
c. The loan loss provisions of Banadesa, both its own funds and trust funds, are underestimated. Three issues should be considered with regard to the underestimation. First, the largest share of the value of Banadesa’s OLP is held in the form of short-term credit, whereby interest payment is due only on the scheduled repayment date. However, data pertaining to the past performance of Banadesa’s loan collection indicates a very high share of arrears from a total OLP. Those arrears were earlier classified as “clean,” not-yet-due loans that only a few months later became arrears. Hence, according to past performance, the coefficients used for provisioning for loan losses are inadequate even when they comply with the general CNBC provisioning requirements. Second, a loan is classified as nonperforming only when all payments are overdue. Third, the Fideicomisos have not been increasing loan loss provisions as per CNBC requirements.