Embed Size (px)
Citation preview

Lisbon, 2018 • www.bportugal.pt
Working Papers 2018
SEPTEMBER 2018 The analyses, opinions and findings of these papers representthe views of the authors, they are not necessarily those of the
Banco de Portugal or the Eurosystem
Please address correspondence toBanco de Portugal, Economics and Research Department
Av. Almirante Reis, 71, 1150-012 Lisboa, PortugalTel.: +351 213 130 000, email: [email protected]
19To ask or not to ask?
Collateral versus screening in lending
relationships
Hans Degryse | Artashes Karapetyan Sudipto Karmakar

Working Papers | Lisbon 2018 • Banco de Portugal Av. Almirante Reis, 71 | 1150-012 Lisboa • www.bportugal.pt •
Edition Economics and Research Department • ISBN (online) 978-989-678-608-3 • ISSN (online) 2182-0422
To Ask or Not To Ask? Collateral versus
Screening in Lending Relationships
Hans DegryseKU Leuven and CEPR
Artashes KarapetyanBI Norwegian Business School
Sudipto KarmakarBanco de Portugal, UECE, and REM
Acknowledgements: We would like to thank Nuno Alves, Christoph Bertsch, Diana
Bon�m, Geraldo Cerqueiro, Mathias E�ng, Leonardo Gambacorta, Vasso Ioannidou,
David Martinez-Miera, Lars Norden, Steven Ongena, José Rosas, Kasper Roszbach,
Silvina Rubio, Pedro Santos, Erik von Schedvin, and seminar participants at the Banque
de France/TSE Workshop on Financial Structure, 11th Swiss Winter Conference on
Financial Intermediation Lenzerheide, the Bundesbank Bank Business Model conference,
EFI Workshop in Brussels, Riksbank, University of Bonn, Bank of Portugal, Vienna, UC3M,
Maastricht and the University of Lille 2 for helpful discussions and comments. Hans Degryse
gratefully acknowledges FWO and the KU Leuven through a C1 grant for �nancial support.
The views expressed are those of the authors and not necessarily those of the Bank of
Portugal or the Eurosystem.
E-mail: [email protected]; [email protected];
Working Papers 2
Abstract
We study the impact of higher capital requirements on banks' decisions to grant
collateralized rather than uncollateralized loans. We exploit the 2011 EBA capital exercise,
a quasi-natural experiment that required a number of banks to increase their regulatory
capital but not others. This experiment makes secured lending more attractive vis-à-
vis unsecured lending for the a�ected banks as secured loans require less regulatory
capital. Using a loan-level dataset covering all corporate loans in Portugal, we identify
a novel channel of tighter capital requirements: relative to the control group and after
the shock, treated banks require loans more often to be collateralized but less so for
relationship borrowers. We further �nd this impact is stronger for collateral that saves
more on regulatory capital.
JEL: G21, G28, G32
3 To Ask or Not To Ask? Collateral versus Screening in Lending Relationships
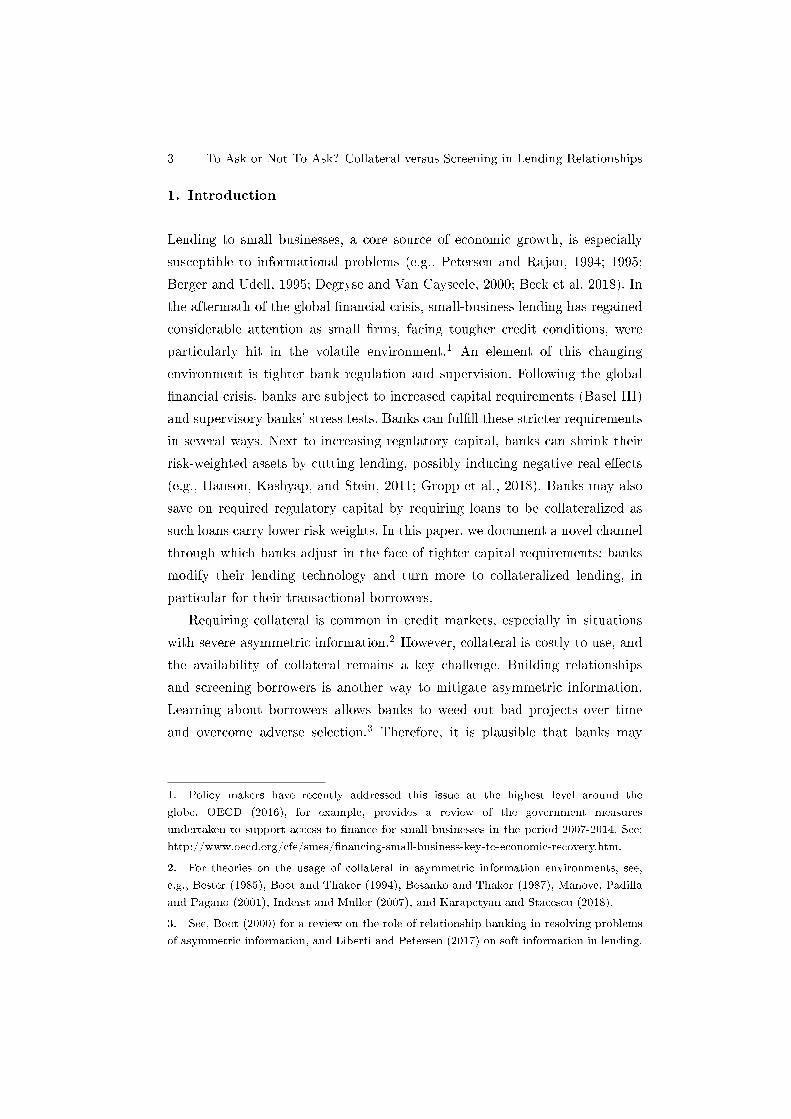
1. Introduction
Lending to small businesses, a core source of economic growth, is especially
susceptible to informational problems (e.g., Petersen and Rajan, 1994; 1995;
Berger and Udell, 1995; Degryse and Van Cayseele, 2000; Beck et al. 2018). In
the aftermath of the global �nancial crisis, small-business lending has regained
considerable attention as small �rms, facing tougher credit conditions, were
particularly hit in the volatile environment.1 An element of this changing
environment is tighter bank regulation and supervision. Following the global
�nancial crisis, banks are subject to increased capital requirements (Basel III)
and supervisory banks' stress tests. Banks can ful�ll these stricter requirements
in several ways. Next to increasing regulatory capital, banks can shrink their
risk-weighted assets by cutting lending, possibly inducing negative real e�ects
(e.g., Hanson, Kashyap, and Stein, 2011; Gropp et al., 2018). Banks may also
save on required regulatory capital by requiring loans to be collateralized as
such loans carry lower risk weights. In this paper, we document a novel channel
through which banks adjust in the face of tighter capital requirements: banks
modify their lending technology and turn more to collateralized lending, in
particular for their transactional borrowers.
Requiring collateral is common in credit markets, especially in situations
with severe asymmetric information.2 However, collateral is costly to use, and
the availability of collateral remains a key challenge. Building relationships
and screening borrowers is another way to mitigate asymmetric information.
Learning about borrowers allows banks to weed out bad projects over time
and overcome adverse selection.3 Therefore, it is plausible that banks may
1. Policy makers have recently addressed this issue at the highest level around the
globe. OECD (2016), for example, provides a review of the government measures
undertaken to support access to �nance for small businesses in the period 2007-2014. See:
http://www.oecd.org/cfe/smes/�nancing-small-business-key-to-economic-recovery.htm.
2. For theories on the usage of collateral in asymmetric information environments, see,
e.g., Bester (1985), Boot and Thakor (1994), Besanko and Thakor (1987), Manove, Padilla
and Pagano (2001), Inderst and Muller (2007), and Karapetyan and Stacescu (2018).
3. See, Boot (2000) for a review on the role of relationship banking in resolving problems
of asymmetric information, and Liberti and Petersen (2017) on soft information in lending.
Working Papers 4
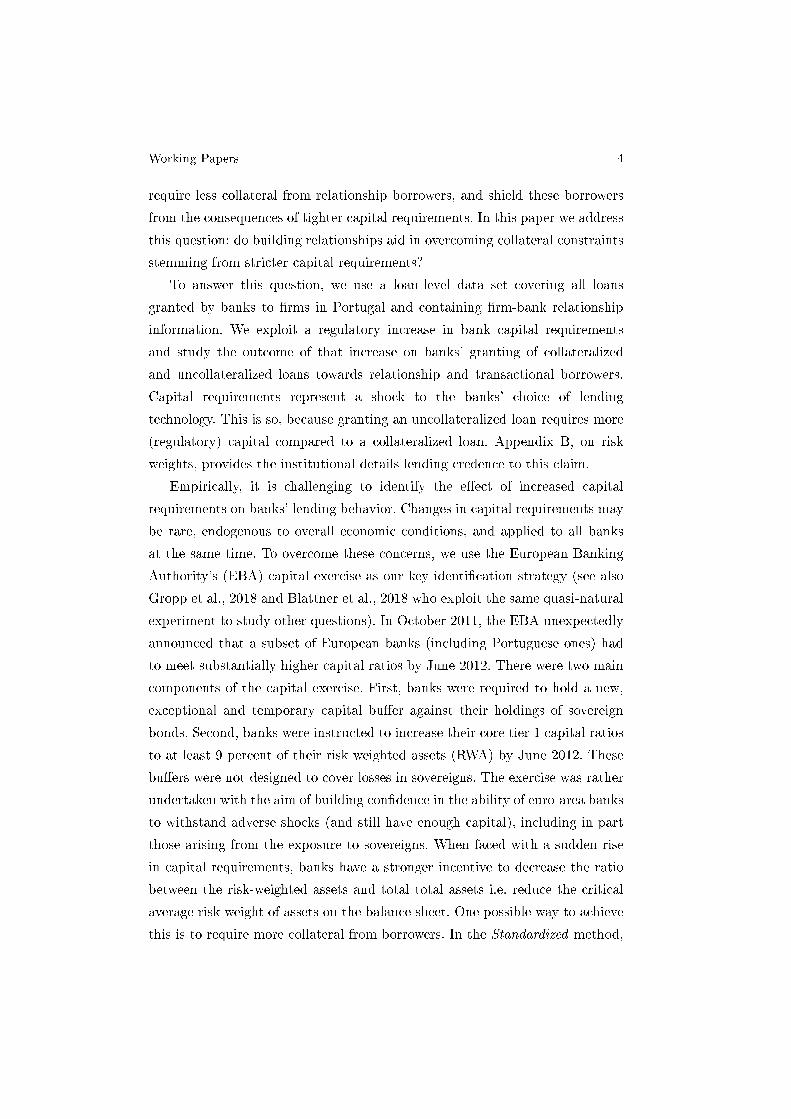
require less collateral from relationship borrowers, and shield these borrowers
from the consequences of tighter capital requirements. In this paper we address
this question: do building relationships aid in overcoming collateral constraints
stemming from stricter capital requirements?
To answer this question, we use a loan-level data set covering all loans
granted by banks to �rms in Portugal and containing �rm-bank relationship
information. We exploit a regulatory increase in bank capital requirements
and study the outcome of that increase on banks' granting of collateralized
and uncollateralized loans towards relationship and transactional borrowers.
Capital requirements represent a shock to the banks' choice of lending
technology. This is so, because granting an uncollateralized loan requires more
(regulatory) capital compared to a collateralized loan. Appendix B, on risk
weights, provides the institutional details lending credence to this claim.
Empirically, it is challenging to identify the e�ect of increased capital
requirements on banks' lending behavior. Changes in capital requirements may
be rare, endogenous to overall economic conditions, and applied to all banks
at the same time. To overcome these concerns, we use the European Banking
Authority's (EBA) capital exercise as our key identi�cation strategy (see also
Gropp et al., 2018 and Blattner et al., 2018 who exploit the same quasi-natural
experiment to study other questions). In October 2011, the EBA unexpectedly
announced that a subset of European banks (including Portuguese ones) had
to meet substantially higher capital ratios by June 2012. There were two main
components of the capital exercise. First, banks were required to hold a new,
exceptional and temporary capital bu�er against their holdings of sovereign
bonds. Second, banks were instructed to increase their core tier 1 capital ratios
to at least 9 percent of their risk weighted assets (RWA) by June 2012. These
bu�ers were not designed to cover losses in sovereigns. The exercise was rather
undertaken with the aim of building con�dence in the ability of euro-area banks
to withstand adverse shocks (and still have enough capital), including in part
those arising from the exposure to sovereigns. When faced with a sudden rise
in capital requirements, banks have a stronger incentive to decrease the ratio
between the risk-weighted assets and total total assets i.e. reduce the critical
average risk weight of assets on the balance sheet. One possible way to achieve
this is to require more collateral from borrowers. In the Standardized method,
5 To Ask or Not To Ask? Collateral versus Screening in Lending Relationships
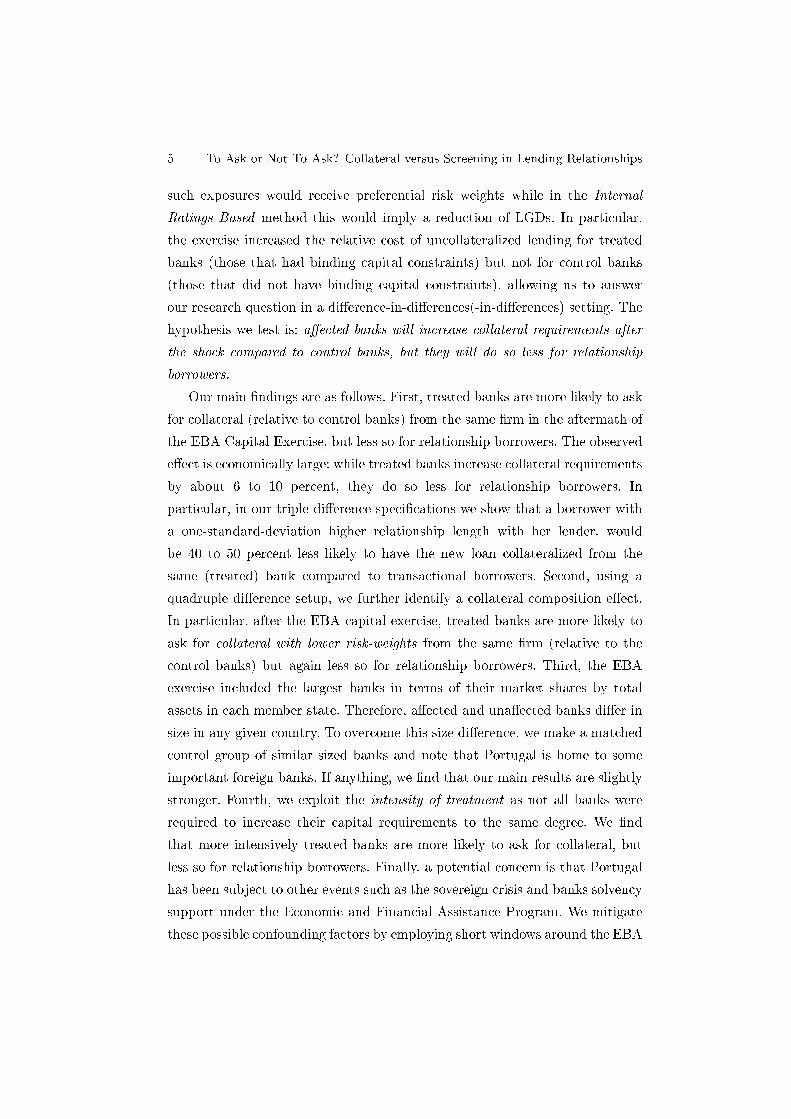
such exposures would receive preferential risk weights while in the Internal
Ratings Based method this would imply a reduction of LGDs. In particular,
the exercise increased the relative cost of uncollateralized lending for treated
banks (those that had binding capital constraints) but not for control banks
(those that did not have binding capital constraints), allowing us to answer
our research question in a di�erence-in-di�erences(-in-di�erences) setting. The
hypothesis we test is: a�ected banks will increase collateral requirements after
the shock compared to control banks, but they will do so less for relationship
borrowers.
Our main �ndings are as follows. First, treated banks are more likely to ask
for collateral (relative to control banks) from the same �rm in the aftermath of
the EBA Capital Exercise, but less so for relationship borrowers. The observed
e�ect is economically large: while treated banks increase collateral requirements
by about 6 to 10 percent, they do so less for relationship borrowers. In
particular, in our triple-di�erence speci�cations we show that a borrower with
a one-standard-deviation higher relationship length with her lender, would
be 40 to 50 percent less likely to have the new loan collateralized from the
same (treated) bank compared to transactional borrowers. Second, using a
quadruple di�erence setup, we further identify a collateral composition e�ect.
In particular, after the EBA capital exercise, treated banks are more likely to
ask for collateral with lower risk-weights from the same �rm (relative to the
control banks) but again less so for relationship borrowers. Third, the EBA
exercise included the largest banks in terms of their market shares by total
assets in each member state. Therefore, a�ected and una�ected banks di�er in
size in any given country. To overcome this size di�erence, we make a matched
control group of similar sized banks and note that Portugal is home to some
important foreign banks. If anything, we �nd that our main results are slightly
stronger. Fourth, we exploit the intensity of treatment as not all banks were
required to increase their capital requirements to the same degree. We �nd
that more intensively treated banks are more likely to ask for collateral, but
less so for relationship borrowers. Finally, a potential concern is that Portugal
has been subject to other events such as the sovereign crisis and banks solvency
support under the Economic and Financial Assistance Program. We mitigate
these possible confounding factors by employing short windows around the EBA

Working Papers 6
capital exercise where confounding factors did not take place, and providing
falsi�cation tests.
Our paper contributes to the literature on relationship banking and
collateral pledging in normal and stress periods.4 There is an extant empirical
literature on how ex ante information asymmetries and observed risk impact the
incidence of pledging collateral (e.g., Berger et al., 2011 and references therein).
Berger, Frame and Ioannidou (2011) employ a nice institutional setting to
disentangle ex ante and ex post frictions and show that unobservably safer
borrowers start with collateralized loan contracts (which provides support for
ex ante collateral theory), while enjoying more and more unsecured credit by
proving their good quality in later stages. More recent studies have focused
on the global �nancial crisis and the bank's role in overcoming frictions (e.g.,
Banerjee et al., 2017, Chodorow-Reich, 2014, Iyer et al., 2014; Ongena et al.,
2015; Bolton et al., 2016; Cingano et al., 2016; Beck et al., 2018). Rather than
focusing on access to funding and the role of banks' heterogeneity, we here focus
on access to unsecured funding, and how relationships a�ect such access after
a shock to their banks' capital requirements. Bolton et al. (2016) develop and
empirically test a model in which relationship banks gather costly information
about their borrowers, which allows them to provide more informed loans to
pro�table �rms during a crisis. Due to an interplay between costly information
acquisition and competition, relationship loans are costlier in normal times,
but cheaper during crises times. Thus, the study rationalizes a distinct role of
relationship banks providing cheaper access at harder times. Instead, we focus
on collateral, rather than the interest cost of the loan, and provide evidence for
easier access to unsecured funding at distress times for relationship borrowers.
Closest to our work, Gropp et al. (2018) study the impact of higher capital
requirements in the EBA capital exercise and show that banks reach a higher
capital ratio by reducing their credit supply (rather than raising new equity).
Analyzing increased capital requirements in Norway, Juelsrud and Wold (2018)
use banks' �nancial statements to show that low capitalized banks decrease
credit growth to �rms but not to households, eventually reducing credit growth
4. For a review, see Boot, 2000; Degryse, Kim and Ongena, 2009; Kysucky and Norden,
2016, among others.

7 To Ask or Not To Ask? Collateral versus Screening in Lending Relationships
at the �rm-level.5 Instead, we focus on the collateral requirements of a new
credit at the loan level conditional on a new loan being granted. Thus, our
study shows, that apart from increasing equity or decreasing credit, banks
can use a third channel to meet increased regulatory capital requirements:
exploiting variation in risk weights. To the best of our knowledge this channel
has previously not been documented.
The rest of the paper is organized as follows: Section 2 provides details on
the EBA capital exercise and formulates our hypotheses. Section 3 describes
the data and the methodology used to construct some of our key variables
for the analysis. Section 4 presents the empirical analysis of the impact of the
EBA capital exercise. Section 5 presents several robustness checks. Section 6
concludes.
2. The EBA Capital Exercise
2.1. The Event
On October 26, 2011 the European Banking Authority (EBA) announced
that major European banks would have to strengthen their regulatory capital
positions. First, banks were required to hold a new, exceptional and temporary
capital bu�er to cover risks linked to their holdings of sovereign bonds. Second,
banks were also required to hold an additional temporary capital bu�er,
increasing their core tier 1 (CT1) capital ratios to at least 9 percent of their
risk-weighted assets (RWA) by June 2012. These bu�ers were not designed to
cover losses in sovereigns. The exercise was rather undertaken with the aim
of building con�dence in the ability of euro-area banks to withstand adverse
shocks (and still have enough capital), including in part those arising from
the exposure to sovereigns. The bu�er against the sovereign exposure would
be based on the market prices of repective sovereign bonds, as of the 30th of
September.
5. A number of other studies have analyzed the credit supply implications of increased
capital requirements or increased cost of equity. See Fraisse et al. (2015), Aiyar et al.(2014),
Célérier et al. (2016) among others.
Working Papers 8
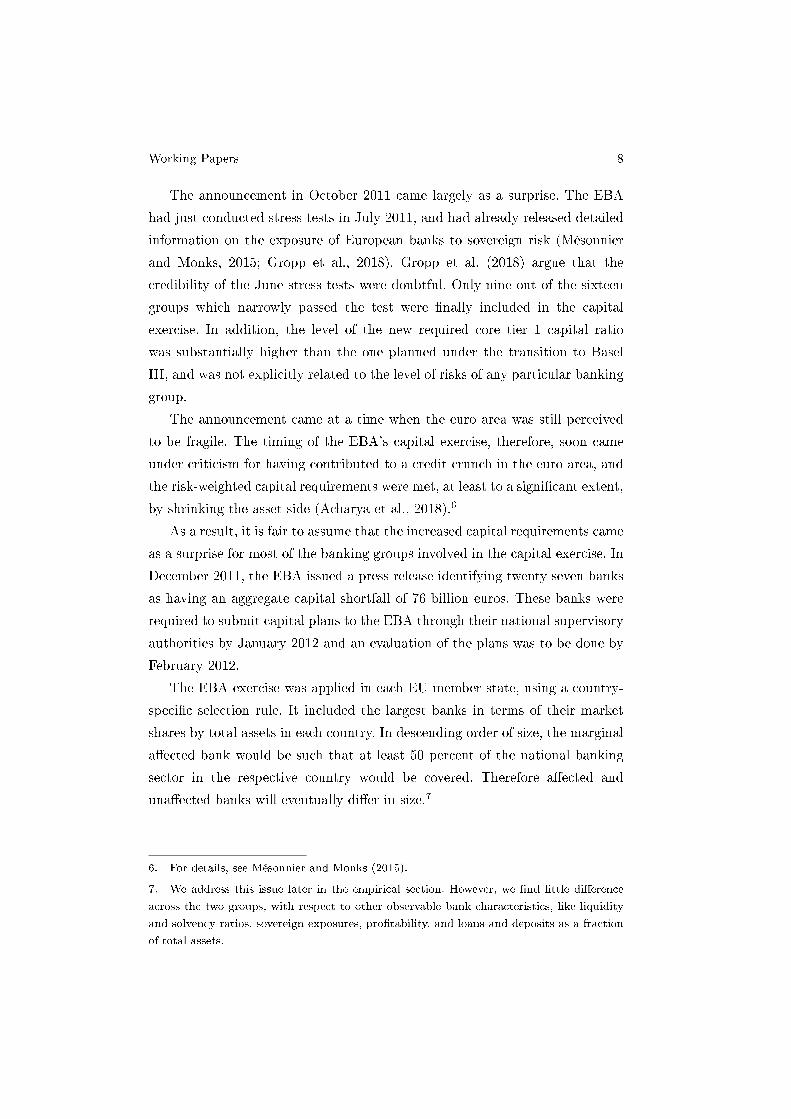
The announcement in October 2011 came largely as a surprise. The EBA
had just conducted stress tests in July 2011, and had already released detailed
information on the exposure of European banks to sovereign risk (Mésonnier
and Monks, 2015; Gropp et al., 2018). Gropp et al. (2018) argue that the
credibility of the June stress tests were doubtful. Only nine out of the sixteen
groups which narrowly passed the test were �nally included in the capital
exercise. In addition, the level of the new required core tier 1 capital ratio
was substantially higher than the one planned under the transition to Basel
III, and was not explicitly related to the level of risks of any particular banking
group.
The announcement came at a time when the euro area was still perceived
to be fragile. The timing of the EBA's capital exercise, therefore, soon came
under criticism for having contributed to a credit crunch in the euro area, and
the risk-weighted capital requirements were met, at least to a signi�cant extent,
by shrinking the asset side (Acharya et al., 2018).6
As a result, it is fair to assume that the increased capital requirements came
as a surprise for most of the banking groups involved in the capital exercise. In
December 2011, the EBA issued a press release identifying twenty seven banks
as having an aggregate capital shortfall of 76 billion euros. These banks were
required to submit capital plans to the EBA through their national supervisory
authorities by January 2012 and an evaluation of the plans was to be done by
February 2012.
The EBA exercise was applied in each EU member state, using a country-
speci�c selection rule. It included the largest banks in terms of their market
shares by total assets in each country. In descending order of size, the marginal
a�ected bank would be such that at least 50 percent of the national banking
sector in the respective country would be covered. Therefore a�ected and
una�ected banks will eventually di�er in size.7
6. For details, see Mésonnier and Monks (2015).
7. We address this issue later in the empirical section. However, we �nd little di�erence
across the two groups, with respect to other observable bank characteristics, like liquidity
and solvency ratios, sovereign exposures, pro�tability, and loans and deposits as a fraction
of total assets.
9 To Ask or Not To Ask? Collateral versus Screening in Lending Relationships
In the Portuguese context, owing to the presence of many small �rms,
the banking system is one of the most important sources of credit. There are
about 180 credit granting institutions in Portugal which can be grouped into 33
banking groups. The largest 8 banking groups account for about 82 percent of
loans, to non-�nancial corporations, varying marginally from year to year. Four
out of the eight biggest banking groups were required to increase their capital
ratios in the EBA capital exercise. The total capital shortfall (after including
the sovereign capital bu�er) for all banks operating in Portugal stood at 6,950
million euros which is roughly 6.06 percent of the aggregate shortfall in the
euro-area. This amount of shortfall was roughly equal to 22 percent of total
capital or 30 percent of core tier1 capital (as of 2011:Q2) of a�ected banks.
Gropp et al. (2018) argue that exposed banks aimed to comply with the higher
capital ratios without raising costly new capital.8
2.2. Hypotheses
We formulate two hypotheses related to the quasi-natural experiment induced
by the EBA capital exercise. Our �rst hypothesis relates the impact of the
EBA capital exercise on the granting of collateralized loans for relationship
versus transactional borrowers at treated and control banks. We formulate
our hypothesis based on the impact the quasi-natural experiment has on
banks' relative cost of extending collateralized versus unsecured loans. In
general, collateralized loans have lower risk weights in line with the actual
implementation of regulation. In our context this means that bank-�rm
exposures secured by collateral require less regulatory capital than unsecured
exposures. This observation is key, since it then makes extending collateral-
based loans cheaper relative to screening-based loans, to the extent that equity
is costlier for the banks than debt. It will therefore increase banks' incentive to
require collateral on a new loan.
To see why this is so, note �rst that in the standardized approach (the
system used by the majority of Portuguese banks) secured exposures receive a
8. Refer: (http://www.eba.europa.eu/risk-analysis-and-data/eu-capital-exercise) and
related documents listed therein for further details.
Working Papers 10
preferential risk weight. For instance, exposures secured by immovable property,
such as residential real estate and commercial immovable property, bene�t
from preferential risk-weights (see Directive 2006/48/EC (the original CRD)).
Furthermore, in the internal ratings-based approach a lower probability of
default and loss-given default can be assigned to collateralized loans.9
Will the a�ected banks then (at least partially) meet the increased capital
requirements by modifying their lending technology and giving preference to
secured lending after the implementation of the exercise? If so, this would be
re�ected in the granting of collateralized loans rather than uncollateralized ones
for those banks who were identi�ed to have a shortfall and must increase capital
ratios - the treated banks, (denoted by dummyebabank). Furthermore, as the use
of screening is less costly for relationship borrowers, we hypothesize that the
increase in collateral requirements, after the capital exercise, will take place by
treated banks, but only to a muted extent for the relationship borrowers. This
leads us to our �rst hypothesis (H1):
H1: Following the capital exercise, the loans granted by treated banks are
more likely to be collateralized than those by the control banks, but less so for
relationship borrowers.
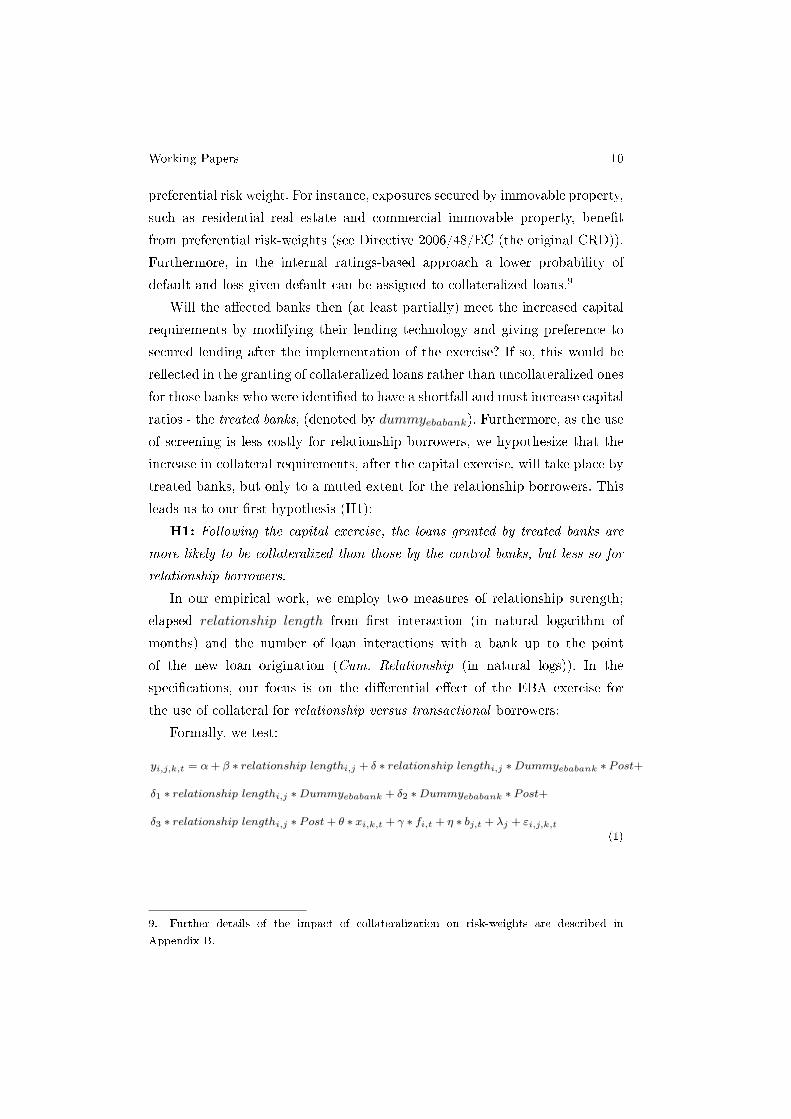
In our empirical work, we employ two measures of relationship strength;
elapsed relationship length from �rst interaction (in natural logarithm of
months) and the number of loan interactions with a bank up to the point
of the new loan origination (Cum. Relationship (in natural logs)). In the
speci�cations, our focus is on the di�erential e�ect of the EBA exercise for
the use of collateral for relationship versus transactional borrowers:
Formally, we test:
yi,j,k,t = α+ β ∗ relationship lengthi,j + δ ∗ relationship lengthi,j ∗Dummyebabank ∗ Post+
δ1 ∗ relationship lengthi,j ∗Dummyebabank + δ2 ∗Dummyebabank ∗ Post+
δ3 ∗ relationship lengthi,j ∗ Post+ θ ∗ xi,k,t + γ ∗ fi,t + η ∗ bj,t + λj + εi,j,k,t(1)
9. Further details of the impact of collateralization on risk-weights are described in
Appendix B.
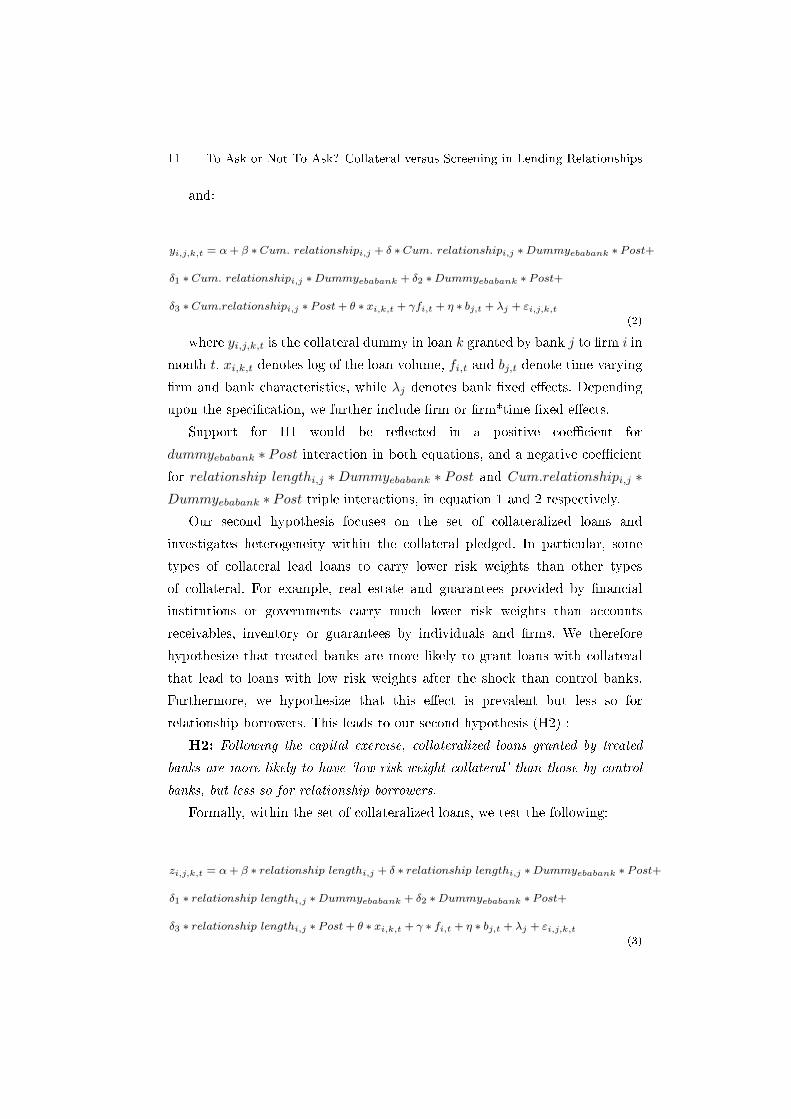
11 To Ask or Not To Ask? Collateral versus Screening in Lending Relationships
and:
yi,j,k,t = α+ β ∗Cum. relationshipi,j + δ ∗Cum. relationshipi,j ∗Dummyebabank ∗ Post+
δ1 ∗Cum. relationshipi,j ∗Dummyebabank + δ2 ∗Dummyebabank ∗ Post+
δ3 ∗Cum.relationshipi,j ∗ Post+ θ ∗ xi,k,t + γfi,t + η ∗ bj,t + λj + εi,j,k,t(2)
where yi,j,k,t is the collateral dummy in loan k granted by bank j to �rm i in
month t. xi,k,t denotes log of the loan volume, fi,t and bj,t denote time-varying
�rm and bank characteristics, while λj denotes bank �xed e�ects. Depending
upon the speci�cation, we further include �rm or �rm*time �xed e�ects.
Support for H1 would be re�ected in a positive coe�cient for
dummyebabank ∗ Post interaction in both equations, and a negative coe�cient
for relationship lengthi,j ∗Dummyebabank ∗ Post and Cum.relationshipi,j ∗Dummyebabank ∗ Post triple interactions, in equation 1 and 2 respectively.
Our second hypothesis focuses on the set of collateralized loans and
investigates heterogeneity within the collateral pledged. In particular, some
types of collateral lead loans to carry lower risk weights than other types
of collateral. For example, real estate and guarantees provided by �nancial
institutions or governments carry much lower risk weights than accounts
receivables, inventory or guarantees by individuals and �rms. We therefore
hypothesize that treated banks are more likely to grant loans with collateral
that lead to loans with low risk weights after the shock than control banks.
Furthermore, we hypothesize that this e�ect is prevalent but less so for
relationship borrowers. This leads to our second hypothesis (H2) :
H2: Following the capital exercise, collateralized loans granted by treated
banks are more likely to have `low-risk-weight collateral' than those by control
banks, but less so for relationship borrowers.
Formally, within the set of collateralized loans, we test the following:
zi,j,k,t = α+ β ∗ relationship lengthi,j + δ ∗ relationship lengthi,j ∗Dummyebabank ∗ Post+
δ1 ∗ relationship lengthi,j ∗Dummyebabank + δ2 ∗Dummyebabank ∗ Post+
δ3 ∗ relationship lengthi,j ∗ Post+ θ ∗ xi,k,t + γ ∗ fi,t + η ∗ bj,t + λj + εi,j,k,t(3)
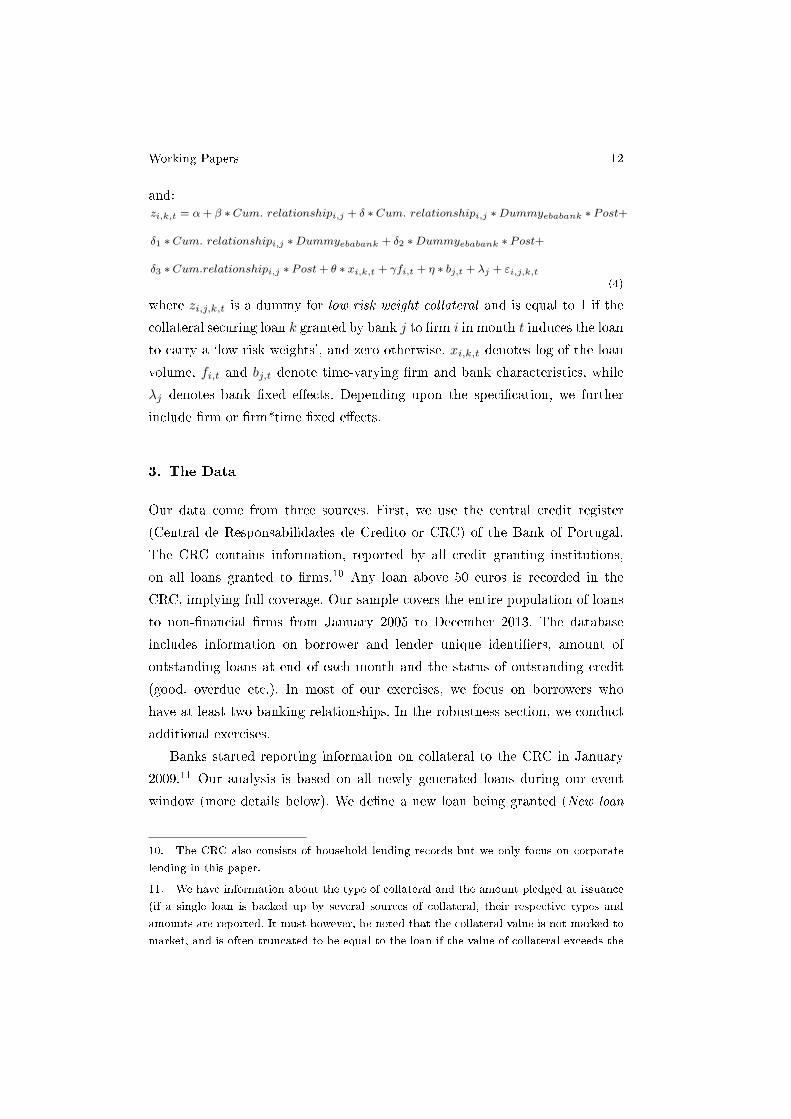
Working Papers 12
and:zi,k,t = α+ β ∗Cum. relationshipi,j + δ ∗Cum. relationshipi,j ∗Dummyebabank ∗ Post+
δ1 ∗Cum. relationshipi,j ∗Dummyebabank + δ2 ∗Dummyebabank ∗ Post+
δ3 ∗Cum.relationshipi,j ∗ Post+ θ ∗ xi,k,t + γfi,t + η ∗ bj,t + λj + εi,j,k,t(4)
where zi,j,k,t is a dummy for low risk weight collateral and is equal to 1 if the
collateral securing loan k granted by bank j to �rm i in month t induces the loan
to carry a `low risk weights', and zero otherwise. xi,k,t denotes log of the loan
volume, fi,t and bj,t denote time-varying �rm and bank characteristics, while
λj denotes bank �xed e�ects. Depending upon the speci�cation, we further
include �rm or �rm*time �xed e�ects.
3. The Data
Our data come from three sources. First, we use the central credit register
(Central de Responsabilidades de Credito or CRC) of the Bank of Portugal.
The CRC contains information, reported by all credit granting institutions,
on all loans granted to �rms.10 Any loan above 50 euros is recorded in the
CRC, implying full coverage. Our sample covers the entire population of loans
to non-�nancial �rms from January 2005 to December 2013. The database
includes information on borrower and lender unique identi�ers, amount of
outstanding loans at end of each month and the status of outstanding credit
(good, overdue etc.). In most of our exercises, we focus on borrowers who
have at least two banking relationships. In the robustness section, we conduct
additional exercises.
Banks started reporting information on collateral to the CRC in January
2009.11 Our analysis is based on all newly generated loans during our event
window (more details below). We de�ne a new loan being granted (New loan
10. The CRC also consists of household lending records but we only focus on corporate
lending in this paper.
11. We have information about the type of collateral and the amount pledged at issuance
(if a single loan is backed up by several sources of collateral, their respective types and
amounts are reported. It must however, be noted that the collateral value is not marked to
market, and is often truncated to be equal to the loan if the value of collateral exceeds the
13 To Ask or Not To Ask? Collateral versus Screening in Lending Relationships
=1 ) by a given bank to a given �rm in any month if we see either a new
bank-�rm relationship, or an increase in the number of loans in a bank-�rm
pair.
We construct two variables to measure a �rm's relationship status. Our �rst
main independent variable is the elapsed time (number of months) since the
�rst interaction between a �rm and a bank, the relationship length. We take
advantage of the long time span of the CRC to build bank-�rm relationship
variables, based on borrowing history, starting from January 2005: this means
that for a bank-�rm interaction during our sample period in, for instance, 2011,
the relationship length is measured using all relationship history from 2005. In
our empirical speci�cations, we use the natural log of relationship length.
The second measure is cumulative relationship (or cum. relationship) -
the relationship strength as proxied by the frequency of interactions up to
the point of origination of the loan under consideration. Unlike relationship
length that measures the time elapsed from �rst interaction until the current
period, the cumulative relationship measure captures the active time between
the parties until the current period. The measure is constructed by counting
the number of times a new loan has been granted, since the �rst interaction.
Thus, for any given point in time, the measure shows the cumulative number
of interactions since the start. This active length may capture better the depth
of the information acquired by the bank. As in the relationship length measure,
this variable is also computed starting in January 2005.
We then combine the CRC database with bank and �rm information. Firm
characteristics such as size, age, pro�tability and industry are taken from the
Central Balance Sheet Database (CBSD), and are available at an annual basis.
This database covers mandatory �nancial statements reported in ful�llment
of �rms' statutory obligations under the Informacao Empresarial Simpli�cada
(Simpli�ed Corporate Information, IES). Information on banks' balance sheet
items (such as total assets and capital and liquidity ratios) is taken from the
loan amount. Furthermore, the reporting requirements for collateral are not uniform across
all �nancial institutions. Therefore, for our analysis, we will only use the information if a
loan is collateralized or not and not the actual value of collateral.
Working Papers 14
Bank of Portugal's Prudential Database (PD). These statistics are reported
monthly.
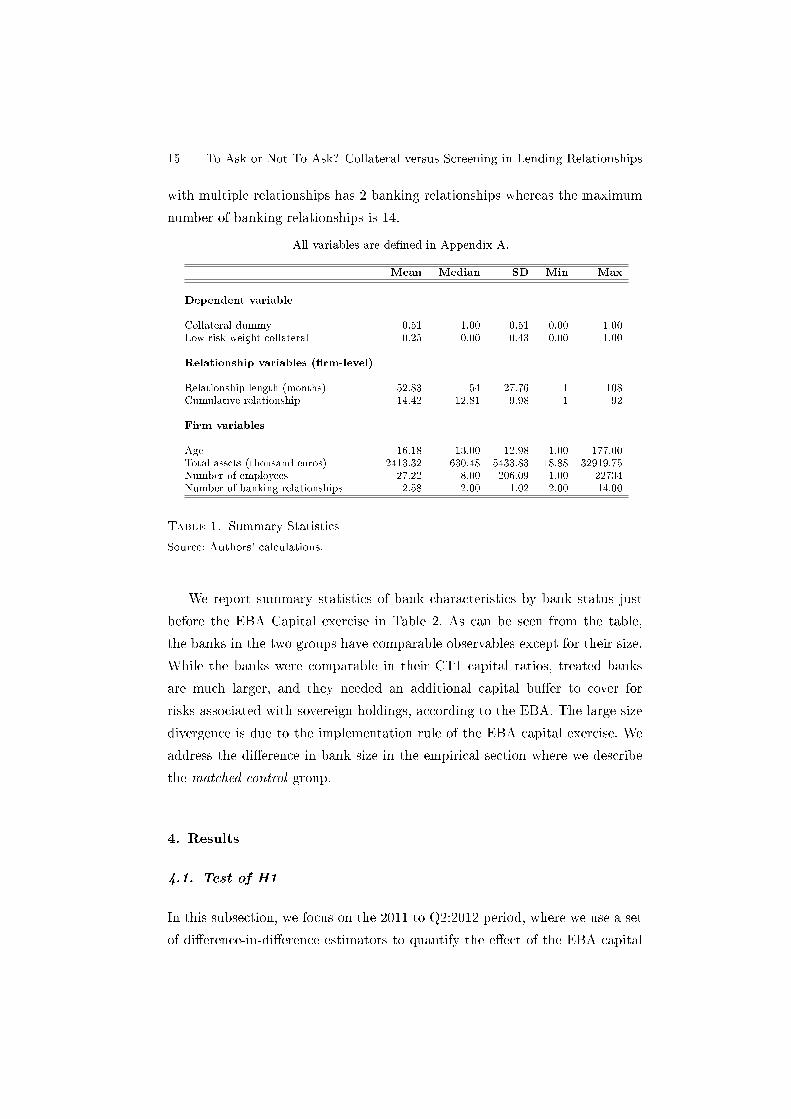
The summary statistics on new loans are provided in Table 1. The
descriptives about the dependent variables and the relationship variables are
for borrowers with at least two banking relationships, and hold for our event
window running from January 2011 to June 2012. Our purpose is to track
collateralization of new loans only. Accordingly, our main dependent variable
- Collateral dummy - is constructed as follows. If a new loan is generated as
above, we count the number of collateralized loans in the current as well as the
previous month. Whenever the number of collateralized loans has increased, we
set the collateral dummy equal to 1 for that particular �rm-bank pair in that
month, and 0 otherwise.12 Table 1 shows that about 51 percent of all new loans
is collateralized. Our second dependent variable low risk weight collateral shows
that 25 percent of all collateralized loans have collateral inducing loans to carry
low risk-weights. The table further shows that the mean cum. relationship and
relationship length, are 14 (interactions) and 53 (months), respectively, with a
high variation in the sample.
The bottom part of the table provides summary statistics for the �rm
speci�c variables measured before the EBA capital exercise. The �rm-level
variables are annual. Firms employ on average about 27 employees, while half
of the �rms employ less than 8 employees. This shows that Portuguese non-
�nancial �rms are mainly small �rms which tend to be more bank dependent.
In our empirical speci�cations we employ the natural logarithm of the number
of employees as proxy for �rm size. Number of banking relationships gives the
number of banks a �rm has a relationship with. The median �rm of �rms
12. One potential concern is that lenders can use existing collateral from an old loan (which
has been nearly repaid) to cross-collateralize a new loan, even when the latter was recorded
unsecured. It should be noted that reporting of the collateral is rather detailed in the Credit
Registry and is broken down into its sources when backed by more than one collateral. A
bank would not have any incentive to report a new loan unsecured when in fact it has
collateral from another loan and if anything, the opposite incentive would be present for
regulatory reasons. Furthermore, legally, banks can only use the collateral for the speci�c
loan under consideration. In Portugal it is not possible to create a �oating charge or �oating
lien which would automatically extend towards all loans.
15 To Ask or Not To Ask? Collateral versus Screening in Lending Relationships
with multiple relationships has 2 banking relationships whereas the maximum
number of banking relationships is 14.
All variables are de�ned in Appendix A.
Mean Median SD Min Max
Dependent variable
Collateral dummy 0.51 1.00 0.51 0.00 1.00Low risk weight collateral 0.25 0.00 0.43 0.00 1.00
Relationship variables (�rm-level)
Relationship length (months) 52.83 54 27.76 1 108Cumulative relationship 14.42 12.81 9.98 1 92
Firm variables
Age 16.18 13.00 12.98 1.00 177.00Total assets (thousand euros) 2413.32 630.48 5433.83 18.88 32919.75Number of employees 27.22 8.00 206.09 1.00 22734Number of banking relationships 2.58 2.00 1.02 2.00 14.00
Table 1. Summary Statistics
Source: Authors' calculations.
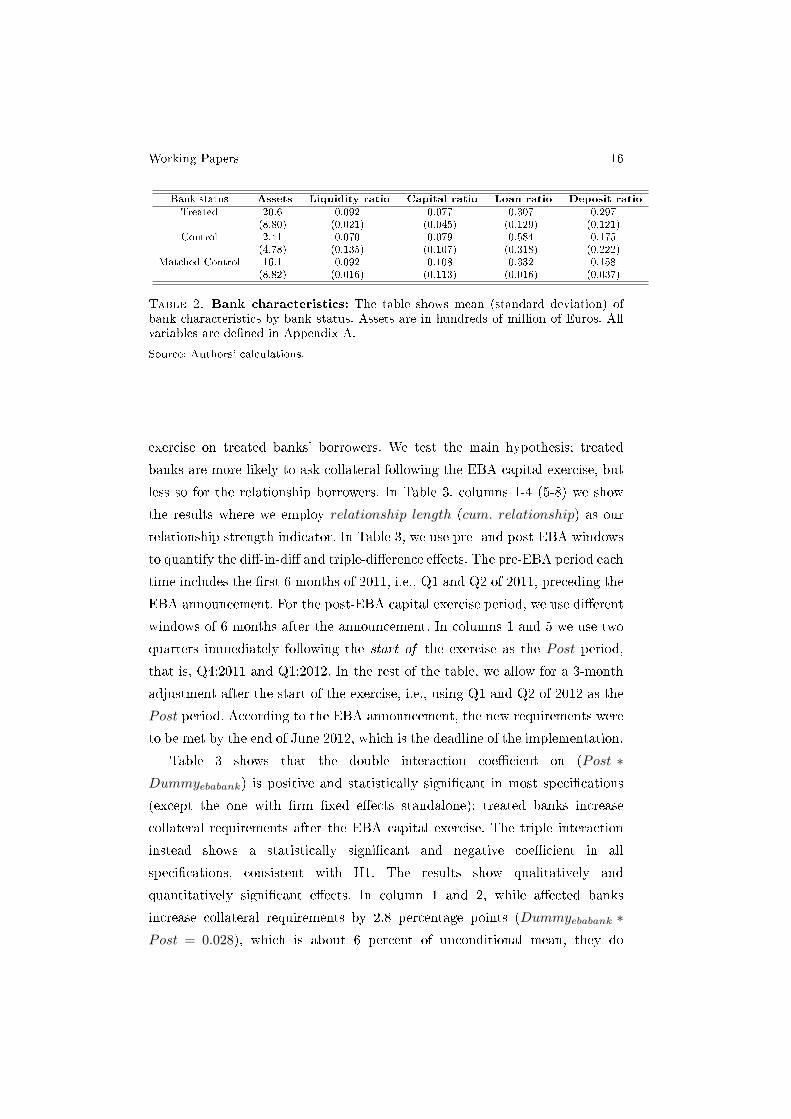
We report summary statistics of bank characteristics by bank status just
before the EBA Capital exercise in Table 2. As can be seen from the table,
the banks in the two groups have comparable observables except for their size.
While the banks were comparable in their CT1 capital ratios, treated banks
are much larger, and they needed an additional capital bu�er to cover for
risks associated with sovereign holdings, according to the EBA. The large size
divergence is due to the implementation rule of the EBA capital exercise. We
address the di�erence in bank size in the empirical section where we describe
the matched control group.
4. Results
4.1. Test of H1
In this subsection, we focus on the 2011 to Q2:2012 period, where we use a set
of di�erence-in-di�erence estimators to quantify the e�ect of the EBA capital
Working Papers 16
Bank status Assets Liquidity ratio Capital ratio Loan ratio Deposit ratioTreated 20.6 0.092 0.077 0.307 0.297
(8.80) (0.021) (0.045) (0.129) (0.121)Control 2.41 0.070 0.079 0.584 0.175
(4.78) (0.135) (0.107) (0.318) (0.222)Matched Control 16.1 0.092 0.108 0.332 0.158
(8.82) (0.016) (0.113) (0.016) (0.037)
Table 2. Bank characteristics: The table shows mean (standard deviation) ofbank characteristics by bank status. Assets are in hundreds of million of Euros. Allvariables are de�ned in Appendix A.
Source: Authors' calculations.
exercise on treated banks' borrowers. We test the main hypothesis; treated
banks are more likely to ask collateral following the EBA capital exercise, but
less so for the relationship borrowers. In Table 3, columns 1-4 (5-8) we show
the results where we employ relationship length (cum. relationship) as our
relationship strength indicator. In Table 3, we use pre- and post-EBA windows
to quantify the di�-in-di� and triple-di�erence e�ects. The pre-EBA period each
time includes the �rst 6 months of 2011, i.e., Q1 and Q2 of 2011, preceding the
EBA announcement. For the post-EBA capital exercise period, we use di�erent
windows of 6 months after the announcement. In columns 1 and 5 we use two
quarters immediately following the start of the exercise as the Post period,
that is, Q4:2011 and Q1:2012. In the rest of the table, we allow for a 3-month
adjustment after the start of the exercise, i.e., using Q1 and Q2 of 2012 as the
Post period. According to the EBA announcement, the new requirements were
to be met by the end of June 2012, which is the deadline of the implementation.
Table 3 shows that the double interaction coe�cient on (Post ∗Dummyebabank) is positive and statistically signi�cant in most speci�cations
(except the one with �rm �xed e�ects standalone): treated banks increase
collateral requirements after the EBA capital exercise. The triple interaction
instead shows a statistically signi�cant and negative coe�cient in all
speci�cations, consistent with H1. The results show qualitatively and
quantitatively signi�cant e�ects. In column 1 and 2, while a�ected banks
increase collateral requirements by 2.8 percentage points (Dummyebabank ∗Post = 0.028), which is about 6 percent of unconditional mean, they do
17 To Ask or Not To Ask? Collateral versus Screening in Lending Relationships
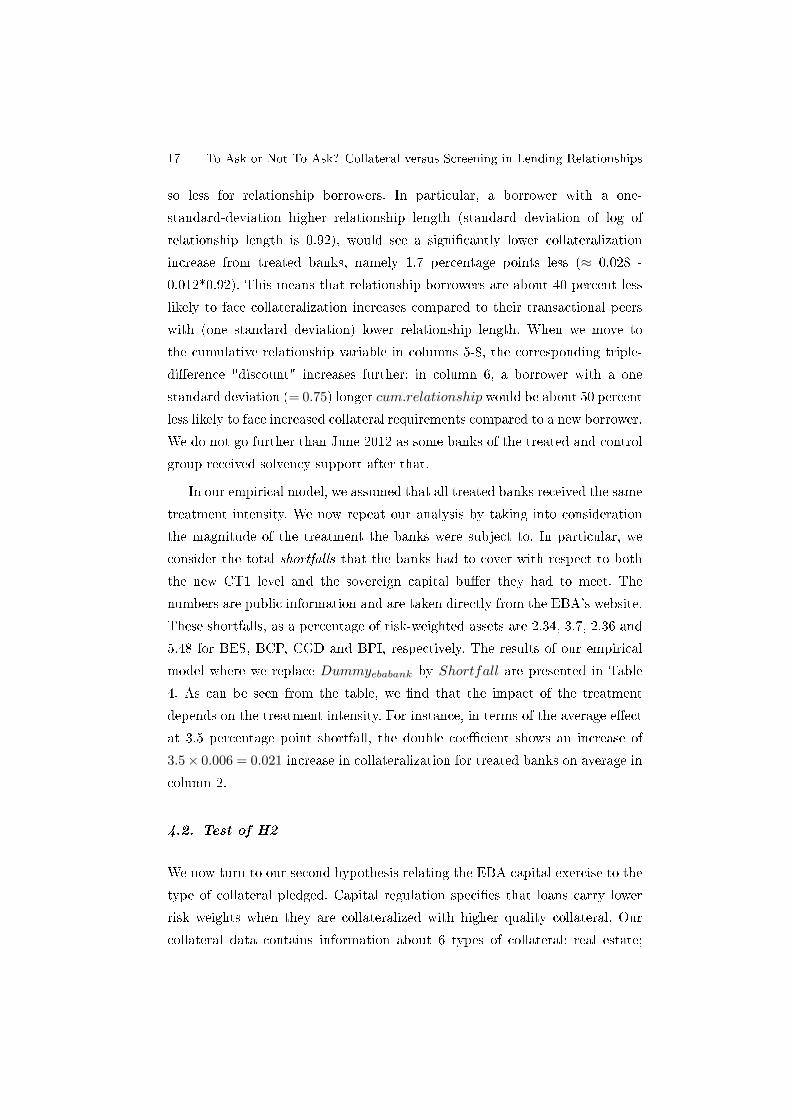
so less for relationship borrowers. In particular, a borrower with a one-
standard-deviation higher relationship length (standard deviation of log of
relationship length is 0.92), would see a signi�cantly lower collateralization
increase from treated banks, namely 1.7 percentage points less (≈ 0.028 -
0.012*0.92). This means that relationship borrowers are about 40 percent less
likely to face collateralization increases compared to their transactional peers
with (one standard deviation) lower relationship length. When we move to
the cumulative relationship variable in columns 5-8, the corresponding triple-
di�erence "discount" increases further: in column 6, a borrower with a one
standard deviation (= 0.75) longer cum.relationship would be about 50 percent
less likely to face increased collateral requirements compared to a new borrower.
We do not go further than June 2012 as some banks of the treated and control
group received solvency support after that.
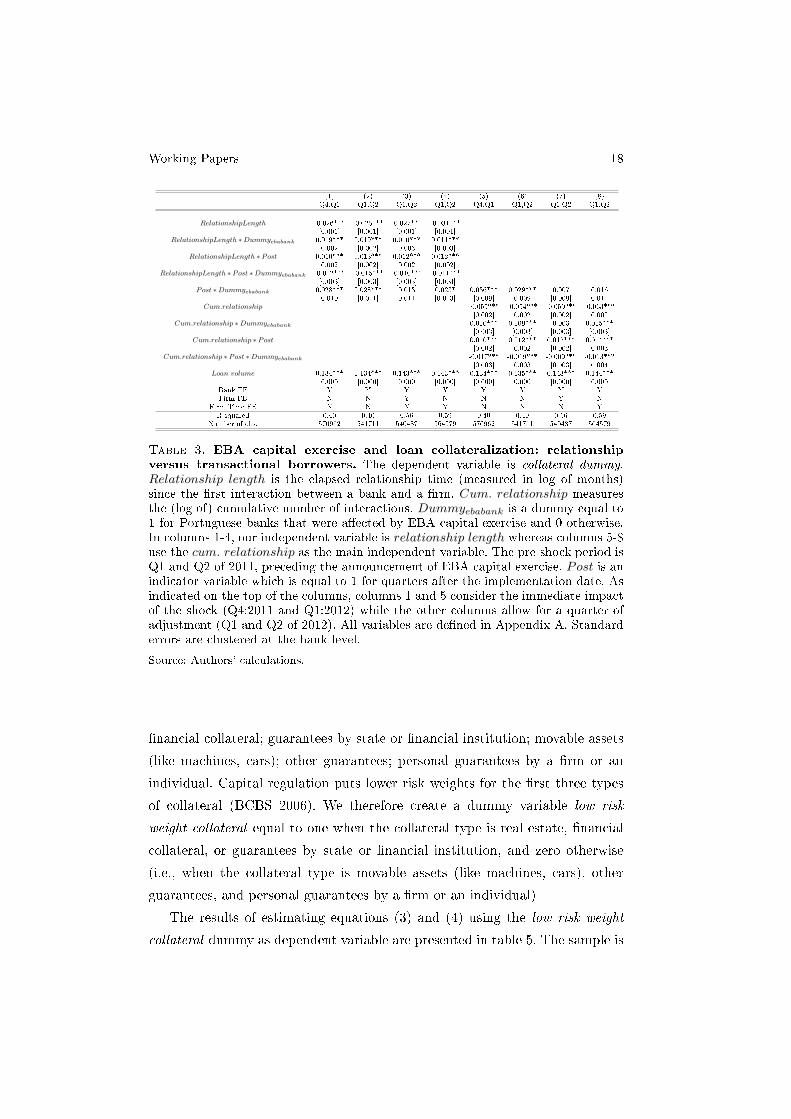
In our empirical model, we assumed that all treated banks received the same
treatment intensity. We now repeat our analysis by taking into consideration
the magnitude of the treatment the banks were subject to. In particular, we
consider the total shortfalls that the banks had to cover with respect to both
the new CT1 level and the sovereign capital bu�er they had to meet. The
numbers are public information and are taken directly from the EBA's website.
These shortfalls, as a percentage of risk-weighted assets are 2.34, 3.7, 2.36 and
5.48 for BES, BCP, CGD and BPI, respectively. The results of our empirical
model where we replace Dummyebabank by Shortfall are presented in Table
4. As can be seen from the table, we �nd that the impact of the treatment
depends on the treatment intensity. For instance, in terms of the average e�ect
at 3.5 percentage point shortfall, the double coe�cient shows an increase of
3.5× 0.006 = 0.021 increase in collateralization for treated banks on average in
column 2.
4.2. Test of H2
We now turn to our second hypothesis relating the EBA capital exercise to the
type of collateral pledged. Capital regulation speci�es that loans carry lower
risk weights when they are collateralized with higher quality collateral. Our
collateral data contains information about 6 types of collateral: real estate;
Working Papers 18
(1) (2) (3) (4) (5) (6) (7) (8)Q4,Q1 Q1,Q2 Q1,Q2 Q1,Q2 Q4,Q1 Q1,Q2 Q1,Q2 Q1,Q2
RelationshipLength -0.026*** -0.025*** -0.027*** -0.031***[0.001] [0.001] [0.001] [0.001]
RelationshipLength ∗Dummyebabank 0.019*** 0.019*** 0.010*** 0.011***[0.002] [0.002] [0.003] [0.003]
RelationshipLength ∗ Post 0.010*** 0.013*** 0.012*** 0.012***[0.002] [0.002] [0.002] [0.002]
RelationshipLength ∗ Post ∗Dummyebabank -0.012*** -0.015*** -0.010*** -0.011***[0.003] [0.003] [0.003] [0.003]
Post ∗Dummyebabank 0.028*** 0.028*** 0.013 0.023* 0.036*** 0.029*** 0.007 0.016[0.010] [0.011] [0.011] [0.013] [0.009] [0.009] [0.009] [0.011]
Cum.relationship -0.055*** -0.054*** -0.059*** -0.063***[0.002] [0.002] [0.002] [0.002]
Cum.relationship ∗Dummyebabank 0.010*** 0.009*** 0.003 0.015***[0.003] [0.003] [0.003] [0.003]
Cum.relationship ∗ Post 0.010*** 0.012*** 0.012*** 0.014***[0.002] [0.002] [0.002] [0.003]
Cum.relationship ∗ Post ∗Dummyebabank -0.017*** -0.019*** -0.009*** -0.013***[0.003] [0.003] [0.003] [0.004]
Loan volume 0.134*** 0.134*** 0.143*** 0.143*** 0.134*** 0.135*** 0.143*** 0.144***[0.000] [0.000] [0.000] [0.000] [0.000] [0.000] [0.000] [0.000]
Bank FE Y Y Y Y Y Y Y YFirm FE N N Y N N N Y N
Firm Time FE N N N Y N N N YR-squared 0.40 0.40 0.56 0.59 0.40 0.40 0.56 0.59
Number of obs. 570962 541711 540487 564579 570962 541711 540487 564579
Table 3. EBA capital exercise and loan collateralization: relationship
versus transactional borrowers. The dependent variable is collateral dummy.Relationship length is the elapsed relationship time (measured in log of months)since the �rst interaction between a bank and a �rm. Cum. relationship measuresthe (log of) cumulative number of interactions. Dummyebabank is a dummy equal to1 for Portuguese banks that were a�ected by EBA capital exercise and 0 otherwise.In columns 1-4, our independent variable is relationship length whereas columns 5-8use the cum. relationship as the main independent variable. The pre-shock period isQ1 and Q2 of 2011, preceding the announcement of EBA capital exercise. Post is anindicator variable which is equal to 1 for quarters after the implementation date. Asindicated on the top of the columns, columns 1 and 5 consider the immediate impactof the shock (Q4:2011 and Q1:2012) while the other columns allow for a quarter ofadjustment (Q1 and Q2 of 2012). All variables are de�ned in Appendix A. Standarderrors are clustered at the bank level.
Source: Authors' calculations.
�nancial collateral; guarantees by state or �nancial institution; movable assets
(like machines, cars); other guarantees; personal guarantees by a �rm or an
individual. Capital regulation puts lower risk weights for the �rst three types
of collateral (BCBS 2006). We therefore create a dummy variable low risk
weight collateral equal to one when the collateral type is real estate, �nancial
collateral, or guarantees by state or �nancial institution, and zero otherwise
(i.e., when the collateral type is movable assets (like machines, cars), other
guarantees, and personal guarantees by a �rm or an individual)
The results of estimating equations (3) and (4) using the low risk weight
collateral dummy as dependent variable are presented in table 5. The sample is
19 To Ask or Not To Ask? Collateral versus Screening in Lending Relationships
(1) (2) (3) (4) (5) (6) (7) (8)Q4,Q1 Q1,Q2 Q1,Q2 Q1,Q2 Q4,Q1 Q1,Q2 Q1,Q2 Q1,Q2
RelationshipLength -0.025*** -0.023*** -0.025*** -0.028***[0.001] [0.001] [0.001] [0.001]
RelationshipLength ∗ Shortfall 0.004*** 0.003*** 0.002*** 0.002***[0.001] [0.001] [0.001] [0.001]
RelationshipLength ∗ Post 0.008*** 0.010*** 0.010*** 0.011***[0.002] [0.002] [0.002] [0.002]
RelationshipLength ∗ Post ∗ Shortfall -0.002*** -0.003*** -0.002*** -0.003***[0.001] [0.001] [0.001] [0.001]
Post ∗ Shortfall 0.004 0.006** 0.002 0.006* 0.006** 0.006** 0.001 0.005[0.003] [0.003] [0.003] [0.004] [0.002] [0.003] [0.003] [0.003]
Cum. relationship -0.053*** -0.052*** 0.000 -0.049***[0.002] [0.002] [.] [0.002]
Cum. relationship ∗ Shortfall 0.003*** 0.002*** 0.001 0.002**[0.001] [0.001] [0.001] [0.001]
Cum. relationship ∗ Post 0.006*** 0.007*** -0.048*** 0.005***[0.002] [0.002] [0.002] [0.002]
Cum. relationship ∗ Post ∗ Shortfall -0.003*** -0.004*** -0.002** -0.004***[0.001] [0.001] [0.001] [0.001]
Loan volume 0.134*** 0.134*** 0.143*** 0.144*** 0.134*** 0.135*** 0.143*** 0.144***[0.000] [0.000] [0.000] [0.000] [0.000] [0.000] [0.000] [0.000]
Bank FE Y Y Y Y Y Y Y YFirm FE N N Y N N N Y N
Firm Time FE N N N Y N N N YR-squared 0.40 0.40 0.56 0.59 0.40 0.40 0.56 0.59
Number of obs. 570962 541711 540487 536549 570962 541711 540487 536549
Table 4. EBA capital exercise and loan collateralization: intensity of
treatment. The dependent variable is collateral dummy. Relationship length isthe elapsed relationship time (measured in log of months) since the �rst interactionbetween a bank and a �rm. Cum. relationship measures the (log of) cumulativenumber of interactions. Shortfall is the percentage shortfall of capital (as a fraction ofrisk-weighted assets) for Portuguese banks that were treated by EBA capital exercise.In columns 1-4, our independent variable is relationship length whereas columns 5-8use the cum. relationship as the main independent variable. The pre-shock period isQ1 and Q2 of 2011, preceding the announcement of EBA capital exercise. Post is anindicator variable which is equal to 1 for quarters after the implementation date. Asindicated on the top of the columns, columns 1 and 5 consider the immediate impactof the shock (Q4:2011 and Q1:2012) while the other columns allow for a quarter ofadjustment (Q1 and Q2 of 2012). All variables are de�ned in Appendix A. Standarderrors are clustered at the bank level.
Source: Authors' calculations.
now restricted to collateralized loans only. The structure of the table is similar
as before; Columns 1 and 5 take Q4:2011 and Q1:2012 as the post period
whereas the other columns employ the �rst two quarters of 2012 as post period.
The �rst four columns present the results for Equation (3), i.e., relationship
length, and the last four columns for Equation (4), i.e., cum. relationship. The
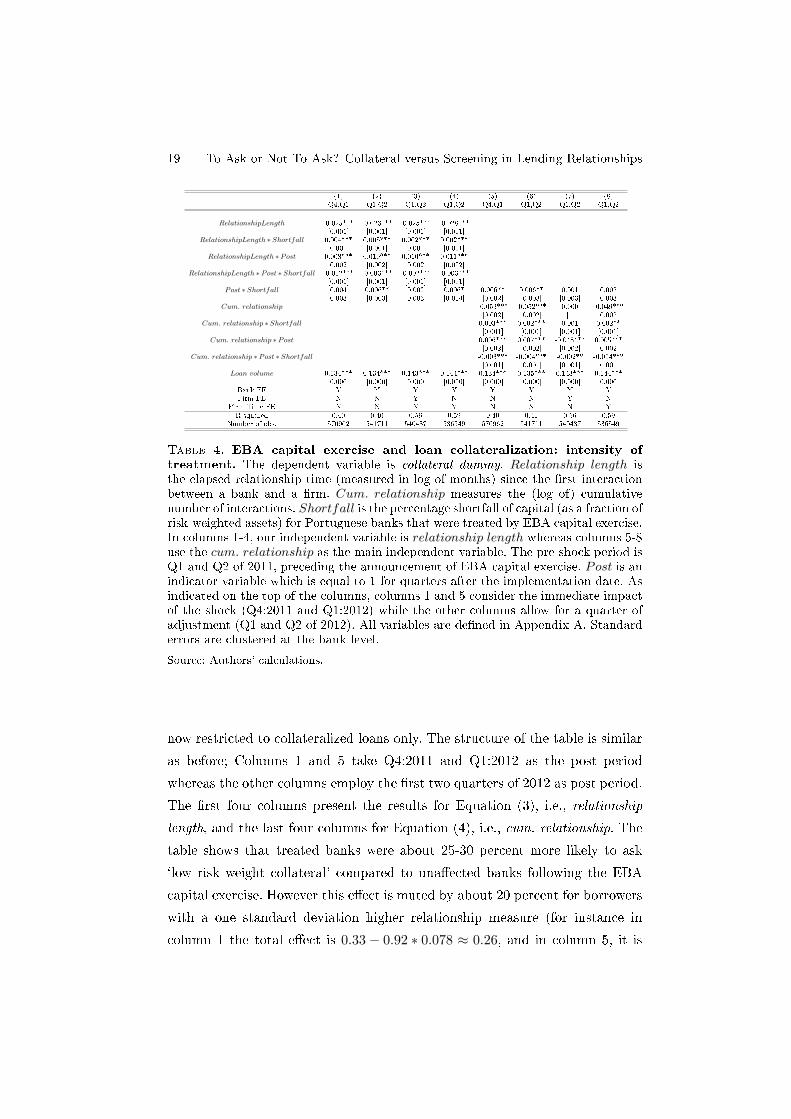
table shows that treated banks were about 25-30 percent more likely to ask
`low risk weight collateral' compared to una�ected banks following the EBA
capital exercise. However this e�ect is muted by about 20 percent for borrowers
with a one standard deviation higher relationship measure (for instance in
column 1 the total e�ect is 0.33− 0.92 ∗ 0.078 ≈ 0.26, and in column 5, it is
Working Papers 20
0.25− 0.75 ∗ 0.078 ≈ 0.19). This result supports H2 as the EBA capital exercise
leads to a more intensive pledging of low risk weight collateral, but less so for
relationship borrowers.13
(1) (2) (3) (4) (5) (6) (7) (8)Q4,Q1 Q1,Q2 Q1,Q2 Q1,Q2 Q4,Q1 Q1,Q2 Q1,Q2 Q1,Q2
RelationshipLength 0.018*** 0.012*** 0.020*** 0.020***[0.001] [0.001] [0.002] [0.002]
RelationshipLength ∗Dummyebabank 0.016*** 0.024*** 0.024*** 0.027***[0.001] [0.001] [0.001] [0.002]
RelationshipLength ∗ Post 0.044*** 0.038*** 0.026*** 0.028***[0.003] [0.003] [0.003] [0.003]
RelationshipLength ∗ Post ∗Dummyebabank -0.078*** -0.079*** -0.049*** -0.063***[0.005] [0.003] [0.004] [0.005]
Post ∗Dummyebabank 0.332*** 0.309*** 0.190*** 0.239*** 0.254*** 0.231*** 0.144*** 0.175***[0.018] [0.013] [0.015] [0.018] [0.014] [0.010] [0.012] [0.014]
Cum.relationship -0.015*** -0.020*** -0.004* -0.002[0.001] [0.002] [0.002] [0.002]
Cum.relationship ∗Dummyebabank 0.022*** 0.031*** 0.032*** 0.035***[0.001] [0.001] [0.002] [0.002]
Cum.relationship ∗ Post 0.041*** 0.035*** 0.024*** 0.022***[0.004] [0.003] [0.003] [0.004]
Cum.relationship ∗ Post ∗Dummyebabank -0.075*** -0.076*** -0.049*** -0.060***[0.005] [0.003] [0.004] [0.005]
Loan volume 0.025*** 0.026*** 0.021*** 0.020*** 0.025*** 0.026*** 0.021*** 0.020***[0.001] [0.001] [0.001] [0.001] [0.001] [0.001] [0.001] [0.001]
Bank FE Y Y Y Y Y Y Y YFirm FE N N Y N N N Y N
Firm-time FE N N N Y N N N YR-squared 0.03 0.03 0.31 0.35 0.03 0.03 0.30 0.35
Number of obs. 346565 329563 326636 320608 346565 329563 326636 320608
Table 5. The EBA capital exercise and collateral type: relationship versus
transactional borrowers. The dependent variable is low risk weight collateral
taking the value of 1 if collateral type is real estate, a guarantee backed by governmentor a �nancial institution or �nancial collateral, and 0 if the loan is collateralized byother collateral. The sample only includes collateralized loans. Dummyebabank is adummy equal to 1 for Portuguese banks that were a�ected by EBA capital exerciseand 0 otherwise. The pre-EBA window is Q1 andQ2 of 2011. As indicated on top ofthe columns, Columns 1 and 5 use Q4:2011 and Q1:2012 as the treatment period.The other columns use Q1 and Q2 of 2012 as the treatment period. Columns 1-4 (5-8)present results for Equation 3 (4). All variables are de�ned in Appendix A. Standarderrors are clustered at the bank level.
Source: Authors' calculations.
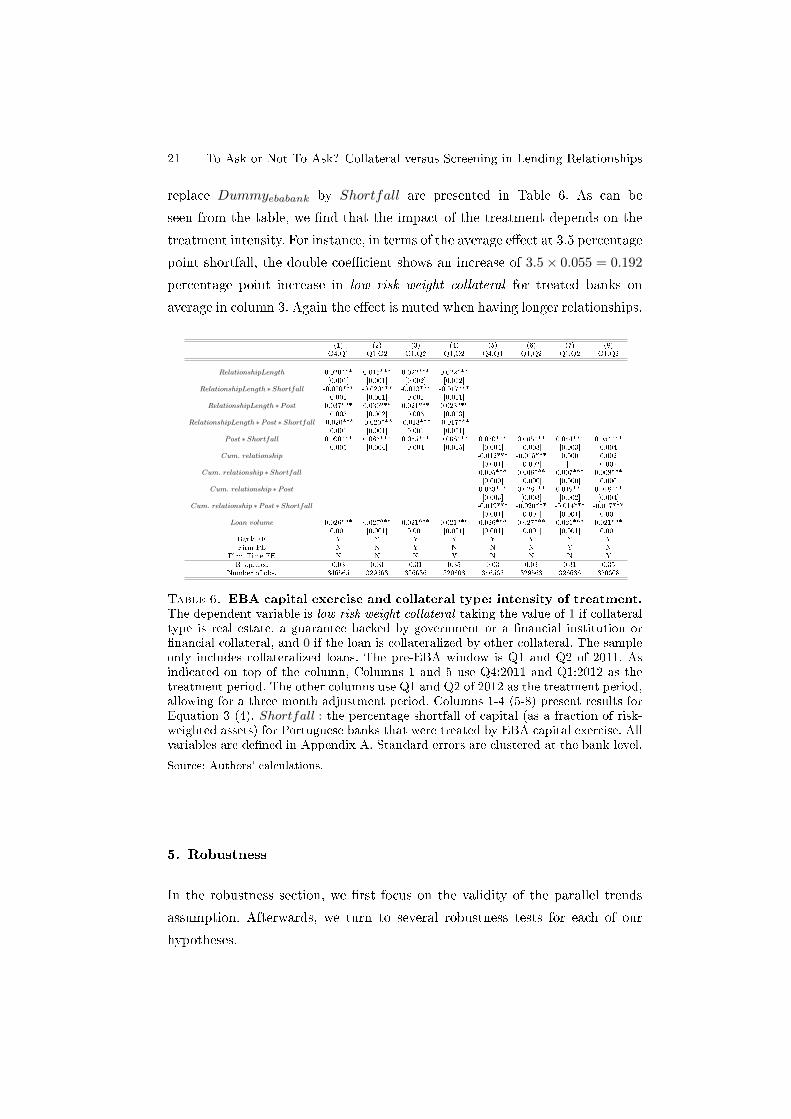
In table 6 we take our analysis one step further by investigating the
treatment intensity as measured by Shortfall. We expect that �rms dealing
with banks su�ering a more intense treatment to require more often low risk
weight collateral rather than other collateral after the treatment, but less
so for relationship borrowers. The results of our empirical model where we
13. We also follow Mayordomo et al. (2018) and group collateral into real versus personal
collateral. We do not �nd any signi�cance for the double and triple interaction terms in
explaining this grouping of collateral. This suggests that risk-weights are the determining
factor in our analysis.
21 To Ask or Not To Ask? Collateral versus Screening in Lending Relationships
replace Dummyebabank by Shortfall are presented in Table 6. As can be
seen from the table, we �nd that the impact of the treatment depends on the
treatment intensity. For instance, in terms of the average e�ect at 3.5 percentage
point shortfall, the double coe�cient shows an increase of 3.5× 0.055 = 0.192
percentage point increase in low risk weight collateral for treated banks on
average in column 3. Again the e�ect is muted when having longer relationships.
(1) (2) (3) (4) (5) (6) (7) (8)Q4,Q1 Q1,Q2 Q1,Q2 Q1,Q2 Q4,Q1 Q1,Q2 Q1,Q2 Q1,Q2
RelationshipLength 0.020*** 0.015*** 0.022*** 0.022***[0.001] [0.001] [0.002] [0.002]
RelationshipLength ∗ Shortfall -0.020*** -0.020*** -0.013*** -0.017***[0.001] [0.001] [0.001] [0.001]
RelationshipLength ∗ Post 0.037*** 0.030*** 0.021*** 0.023***[0.003] [0.002] [0.003] [0.003]
RelationshipLength ∗ Post ∗ Shortfall -0.020*** -0.020*** -0.013*** -0.017***[0.001] [0.001] [0.001] [0.001]
Post ∗ Shortfall 0.090*** 0.083*** 0.055*** 0.068*** 0.070*** 0.065*** 0.044*** 0.054***[0.005] [0.004] [0.004] [0.005] [0.004] [0.003] [0.003] [0.004]
Cum. relationship -0.012*** -0.015*** 0.000 0.002[0.001] [0.002] [.] [0.002]
Cum. relationship ∗ Shortfall 0.005*** 0.006*** 0.007*** 0.008***[0.000] [0.000] [0.000] [0.000]
Cum. relationship ∗ Post 0.033*** 0.028*** 0.019*** 0.018***[0.003] [0.003] [0.002] [0.004]
Cum. relationship ∗ Post ∗ Shortfall -0.019*** -0.020*** -0.014*** -0.017***[0.001] [0.001] [0.001] [0.001]
Loan volume 0.026*** 0.027*** 0.021*** 0.021*** 0.026*** 0.027*** 0.021*** 0.021***[0.001] [0.001] [0.001] [0.001] [0.001] [0.001] [0.001] [0.001]
Bank FE Y Y Y Y Y Y Y YFirm FE N N Y N N N Y N
Firm Time FE N N N Y N N N YR-squared 0.03 0.03 0.31 0.35 0.03 0.03 0.31 0.35
Number of obs. 346565 329563 326636 320608 346565 329563 326636 320608
Table 6. EBA capital exercise and collateral type: intensity of treatment.
The dependent variable is low risk weight collateral taking the value of 1 if collateraltype is real estate, a guarantee backed by government or a �nancial institution or�nancial collateral, and 0 if the loan is collateralized by other collateral. The sampleonly includes collateralized loans. The pre-EBA window is Q1 and Q2 of 2011. Asindicated on top of the column, Columns 1 and 5 use Q4:2011 and Q1:2012 as thetreatment period. The other columns use Q1 and Q2 of 2012 as the treatment period,allowing for a three month adjustment period. Columns 1-4 (5-8) present results forEquation 3 (4). Shortfall : the percentage shortfall of capital (as a fraction of risk-weighted assets) for Portuguese banks that were treated by EBA capital exercise. Allvariables are de�ned in Appendix A. Standard errors are clustered at the bank level.
Source: Authors' calculations.
5. Robustness
In the robustness section, we �rst focus on the validity of the parallel trends
assumption. Afterwards, we turn to several robustness tests for each of our
hypotheses.
Working Papers 22
5.1. Validity of the parallel trends assumption
In this subsection we test the validity of the underlying assumption of the
parallel trends in our di�-in-di� analysis. For this purpose, we study the lead-
up to 2011 and examine how the lending activity of the treated and control
banks di�ered in terms of loans' collateral requirements.
A potential concern in the di�-in-di� analysis is that the underlying
assumption of parallel trends does not hold: absent our capital exercise, the
a�ected banks would have treated their relationship borrowers in the same
way (in terms of collateral requirements), as the non-a�ected banks. This
assumption is hard to test. To corroborate its validity, we must reject the
possibility that treated banks over time may have increased their collateral
requirements, but less so for high-relationship borrowers. Our results above
would otherwise simply re�ect a trend already observed in the run up to the
event period.
Yet, this exercise is challenging due to the volatile markets before 2011.
Until late 2009 and early 2010, the sustainability of the Portuguese sovereign
debt was not perceived as a concern for the markets.14 However, in April
2010, when the Greek government requested an EU/IMF bailout package,
markets started to doubt the sustainability of the sovereign debt. Shortly
afterward, investors began to be concerned about the solvency and liquidity
of the public debt issued by the troubled countries, including Portugal. The
higher sovereign risk since early 2010 in the Euro area dramatically increased
the cost of some euro area, including Portuguese, banks' funding. The size of
the impact is generally proportional to the deterioration in the creditworthiness
of the domestic sovereign. Banks in Greece, Ireland, Spain, and Portugal had
more di�culty raising wholesale debt and deposits, and had become reliant
on central bank liquidity. In the European Banking Authority's stress tests of
December 2010, the exposure of Portuguese banks to Portuguese government
debt was estimated at 23 percent of their assets. As a result, the banks and the
14. For over ten years since the introduction of the Euro, the yields of bonds issued by
European countries were low and stable.
23 To Ask or Not To Ask? Collateral versus Screening in Lending Relationships
sovereign are quite closely linked.15 Uncertain economic conditions eventually
also a�ected �rm risk. Banks may demand higher returns when lending to them
as a compensation for holding additional risk. This mechanism - the �rm risk
channel - has been shown to be quite important quantitatively (Bocola, 2016).16
A decline in the repayment probability can then increase banks' required
compensation, in form of higher collateral requirements and higher interest
rates.17 In line with �ndings from other countries (see for instance Gropp et
al., 2018; Juelsrud and Wold, 2018), the overall lending did decrease during the
period.
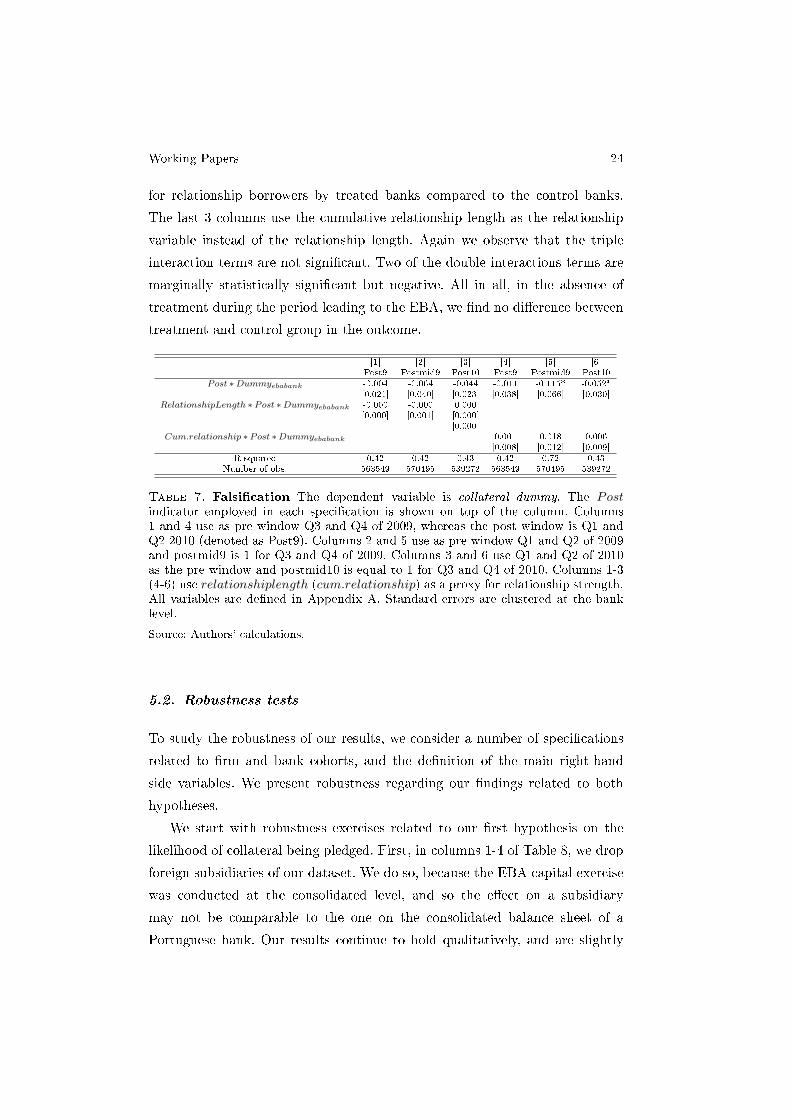
In table 7, we analyze the rate of loan collateralization by all banks in non-
EBA periods during 2009-2010, i.e., covering windows before the EBA capital
exercise. In Table 7 we show that there is no change in the use of collateral
by treatment versus control banks in our pre-event period. To conserve space,
we only report the coe�cients for the doubIe and triple interaction terms of
interest. In columns 1-3, pre-EBA periods are analyzed for the relationship
length measure. Column 1 and 2, show the results for the window around end of
2009 (Post9 is a dummy variable that takes value 1 for periods after year 2009,
and 0 before end of 2009) and mid 2009 (Postmid9 is a dummy variable that
takes value 1 for periods after Q2 2009, and 0 otherwise), respectively. Column
3 uses postmid10 as the indicator variable which takes a value of 1 from July
2010 and 0 earlier. As the double coe�cients in the table con�rm, treated banks
did not increase collateral requirements (if anything, they in fact somewhat
decreased it albeit this is mostly statistically insigni�cant). At the same
time, the triple coe�cients con�rm that there was no di�erential treatment
15. The pattern is similar in many other European countries where banks hold a signi�cant
amount of their domestic public debt. The correlation between the CDS spreads of the
sovereign and the banks is extremely strong. Brunnermeier et al. (2011) argue that the
sudden panics and the spike in sovereign bond yields in Portugal and elsewhere were the
consequence of the close interlinkages between banks and sovereigns.
16. Buera and Karmakar (2017) document that especially highly leveraged �rms found
it di�cult to obtain �nancing and contracted more in the aftermath of the sovereign debt
crisis.
17. Using comprehensive micro-data from Spain, Jiménez et al. (2006) demonstrate
precisely such a negative relationship between collateral requirements and the business cycle.
Working Papers 24
for relationship borrowers by treated banks compared to the control banks.
The last 3 columns use the cumulative relationship length as the relationship
variable instead of the relationship length. Again we observe that the triple
interaction terms are not signi�cant. Two of the double interactions terms are
marginally statistically signi�cant but negative. All in all, in the absence of
treatment during the period leading to the EBA, we �nd no di�erence between
treatment and control group in the outcome.
[1] [2] [3] [4] [5] [6]Post9 Postmid9 Post10 Post9 Postmid9 Post10
Post ∗Dummyebabank -0.004 -0.064 -0.044 -0.011 -0.115* -0.052*[0.021] [0.040] [0.023] [0.038] [0.066] [0.030]
RelationshipLength ∗ Post ∗Dummyebabank -0.000 -0.000 0.000[0.000] [0.001] [0.000]
[0.000]Cum.relationship ∗ Post ∗Dummyebabank 0.001 0.018 0.006
[0.008] [0.012] [0.009]R-squared 0.42 0.42 0.43 0.42 0.72 0.43
Number of obs. 563549 570495 539272 563549 570495 539272
Table 7. Falsi�cation The dependent variable is collateral dummy. The Postindicator employed in each speci�cation is shown on top of the column. Columns1 and 4 use as pre window Q3 and Q4 of 2009, whereas the post window is Q1 andQ2 2010 (denoted as Post9). Columns 2 and 5 use as pre window Q1 and Q2 of 2009and postmid9 is 1 for Q3 and Q4 of 2009. Columns 3 and 6 use Q1 and Q2 of 2010as the pre window and postmid10 is equal to 1 for Q3 and Q4 of 2010. Columns 1-3(4-6) use relationshiplength (cum.relationship) as a proxy for relationship strength.All variables are de�ned in Appendix A. Standard errors are clustered at the banklevel.
Source: Authors' calculations.
5.2. Robustness tests
To study the robustness of our results, we consider a number of speci�cations
related to �rm and bank cohorts, and the de�nition of the main right-hand
side variables. We present robustness regarding our �ndings related to both
hypotheses.
We start with robustness exercises related to our �rst hypothesis on the
likelihood of collateral being pledged. First, in columns 1-4 of Table 8, we drop
foreign subsidiaries of our dataset. We do so, because the EBA capital exercise
was conducted at the consolidated level, and so the e�ect on a subsidiary
may not be comparable to the one on the consolidated balance sheet of a
Portuguese bank. Our results continue to hold qualitatively, and are slightly
25 To Ask or Not To Ask? Collateral versus Screening in Lending Relationships
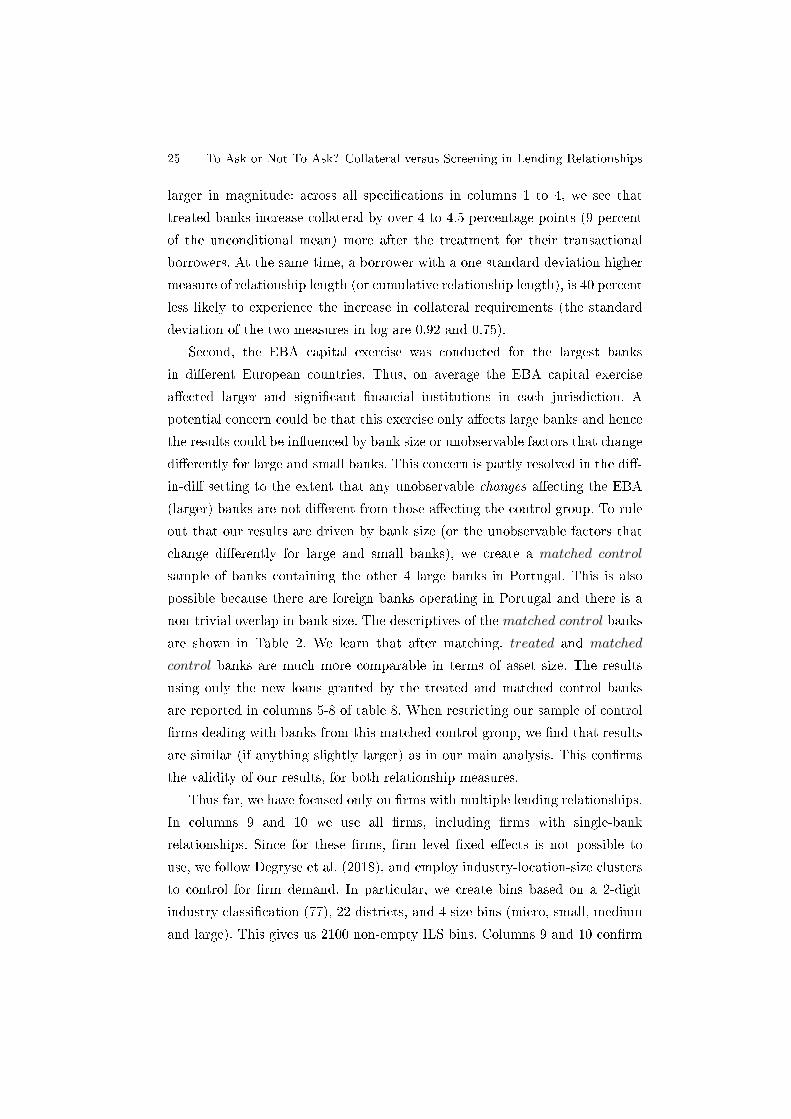
larger in magnitude: across all speci�cations in columns 1 to 4, we see that
treated banks increase collateral by over 4 to 4.5 percentage points (9 percent
of the unconditional mean) more after the treatment for their transactional
borrowers. At the same time, a borrower with a one standard deviation higher
measure of relationship length (or cumulative relationship length), is 40 percent
less likely to experience the increase in collateral requirements (the standard
deviation of the two measures in log are 0.92 and 0.75).
Second, the EBA capital exercise was conducted for the largest banks
in di�erent European countries. Thus, on average the EBA capital exercise
a�ected larger and signi�cant �nancial institutions in each jurisdiction. A
potential concern could be that this exercise only a�ects large banks and hence
the results could be in�uenced by bank size or unobservable factors that change
di�erently for large and small banks. This concern is partly resolved in the di�-
in-di� setting to the extent that any unobservable changes a�ecting the EBA
(larger) banks are not di�erent from those a�ecting the control group. To rule
out that our results are driven by bank size (or the unobservable factors that
change di�erently for large and small banks), we create a matched control
sample of banks containing the other 4 large banks in Portugal. This is also
possible because there are foreign banks operating in Portugal and there is a
non-trivial overlap in bank size. The descriptives of the matched control banks
are shown in Table 2. We learn that after matching, treated and matched
control banks are much more comparable in terms of asset size. The results
using only the new loans granted by the treated and matched control banks
are reported in columns 5-8 of table 8. When restricting our sample of control
�rms dealing with banks from this matched control group, we �nd that results
are similar (if anything slightly larger) as in our main analysis. This con�rms
the validity of our results, for both relationship measures.
Thus far, we have focused only on �rms with multiple lending relationships.
In columns 9 and 10 we use all �rms, including �rms with single-bank
relationships. Since for these �rms, �rm level �xed e�ects is not possible to
use, we follow Degryse et al. (2018), and employ industry-location-size clusters
to control for �rm demand. In particular, we create bins based on a 2-digit
industry classi�cation (77), 22 districts, and 4 size bins (micro, small, medium
and large). This gives us 2100 non-empty ILS bins. Columns 9 and 10 con�rm
Working Papers 26
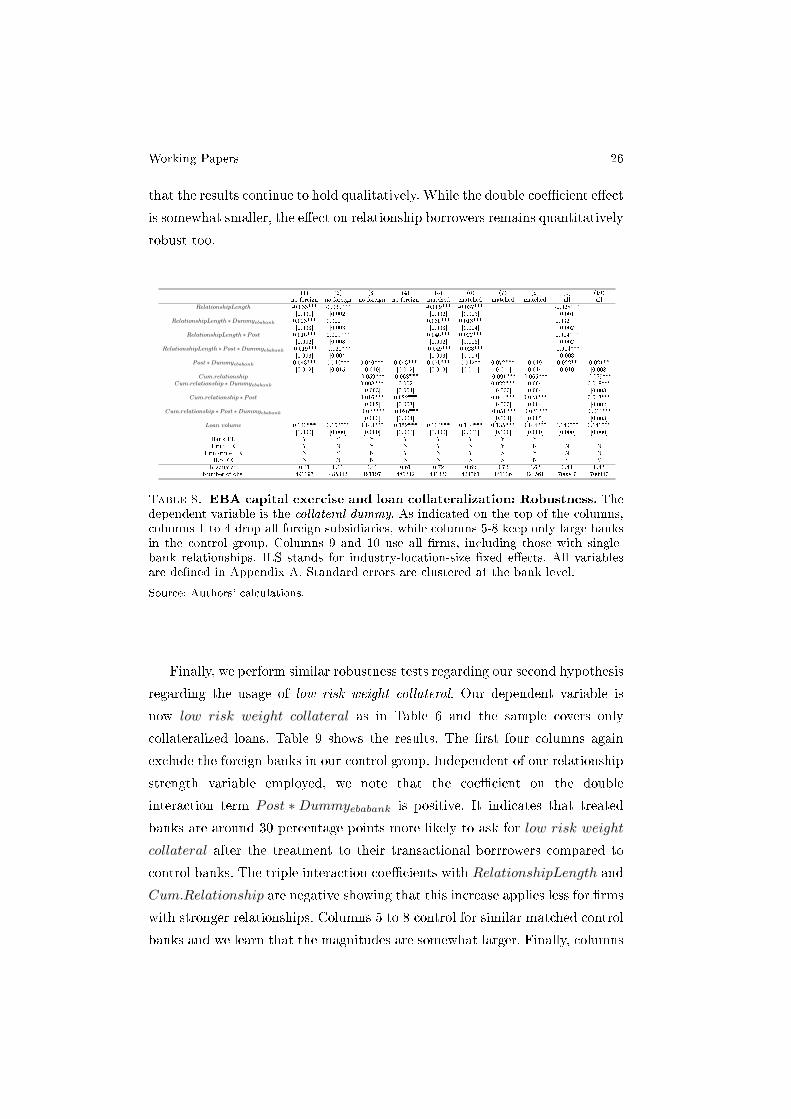
that the results continue to hold qualitatively. While the double coe�cient e�ect
is somewhat smaller, the e�ect on relationship borrowers remains quantitatively
robust too.
(1) (2) (3) (4) (5) (6) (7) (8) (9) (10)no foreign no foreign no foreign no foreign matched matched matched matched all all
RelationshipLength -0.033*** -0.039*** -0.069*** -0.037*** -0.028***[0.001] [0.002] [0.002] [0.003] [0.001]
RelationshipLength ∗Dummyebabank 0.023*** 0.010*** 0.035*** 0.013*** 0.032***[0.003] [0.003] [0.003] [0.004] [0.002]
RelationshipLength ∗ Post 0.016*** 0.019*** 0.046*** 0.022*** 0.014***[0.002] [0.003] [0.002] [0.003] [0.002]
RelationshipLength ∗ Post ∗Dummyebabank -0.019*** -0.021*** -0.049*** -0.023*** -0.014***[0.003] [0.004] [0.003] [0.004] [0.003]
Post ∗Dummyebabank 0.043*** 0.046*** 0.040*** 0.043*** 0.075*** 0.042** 0.072*** 0.019 0.022** 0.021**[0.012] [0.015] [0.010] [0.012] [0.013] [0.017] [0.011] [0.014] [0.010] [0.008]
Cum.relationship -0.059*** -0.068*** -0.091*** -0.065*** -0.059***Cum.relationship ∗Dummyebabank 0.008*** 0.002 0.022*** 0.004 0.018***
[0.003] [0.004] [0.003] [0.004] [0.003]Cum.relationship ∗ Post 0.016*** 0.022*** 0.044*** 0.023*** 0.013***
[0.002] [0.003] [0.003] [0.004] [0.002]Cum.relationship ∗ Post ∗Dummyebabank -0.022*** -0.026*** -0.051*** -0.021*** -0.016***
[0.003] [0.004] [0.004] [0.005] [0.003]Loan volume 0.143*** 0.152*** 0.143*** 0.152*** 0.134*** 0.144*** 0.135*** 0.144*** 0.140*** 0.141***
[0.000] [0.000] [0.000] [0.000] [0.000] [0.000] [0.000] [0.000] [0.000] [0.000]Bank FE Y Y Y Y Y Y Y YFirm FE Y N Y N Y N Y N N N
Firm-time FE N Y N Y N Y N Y N NILS FE N N N N N N N N Y Y
R-squared 0.41 0.61 0.41 0.61 0.72 0.62 0.72 0.62 0.43 0.43Number of obs. 491197 485342 491197 485342 431336 424561 431336 424561 700947 700947
Table 8. EBA capital exercise and loan collateralization: Robustness. Thedependent variable is the collateral dummy. As indicated on the top of the columns,columns 1 to 4 drop all foreign subsidiaries, while columns 5-8 keep only large banksin the control group. Columns 9 and 10 use all �rms, including those with single-bank relationships. ILS stands for industry-location-size �xed e�ects. All variablesare de�ned in Appendix A. Standard errors are clustered at the bank level.
Source: Authors' calculations.
Finally, we perform similar robustness tests regarding our second hypothesis
regarding the usage of low risk weight collateral. Our dependent variable is
now low risk weight collateral as in Table 6 and the sample covers only
collateralized loans. Table 9 shows the results. The �rst four columns again
exclude the foreign banks in our control group. Independent of our relationship
strength variable employed, we note that the coe�cient on the double
interaction term Post ∗ Dummyebabank is positive. It indicates that treated
banks are around 30 percentage points more likely to ask for low risk weight
collateral after the treatment to their transactional borrrowers compared to
control banks. The triple interaction coe�cients with RelationshipLength and
Cum.Relationship are negative showing that this increase applies less for �rms
with stronger relationships. Columns 5 to 8 control for similar matched control
banks and we learn that the magnitudes are somewhat larger. Finally, columns
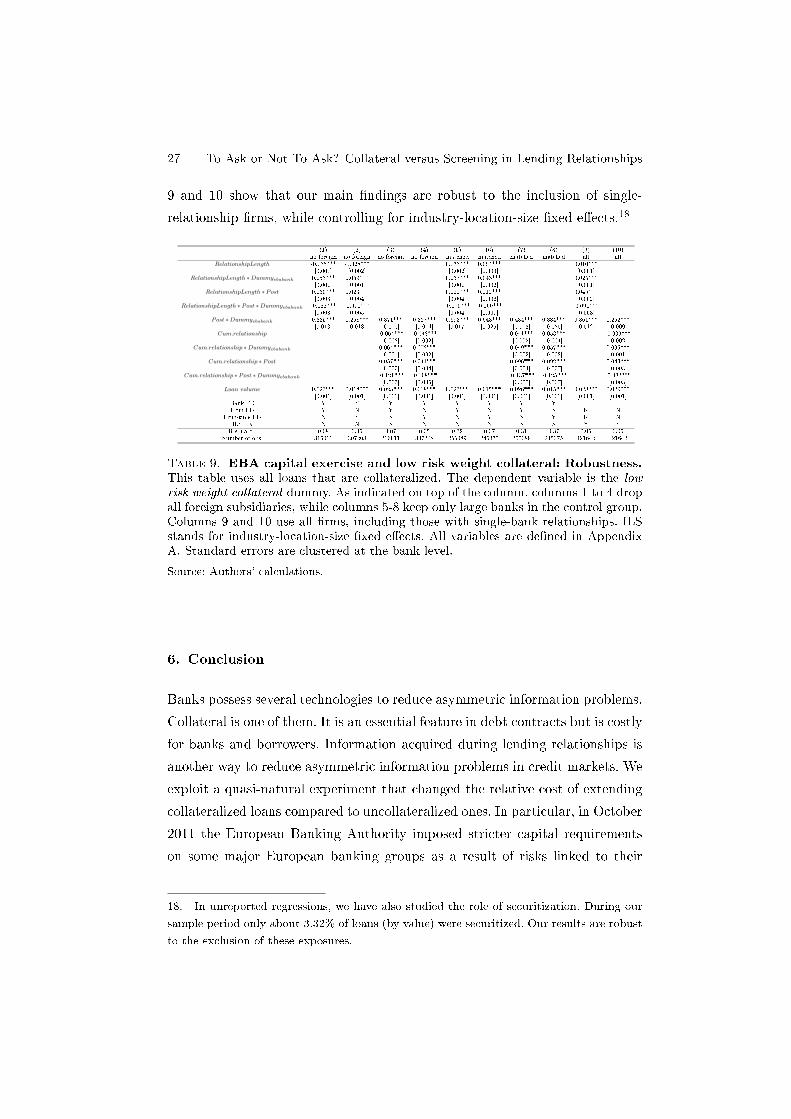
27 To Ask or Not To Ask? Collateral versus Screening in Lending Relationships
9 and 10 show that our main �ndings are robust to the inclusion of single-
relationship �rms, while controlling for industry-location-size �xed e�ects.18
(1) (2) (3) (4) (5) (6) (7) (8) (9) (10)no foreign no foreign no foreign no foreign matched matched matched matched all all
RelationshipLength -0.035*** -0.028*** 0.073*** 0.084*** 0.010***[0.001] [0.002] [0.002] [0.003] [0.001]
RelationshipLength ∗Dummyebabank 0.053*** 0.059*** 0.037*** 0.043*** 0.025***[0.001] [0.001] [0.001] [0.002] [0.001]
RelationshipLength ∗ Post 0.036*** 0.023*** 0.122*** 0.112*** 0.045***[0.003] [0.004] [0.004] [0.006] [0.002]
RelationshipLength ∗ Post ∗Dummyebabank -0.088*** -0.071*** -0.170*** -0.160*** -0.091***[0.003] [0.005] [0.004] [0.007] [0.003]
Post ∗Dummyebabank 0.335*** 0.268*** 0.371*** 0.327*** 0.693*** 0.643*** 0.434*** 0.384*** 0.361*** 0.252***[0.013] [0.018] [0.010] [0.014] [0.017] [0.025] [0.013] [0.020] [0.012] [0.009]
Cum.relationship -0.064*** -0.048*** 0.041*** 0.053*** -0.033***[0.002] [0.002] [0.002] [0.004] [0.002]
Cum.relationship ∗Dummyebabank 0.064*** 0.072*** 0.049*** 0.057*** 0.035***[0.001] [0.002] [0.002] [0.002] [0.001]
Cum.relationship ∗ Post 0.057*** 0.041*** 0.096*** 0.092*** 0.043***[0.003] [0.004] [0.004] [0.007] [0.003]
Cum.relationship ∗ Post ∗Dummyebabank -0.121*** -0.108*** -0.137*** -0.125*** -0.082***[0.003] [0.005] [0.005] [0.007] [0.003]
Loan volume 0.023*** 0.018*** 0.023*** 0.018*** 0.023*** 0.015*** 0.026*** 0.015*** 0.028*** 0.029***[0.001] [0.001] [0.001] [0.001] [0.001] [0.001] [0.001] [0.001] [0.001] [0.001]
Bank FE Y Y Y Y Y Y Y YFirm FE Y N Y N Y N Y N N N
Firm-time FE N Y N Y N Y N Y N NILS FE N N N N N N N N Y Y
R-squared 0.08 0.35 0.07 0.35 0.32 0.37 0.31 0.37 0.06 0.05Number of obs. 316011 307208 316011 307208 255089 245375 255089 245375 421642 421642
Table 9. EBA capital exercise and low risk weight collateral: Robustness.
This table uses all loans that are collateralized. The dependent variable is the low
risk weight collateral dummy. As indicated on top of the column, columns 1 to 4 dropall foreign subsidiaries, while columns 5-8 keep only large banks in the control group.Columns 9 and 10 use all �rms, including those with single-bank relationships. ILSstands for industry-location-size �xed e�ects. All variables are de�ned in AppendixA. Standard errors are clustered at the bank level.
Source: Authors' calculations.
6. Conclusion
Banks possess several technologies to reduce asymmetric information problems.
Collateral is one of them. It is an essential feature in debt contracts but is costly
for banks and borrowers. Information acquired during lending relationships is
another way to reduce asymmetric information problems in credit markets. We
exploit a quasi-natural experiment that changed the relative cost of extending
collateralized loans compared to uncollateralized ones. In particular, in October
2011 the European Banking Authority imposed stricter capital requirements
on some major European banking groups as a result of risks linked to their
18. In unreported regressions, we have also studied the role of securitization. During our
sample period only about 3.32% of loans (by value) were securitized. Our results are robust
to the exclusion of these exposures.

Working Papers 28
sovereign bond holdings. This exogenous variation favors collateralized lending
by the treated banks relative to unsecured lending as collateralized loans carry
lower risk weights and therefore require less regulatory capital to be withheld
against them. Using detailed loan-level data and a di�erence-in-di�erence-in-
di�erences approach, we �nd that treated banks in general are 3-5 percentage
points (6-10 percent) more likely to require collateral. However, for high-
relationship borrowers (those with one standard-deviation higher relationship
length) the treated banks' increase in required collateralization is reduced by
about 40 percent. Furthermore, following the quasi-natural experiment, treated
banks were requiring more often collateral that saves more on regulatory capital
than control banks, but less so for relationship borrowers.
Banks have several margins to adjust to higher capital requirements. Next
to raising new capital or cutting lending, our paper documents a novel channel
of higher capital requirements. In particular, banks change the composition
of lending towards collateralized loans. This e�ect is muted for relationship
borrowers. For borrowers that have insu�cient supply of collateral, this suggests
an increased access to credit when having strong relationships. In sum, we
show that relationship banking is an empirically important driver of collateral
decisions also in environments with stricter capital requirements.
29 To Ask or Not To Ask? Collateral versus Screening in Lending Relationships
References
[1] Acharya, V., T. Eisert, C. Eu�nger, C.W. Hirsh, 2018. Real E�ects of the
Sovereign Debt Crisis in Europe: Evidence from Syndicated Loans, Review
of Financial Studies, 31, 2855-2896.
[2] Aiyar, S., C.W. Calomiris, J. Hooley, Y. Korniyenko, and T. Wieladek,
2014. The international transmission of bank capital requirements:
Evidence from the UK, Journal of Financial Economics, 113, 368-382.
[3] Banerjee, R. N., L. Gambacorta, and E. Sette, 2017. The real e�ects of
relationship lending, Working paper number 662, Bank for International
settlements.
[4] Basel Committee on Banking Supervision, 2006. International Conver-
gence of Capital Measurement and Capital Standards.
[5] Beck, T., H. Degryse, R. De Haas and N. van Horen, 2018. When arm's
length is too far. Relationship banking over the credit cycle, Journal of
Financial Economics, 127, 174-196.
[6] Beck, T., V. Ioannidou, and L. Schaefer, 2016, Foreigners vs. Natives:
Bank Lending Technologies and Loan Pricing, Management Science,
Forthcoming.
[7] Berger, A. , M. Espinosa-Vega, S. Frame, and N. Miller, 2011. Why
do borrowers pledge collateral? New empirical evidence on the role of
asymmetric information, Journal of Financial Intermediation, 20, 55-70.
[8] Berger, A., W. S. Frame, and V. Ioannidou, 2011. Tests of ex ante versus
ex post theories of collateral using private and public information, Journal
of Financial Economics, 100, 85-97.
[9] Berger, A. N., and Gregory F. Udell, 1995. Relationship Lending and lines
of Credit in Small Firm Financing, Journal of Business, 68, 351-381.
[10] Besanko, D., and A. Thakor, 1987. Collateral and Rationing: Sorting
Equilibria in Monopolistic and Competitive Credit Markets, International
Economic Review, 28,3, 671-89.
[11] Bester, H., 1985. Screening vs. rationing in credit markets with imperfect
information, American Economic Review, 75, 850-855.
[12] Blattner,L., L. Farinha, and F. Rebelo, 2018. When Losses turn into Loans:
The cost of Undercapitalized Banks, Working Paper, Harvard University.
Working Papers 30
[13] Bocola, L., 2016. The Pass-through of Sovereign Risk. Journal of Political
Economy, 124, 879-926.
[14] Bolton, P., X. Freixas, L. Gambacorta, and P. Mistrulli, 2016. Relationship
and transaction lending in a crisis, Review of Financial Studies, 29 (10),
2643-2676
[15] Boot, A.W.A., 2000. Relationship Banking: What Do We Know?, Journal
of Financial Intermediation, 9, 7-25.
[16] Boot, A. W.A. and A. Thakor, 1994. Moral Hazard and Secured Lending
in an In�nitely Repeated Credit Market Game, International Economic
Review, 35, 899-920.
[17] Brunnermeier, M., L. Garicano, P. R. Lane, M. Pagano, R. Reis, T. Santos,
D. Thesmar, S. Nieuwerburgh, and D. Vayanos, 2011. European Safe
Bonds (Esbies), www.euronomics.com.
[18] Buera, F. J., and S. Karmakar, 2018. Real E�ects of Financial Distress:
Role of Heterogeneity, Bank of Portugal, Working Paper No. 06/2018.
[19] Célérier, C., T. Kick, and S. Ongena, 2018. Taxing bank leverage, Working
paper
[20] Chodorow-Reich, G., 2014. The Employment E�ects of Credit Market
Disruptions: Firm-level Evidence from the 2008�9 Financial Crisis, The
Quarterly Journal of Economics 129 (1): 1-59.
[21] Cingano, F., F. Manaresi, and E. Sette, 2016. Does Credit Crunch
Investment Down?, Review of Financial Studies, 29 (10), 2737-2773.
[22] Committee on the Global Financial System, 2011. No 43, Bank for
International Settlements.
[23] Degryse, H., O. De Jonghe, S. Jakovljévic, K. Mulier, and G. Schepens,
2018. Identifying credit supply shocks with bank-�rm data: Methods and
applications.
[24] Degryse, H. and P. Van Cayseele, 2000. Relationship lending within a
bank-based system, Journal of Financial Intermediation, 9, 90-109.
[25] Degryse, H., M. Kim, and S. Ongena, 2009. The Microeconometrics of
Banking: Methods, Applications and Results, Oxford University Press.
[26] Fraisse, H., M. Lé, and D. Thesmar, 2015. The real e�ects of bank capital
requirements, Working paper
31 To Ask or Not To Ask? Collateral versus Screening in Lending Relationships
[27] Gropp, R., T. Mosk, S. Ongena and C. Wix, 2018. Bank Response to
Higher Capital Requirements: Evidence from a Quasi-natural Experiment,
Forthcoming Review of Financial Studies
[28] Hanson, S.G., A.K. Kashyap, and J.C. Stein, 2011. A Macroprudential
Approach to Financial Regulation, Journal of Economic Perspectives, 25,
3�28.
[29] Inderst. R., and H.M. Muller, 2007. A Lender-based Theory of Collateral,
Journal of Financial Economics, 84, 826�859.
[30] Iyer, R., J. L. Peydró, S. da-Rocha-Lopes, and A. Schoar, 2014. Interbank
Liquidity Crunch and the Firm Credit Crunch: Evidence from the 2007�
2009 Crisis, Review of Financial Studies, 27(1), 347-372.
[31] Jiménez, G., V. Salas and J. Saurina, 2006. Determinants of Collateral,
Journal of Financial Economics, 81, 255-281.
[32] Juelsrud, E. R., and E. G. Wold, 2018. Risk-Weighted Capital
Requirements and Portfolio Rebalancing, Working Paper, BI Norwegian
Business School.
[33] Karapetyan, A. and B. Stacescu, 2018. Collateral versus Informed
Screening during Banking Relationships, Working Paper.
[34] Kysucky, V., and L. Norden, 2016. The Bene�ts of Relationship Lending
in a Cross-Country Context: A Meta-Analysis, Management Science, 62,
90-110.
[35] Liberti, J., and M. Petersen, 2017. Information: Hard and Soft, mimeo.
[36] Manove, M., J. Padilla and M. Pagano, 2001. Collateral versus Project
Screening: A Model of Lazy Banks, RAND Journal of Economics, 32, 726-
44.
[37] Mayordomo, S., A. Moreno, S. Ongena and M.Rodríguez, 2018. Keeping it
Personal� or �Getting Real�? On the Drivers and E�ectiveness of Personal
versus Real Loan Guarantees.
[38] Mésonnier, J.S., and A. Monks, Did the EBA Capital Exercise Cause
a Credit Crunch in the Euro Area?, International Journal of Central
Banking, 11, 75-117.
[39] OECD (2016), Financing SMEs and Entrepreneurs. An OECD Scoreboard,
Paris.
Working Papers 32
[40] Ongena S., J. L. Peydró and N. van Horen, 2015. Shocks Abroad, Pain
at Home? Bank-�rm Level Evidence on Financial Contagion During the
Recent Financial Crisis, IMF Economic Review, 63(4), 698-750.
[41] Petersen, M., and R.G. Rajan, 1994. The Bene�ts of Lending
Relationships: Evidence from Small Business Data, Journal of Finance,
49, 3-37.
[42] Petersen, M., and R.G. Rajan, 1995. The E�ect of Credit Market
Competition on Lending Relationships, Quarterly Journal of Economics,
110, 407-443.
[43] Reis, R., 2013. The Portuguese Slump and Crash and the Euro Crisis,
Brookings Papers on Economic Activity, spring, 143-210.
[44] Small Business Administration, https://www.sba.gov/advocacy/small-
business-lending-united-states-2013
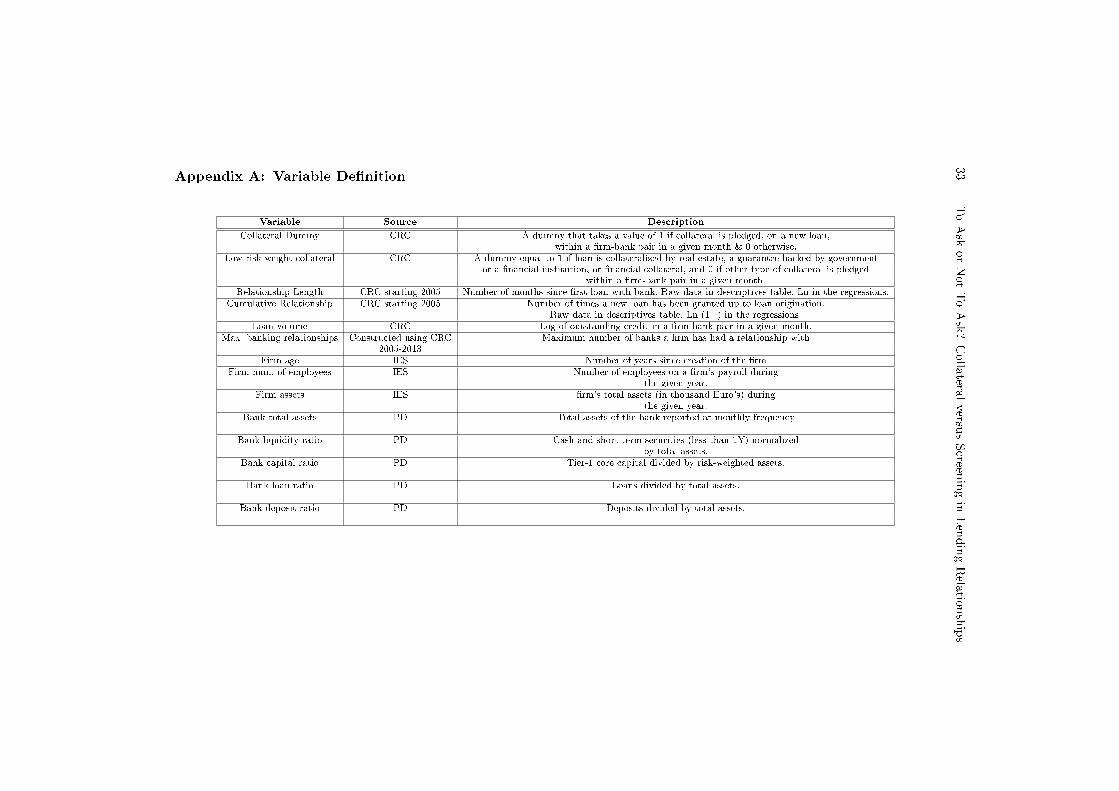
33
ToAsk
orNotToAsk?Colla
teralversu
sScreen
ingin
LendingRela
tionships
Appendix A: Variable De�nition
Variable Source Description
Collateral Dummy CRC A dummy that takes a value of 1 if collateral is pledged, on a new loan,within a �rm-bank pair in a given month & 0 otherwise.
Low risk weight collateral CRC A dummy equal to 1 if loan is collateralized by real estate, a guarantee backed by governmentor a �nancial institution, or �nancial collateral, and 0 if other type of collateral is pledged
within a �rm-bank pair in a given month.Relationship Length CRC starting 2005 Number of months since �rst loan with bank. Raw data in descriptives table. Ln in the regressions.
Cumulative Relationship CRC starting 2005 Number of times a new loan has been granted up to loan origination.Raw data in descriptives table. Ln (1+) in the regressions.
Loan volume CRC Log of outstanding credit in a �rm-bank pair in a given month.Max. banking relationships Constructed using CRC Maximum number of banks a �rm has had a relationship with
2005-2013Firm age IES Number of years since creation of the �rm
Firm num. of employees IES Number of employees on a �rm's payroll duringthe given year.
Firm assets IES �rm's total assets (in thousand Euro's) duringthe given year.
Bank total assets PD Total assets of the bank reported at monthly frequency
Bank liquidity ratio PD Cash and short-term securities (less than 1Y) normalizedby total assets.
Bank capital ratio PD Tier-1 core capital divided by risk-weighted assets.
Bank loan ratio PD Loans divided by total assets.
Bank deposit ratio PD Deposits divided by total assets.
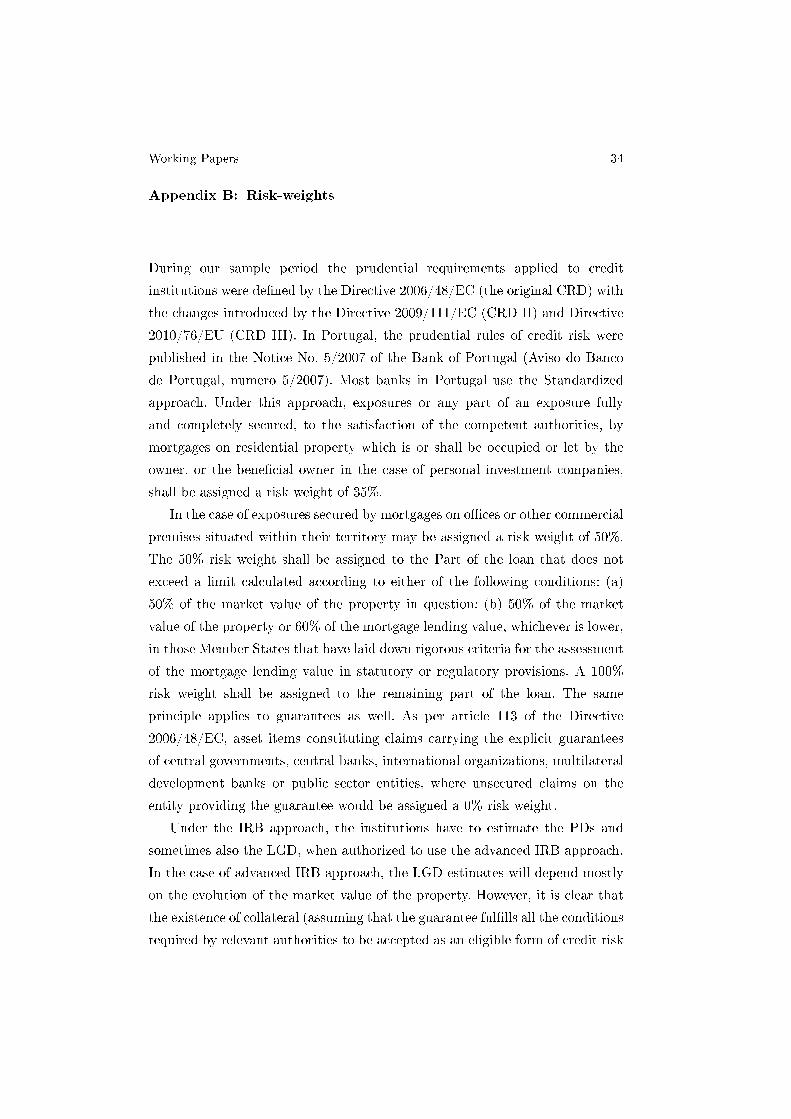
Working Papers 34
Appendix B: Risk-weights
During our sample period the prudential requirements applied to credit
institutions were de�ned by the Directive 2006/48/EC (the original CRD) with
the changes introduced by the Directive 2009/111/EC (CRD II) and Directive
2010/76/EU (CRD III). In Portugal, the prudential rules of credit risk were
published in the Notice No. 5/2007 of the Bank of Portugal (Aviso do Banco
de Portugal, numero 5/2007). Most banks in Portugal use the Standardized
approach. Under this approach, exposures or any part of an exposure fully
and completely secured, to the satisfaction of the competent authorities, by
mortgages on residential property which is or shall be occupied or let by the
owner, or the bene�cial owner in the case of personal investment companies,
shall be assigned a risk weight of 35%.
In the case of exposures secured by mortgages on o�ces or other commercial
premises situated within their territory may be assigned a risk weight of 50%.
The 50% risk weight shall be assigned to the Part of the loan that does not
exceed a limit calculated according to either of the following conditions: (a)
50% of the market value of the property in question; (b) 50% of the market
value of the property or 60% of the mortgage lending value, whichever is lower,
in those Member States that have laid down rigorous criteria for the assessment
of the mortgage lending value in statutory or regulatory provisions. A 100%
risk weight shall be assigned to the remaining part of the loan. The same
principle applies to guarantees as well. As per article 113 of the Directive
2006/48/EC, asset items constituting claims carrying the explicit guarantees
of central governments, central banks, international organizations, multilateral
development banks or public sector entities, where unsecured claims on the
entity providing the guarantee would be assigned a 0% risk weight.
Under the IRB approach, the institutions have to estimate the PDs and
sometimes also the LGD, when authorized to use the advanced IRB approach.
In the case of advanced IRB approach, the LGD estimates will depend mostly
on the evolution of the market value of the property. However, it is clear that
the existence of collateral (assuming that the guarantee ful�lls all the conditions
required by relevant authorities to be accepted as an eligible form of credit risk

35 To Ask or Not To Ask? Collateral versus Screening in Lending Relationships
mitigation) will imply a reduction of the LGD. The detailed procedure for the
calculation of PDs and LDs can be consulted in the Directive 2006/48/EC.

Working Papers
20161|16 A mixed frequency approach to forecast
private consumption with ATM/POS data
Cláudia Duarte | Paulo M. M. Rodrigues | António Rua
2|16 Monetary developments and expansionary fiscal consolidations: evidence from the EMU
António Afonso | Luís Martins
3|16 Output and unemployment, Portugal, 2008–2012
José R. Maria
4|16 Productivity and organization in portuguese firms
Lorenzo Caliendo | Luca David Opromolla | Giordano Mion | Esteban Rossi-Hansberg
5|16 Residual-augmented IVX predictive regression
Matei Demetrescu | Paulo M. M. Rodrigues
6|16 Understanding the public sector pay gap
Maria M. Campos | Evangelia Papapetrou | Domenico Depalo Javier J. Pérez | Roberto Ramos
7|16 Sorry, we’re closed: loan conditions when bank branches close and firms transfer to another bank
Diana Bonfim | Gil Nogueira | Steven Ongena
8|16 The effect of quantitative easing on lending conditions
Laura Blattner | Luísa Farinha | Gil Nogueira
9|16 Market integration and the persistence of electricity prices
João Pedro Pereira | Vasco Pesquita | Paulo M. M. Rodrigues | António Rua
10|16 EAGLE-FLI | A macroeconomic model of banking and financial interdependence in the euro area
N. Bokan | A. Gerali | S. Gomes | P. Jacquinot | M. Pisani
11|16 Temporary contracts’ transitions: the role of training and institutions
Sara Serra
12|16 A wavelet-based multivariate multiscale approach for forecasting
António Rua
13|16 Forecasting banking crises with dynamic panel probit models
António Antunes | Diana Bonfim | Nuno Monteiro | Paulo M. M. Rodrigues
14|16 A tale of two sectors: why is misallocation higher in services than in manufacturing?
Daniel A. Dias | Carlos Robalo Marques | Christine Richmond
15|16 The unsecured interbank money market: a description of the Portuguese case
SofiaSaldanha
16|16 Leverage and r isk weighted capital requirements
Leonardo Gambacorta | Sudipto Karmakar
17|16 Surviving the perfect storm: the role of the lender of last resort
NunoAlves|DianaBonfim|CarlaSoares
18|16 Public debt expansions and the dy-namics of the household borrowing constraint
António Antunes | Valerio Ercolani
20171|17 The diffusion of knowledge via managers’
mobility
Giordano Mion | Luca David Opromolla | Alessandro Sforza
2|17 Upward nominal wage rigidity
Paulo Guimarães | Fernando Martins | Pedro Portugal
3|17 Zooming the ins and outs of the U.S. unemployment
Pedro Portugal | António Rua
4|17 Labor market imperfections and the firm’s wage setting policy
Sónia Félix | Pedro Portugal
5|17 International banking and cross-border effects of regulation: lessons from Portugal
DianaBonfim|SóniaCosta
6|17 Disentangling the channels from birthdate to educational attainment
Luís Martins | Manuel Coutinho Pereira
7|17 Who’s who in global value chains? A weight-ed network approach
João Amador | Sónia Cabral | Rossana Mastrandrea | Franco Ruzzenenti
8|17 Lending relationships and the real economy: evidence in the context of the euro area sovereign debt crisis
Luciana Barbosa
9|17 Impact of uncertainty measures on the Portuguese economy
Cristina Manteu | Sara Serra
10|17 Modelling currency demand in a small open economy within a monetary union
António Rua
11|17 Boom, slump, sudden stops, recovery, and policy options. Portugal and the Euro
Olivier Blanchard | Pedro Portugal
12|17 Inefficiency distribution of the European Banking System
João Oliveira
13|17 Banks’ liquidity management and systemic risk
Luca G. Deidda | Ettore Panetti
14|17 Entrepreneurial risk and diversification through trade
Federico Esposito
15|17 The portuguese post-2008 period: a narra-tive from an estimated DSGE model
Paulo Júlio | José R. Maria
16|17 A theory of government bailouts in a het-erogeneous banking system
Filomena Garcia | Ettore Panetti
17|17 Goods and factor market integration: a quan-titative assessment of the EU enlargement
FLorenzo Caliendo | Luca David Opromolla | Fernando Parro | Alessandro Sforza
20181|18 Calibration and the estimation of macro-
economic models
Nikolay Iskrev
2|18 Are asset price data informative about news shocks? A DSGE perspective
Nikolay Iskrev
3|18 Sub-optimality of the friedman rule with distorting taxes
Bernardino Adão | André C. Silva
4|18 The effect of firm cash holdings on monetary policy
Bernardino Adão | André C. Silva
5|18 The returns to schooling unveiled
Ana Rute Cardoso | Paulo Guimarães | Pedro Portugal | Hugo Reis
6|18 Real effects of financial distress: the role of heterogeneity
Francisco Buera | Sudipto Karmakar
7|18 Did recent reforms facilitate EU labour mar-ket adjustment? Firm level evidence
Mario Izquierdo | Theodora Kosma | Ana Lamo | Fernando Martins | Simon Savsek
8|18 Flexible wage components as a source of wage adaptability to shocks: evidence from European firms, 2010–2013
Jan Babecký | Clémence Berson | Ludmila Fadejeva | Ana Lamo | Petra Marotzke | Fernando Martins | Pawel Strzelecki
9|18 The effects of official and unofficial informa-tion on tax compliance
Filomena Garcia | Luca David Opromolla Andrea Vezulli | Rafael Marques
10|18 International trade in services: evidence for portuguese firms
João Amador | Sónia Cabral | Birgitte Ringstad
11|18 Fear the walking dead: zombie firms, spillovers and exit barriers
Ana Fontoura Gouveia | Christian Osterhold
12|18 Collateral Damage? Labour Market Effects of Competing with China – at Home and Abroad
Sónia Cabral | Pedro S. Martins | João Pereira dos Santos | Mariana Tavares
13|18 An integrated financial amplifier: The role of defaulted loans and occasionally binding constraints in output fluctuations
Paulo Júlio | José R. Maria
14|18 Structural Changes in the Duration of Bull Markets and Business Cycle Dynamics
João Cruz | João Nicolau | Paulo M.M. Rodrigues
15|18 Cross-border spillovers of monetary policy: what changes during a financial crisis?
Luciana Barbosa | Diana Bonfim | Sónia Costa | Mary Everett
16|18 When losses turn into loans: the cost of undercapitalized banks
Laura Blattner | Luísa Farinha | Francisca Rebelo
17|18 Testing the fractionally integrated hypothesis using M estimation: With an application to stock market volatility
Matei Demetrescu | Paulo M. M. Rodrigues | Antonio Rubia

18|18 Every cloud has a silver lining: Micro-level evidence on the cleansing effects of the Portuguese financial crisis
Daniel A. Dias | Carlos Robalo Marques
19|18 To ask or not to ask? Collateral versus screening in lending relationships
Hans Degryse | Artashes Karapetyan | Sudipto Karmakar

www.bportugal.pt