Embed Size (px)
Citation preview
Lisa Thiebaud Nicoli & Letitia Logan Passarella
For the last few years, Maryland’s economy has been on the
upswing. In January 2017 the state’s unemployment rate was
4.2%, which is both lower than the national unemployment rate
and the lowest unemployment rate in Maryland since mid-2008
(U.S. Bureau of Labor Statistics, 2017). Although there were
6,700 new jobs in January 2017, many economists think the
economy may begin to slow down later in the year (Sherman,
2017). However, the labor market was strong enough that
almost 9,000 more people were either working or looking for
work (Sherman, 2017).
When the economy is doing well, fewer families tend to seek
assistance from safety net programs, such as Temporary Cash
Assistance (TCA). TCA, which is Maryland’s version of the
federal Temporary Assistance for Needy Families (TANF)
program, provides cash assistance to families experiencing
economic difficulties and other crises. When unemployment is
low, parents who lose their jobs are able to find new ones more
easily, and they can avoid relying on programs like TCA.
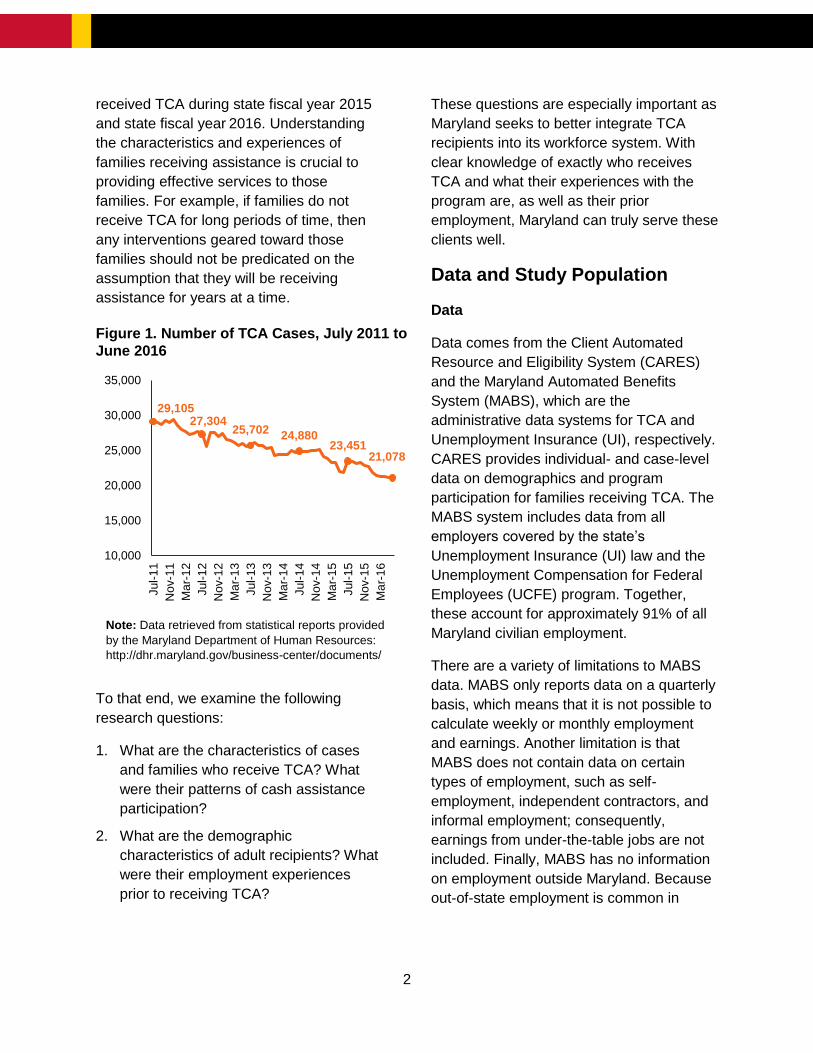
With the improving Maryland economy—and this relationship
between a thriving economy and safety-net programs—it is no
surprise that the number of families receiving TCA has been
steadily declining for years. Figure 1, below, shows the number
of TCA cases in each month from July 2011 through June 2016.
Over this five-year period, the number of families receiving TCA
decreased by over 25% from 29,105 to 21,078. In fact, after
June 2016, caseloads reached record lows. Until the most
recent few months, the fewest number of families in any month
since the 1996 welfare reform was 20,725 in March 2007. In
January 2017, there were only 19,749 families receiving TCA
(Maryland Department of Human Resources, 2017).
Given the low unemployment rate and declining caseloads, who
continues to receive TCA? In this brief, we focus on families—
and, in particular, adult recipients in those families—who
Statewide, the number of
cases declined 8% between
SFY2015 and SFY2016, and
most jurisdictions
experienced decreases in
their caseloads as well.
Most cases include one adult
and one or two children.
After the long-term disabled
designation was eliminated
in October 2015, over 80% of
those cases transitioned to a
work-eligible designation in a
subsequent month.
Adult recipients are typically
African American women in
their early 30s who have
finished high school but have
no further education.
Over half of adult recipients
worked in the year before
they received TCA, but they
usually did not work in all
four quarters.
Median annual earnings in
the year before receiving TCA
were about $5,000, which is
well below the poverty line for
a three-person family
($20,160).
Most commonly, adult
recipients worked in
administrative & support
services, restaurants, and
retail.
KEY FINDINGS
2
received TCA during state fiscal year 2015
and state fiscal year 2016. Understanding
the characteristics and experiences of
families receiving assistance is crucial to
providing effective services to those
families. For example, if families do not
receive TCA for long periods of time, then
any interventions geared toward those
families should not be predicated on the
assumption that they will be receiving
assistance for years at a time.
To that end, we examine the following
research questions:
1. What are the characteristics of cases
and families who receive TCA? What
were their patterns of cash assistance
participation?
2. What are the demographic
characteristics of adult recipients? What
were their employment experiences
prior to receiving TCA?
These questions are especially important as
Maryland seeks to better integrate TCA
recipients into its workforce system. With
clear knowledge of exactly who receives
TCA and what their experiences with the
program are, as well as their prior
employment, Maryland can truly serve these
clients well.
Data and Study Population
Data
Data comes from the Client Automated
Resource and Eligibility System (CARES)
and the Maryland Automated Benefits
System (MABS), which are the
administrative data systems for TCA and
Unemployment Insurance (UI), respectively.
CARES provides individual- and case-level
data on demographics and program
participation for families receiving TCA. The
MABS system includes data from all
employers covered by the state’s
Unemployment Insurance (UI) law and the
Unemployment Compensation for Federal
Employees (UCFE) program. Together,
these account for approximately 91% of all
Maryland civilian employment.
There are a variety of limitations to MABS
data. MABS only reports data on a quarterly
basis, which means that it is not possible to
calculate weekly or monthly employment
and earnings. Another limitation is that
MABS does not contain data on certain
types of employment, such as self-
employment, independent contractors, and
informal employment; consequently,
earnings from under-the-table jobs are not
included. Finally, MABS has no information
on employment outside Maryland. Because
out-of-state employment is common in
29,10527,304
25,70224,880
23,45121,078
10,000
15,000
20,000
25,000
30,000
35,000
Jul-
11
Nov-1
1
Ma
r-1
2
Jul-
12
Nov-1
2
Ma
r-1
3
Jul-
13
Nov-1
3
Ma
r-1
4
Jul-
14
Nov-1
4
Ma
r-1
5
Jul-
15
Nov-1
5
Ma
r-1
6
Note: Data retrieved from statistical reports provided
by the Maryland Department of Human Resources:
http://dhr.maryland.gov/business-center/documents/
Figure 1. Number of TCA Cases, July 2011 to
June 2016
3
Maryland,1 we are likely understating
employment and may be missing some
earnings.
Study Population
There have been substantial changes to
how we examine current recipients.
Previous reports on current TCA recipients
focused on families who received
assistance in October of a given year.
Demographic and employment analyses
included all payees, regardless of whether
they were recipients, and left out other
adults who were included on the case.
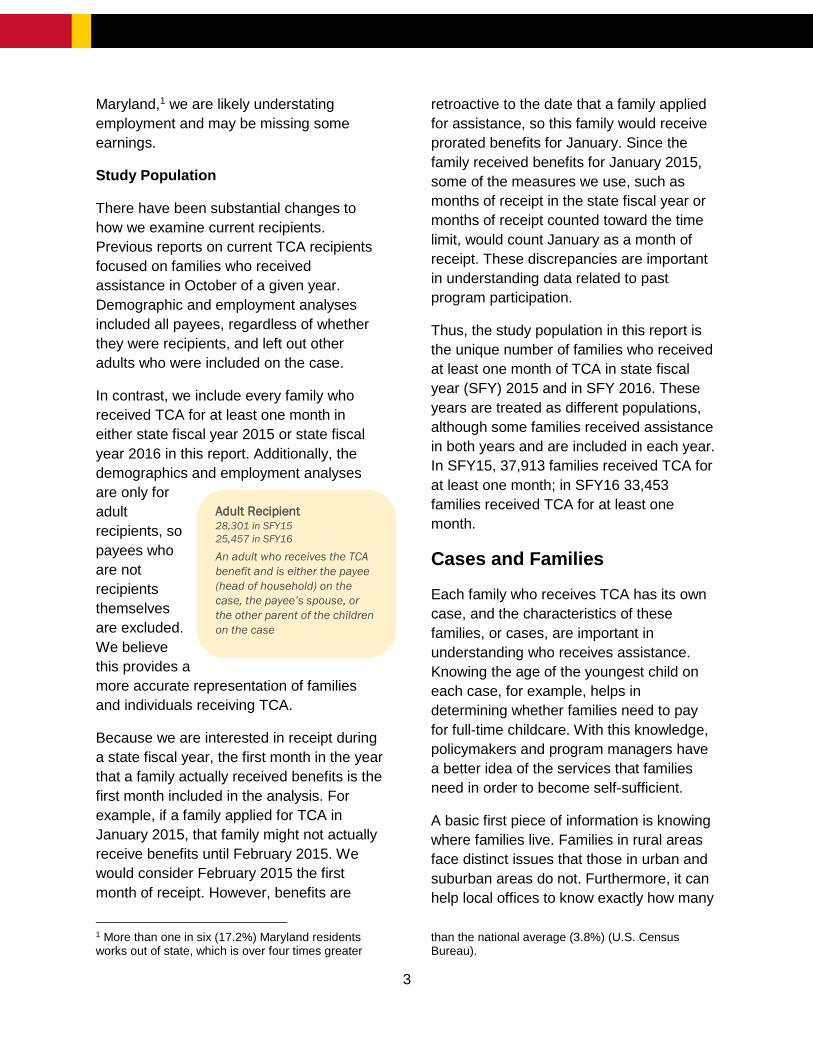
In contrast, we include every family who
received TCA for at least one month in
either state fiscal year 2015 or state fiscal
year 2016 in this report. Additionally, the
demographics and employment analyses
are only for
adult
recipients, so
payees who
are not
recipients
themselves
are excluded.
We believe
this provides a
more accurate representation of families
and individuals receiving TCA.
Because we are interested in receipt during
a state fiscal year, the first month in the year
that a family actually received benefits is the
first month included in the analysis. For
example, if a family applied for TCA in
January 2015, that family might not actually
receive benefits until February 2015. We
would consider February 2015 the first
month of receipt. However, benefits are
1 More than one in six (17.2%) Maryland residents works out of state, which is over four times greater
retroactive to the date that a family applied
for assistance, so this family would receive
prorated benefits for January. Since the
family received benefits for January 2015,
some of the measures we use, such as
months of receipt in the state fiscal year or
months of receipt counted toward the time
limit, would count January as a month of
receipt. These discrepancies are important
in understanding data related to past
program participation.
Thus, the study population in this report is
the unique number of families who received
at least one month of TCA in state fiscal
year (SFY) 2015 and in SFY 2016. These
years are treated as different populations,
although some families received assistance
in both years and are included in each year.
In SFY15, 37,913 families received TCA for
at least one month; in SFY16 33,453
families received TCA for at least one
month.
Cases and Families
Each family who receives TCA has its own
case, and the characteristics of these
families, or cases, are important in
understanding who receives assistance.
Knowing the age of the youngest child on
each case, for example, helps in
determining whether families need to pay
for full-time childcare. With this knowledge,
policymakers and program managers have
a better idea of the services that families
need in order to become self-sufficient.
A basic first piece of information is knowing
where families live. Families in rural areas
face distinct issues that those in urban and
suburban areas do not. Furthermore, it can
help local offices to know exactly how many
than the national average (3.8%) (U.S. Census Bureau).
Adult Recipient 28,301 in SFY15
25,457 in SFY16
An adult who receives the TCA
benefit and is either the payee
(head of household) on the
case, the payee’s spouse, or
the other parent of the children
on the case
4
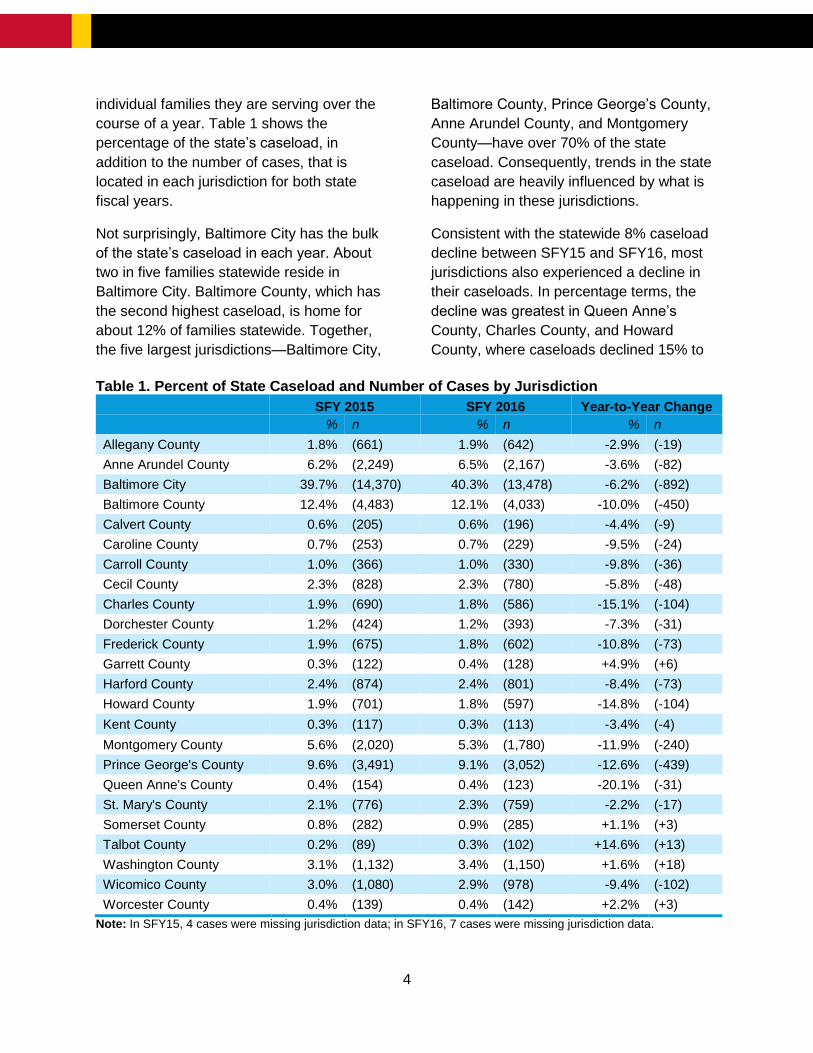
individual families they are serving over the
course of a year. Table 1 shows the
percentage of the state’s caseload, in
addition to the number of cases, that is
located in each jurisdiction for both state
fiscal years.
Not surprisingly, Baltimore City has the bulk
of the state’s caseload in each year. About
two in five families statewide reside in
Baltimore City. Baltimore County, which has
the second highest caseload, is home for
about 12% of families statewide. Together,
the five largest jurisdictions—Baltimore City,
Baltimore County, Prince George’s County,
Anne Arundel County, and Montgomery
County—have over 70% of the state
caseload. Consequently, trends in the state
caseload are heavily influenced by what is
happening in these jurisdictions.
Consistent with the statewide 8% caseload
decline between SFY15 and SFY16, most
jurisdictions also experienced a decline in
their caseloads. In percentage terms, the
decline was greatest in Queen Anne’s
County, Charles County, and Howard
County, where caseloads declined 15% to
Table 1. Percent of State Caseload and Number of Cases by Jurisdiction
SFY 2015 SFY 2016 Year-to-Year Change
% n % n % n
Allegany County 1.8% (661) 1.9% (642) -2.9% (-19)
Anne Arundel County 6.2% (2,249) 6.5% (2,167) -3.6% (-82)
Baltimore City 39.7% (14,370) 40.3% (13,478) -6.2% (-892)
Baltimore County 12.4% (4,483) 12.1% (4,033) -10.0% (-450)
Calvert County 0.6% (205) 0.6% (196) -4.4% (-9)
Caroline County 0.7% (253) 0.7% (229) -9.5% (-24)
Carroll County 1.0% (366) 1.0% (330) -9.8% (-36)
Cecil County 2.3% (828) 2.3% (780) -5.8% (-48)
Charles County 1.9% (690) 1.8% (586) -15.1% (-104)
Dorchester County 1.2% (424) 1.2% (393) -7.3% (-31)
Frederick County 1.9% (675) 1.8% (602) -10.8% (-73)
Garrett County 0.3% (122) 0.4% (128) +4.9% (+6)
Harford County 2.4% (874) 2.4% (801) -8.4% (-73)
Howard County 1.9% (701) 1.8% (597) -14.8% (-104)
Kent County 0.3% (117) 0.3% (113) -3.4% (-4)
Montgomery County 5.6% (2,020) 5.3% (1,780) -11.9% (-240)
Prince George's County 9.6% (3,491) 9.1% (3,052) -12.6% (-439)
Queen Anne's County 0.4% (154) 0.4% (123) -20.1% (-31)
St. Mary's County 2.1% (776) 2.3% (759) -2.2% (-17)
Somerset County 0.8% (282) 0.9% (285) +1.1% (+3)
Talbot County 0.2% (89) 0.3% (102) +14.6% (+13)
Washington County 3.1% (1,132) 3.4% (1,150) +1.6% (+18)
Wicomico County 3.0% (1,080) 2.9% (978) -9.4% (-102)
Worcester County 0.4% (139) 0.4% (142) +2.2% (+3)
Note: In SFY15, 4 cases were missing jurisdiction data; in SFY16, 7 cases were missing jurisdiction data.
5
20%. However, three large jurisdictions—
Baltimore County, Montgomery County, and
Prince George’s County—all had decreases
of 10% to 13%. As a result, about 40% of
the total caseload decline came from those
three counties.
Only a handful of mostly small jurisdictions
had any increase in their caseloads. These
increases were typically miniscule, as
Garrett County, Somerset County, and
Worcester County each had increases of
less than seven cases. Talbot County,
which had the smallest caseload in the state
in both years, added 13 cases. Washington
County was the only jurisdiction with more
than 1% of the state caseload that had any
increase, and it rose less than 2%. While
these increases are very minor, it is
noteworthy that they all occur in either
western Maryland or the Eastern Shore—
that is, in the more rural parts of the state.
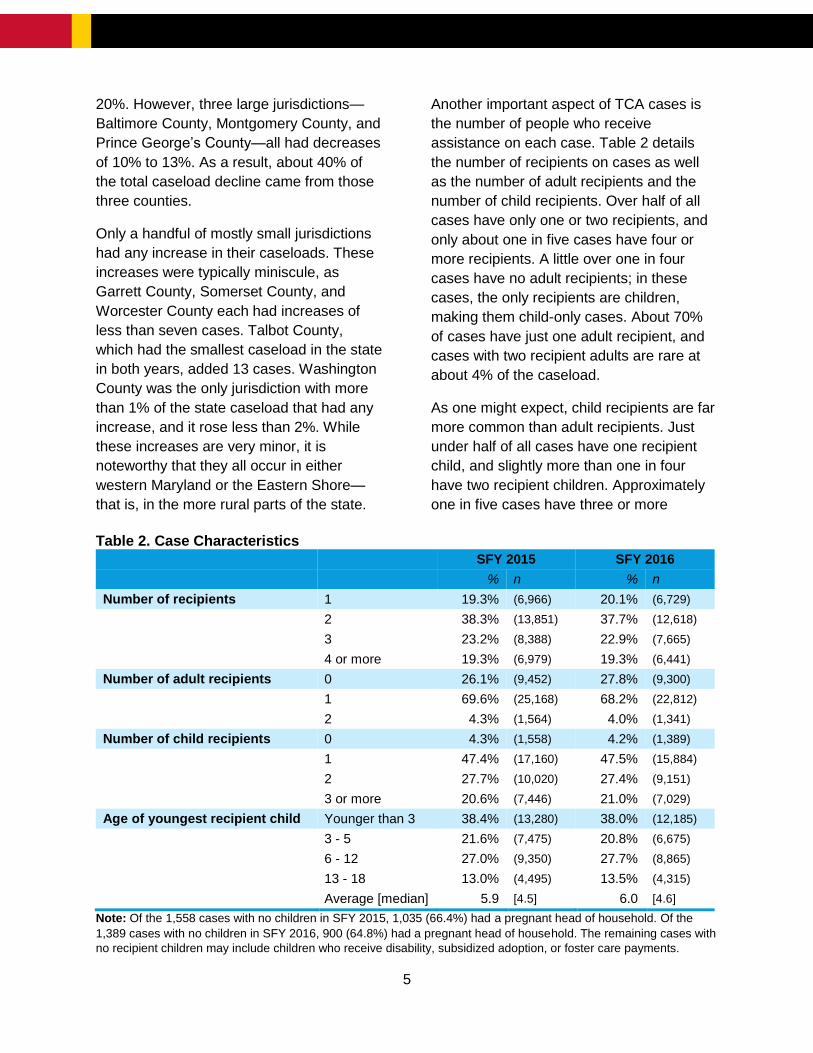
Another important aspect of TCA cases is
the number of people who receive
assistance on each case. Table 2 details
the number of recipients on cases as well
as the number of adult recipients and the
number of child recipients. Over half of all
cases have only one or two recipients, and
only about one in five cases have four or
more recipients. A little over one in four
cases have no adult recipients; in these
cases, the only recipients are children,
making them child-only cases. About 70%
of cases have just one adult recipient, and
cases with two recipient adults are rare at
about 4% of the caseload.
As one might expect, child recipients are far
more common than adult recipients. Just
under half of all cases have one recipient
child, and slightly more than one in four
have two recipient children. Approximately
one in five cases have three or more
Table 2. Case Characteristics
SFY 2015 SFY 2016
% n % n
Number of recipients 1 19.3% (6,966) 20.1% (6,729)
2 38.3% (13,851) 37.7% (12,618)
3 23.2% (8,388) 22.9% (7,665)
4 or more 19.3% (6,979) 19.3% (6,441)
Number of adult recipients 0 26.1% (9,452) 27.8% (9,300)
1 69.6% (25,168) 68.2% (22,812)
2 4.3% (1,564) 4.0% (1,341)
Number of child recipients 0 4.3% (1,558) 4.2% (1,389)
1 47.4% (17,160) 47.5% (15,884)
2 27.7% (10,020) 27.4% (9,151)
3 or more 20.6% (7,446) 21.0% (7,029)
Age of youngest recipient child Younger than 3 38.4% (13,280) 38.0% (12,185)
3 - 5 21.6% (7,475) 20.8% (6,675)
6 - 12 27.0% (9,350) 27.7% (8,865)
13 - 18 13.0% (4,495) 13.5% (4,315)
Average [median] 5.9 [4.5] 6.0 [4.6]
Note: Of the 1,558 cases with no children in SFY 2015, 1,035 (66.4%) had a pregnant head of household. Of the
1,389 cases with no children in SFY 2016, 900 (64.8%) had a pregnant head of household. The remaining cases with
no recipient children may include children who receive disability, subsidized adoption, or foster care payments.
6
recipient children. Table 2 also shows that
the youngest child on each case is, on
average, quite young. More than one in
three children are less than three years old,
and an additional 20% are ages three to
five. Over half of the youngest recipient
children, then, would need daycare or after-
school care for kindergartners in order for
their parents to work full-time. Less than
15% of the youngest recipient children are
teenagers who would not need constant
supervision, meaning that the cost of
daycare and after-school care is relevant for
most TCA families.
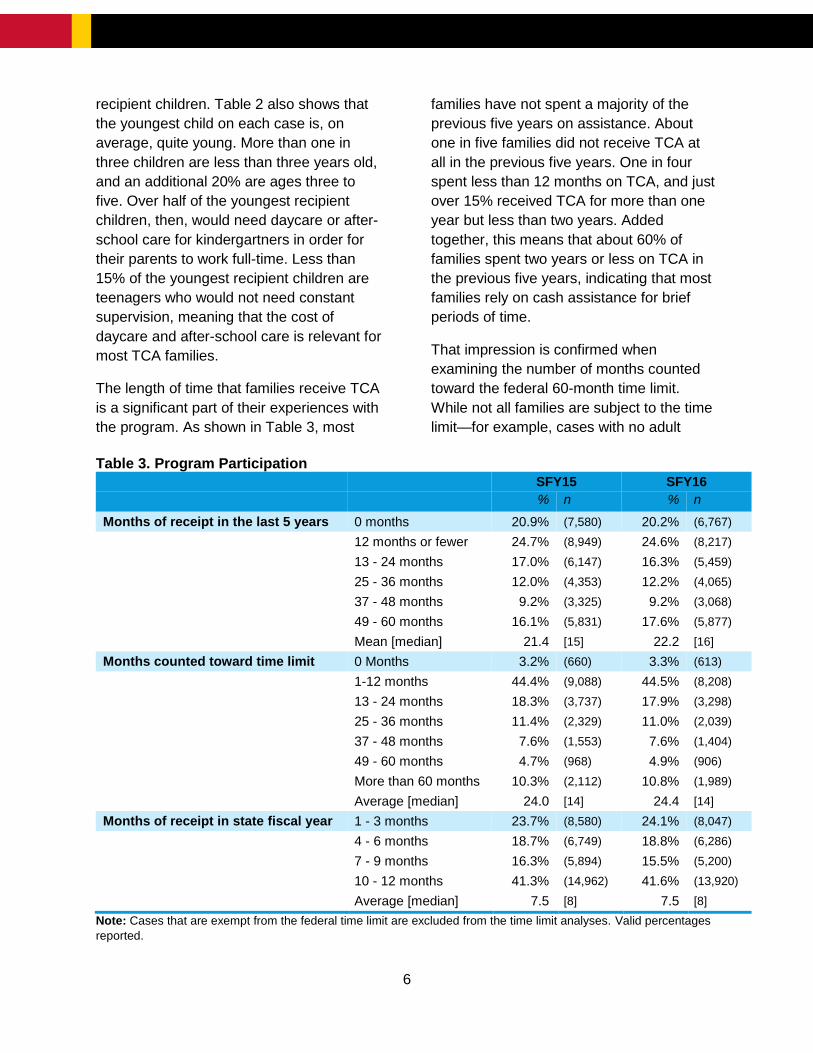
The length of time that families receive TCA
is a significant part of their experiences with
the program. As shown in Table 3, most
families have not spent a majority of the
previous five years on assistance. About
one in five families did not receive TCA at
all in the previous five years. One in four
spent less than 12 months on TCA, and just
over 15% received TCA for more than one
year but less than two years. Added
together, this means that about 60% of
families spent two years or less on TCA in
the previous five years, indicating that most
families rely on cash assistance for brief
periods of time.
That impression is confirmed when
examining the number of months counted
toward the federal 60-month time limit.
While not all families are subject to the time
limit—for example, cases with no adult
Table 3. Program Participation
SFY15 SFY16
% n % n
Months of receipt in the last 5 years 0 months 20.9% (7,580) 20.2% (6,767)
12 months or fewer 24.7% (8,949) 24.6% (8,217)
13 - 24 months 17.0% (6,147) 16.3% (5,459)
25 - 36 months 12.0% (4,353) 12.2% (4,065)
37 - 48 months 9.2% (3,325) 9.2% (3,068)
49 - 60 months 16.1% (5,831) 17.6% (5,877)
Mean [median] 21.4 [15] 22.2 [16]
Months counted toward time limit 0 Months 3.2% (660) 3.3% (613)
1-12 months 44.4% (9,088) 44.5% (8,208)
13 - 24 months 18.3% (3,737) 17.9% (3,298)
25 - 36 months 11.4% (2,329) 11.0% (2,039)
37 - 48 months 7.6% (1,553) 7.6% (1,404)
49 - 60 months 4.7% (968) 4.9% (906)
More than 60 months 10.3% (2,112) 10.8% (1,989)
Average [median] 24.0 [14] 24.4 [14]
Months of receipt in state fiscal year 1 - 3 months 23.7% (8,580) 24.1% (8,047) 4 - 6 months 18.7% (6,749) 18.8% (6,286) 7 - 9 months 16.3% (5,894) 15.5% (5,200) 10 - 12 months 41.3% (14,962) 41.6% (13,920)
Average [median] 7.5 [8] 7.5 [8]
Note: Cases that are exempt from the federal time limit are excluded from the time limit analyses. Valid percentages
reported.
7
recipients are exempt due to federal law,
and Maryland chooses to exclude cases
that have an adult recipient in unsubsidized
employment—those who do accrue time-
limited months are well below the 60-month
limit. Almost half of all families subject to the
time limit have 12 or fewer months, and only
10% have more than 60 months.2 Indeed,
the median number of time-limited months
(14) suggests that most families are very far
from reaching the 60-month limit.3
In addition to looking at receipt prior to the
state fiscal year, we also explore the
number of months that families received
TCA in the state fiscal year. Most
commonly, families received assistance for
about eight months during the fiscal year.
Slightly less than one in four had between
one and three months of TCA receipt during
the fiscal year; over 40% have 10 to 12
months of receipt. The percentage with 10
to 12 months of receipt declines
considerably if child-only cases, which are
not subject to time limits or work
requirements, are excluded. Among all
other cases, about 32% have 10 to 12
months of receipt, compared to about 41% if
child-only cases are included. This implies
that cases with adult recipients typically
receive assistance for shorter periods of
time.
Families who receive TCA have a myriad of
different needs. Some families are dealing
with disabilities in adults or children, other
families have experienced domestic
violence, and still others are legal,
noncitizen immigrants. To better serve
families with these varying needs, Maryland
2 Federal law allows states to exempt up to 20% of the caseload from the time limit if those families are experiencing hardship. 3 The median is the middle value of a distribution. Half of families subject to the time limit accrued 14 months
uses a classification system to group
families into categories related to those
needs. At the most basic level, the system
distinguishes between cases that are work-
eligible—that is, the adult on the case is
required to participate in work-related
activities as a condition of receiving
assistance—and cases that are work-
exempt. Work-exempt cases, such as those
without adult recipients or those in which
there is a child under the age of one,4 have
no obligation to participate in work activities.
While some cases may fit more than one
designation, each case has only one
designation. An algorithm, which operates
hierarchically, assigns cases to the
appropriate designation.
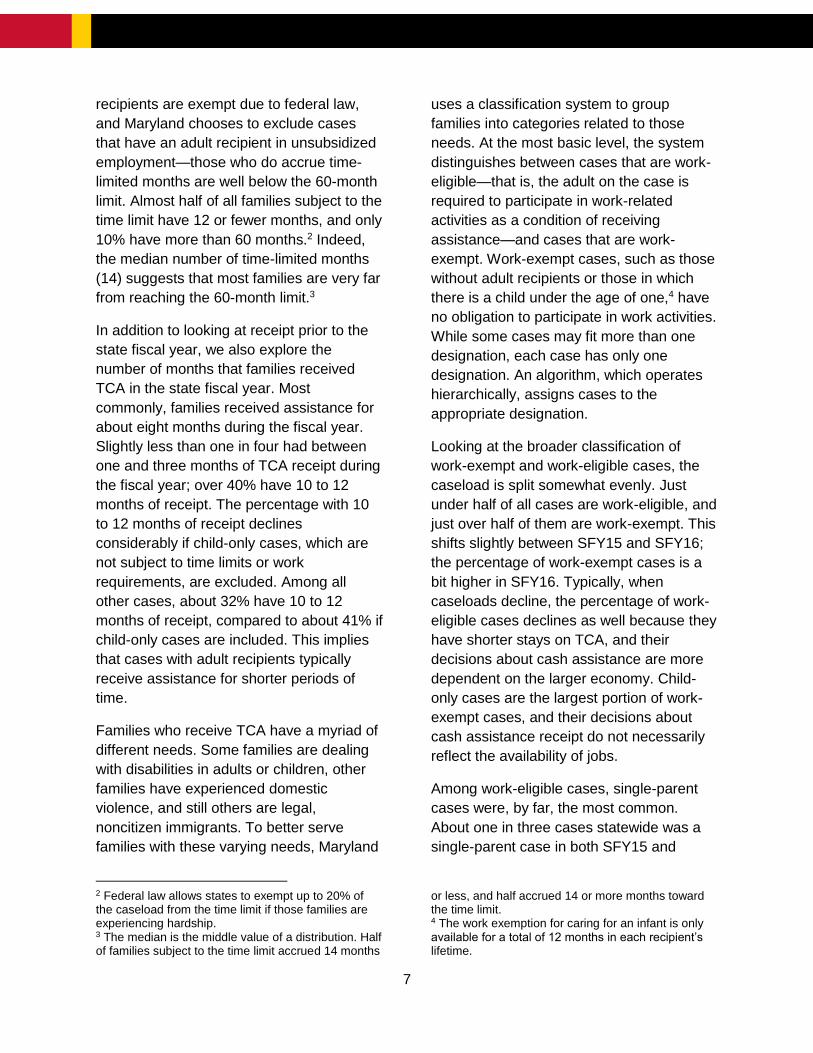
Looking at the broader classification of
work-exempt and work-eligible cases, the
caseload is split somewhat evenly. Just
under half of all cases are work-eligible, and
just over half of them are work-exempt. This
shifts slightly between SFY15 and SFY16;
the percentage of work-exempt cases is a
bit higher in SFY16. Typically, when
caseloads decline, the percentage of work-
eligible cases declines as well because they
have shorter stays on TCA, and their
decisions about cash assistance are more
dependent on the larger economy. Child-
only cases are the largest portion of work-
exempt cases, and their decisions about
cash assistance receipt do not necessarily
reflect the availability of jobs.
Among work-eligible cases, single-parent
cases were, by far, the most common.
About one in three cases statewide was a
single-parent case in both SFY15 and
or less, and half accrued 14 or more months toward the time limit. 4 The work exemption for caring for an infant is only available for a total of 12 months in each recipient’s lifetime.
8
Table 4. Caseload Designation
SFY 2015 SFY 2016
% n % n
Work-eligible 47.4% (17,119) 45.8% (15,314)
Single-parent cases 33.9% (12,269) 33.5% (11,197)
Earnings cases 4.4% (1,590) 4.5% (1,507)
Short-term disabled 4.3% (1,551) 3.5% (1,159)
Legal immigrant 0.8% (299) 0.7% (240)
Domestic violence 0.9% (317) 0.9% (288)
Two-parent cases 3.0% (1,093) 2.8% (923)
Work-exempt 52.6% (19,035) 54.2% (18,111)
Child-only 26.1% (9,451) 27.9% (9,332)
Child under one 9.9% (3,570) 9.8% (3,272)
Long-term disabled 13.0% (4,697) 12.4% (4,157)
Caring for disabled family member 2.3% (820) 2.6% (865)
Needy caretaker relative 1.4% (497) 1.5% (485)
Note: Valid percentages reported.
SFY16. No other work-eligible caseload
designation constituted more than 5% of the
state caseload. About 4% of cases were
earnings cases, and another 4% were short-
term disabled cases. Only about 3% were
two-parent cases, and less than 1% each
were either legal immigrant or domestic
violence cases.
Work-exempt cases were less dominated by
a single designation. While child-only cases
were the most common—slightly more than
one in four cases statewide in each year
was child-only—over 10% were long-term
disabled, and 10% were classified as child
under one. About 2% to 3% of cases were
work-exempt due to caring for a disabled
family member, and less than 2% were
needy caretaker relative cases.
Although we list long-term disabled cases
as work-exempt, that does not reflect their
current status. In October 2015, four months
into SFY16, the long-term disabled category
was eliminated, and the cases were
reclassified into the next most appropriate
category. The percentage and number that
we present in Table 4 represents families
whose first month of receipt in SFY16 was
July, August, or September 2015. Beginning
with October 2015, no cases were
designated as long-term disabled.
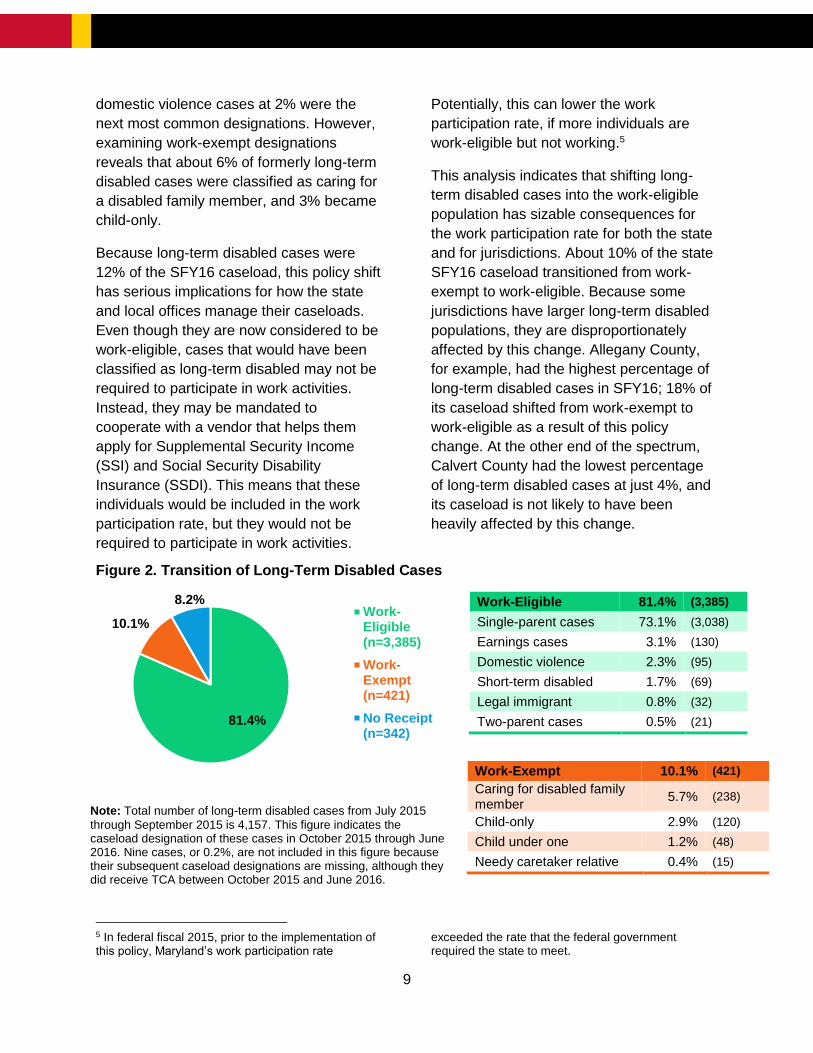
To explore what happened to long-term
disabled cases, we follow the 4,157 cases
that were designated as long-term disabled
in the first three months of SFY16. Figure 2
shows whether cases initially designated as
long-term disabled became work-eligible or
work-exempt during the next month that the
family received benefits in SFY16. Over
80% of long-term disabled cases
transitioned to a work-eligible caseload
designation, and 10% shifted to a different
work-exempt designation. An additional 8%
of cases did not receive TCA in any
subsequent month in SFY16.
As the tables next to the figure show, over
seven in 10 formerly long-term disabled
cases were classified as single-parent
cases in the next month that benefits were
received. With regard to other work-eligible
designations, earnings cases at 3% and
9
domestic violence cases at 2% were the
next most common designations. However,
examining work-exempt designations
reveals that about 6% of formerly long-term
disabled cases were classified as caring for
a disabled family member, and 3% became
child-only.
Because long-term disabled cases were
12% of the SFY16 caseload, this policy shift
has serious implications for how the state
and local offices manage their caseloads.
Even though they are now considered to be
work-eligible, cases that would have been
classified as long-term disabled may not be
required to participate in work activities.
Instead, they may be mandated to
cooperate with a vendor that helps them
apply for Supplemental Security Income
(SSI) and Social Security Disability
Insurance (SSDI). This means that these
individuals would be included in the work
participation rate, but they would not be
required to participate in work activities.
Potentially, this can lower the work
participation rate, if more individuals are
work-eligible but not working.5
This analysis indicates that shifting long-
term disabled cases into the work-eligible
population has sizable consequences for
the work participation rate for both the state
and for jurisdictions. About 10% of the state
SFY16 caseload transitioned from work-
exempt to work-eligible. Because some
jurisdictions have larger long-term disabled
populations, they are disproportionately
affected by this change. Allegany County,
for example, had the highest percentage of
long-term disabled cases in SFY16; 18% of
its caseload shifted from work-exempt to
work-eligible as a result of this policy
change. At the other end of the spectrum,
Calvert County had the lowest percentage
of long-term disabled cases at just 4%, and
its caseload is not likely to have been
heavily affected by this change.
Figure 2. Transition of Long-Term Disabled Cases
5 In federal fiscal 2015, prior to the implementation of this policy, Maryland’s work participation rate
exceeded the rate that the federal government required the state to meet.
81.4%
10.1%
8.2%Work-Eligible(n=3,385)
Work-Exempt(n=421)
No Receipt(n=342)
Work-Eligible 81.4% (3,385)
Single-parent cases 73.1% (3,038)
Earnings cases 3.1% (130)
Domestic violence 2.3% (95)
Short-term disabled 1.7% (69)
Legal immigrant 0.8% (32)
Two-parent cases 0.5% (21)
Work-Exempt 10.1% (421)
Caring for disabled family member
5.7% (238)
Child-only 2.9% (120)
Child under one 1.2% (48)
Needy caretaker relative 0.4% (15)
Note: Total number of long-term disabled cases from July 2015
through September 2015 is 4,157. This figure indicates the caseload designation of these cases in October 2015 through June 2016. Nine cases, or 0.2%, are not included in this figure because their subsequent caseload designations are missing, although they did receive TCA between October 2015 and June 2016.
10
Adult Recipients
Because self-sufficiency is the goal for most
families receiving TCA, adult recipients are
a critical part of the program. Interventions
usually target adult recipients, helping them
improve their skills or find good-paying jobs.
In order to ensure that these interventions
are based on a solid understanding of adult
recipients’ needs, we present demographic
information as well as employment and
earnings histories for all adult recipients.
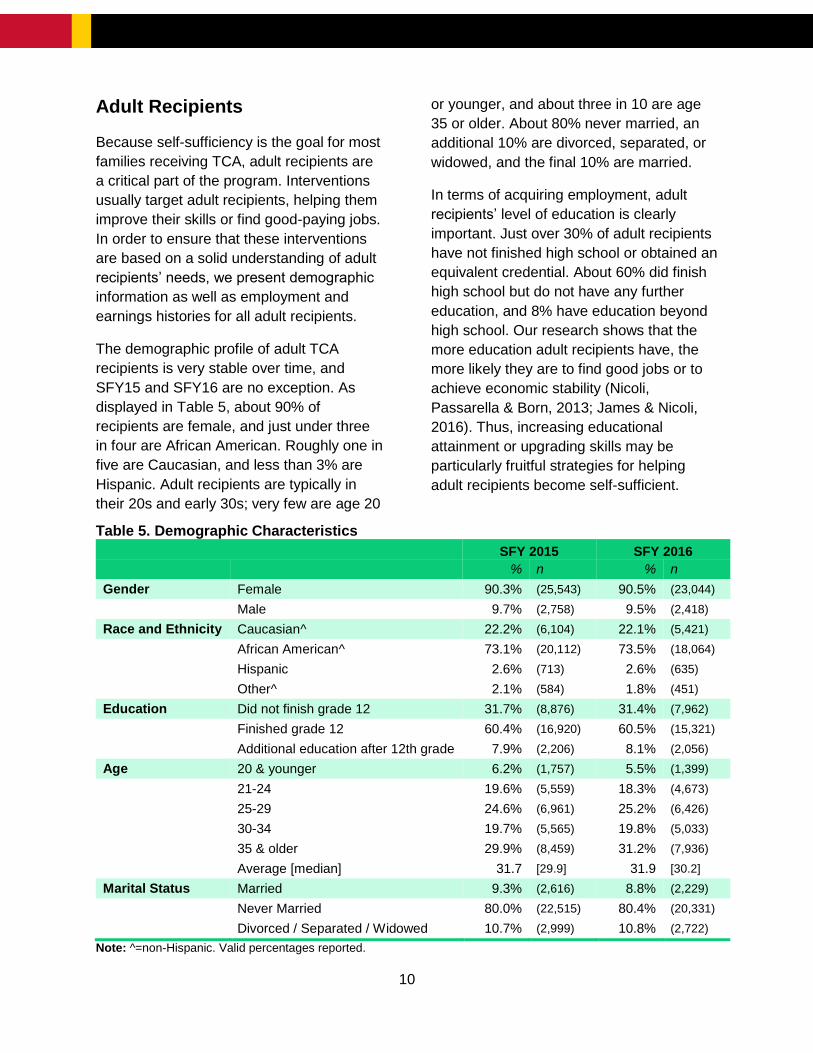
The demographic profile of adult TCA
recipients is very stable over time, and
SFY15 and SFY16 are no exception. As
displayed in Table 5, about 90% of
recipients are female, and just under three
in four are African American. Roughly one in
five are Caucasian, and less than 3% are
Hispanic. Adult recipients are typically in
their 20s and early 30s; very few are age 20
or younger, and about three in 10 are age
35 or older. About 80% never married, an
additional 10% are divorced, separated, or
widowed, and the final 10% are married.
In terms of acquiring employment, adult
recipients’ level of education is clearly
important. Just over 30% of adult recipients
have not finished high school or obtained an
equivalent credential. About 60% did finish
high school but do not have any further
education, and 8% have education beyond
high school. Our research shows that the
more education adult recipients have, the
more likely they are to find good jobs or to
achieve economic stability (Nicoli,
Passarella & Born, 2013; James & Nicoli,
2016). Thus, increasing educational
attainment or upgrading skills may be
particularly fruitful strategies for helping
adult recipients become self-sufficient.
Table 5. Demographic Characteristics
SFY 2015 SFY 2016
% n % n
Gender Female 90.3% (25,543) 90.5% (23,044)
Male 9.7% (2,758) 9.5% (2,418)
Race and Ethnicity Caucasian^ 22.2% (6,104) 22.1% (5,421)
African American^ 73.1% (20,112) 73.5% (18,064)
Hispanic 2.6% (713) 2.6% (635)
Other^ 2.1% (584) 1.8% (451)
Education Did not finish grade 12 31.7% (8,876) 31.4% (7,962)
Finished grade 12 60.4% (16,920) 60.5% (15,321)
Additional education after 12th grade 7.9% (2,206) 8.1% (2,056)
Age 20 & younger 6.2% (1,757) 5.5% (1,399)
21-24 19.6% (5,559) 18.3% (4,673)
25-29 24.6% (6,961) 25.2% (6,426)
30-34 19.7% (5,565) 19.8% (5,033)
35 & older 29.9% (8,459) 31.2% (7,936)
Average [median] 31.7 [29.9] 31.9 [30.2]
Marital Status Married 9.3% (2,616) 8.8% (2,229)
Never Married 80.0% (22,515) 80.4% (20,331)
Divorced / Separated / Widowed 10.7% (2,999) 10.8% (2,722)
Note: ^=non-Hispanic. Valid percentages reported.
11
Figure 3. Percent Employed Year before TCA Receipt
Figure 4. Number of Quarters Worked Year before TCA Receipt
6 Earnings are standardized to 2016 dollars.
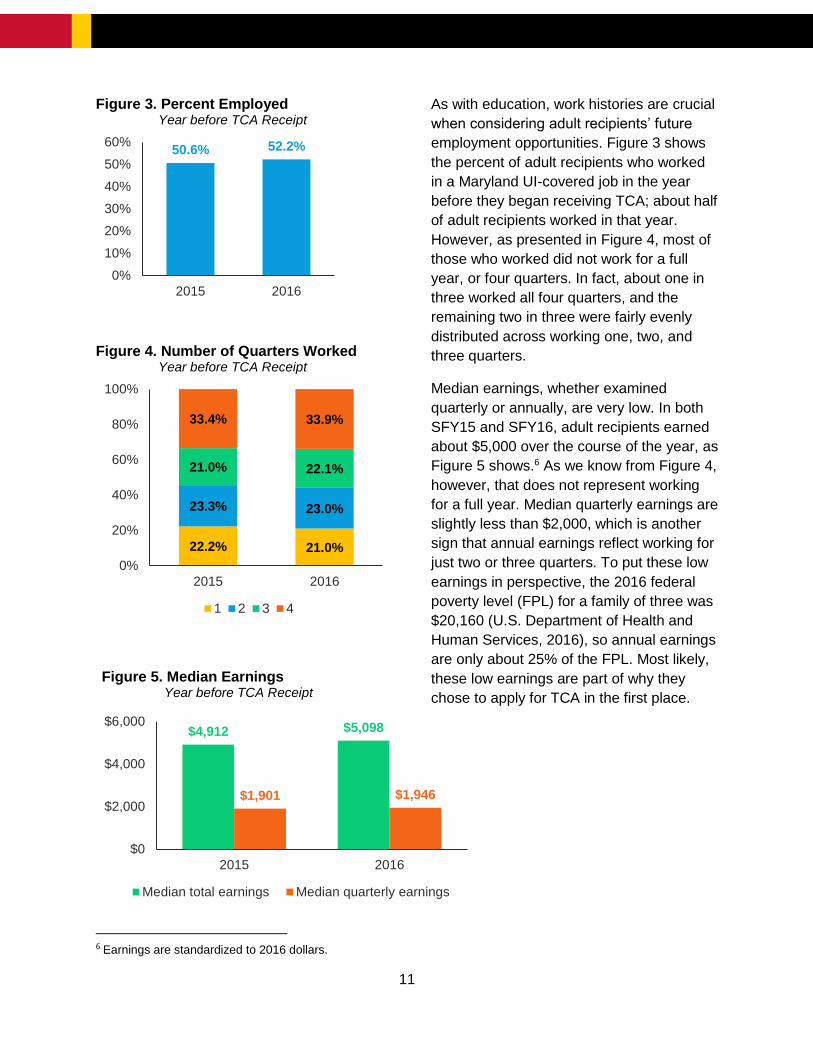
As with education, work histories are crucial
when considering adult recipients’ future
employment opportunities. Figure 3 shows
the percent of adult recipients who worked
in a Maryland UI-covered job in the year
before they began receiving TCA; about half
of adult recipients worked in that year.
However, as presented in Figure 4, most of
those who worked did not work for a full
year, or four quarters. In fact, about one in
three worked all four quarters, and the
remaining two in three were fairly evenly
distributed across working one, two, and
three quarters.
Median earnings, whether examined
quarterly or annually, are very low. In both
SFY15 and SFY16, adult recipients earned
about $5,000 over the course of the year, as
Figure 5 shows.6 As we know from Figure 4,
however, that does not represent working
for a full year. Median quarterly earnings are
slightly less than $2,000, which is another
sign that annual earnings reflect working for
just two or three quarters. To put these low
earnings in perspective, the 2016 federal
poverty level (FPL) for a family of three was
$20,160 (U.S. Department of Health and
Human Services, 2016), so annual earnings
are only about 25% of the FPL. Most likely,
these low earnings are part of why they
chose to apply for TCA in the first place.
50.6% 52.2%
0%
10%
20%
30%
40%
50%
60%
2015 2016
22.2% 21.0%
23.3% 23.0%
21.0% 22.1%
33.4% 33.9%
0%
20%
40%
60%
80%
100%
2015 2016
1 2 3 4
$4,912 $5,098
$1,901 $1,946
$0
$2,000
$4,000
$6,000
2015 2016
Median total earnings Median quarterly earnings
Figure 5. Median Earnings Year before TCA Receipt
12
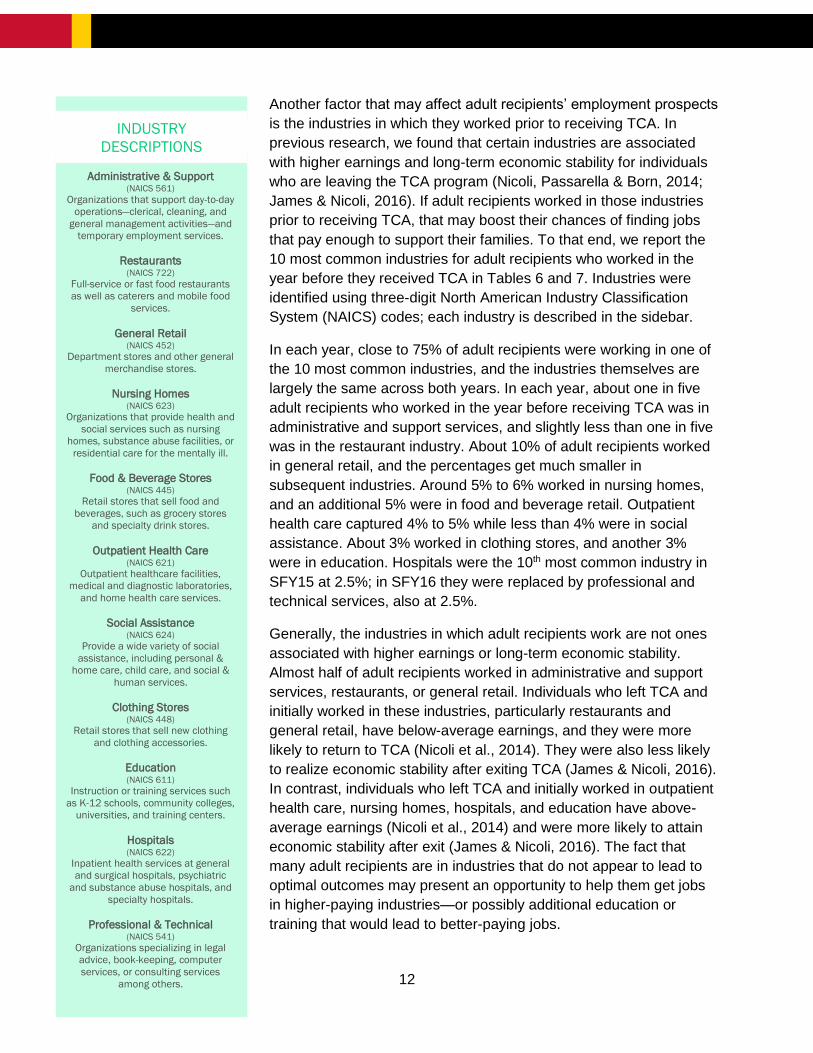
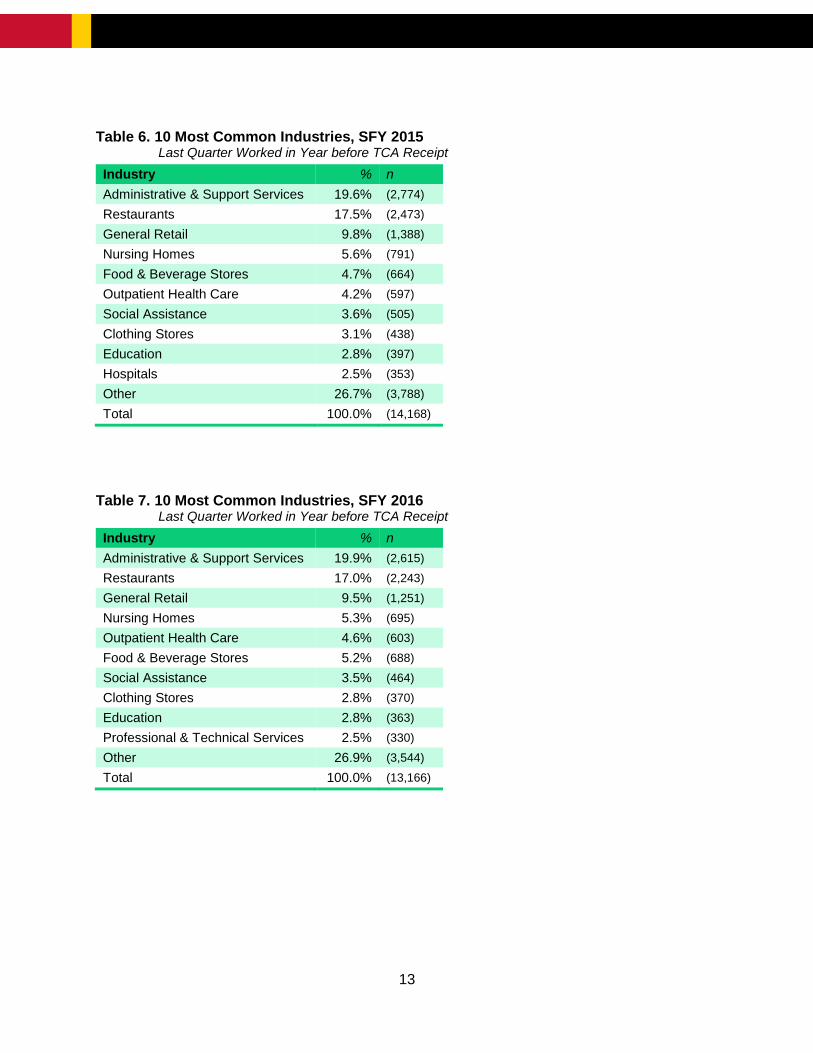
Another factor that may affect adult recipients’ employment prospects
is the industries in which they worked prior to receiving TCA. In
previous research, we found that certain industries are associated
with higher earnings and long-term economic stability for individuals
who are leaving the TCA program (Nicoli, Passarella & Born, 2014;
James & Nicoli, 2016). If adult recipients worked in those industries
prior to receiving TCA, that may boost their chances of finding jobs
that pay enough to support their families. To that end, we report the
10 most common industries for adult recipients who worked in the
year before they received TCA in Tables 6 and 7. Industries were
identified using three-digit North American Industry Classification
System (NAICS) codes; each industry is described in the sidebar.
In each year, close to 75% of adult recipients were working in one of
the 10 most common industries, and the industries themselves are
largely the same across both years. In each year, about one in five
adult recipients who worked in the year before receiving TCA was in
administrative and support services, and slightly less than one in five
was in the restaurant industry. About 10% of adult recipients worked
in general retail, and the percentages get much smaller in
subsequent industries. Around 5% to 6% worked in nursing homes,
and an additional 5% were in food and beverage retail. Outpatient
health care captured 4% to 5% while less than 4% were in social
assistance. About 3% worked in clothing stores, and another 3%
were in education. Hospitals were the 10th most common industry in
SFY15 at 2.5%; in SFY16 they were replaced by professional and
technical services, also at 2.5%.
Generally, the industries in which adult recipients work are not ones
associated with higher earnings or long-term economic stability.
Almost half of adult recipients worked in administrative and support
services, restaurants, or general retail. Individuals who left TCA and
initially worked in these industries, particularly restaurants and
general retail, have below-average earnings, and they were more
likely to return to TCA (Nicoli et al., 2014). They were also less likely
to realize economic stability after exiting TCA (James & Nicoli, 2016).
In contrast, individuals who left TCA and initially worked in outpatient
health care, nursing homes, hospitals, and education have above-
average earnings (Nicoli et al., 2014) and were more likely to attain
economic stability after exit (James & Nicoli, 2016). The fact that
many adult recipients are in industries that do not appear to lead to
optimal outcomes may present an opportunity to help them get jobs
in higher-paying industries—or possibly additional education or
training that would lead to better-paying jobs.
Administrative & Support (NAICS 561)
Organizations that support day-to-day
operations—clerical, cleaning, and
general management activities—and
temporary employment services.
Restaurants (NAICS 722)
Full-service or fast food restaurants
as well as caterers and mobile food
services.
General Retail
(NAICS 452)
Department stores and other general
merchandise stores.
Nursing Homes (NAICS 623)
Organizations that provide health and
social services such as nursing
homes, substance abuse facilities, or
residential care for the mentally ill.
Food & Beverage Stores (NAICS 445)
Retail stores that sell food and
beverages, such as grocery stores
and specialty drink stores.
Outpatient Health Care (NAICS 621)
Outpatient healthcare facilities,
medical and diagnostic laboratories,
and home health care services.
Social Assistance (NAICS 624)
Provide a wide variety of social
assistance, including personal &
home care, child care, and social &
human services.
Clothing Stores (NAICS 448)
Retail stores that sell new clothing
and clothing accessories.
Education (NAICS 611)
Instruction or training services such
as K-12 schools, community colleges,
universities, and training centers.
Hospitals (NAICS 622)
Inpatient health services at general
and surgical hospitals, psychiatric
and substance abuse hospitals, and
specialty hospitals.
Professional & Technical (NAICS 541)
Organizations specializing in legal
advice, book-keeping, computer
services, or consulting services
among others.
INDUSTRY
DESCRIPTIONS
13
Table 6. 10 Most Common Industries, SFY 2015 Last Quarter Worked in Year before TCA Receipt
Industry % n
Administrative & Support Services 19.6% (2,774)
Restaurants 17.5% (2,473)
General Retail 9.8% (1,388)
Nursing Homes 5.6% (791)
Food & Beverage Stores 4.7% (664)
Outpatient Health Care 4.2% (597)
Social Assistance 3.6% (505)
Clothing Stores 3.1% (438)
Education 2.8% (397)
Hospitals 2.5% (353)
Other 26.7% (3,788)
Total 100.0% (14,168)
Table 7. 10 Most Common Industries, SFY 2016 Last Quarter Worked in Year before TCA Receipt
Industry % n
Administrative & Support Services 19.9% (2,615)
Restaurants 17.0% (2,243)
General Retail 9.5% (1,251)
Nursing Homes 5.3% (695)
Outpatient Health Care 4.6% (603)
Food & Beverage Stores 5.2% (688)
Social Assistance 3.5% (464)
Clothing Stores 2.8% (370)
Education 2.8% (363)
Professional & Technical Services 2.5% (330)
Other 26.9% (3,544)
Total 100.0% (13,166)
14
Conclusions
Although caseloads for Maryland’s
Temporary Cash Assistance (TCA) program
are declining, information about who
receives this assistance remains vital. In
this brief, we profile families who received
TCA in state fiscal years 2015 and 2016 as
well as the adult recipients in those families.
With these data, it is easier to understand
how to help families achieve self-sufficiency.
Most families who received TCA lived in one
of the more populous jurisdictions in
Maryland: Baltimore City, Baltimore County,
Prince George’s County, Montgomery
County, or Anne Arundel County. They
tended to be small, with one adult and one
or two children per case. Many of these
children were young, as the youngest child
receiving TCA was age five or younger in
most families. Typically, families did not
receive assistance for long periods of time,
and most received TCA for less than two of
the previous five years.
In some families, adult recipients were
considered to be work-eligible; that is, they
were required to participate in work-related
activities as a condition of receiving
assistance. These families constituted
slightly less than half of families who
received TCA in either state fiscal year. Due
to a policy change in October 2015,
however, about 10% of families shifted from
being work-exempt to being work-eligible.
While the full extent of this policy change is
not evident in these data, it is something to
monitor in coming years.
Demographically, adult recipients are
primarily African American women in their
early 30s who never married. Most have
finished high school, although education
beyond high school is rare. A little more
than half of adult recipients worked in the
year before they received TCA, but they
usually did not work all four quarters in that
year. Earnings in that year were very low,
with a median of approximately $5,000.
Close to half of those who were employed in
the year before TCA worked in
administrative and support services,
restaurants, and general retail.
These findings about employment and
earnings, in particular, point to ways that
caseworkers, program managers, and
vendors can help families attain self-
sufficiency. While many adult recipients
worked in the recent past, they typically did
not earn anywhere near enough to support
a family, at least in part because they
frequently worked in industries that do not
pay well. Combined with the fact that post-
high school education is not common
among adult recipients, this suggests that
additional education or training focused on
industries that offer higher wages may be
appropriate for a number of adult recipients.
For others, assistance with finding jobs that
pay more than jobs they have held in the
past may be enough. With this additional
education, training, or job search
assistance, families may be able to become
economically stable and permanently leave
cash assistance.
15
References
James, A.M., & Nicoli, L.T. (2016). Economic stability after leaving welfare. Retrieved from the Family Welfare Research and Training Group website: http://www.family welfare.umaryland.edu/reports1/ economic_stability.pdf
Maryland Department of Human Resources.
(2017). Family Investment
Administration statistical reports.
Retrieved from http://dhr.maryland.
gov/business-center/documents/
Nicoli, L.T., Passarella, L.L., & Born, C.E. (2013). Welfare recipients who find good jobs: Who are they, and what are their outcomes? Retrieved from the Family Welfare Research and Training Group website: http://www. familywelfare.umaryland.edu/reports1/goodjobs.pdf
Nicoli, L.T., Passarella, L.L., & Born, C.E. (2014). Industries among employed welfare leavers. Retrieved from the Family Welfare Research and Training Group website: http://www. familywelfare.umaryland.edu/reports1/industriesbrief.pdf
Sherman, N. (2017, March 13). Maryland adds 6,700 jobs, unemployment rate holds at 4.2 percent. The Baltimore Sun. Retrieved from http:// baltimoresun.com/
U.S. Bureau of Labor Statistics. (2017). Local Area Unemployment Statistics, Maryland. Retrieved March 16, 2017. http://data.bls.gov
U.S. Census Bureau (2016). Sex of workers by place of work, 2011-2015 American Community Survey 5-year estimates. Retrieved from https://fact finder.census.gov/faces/tableservices/jsf/pages/productview.xhtml?pid=ACS_15_5YR_B08007&prodType=table
U.S. Department of Health and Human Services, Office of the Asst. Secretary for Planning and Evaluation. (2016). 2016 poverty guidelines. Retrieved from: https://aspe.hhs.gov/computations-2016-poverty-guidelines
The authors would like to thank Jamie Haskel and Somlak Suvanasorn for their assistance in the
collection and processing of data for this research brief. This brief was prepared by the Ruth Young
Center for Families and Children with support from its long time research partner, the Maryland
Department of Human Resources.
For additional information, please contact Dr. Lisa Nicoli (410.706.2763; [email protected])
at the School of Social Work.
Please visit our website www.familywelfare.umaryland.edu for additional copies of this brief and other
reports.