Embed Size (px)
Citation preview
LISA Short Course SeriesMultivariate Analysis in R
Liang (Sally) ShanMarch 3, 2015
LISA: Multivariate Analysis in R Mar. 3, 2015
Laboratory for Interdisciplinary Statistical
Analysis
Collaboration:
Visit our website to request personalized statistical advice and assistance with:
Designing Experiments • Analyzing Data • Interpreting ResultsGrant Proposals • Software (R, SAS, JMP, Minitab...)
LISA statistical collaborators aim to explain concepts in ways useful for your research.
Great advice right now: Meet with LISA before collecting your data.
All services are FREE for VT researchers. We assist with research—not class projects or homework.
LISA helps VT researchers benefit from the use of Statistics
www.lisa.stat.vt.edu
LISA also offers:
Educational Short Courses: Designed to help graduate students apply statistics in their researchWalk-In Consulting: Available Monday-Friday from 1-3 PM in the Old Security Building (OSB) for questions <30 mins. See our website for additional times and locations.
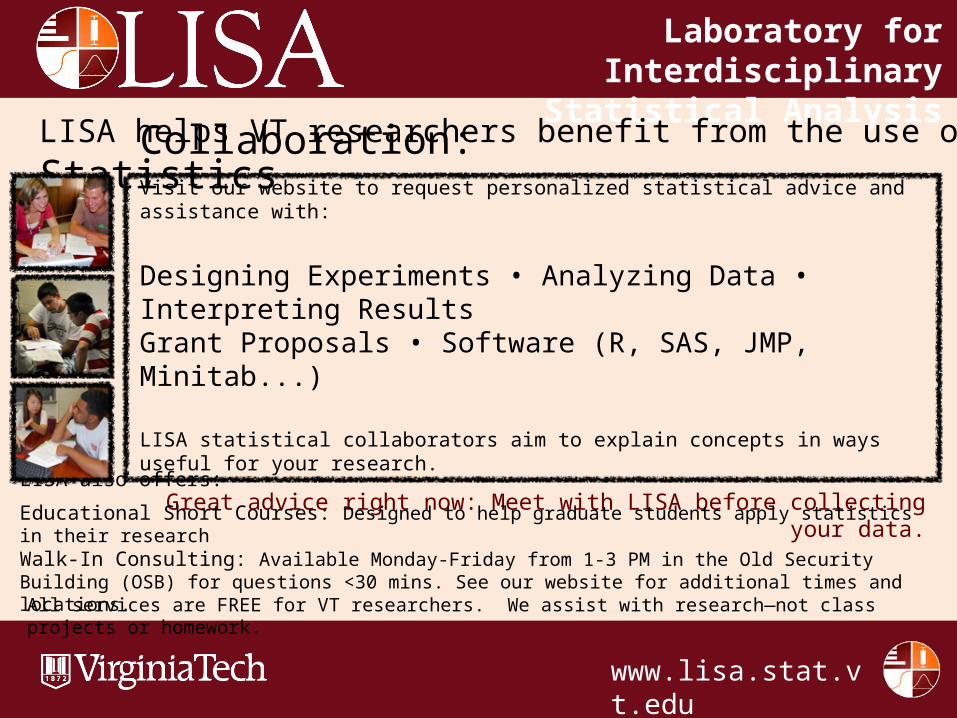
1. What is multivariate analysis?
2. Summarizing and plotting multivariate data in R
3. Dimension reduction vs. clustering
4. Principal component analysis (PCA) (in R)
5. Factor analysis (in R)
6. Relationship between PCA and factor analysis
Outline
LISA: Multivariate Analysis in R Mar. 3, 2015
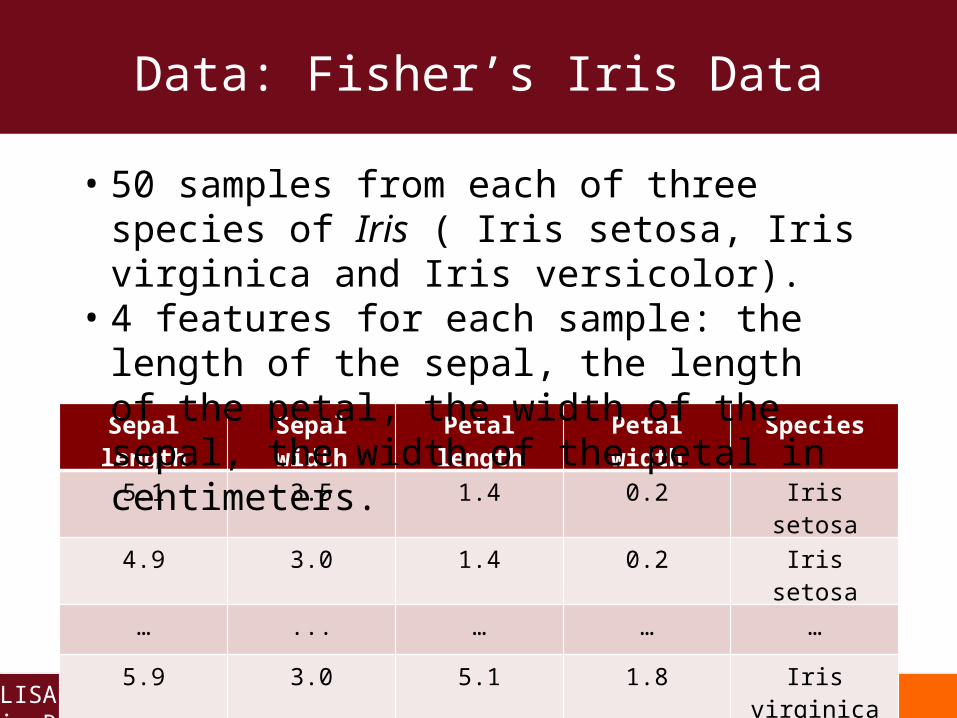
Data: Fisher’s Iris Data
LISA: Multivariate Analysis in R Mar. 3, 2015
Sepal length Sepal width Petal length Petal width Species
5.1 3.5 1.4 0.2 Iris setosa
4.9 3.0 1.4 0.2 Iris setosa
… ... … … …
5.9 3.0 5.1 1.8 Iris virginica
• 50 samples from each of three species of Iris ( Iris setosa, Iris virginica and Iris versicolor).
• 4 features for each sample: the length of the sepal, the length of the petal, the width of the sepal, the width of the petal in centimeters.
• Univariate analysis is used when one variable is measured for each observation.– Possible approaches: histogram; bar chart;
descriptive statistics
• Multivariate analysis is used when more than one outcome variables are measured for each observation. E.g., the Iris data. – Possible approaches: principal component
analysis, factor analysis, classification, clustering
What is Multivariate Analysis?
LISA: Multivariate Analysis in R Mar. 3, 2015
• To get some idea of the data, we start with calculating summary statistics such as the mean and standard deviation for each variable.
• R function sapply() can be used to apply some function to each column in a data frame, eg. sapply(mydataframe,sd)
• A good reference for apply functions– http://www.ats.ucla.edu/stat/r/library/
advanced_function_r.htm#sapply
Summarizing Multivariate Data in R
LISA: Multivariate Analysis in R Mar. 3, 2015
• Since multiple variables are measured simultaneously, we expect some extent of correlation among the variables.
• Scatterplot matrix is an ideal option to visualize their relationship.
• Install the “car” package in R, and then use R function scatterplotMatrix().
• Pairwise pearson correlation coefficient could be calculated using R function cor() on the data frame.
Plotting Multivariate Data in R
LISA: Multivariate Analysis in R Mar. 3, 2015
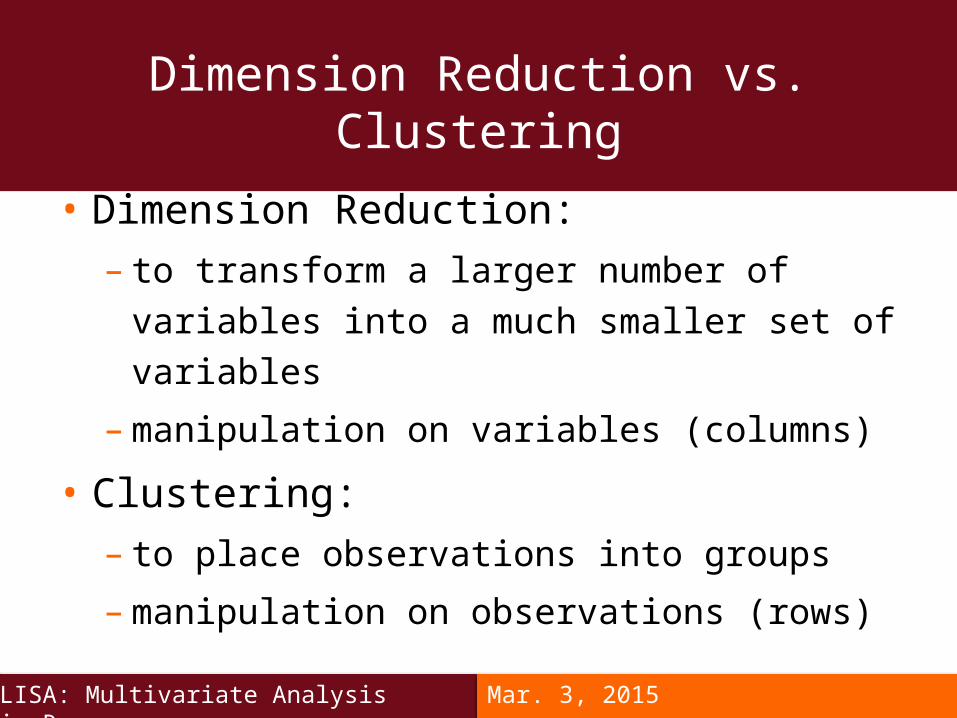
• Dimension Reduction:– to transform a larger number of
variables into a much smaller set of variables
– manipulation on variables (columns)
• Clustering:– to place observations into groups
– manipulation on observations (rows)
Dimension Reduction vs. Clustering
LISA: Multivariate Analysis in R Mar. 3, 2015
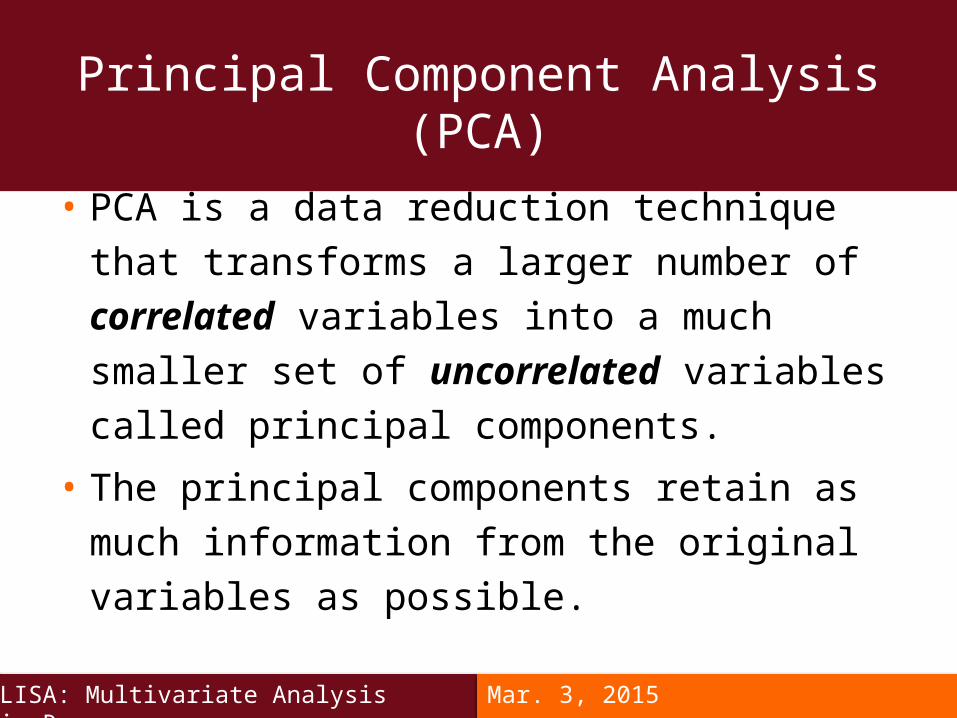
• PCA is a data reduction technique that transforms a larger number of correlated variables into a much smaller set of uncorrelated variables called principal components.
• The principal components retain as much information from the original variables as possible.
Principal Component Analysis (PCA)
LISA: Multivariate Analysis in R Mar. 3, 2015
Principal Component Analysis (PCA)
LISA: Multivariate Analysis in R Mar. 3, 2015
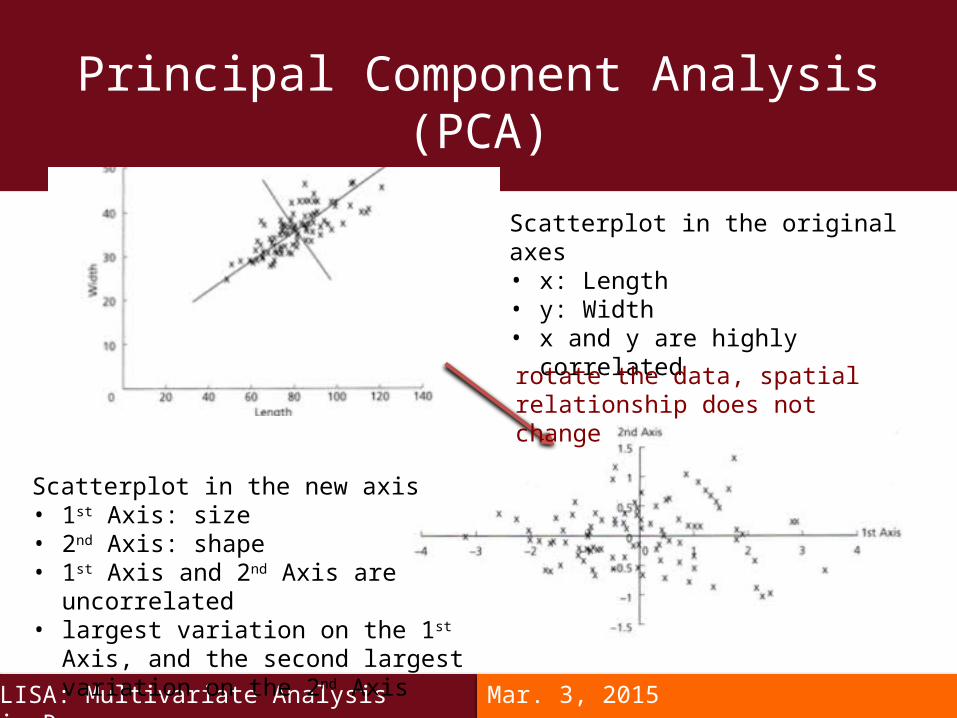
Scatterplot in the original axes• x: Length• y: Width • x and y are highly correlated
rotate the data, spatial relationship does not change
Scatterplot in the new axis• 1st Axis: size• 2nd Axis: shape• 1st Axis and 2nd Axis are uncorrelated• largest variation on the 1st Axis, and the second
largest variation on the 2nd Axis
• PCA produces linear combinations of the original variables to generate the new variables (axes), known as principal components (PCs)
• The variations on the PCs are in a descending order, i.e., the first PC accounts for the greatest possible variance, the second PC accounts for the second largest variance, etc.
• The PCs are uncorrelated with (perpendicular to) each other.
Principal Component Analysis (PCA)
LISA: Multivariate Analysis in R Mar. 3, 2015
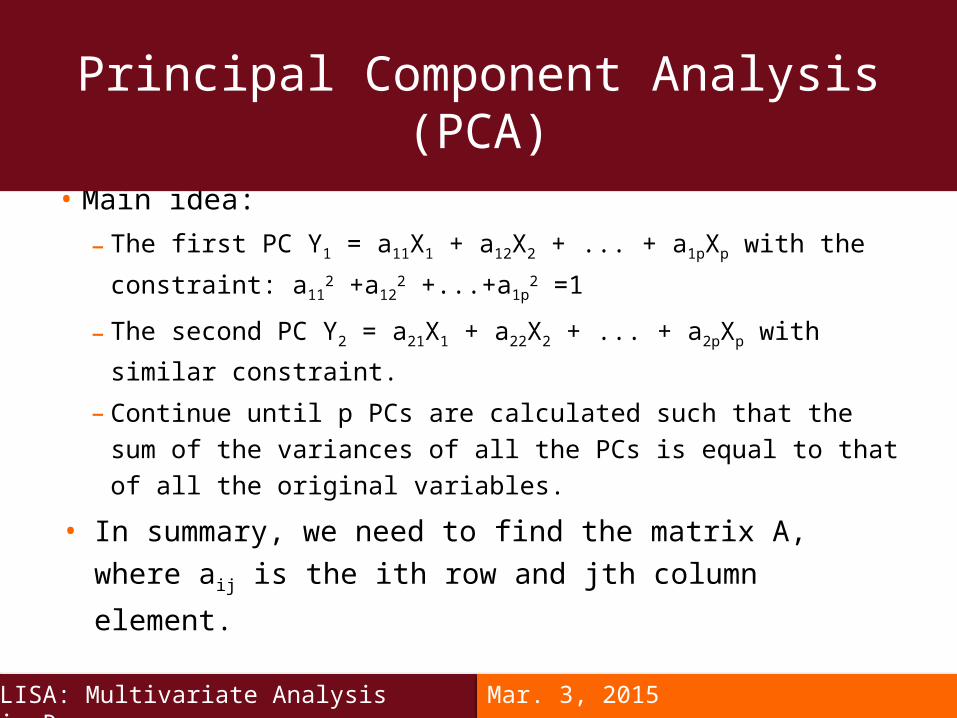
• Main idea:
– The first PC Y1 = a11X1 + a12X2 + ... + a1pXp with the constraint: a112
+a122 +...+a1p
2 =1
– The second PC Y2 = a21X1 + a22X2 + ... + a2pXp with similar constraint.
– Continue until p PCs are calculated such that the sum of the variances of all the PCs is equal to that of all the original variables.
• In summary, we need to find the matrix A, where aij is the
ith row and jth column element.
Principal Component Analysis (PCA)
LISA: Multivariate Analysis in R Mar. 3, 2015
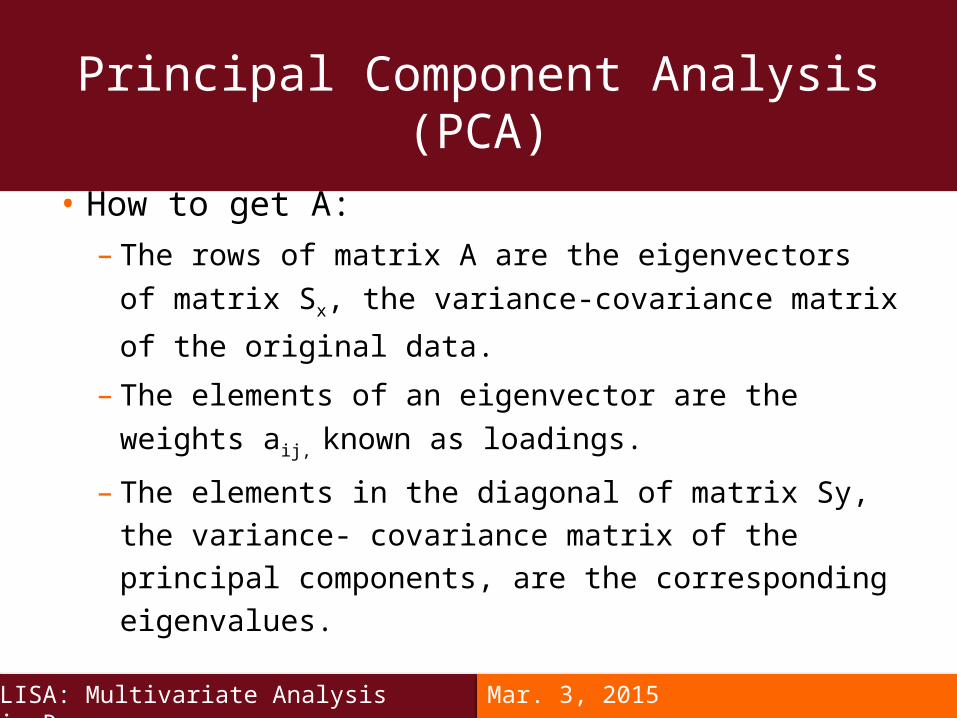
• How to get A:
– The rows of matrix A are the eigenvectors of matrix Sx,
the variance-covariance matrix of the original data.
– The elements of an eigenvector are the weights aij,
known as loadings.
– The elements in the diagonal of matrix Sy, the variance- covariance matrix of the principal components, are the corresponding eigenvalues.
Principal Component Analysis (PCA)
LISA: Multivariate Analysis in R Mar. 3, 2015

• Other related terms:– Score: the positions of each observation in the new coordinate
system of PCs.• For instance, the score for the rth sample on the kth PC is Ykr = ak1x1r +
ak2x2r + ... + akpxpr
– Scree plot: a graphical display of the variance of each PC to determine how many PCs should be selected in order to retain a high percentage of the variation in the data.
• The plot shows the variance for the first component and then for the subsequent components, it shows the additional variance that each component is adding.
Principal Component Analysis (PCA)
LISA: Multivariate Analysis in R Mar. 3, 2015
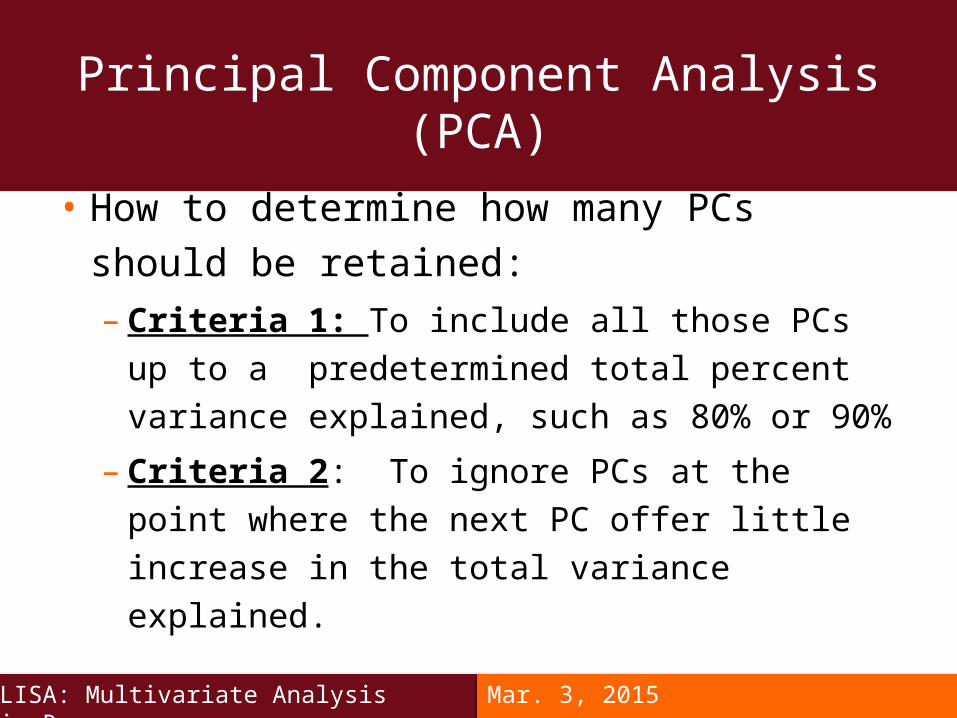
• How to determine how many PCs should be retained:– Criteria 1: To include all those PCs up to a
predetermined total percent variance explained, such as 80% or 90%
– Criteria 2: To ignore PCs at the point where the next PC offer little increase in the total variance explained.
Principal Component Analysis (PCA)
LISA: Multivariate Analysis in R Mar. 3, 2015
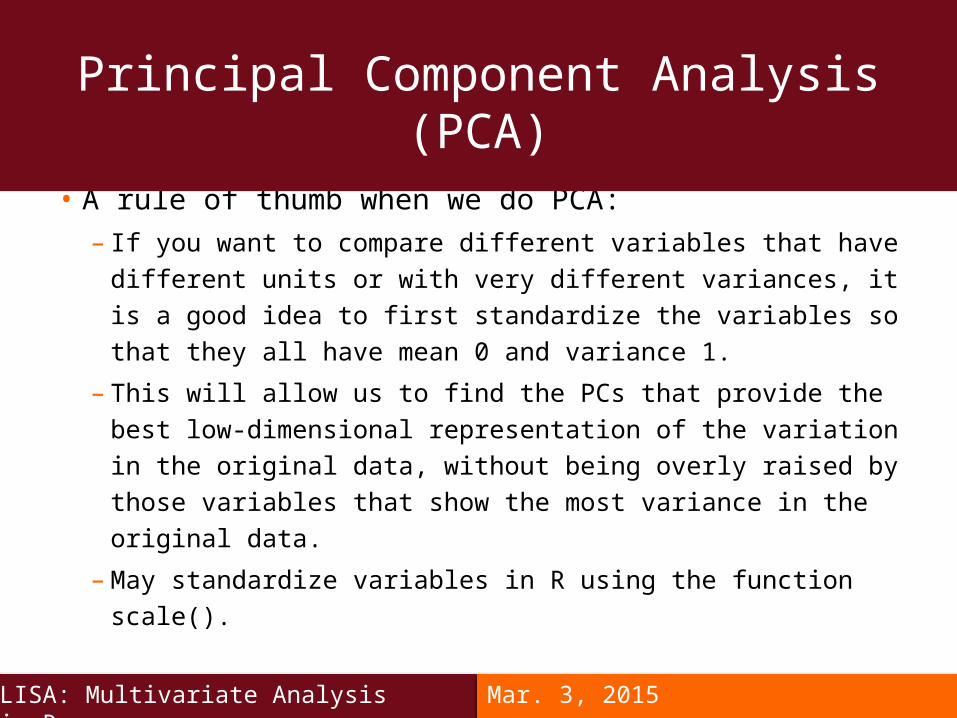
• A rule of thumb when we do PCA:– If you want to compare different variables that have different
units or with very different variances, it is a good idea to first standardize the variables so that they all have mean 0 and variance 1.
– This will allow us to find the PCs that provide the best low-dimensional representation of the variation in the original data, without being overly raised by those variables that show the most variance in the original data.
– May standardize variables in R using the function scale().
Principal Component Analysis (PCA)
LISA: Multivariate Analysis in R Mar. 3, 2015
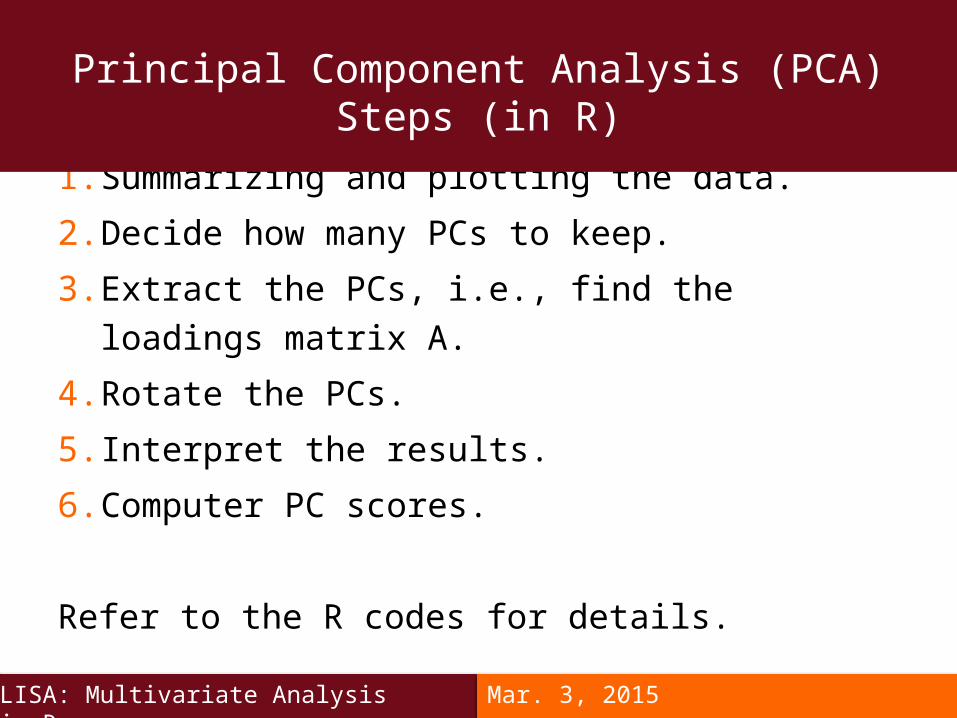
1. Summarizing and plotting the data.
2. Decide how many PCs to keep.
3. Extract the PCs, i.e., find the loadings matrix A.
4. Rotate the PCs.
5. Interpret the results.
6. Computer PC scores.
Refer to the R codes for details.
Principal Component Analysis (PCA) Steps (in R)
LISA: Multivariate Analysis in R Mar. 3, 2015
• Factor Analysis is to uncover the latent structure in a given set of variables.
• It looks for a smaller set of latent variables (called factors) that can explain the relationships among the observed variables.
• Correlated factors are common, but not required, in the factor analysis model.
Factor Analysis
LISA: Multivariate Analysis in R Mar. 3, 2015
• The model can be written as
Xi = b1F1 + b2F2 + ... + bpFp + ei
• Xi is the ith observed variable (i=1,…,k), Fj are
the factors (j=1,...,p), and p<k.
• Ei is the portion of variable xi unique to that
variable.
Factor Analysis
LISA: Multivariate Analysis in R Mar. 3, 2015
• There are many methods of extracting common factors, including maximum likelihood (ml), iterated principal axis (pa), weighted least square (wls), generalized weighted least squares (gls), and minimum residual (minres).
• We may identify which method to use in R code.
Factor Analysis
LISA: Multivariate Analysis in R Mar. 3, 2015
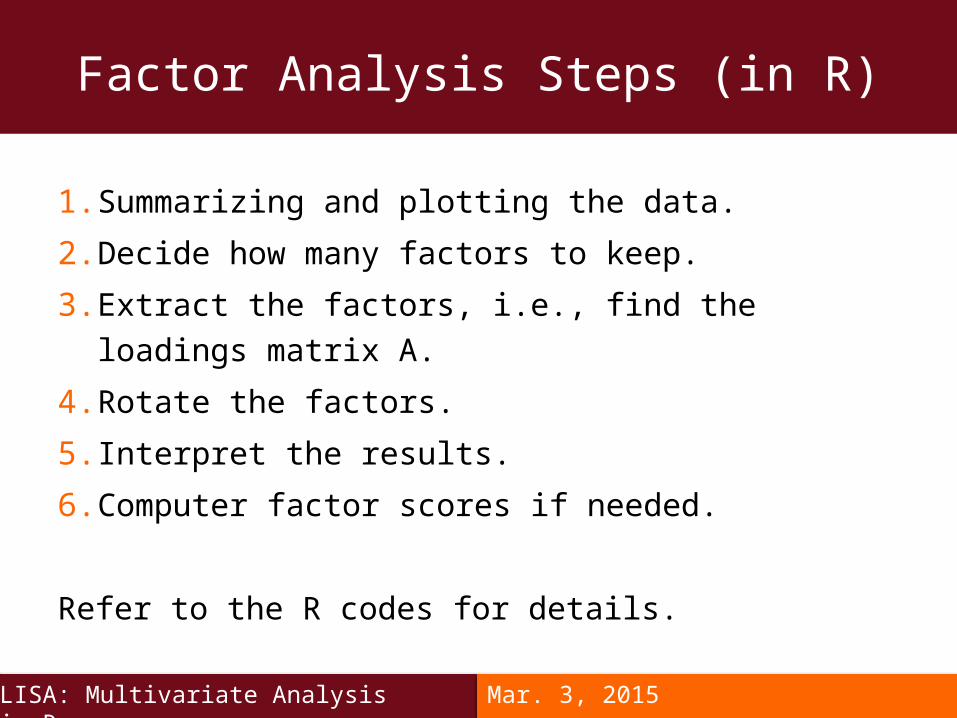
1. Summarizing and plotting the data.
2. Decide how many factors to keep.
3. Extract the factors, i.e., find the loadings matrix A.
4. Rotate the factors.
5. Interpret the results.
6. Computer factor scores if needed.
Refer to the R codes for details.
Factor Analysis Steps (in R)
LISA: Multivariate Analysis in R Mar. 3, 2015
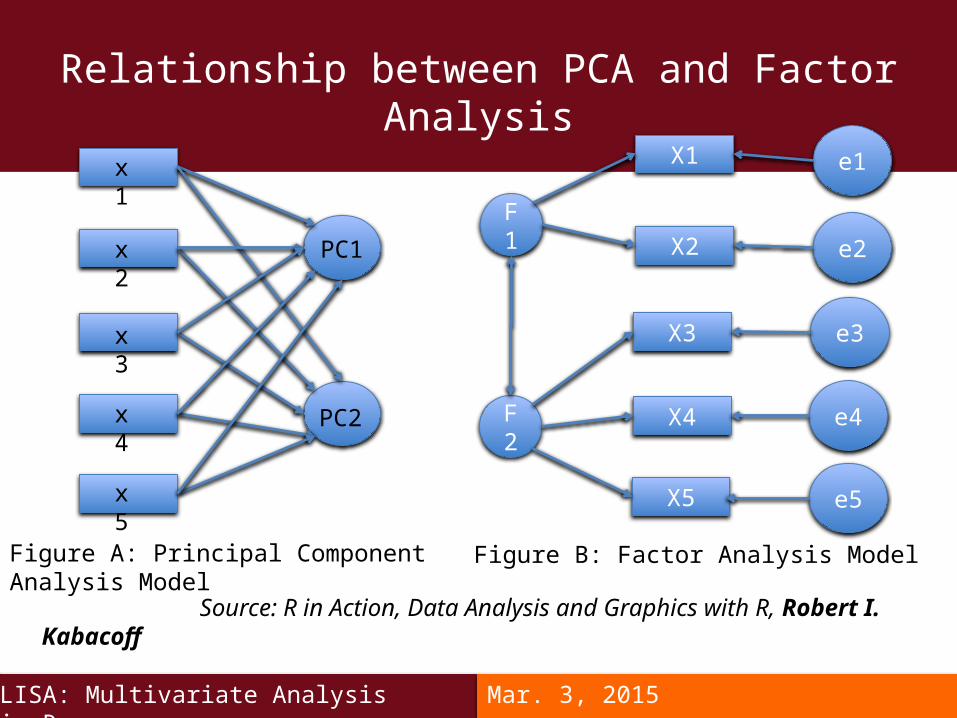
Relationship between PCA and Factor Analysis
LISA: Multivariate Analysis in R Mar. 3, 2015
x1
x2
x3
x4
x5
PC1
PC2
Figure A: Principal Component Analysis Model
F1
e1
F2
X1
X2
X3
X4
X5
e2
e3
e4
e5
Figure B: Factor Analysis Model
Source: R in Action, Data Analysis and Graphics with R, Robert I. Kabacoff
• R in Action: Data Analysis and Graphics with R, Robert I. Kabacoff
• http://strata.uga.edu/software/pdf/pcaTutorial.pdf
References
LISA: Multivariate Analysis in R Mar. 3, 2015

Please don’t forget to fill the sign in sheet and to complete the survey that will be sent to you by email.
Thank you!
LISA: Multivariate Analysis in R Mar. 3, 2015


![JWMVS-529 CD Multivariate SSE Programdmitryf/manuals/Multivariate...This manual is for the JASCO [CD Multivariate SSE] program that runs on Microsoft Windows. The [CD Multivariate](https://img.pdfslide.us/doc/110x75/6126f1e613b27866f35b8927/jwmvs-529-cd-multivariate-sse-program-dmitryfmanualsmultivariate-this-manual.jpg)