Embed Size (px)
Citation preview

Is the One Percent Permeable?
Ascribed and Achieved Traits in
Top Incomes, Top Net Worth, and Both
Lisa A. Keister
Hang Young Lee
Department of Sociology
Duke University
Box 90088
Durham, NC 27708
Phone: (919) 660-5624
Fax: (919) 660-5623
April 2015
*Direct correspondence to Lisa A. Keister at 268 Sociology-Psychology Building, Box 90088,
Durham, NC 27708, [email protected]. Keister acknowledges a grant from the National
Science Foundation (SES-1322738) that supported this research. We are grateful for comments
from Tony Atkinson, Richard Benton, Arthur Kennickell, Thomas Piketty, and Laura Tesch.

ABSTRACT
It is well-known that the one percent control disproportionate quantities of income and net worth,
but knowledge about who occupies these top economic positions is limited. We explore whether
the one percent is permeable by studying the relative weight of ascribed and achieved traits in
generating membership in top income and net worth positions. We make two important
contributions. First, rather than focus on either income or net worth as previous research has
done, we simultaneously study both income and net worth. To do this, we disaggregate the top
one percent into three groups: top income earners, top net worth owners, and those at the top of
both distributions; this takes seriously the nuanced relationship between the two resources and
provides new insight into both resource concentration and the permeability of the top. Second,
we develop a set of theoretically grounded propositions regarding the permeability of the one
percent. We propose that (a) the degree to which there is overlap between the top one percent by
income and net worth (i.e., the size of the third, joint income-net worth group) and (b) the
particular mix of traits evidenced in members of the top three groups indicate whether the top is
permeable. Analyses of the Survey of Consumer Finances both suggest that the one percent is
permeable and offer insights into who occupies these top positions.

1
It is clear that the one percent—those at the top of the income and wealth distributions—
disproportionately own the financial resources that provide economic, social, and political
advantages in the United States. However, little is known about who occupies these top positions
and whether it is possible to move into the top from other locations in these distributions. Since
2001, the top one percent by income have received 17% to 21% of total household income, and
the top one percent of wealth owners have held 32% to 34% of net worth (Keister 2014).
Understanding the factors that are associated with membership in these top financial positions is
fundamental to sociological research on stratification and inequality: if inheritance is the primary
driver of membership in the one percent, those in top financial positions may constitute an
ossified social class that is accessible only to a privileged few who re-create themselves and
maintain their advantages over generations. By contrast, if it is possible to achieve top status
through education and work, then top positions are part of a more fluid social structure in which
upward, downward, and lateral mobility are conceivable. These questions motivated early
sociological research (Pareto 1991 [1916]; Parkin 1979; Weber 1978) and have been central to
research on status attainment (Blau and Duncan 1967a; Kerckhoff 1976), mobility (McCall and
Percheski 2010; Warren and Hauser 1997), and elite (Domhoff 2013b; Zweigenhaft and
Domhoff 2014) research until recently. Yet, sociological interest in top income and net worth
owners is relatively new and has not begun to address the permeability of top positions (DiPrete,
Eirich and Pittinsky 2010; Keister and Lee 2014; Volscho and Kelly 2012).
Research on the one percent is more established in economics; however, the focus of this
work has largely been on explaining inequality and has typically treated income and net worth
separately rather than addressing the nuanced relationship between the two resources. That is, the
primary goal of this research has been understanding why income inequality (Atkinson, Piketty
2
and Saez 2011; Piketty 2013) and, to a lesser extent, net worth (Edlund and Kopczuk 2009;
Kopczuk and Saez 2004; Piketty and Zucman 2014) inequality have grown. Sociologists have
made important contributions to this literature, but their focus has also been on explaining
inequality (DiPrete, Eirich and Pittinsky 2010; Volscho and Kelly 2012). The few studies
exploring who occupies top positions have most typically examined the components of total
household income in order to understand whether rentiers (i.e., those receiving income primarily
from capital investments) or the working rich (i.e., those receiving income primarily from wages
and other work-related sources) dominate top positions (Atkinson, Piketty and Saez 2011;
Piketty 2013; Piketty and Saez 2003). Although this research points to important trends in
income sources, the focus on either income or net worth excludes households with high levels of
one resource but not the other. As a result, those who have high net worth but not high income
(e.g., retirees, nonworking wealthy whose capital income is below the top income threshold) or
those who have high incomes but do not have top net worth (e.g., high salary earners who have
not saved) are omitted. One important exception (Wolff and Zacharias 2009) used a wealth-
adjusted measure of income to study income components, incorporating both income and wealth;
however, this research did not study top wealth owners who do not have high incomes.
In this paper, we explore whether—within a context of extreme and growing inequality—
the one percent is permeable. We accomplish this in two steps. First, we propose that in order to
understand the relative weight of inheritance, education, and work in determining membership in
the one percent, it is important to simultaneously study income and net worth. To do this, we
disaggregate the top one percent into three groups: the top one percent of income earners, the top
one percent of net worth owners, and the top one percent of both distributions. This
disaggregation allows us to study income and net worth simultaneously and to take advantage of

3
the nuanced relationship between the two resources to better understand permeability. Second,
we synthesize ideas from research on stratification and elite research to develop a theoretically
grounded set of propositions regarding the permeability of top positions. We propose that
studying three top groups will show that there is some permeability at the top that will be evident
in (1) moderate levels of overlap between top income and top net worth positions (i.e., the one
percent of each distribution will be in neither completely different nor completely the same
households); and (2) a predictably different mix of ascribed and achieved traits associated with
membership in each of these top positions. We explore these ideas empirically using household
data from the 1989–2010 Survey of Consumer Finances (SCF).
Using the One Percent to Study Social Ossification
Studying the one percent has its origins in early work on income and savings (Kuznets
1953). There were other early uses of the concept (Burchell 1989; Reich 1972), but it did not
become common in academic research until the early 2000s (Frank 2000; Piketty and Saez 2003)
and in popular discourse until the Occupy Wall Street movement in 2011 (Dunn 2011; Sharlet
2011; Stigletz 2011). Studying the one percent provides a metric for research on advantaged
households that is somewhat comparable to the poverty line used in research on the
disadvantaged. Using other cutoffs to study top groups—such as the top five or top ten percent of
households—can also be effective. However, studying the one percent has become common
because the extremely high levels of income and assets accruing to this group underscore the
magnitude of resource concentration. Moreover, the one percent is meaningful as a group
because its members represent more than a loose affiliation of millionaires and billionaires;
rather, evidence suggests that these households are unified in their unique lifestyles, social
attitudes, political opinions, and efforts to shape public policies in their favor (Bartels 2008;

4
Bonica et al. 2013; Domhoff 2013a; Page, Bartels and Seawright 2013).
The primary focus of most recent research on the one percent has been identifying
reasons for increasing income concentration. Explanations include growing managerial power
(Bebchuk and Fried 2003, 2004; Fligstein 2002), changing nature of economic rents (Bivens and
Mishel 2013), declining union power and slow wage growth for most families (Macunovich et al.
1995; McCall and Percheski 2010; Volscho and Kelly 2012), greater acceptance of very high
salaries (Piketty and Saez 2006), and tax policies that affect how surpluses are divided between
employers and employees (Piketty, Saez and Stantcheva Forthcoming). Two particularly
intriguing explanations stand out in this work. First, a study at the market (rather than firm) level
shows that compensation benchmarking and leapfrogging have contributed to changes in the
income distribution (DiPrete, Eirich and Pittinsky 2010). Second, Piketty’s (2013) work, which
attracted popular attention shows that because the rate of return on capital has exceeded the rate
of economic growth, the concentration of wealth has remained extremely high.1
Underlying some of this work is a concern with structural rigidity (i.e., who occupies top
positions); however, the focus in this literature has been either high income or high net worth
households, and the research has not included direct analysis of whether top earners inherited or
were self-made. One analytic strategy that offers some evidence regarding structural rigidity
involves decomposing total income into its earned and investment components to study whether
the working rich (i.e., those with high levels of earned income) outnumber rentiers (i.e., those
with high levels of investment income). For example, Piketty and Saez (2003) found that the
working rich outnumber rentiers, a finding that has been used as evidence that inheritance has
become a relatively less important—and work, a relatively more important—determinant of
1 See Keister (2014) and Neckerman and Torche (2007) for reviews of the income inequality literature.

5
membership in top positions. However, those with high net worth but not high incomes were
excluded from this work. Another paper began to address the omission of high-wealth
households by including unrealized capital gains and imputed rents to reckon income from
wealth; this study shows that approximately half of the income of the top centile is work-
generated, suggesting that the working rich and rentiers now share top positions (Wolff and
Zacharias 2009). This approach is compelling because it comes closer to using both income and
net worth to study permeability; however, the focus is still on income, and those with top net
worth but not top income were excluded. Moreover, research in this tradition does not directly
study the relative weight of inheritance and other factors in producing top households, perhaps
overlooking more-nuanced processes that may be at work. For example, given that many of those
in the top one percent by income both inherited and work for a family business at a time when
CEO salaries are rising, inheritance might be associated with high incomes even when earned
income surpasses investment income.
A small subset of research on the one percent focuses on top net worth holders, but data
challenges in this literature contribute to contradictory findings about permeability. Two studies
concurred with the income decomposition finding that inheritance is a less important determinant
of top wealth membership, but both drew inferences from aggregate data: one observed that
income inequality increased but net worth inequality was steady between 1980 and the early
2000s (Kopczuk and Saez 2004); the other found fewer women in top net worth positions even
though inheritance is gender-equal (Edlund and Kopczuk 2009). In contrast, an important recent
study using unique longitudinal household data on top net worth owners found that inheritance is
still a strong predictor of top wealth ownership; unfortunately, this work used a constrained
Norwegian cohort sample and proxy variables to measure inheritance (Hansen 2014). Also

6
informative is Domhoff’s research on the wealthy (2013b), which shows that owners and top-
level managers of large corporations work together to maintain their top positions, suggests little
permeability at the top. Unfortunately, however, these ideas have not been studied using
representative survey data on those in top positions.
Reconsidering Top Positions: Top Income, Top Net Worth, and Both
To better understand the relative weight of ascribed and achieved traits in generating top
financial positions, it is important to study income and net worth together because these two
resources have a nuanced relationship that would otherwise be lost. Income (flows of money into
a household) and net worth (total saved assets less liabilities) are jointly determined: having one
can clearly increase ownership of the other. High income facilitates saving, and wealth generates
income; thus, the correlation between income and net worth should be high. Yet, life course
processes, cohort differences, interpersonal variation in saving propensities, structural
differences in opportunities to save and invest, and business cycle variations combine to reduce
the correlation and to suggest that a direct, simultaneous analysis of income and net worth would
more effectively identify the correlates of membership in top positions. Moreover, isolating those
with either top income or top net worth risks generating general conclusions about permeability
of top positions from information on an overly limited group of households.
To study income and net worth simultaneously, we disaggregate the standard two top
groups (i.e., top income, top net worth) into three groups: top income earners, top net worth
owners, and those at the top of both distributions. These three groups differ conceptually. Those
with either high income or high net worth are both clearly advantaged and potentially powerful
but in qualitatively different ways and in different arenas. Those at the top of both distributions
enjoy the advantages of both resources and may have additional influence given their unique

7
financial positions. Perhaps most importantly, members of these three groups are likely to have
distinct financial profiles, and disaggregating them may reveal new facts about resource
concentration and the relative weight of inheritance and other factors in generating membership
in top positions. Those at the top of both distributions are particularly important: because it takes
extremely high levels of both resources to be in this position, they are likely to have higher
median income and net worth and to control larger portions of both than those who are at the top
of one distribution. One scenario for membership in the top of both distributions involves having
very high earned income. A high salary alone can lead to membership in the top one percent of
the income distribution, but a high salary is often accompanied by asset-related compensation,
such as stock options, that can lead to high net worth. Moreover, asset-related compensation can
feed back into income through investment earnings, adding even more to both income and net
worth. Similarly, very high net worth typically produces high levels of income, which, if
accompanied by additional earned income, can lead to high values on both resources. In contrast,
top income earners (who are not top net worth owners) and top net worth owners (who are not
top income earners) will be less privileged than those at the top of both distributions.
Theoretical Underpinnings of Permeability and Membership in Top Positions
Ideas from research on status attainment and elite research are useful starting points for
understanding who occupies top income and net worth positions and why.
Status Attainment
Status attainment research addresses how a person’s origin combines with other factors to
affect adult destination or well-being. Work in this tradition specifies the combinations of
individual attributes (e.g., family background, education, work behaviors) and mechanisms that
contribute to adult attainment. Attainment was traditionally measured as occupational status

8
(Blau and Duncan 1967b; McClendon 1976; Sewell, Haller and Ohlendorf 1970; Sewell and
Hauser 1975), but the focus has expanded to include measures of income and net worth
(Campbell and Henretta 1980; Keister 2005; Spilerman and Wolff 2012; Warren 2012). Status
attainment research identifies several mechanisms that relate origin to adult status, including
socialization, allocation, social psychological traits, and social network processes. Socialization
is the influence of family and others have on young people’s trajectories and outcomes (Sewell,
Haller and Ohlendorf 1970; Sewell and Hauser 1972); allocation refers to the structural factors
that select, classify, and assign individuals to groups (Kerckhoff 1976; Knottnerus 1987). These
processes work with social psychological traits and social capital to facilitate, constrain, and
direct individual outcomes. Although social psychological factors underlie status attainment
processes, ideas related to the former are relatively understudied in attainment research. Another
weakness of status attainment models is that they do not study the unique factors that lead to
membership in top social and economic positions. Even status attainment research with a focus
on wealth outcomes has devoted little attention to the behaviors and processes that operate at the
top of the wealth distribution (Keister 2005; Spilerman 2000; Spilerman and Wolff 2012).
Elite Circulation
Elite theorists study more directly the combinations of traits and mechanisms that lead to
membership in top social and economic positions. The ideas of one theorist, Pareto, have
attracted little attention from sociologists, yet his work on elite circulation is particularly relevant
here. Pareto defined elites as those who rank highest on social values or commodities, which can
include power, knowledge, and even artistic ability or religious piety, but also includes scoring
highest on the control of financial resources (Pareto 1991 [1916]).2 Pareto also identified six
2 Mosca’s (1939) ideas are similar. See Zetterberg (1991) for a detailed comparison.

9
motivators of human action and used two of them to explain elite circulation. First, preservation
is the inclination to reaffirm the status quo and maintain prevailing circumstances and conditions.
Second, combination is the inclination to invent, create, and otherwise engage in new activities.
Although all people exhibit these traits at some times and to some degree, the traits are more
dominant in some individuals. Pareto referred to those with strong preservation tendencies as
consolidators and those with strong combination tendencies as innovators. Consolidators prefer
consistency, safety, and security; attempt to maintain the status quo for themselves and their
offspring; and are overrepresented among those in top positions given evidence that they engage
in social closure (Domhoff 2013b; Weber 1978). By contrast, innovators make new things, take
risks, and reinvest the rewards in additional, novel ventures; this category includes Schumpeter’s
entrepreneurs and Weber’s modern capitalists (Schumpeter 1934; Weber 1968; Zetterberg 1991).
These are not simply different labels for potential versus actual elites or for old versus new
money: Pareto emphasized that new and established elites have both traits, and he conceptualized
elite circulation as the process by which those for whom innovation is dominant replace—and
then become like—those for whom consolidation is dominant.
Proposition 1: Permeability of the One Percent
Two broad propositions regarding the one percent in the contemporary United States
follow from these ideas. First, some degree of permeability of top positions is likely. Status
attainment suggests that the right combination of socialization, selection, and social
psychological processes will allow some people to move up from a lower socioeconomic status
(SES) while many retain their high-SES origins. At the same time, less conducive permutations
of socialization, selection, and social psychological factors will prevent others from retaining
privileged positions.

10
Pareto’s ideas provide a mechanism for understanding how this happens: elite circulation
occurs as those in top positions fail to maintain their status and are replaced by those who were
not formerly in top positions. Those who start in top positions are likely to have a strong
tendency to consolidate, which is likely to manifest itself in exclusionary behavior. However,
because those who start in top positions will also vary in their tendencies to innovate, they will
vary in their educational outcomes as well. Those who start in positions other than the top may
not deliberately attempt to move up, but if they have strong innovative tendencies, their
educational attainment may lead to upward status movement, which may put them in top
positions. In addition, those who are in top positions and have innovative tendencies may invest
in other innovators (e.g., by providing capital to nascent entrepreneurs) and thus support both the
new ventures of others and facilitate income and net worth attainment for them. Ironically, this
investment might contribute to the replacement of the original investors at the top of the income
and net worth distributions. The result is likely to be a continuous, fluid flow of people into and
out of top positions; this flow is likely to be subtle rather than revolutionary, but it is likely to
occur continuously nonetheless. As a result, vacancies in top positions will be filled by the
upwardly mobile. Lateral mobility—or mobility among positions at the top of the income, net
worth, and both distributions—is also likely, reflecting the nuanced relationship between income
and net worth and people’s changing financial situations over the life course.
Importantly, permeability does not deny inequality, the concentration of resources at the
top of the income and net worth distributions, or the reality that structural constraints prevent
access to top positions for some groups. Rather, we expect that within a context of high and
growing inequality, the distribution of traits of origin leads to circulation of individuals into, out
of, and across top positions. Despite disagreement about who occupies top positions, income

11
decomposition research concurs that there have been changes at the top (Atkinson, Piketty and
Saez 2011), suggesting some amount of circulation; rates of both upward and downward net
worth mobility are higher than we would expect by chance (Keister 2005); members of the
Forbes 400 are less likely to have inherited their wealth or to have grown up wealthy (Kaplan
and Rauh 2013); and some groups have experienced upward net worth mobility in recent decades
(Keister 2007).
Although identifying empirical indicators of the permeability of top positions is
challenging, one measure is evident in the notion of three top groups that we identify: the degree
to which there is overlap between top income earners and top net worth owners (that is, the size
of the third, joint income–net worth group) indicates whether there is permeability at the top. The
degree to which top income earners and top net worth holders either are two completely separate
groups or overlap with each other to create a third group at the top of both distributions is likely
to vary across contexts and over time. We propose that the closer the overlap is to halfway
between no overlap and total overlap, the higher the level of permeability. To understand why,
imagine the extremes.3 First, in a society with no overlap, saved incomes would contribute little
to membership in top net worth positions; similarly, even the highest net worth would not
generate as much income as that of top income earners. Thus, two distinct elite groups would
exist—one with high income and one with high net worth—each with distinct advantages and
potentially different interests. By contrast, in a society with complete overlap, net worth would
be the dominant source of income, and saved income would simply reinforce the status of those
with top net worth. Thus, a single, privileged group, or core economic elite, would monopolize
both resources. In both extreme examples, there is high structural rigidity or limited movement
3 This idea is akin to Piketty’s hyperpatrimonial and hypermeritocratic societies (2013:264–65).
12
into, out of, or between (in the case of two groups) the core elite. A society with a more
permeable elite, however, is likely to have a third group that is high in both income and net
worth; that is, the top income and net worth groups are likely to overlap. In this scenario, the
overlap is a snapshot at one moment in time of ongoing upward, downward, and lateral mobility.
For the top one percent, high permeability will be evidenced in an overlap that is near
0.5. That is, although the top one percent by income or net worth alone is 1% of the population
by definition, the size of the group at the top of both distributions can vary. Specifically, overlap
between the tops of the two distributions can vary from none or 0 (i.e., the one percent by
income and by net worth are completely unique) to complete or 1 (i.e., the one percent by
income and by net worth are exactly the same). Thus, for the contemporary U.S., we propose:
Proposition 1: The percentage of the population that is at the top of both the income
distribution and the net worth distribution will be close to 0.5%.
Proposition 2: Membership in Top Positions
The second broad proposition that follows from status attainment and elite circulation
ideas is that in the contemporary U.S., a different combination of traits will be associated with
membership in the top one percent of income earners, the top one percent of net worth owners,
and the top of both distributions. Research on the one percent that studies either high income or
high net worth households assumes that the same processes lead to membership in both top
groups (Atkinson, Piketty and Saez 2011; Piketty and Saez 2003; Wolff and Zacharias 2009).
However, because these three top positions are distinct and there is some permeability of each, a
unique and predictable set of factors will be associated with membership in each top group.
Inheritance, for example, is often assumed to prohibit mobility and to lead directly to
inequality (Brown, Coile and Weisbenner 2010; McNamee and Miller 1998; Piketty 2013; Wolff

13
2002). This is logical given that intergenerational transfers allow families to pass accumulated
assets directly from one generation to the next, contributing to social ossification: if a small
number of families retain access to large estates over the generations, those who are not born into
privilege are unlikely to be able to move up the wealth distribution. Yet, studies of inheritance
have drawn varying conclusions, with some taking for granted that inheritance reduces mobility
(Keister 2005; Laitner 2001; Menchik and Jiankoplos 1998; Piketty 2013) others (more in line
with Pareto’s ideas) arguing that inherited wealth accounts for a small portion of total net worth
for the wealthiest households and that many of today’s wealthiest families are entrepreneurs who
created their fortunes recently (Gokhale and Kotlikoff 2000; Gokhale and Villarreal 2006). Janet
Yellen, Federal Reserve Board chair, recently offered the intriguing proposition that although
inheritance is concentrated at the top of the wealth distribution, these transfers are less
concentrated than total wealth. She proposed that inheritances are likely to contribute a sizable
additive effect for households with modest wealth, concluding that inheritances are a potential
source of economic opportunity for most Americans (Yellen 2014).
In reality, the effect of intergenerational transfers is likely to vary across top groups and
with the size of the inheritance. That is, Yellen’s proposal may be overly optimistic. Receiving a
large inheritance will certainly increase the likelihood of membership in all three top positions;
but because an extremely large inheritance is required to generate a top income and transferring
large incomes in other ways is more difficult (i.e., transferring ownership of a business is one
way that incomes can be bequeathed), the effect of inheriting is likely to be stronger for
membership in top net worth positions (i.e., top net worth only and top of both distributions) than
for membership in top income positions. Inheriting can also dampen innovation by reducing the
motivation to innovate and reducing incentives for personal achievement (Hurst, Luoh and

14
Stafford 1998; Keister 2000b; Spilerman 2000). Moreover, if households at the lower end of the
income and wealth distributions who have substantial debt receive an inheritance, they may be
inclined (or required) to pay off their debt before saving (Wolff and Gittleman 2011), suggesting
a reduced long-term impact of inheritance for households with limited resources. For these
reasons, the association between receiving a modest inheritance and membership in any of the
three top groups is likely to be negative. Thus, we expect the following:
Proposition 2A: A large inheritance will increase the likelihood of membership in all three
top groups, but the effect will be stronger for membership in top net worth positions.
Proposition 2B: A modest inheritance will reduce the likelihood of membership in top positions.
The effect of education on top memberships is also likely to vary in ways that are
consistent with permeability. Overall, education is likely to be an important predictor of
membership in top positions because human capital is positively associated with both income
and net worth at all levels of SES background. Those from privileged families (i.e., those who
also inherited large fortunes) are likely to have educational advantages as well. For those from
less privileged backgrounds, human capital is likely to be an important contributor to adult
income and net worth. Although we expect education to have a strong and positive effect on
membership in both top income and net worth positions, the effect is likely to be stronger for top
income positions after inheritance is controlled, reflecting the human capital effect on earnings
for those from more modest backgrounds. In addition, human capital is more directly tied to
labor income and thus facilitates mobility into top income positions more readily than it does top
net worth positions:
Proposition 2C: High levels of education will increase the likelihood of membership in all
three top positions, but the effect will be stronger for membership in top income positions.
15
Similarly, self-employment, which is influenced by both ascribed and achieved
components, is likely to have varying effects on membership in each of the three top positions.
Not only does self-employment embody the notion of innovation (Pareto 1991 [1916]), but
mobility research has also found a strong, positive effect of self-employment on upward mobility
(Aldrich, Renzulli and Langton 1998; Keister 2005). The effect of self-employment, however, is
likely to be weaker than inheritance and education in predicting membership in any of the top
three positions because the self-employed vary considerably in both income and the ownership
of business-associated assets. Indeed, evidence suggests that incomes and net worth among the
self-employed are more highly skewed than incomes and net worth for employees (Kim, Aldrich
and Keister 2004). Specifically, a small group of the self-employed earn much more than their
self-employed peers, inflating the mean income for all those who do not work for others.
Similarly, the self-employed whose businesses are relatively large (i.e., in terms of revenue and
employees) are likely to have relatively high levels of business equity, thereby contributing to
high levels of net worth and inflating the mean net worth for all those who are self-employed.
That is, the self-employed who are in the upper tails of the income and net worth distributions for
the self-employed are likely to occupy top income and net worth positions. Thus, owning a large
business will increase the likelihood of membership in both top income and top net worth
positions. Nevertheless, self-employment is unlikely to allow an individual to overcome the well-
established effects of inheritance and educational attainment. Specifically, we expect:
Proposition 2D: Self-employment will increase the likelihood of membership in all top three
positions, but the effect will be weaker than that of inheritance and education.
Of course, inheriting alone will not guarantee membership in top positions, and
permeability of the top implies that some individuals who are born privileged will not remain so.

16
For example, those who are in top positions because they inherited but do not go on to complete
education or otherwise distinguish themselves are likely to be replaced. It follows, then, that
those who inherit and either achieve high levels of education or start or inherit a business are
likely to remain in top positions. Permeability of top positions also suggests that those who did
not inherit may become members of the top three positions. Naturally, however, the road to a top
position is more difficult for those who do not inherit; for this reason, we expect that the
combination of attaining high levels of education and becoming self-employed represents the
most likely path to membership in top income and top net worth positions. Thus, we propose:
Proposition 2E: Inheritors who also attain high levels of education or are self-employed will
increase their likelihood of remaining in top positions.
Proposition 2F: For those who did not inherit, attaining high levels of education and
becoming self-employed represent the most likely path to membership in a top position.
Data and Research Methods
To study these ideas empirically, we use data from the Survey of Consumer Finances
(SCF). The SCF is a triennial survey of U.S. households collected by the Federal Reserve System
since 1983 that is ideal for this study because it uses a dual-frame sample designed to adequately
represent all households, including top income earners and net worth owners. The sample
provides good coverage of both broadly distributed variables (e.g., checking accounts) and
narrowly held variables (e.g., corporate stock) (Kennickell and Woodburn 1999). A multistage
national area probability sample ensures representation of broadly distributed traits; a list sample,
including an oversample of high-income households identified with Internal Revenue Service
data (Johnson and Moore 2005; Kennickell 2007), ensures representation of variables that are
narrowly held and highly skewed in ownership. Although the high-income respondents are not
17
specifically chosen to be high net worth, the resulting sample includes households at the top of
both the income distribution and the net worth distribution (Kennickell 2007).4 The SCF contains
detailed information about household income, assets, debts, and related financial information; it
also contains detailed information on inheritance, education, and other demographic traits useful
for controlling the various factors that contribute to income and net worth ownership (Johnson
and Moore 2005). We use SCF data for 1989, 1992, 1995, 1998, 2001, 2004, 2007, and 2010; we
also use a pooled version of the data in which we combine all cross sections into a single large
data set. We use the consumer price index (CPI-U) to inflate values to 2010 dollars.
One downside of the SCF is that it is a repeated cross-sectional survey. Ideally, we would
use longitudinal data that would allow us to identify life trajectories and movement into and out
of top positions. Unfortunately, no data are available that include longitudinal information and
sufficient data on top income earners and net worth owners. The National Longitudinal Survey
of Youth, the Panel Study of Income Dynamics, and the Survey of Income and Program
Participation are commonly used to study income and wealth ownership over the life course, but
none of these contain the data needed to understand who occupies top positions.
Variables
The dependent variables in our regression models are binary indicators of membership in
three mutually exclusive groups: the top one percent of (1) income earners only, (2) net worth
owners only, and (3) both income earners and net worth owners.
4 The SCF excludes households identified as Forbes 400 members using current information at
the time of the survey. Because the Forbes 400 are the top 0.00034% of households, few of them
are likely to be sampled; thus, only a small number of respondents will be excluded. This
exclusion may affect income and net worth estimates, but the effect is likely to be minimal.

18
Income. Total income is the sum of income from all sources for all members of
responding households, including wages; self-employment and business; taxable and tax-exempt
interest; dividends; realized capital gains; food stamps and other government transfer programs;
withdrawals from pensions/retirement accounts; Social Security; alimony; and miscellaneous
sources. Investment income and stock options are included as interests/dividends, capital gains,
or miscellaneous income when executed in the year prior to the survey. Unexecuted stock
options are not included because their value is uncertain until the exercise date. Capital gains and
stock options that were executed prior to the calendar year preceding the survey are reflected in
household assets. Income from sources other than wages and business/self-employment
constitutes a large portion of total income for the self-employed, and self-employed respondents
have more-diversified income portfolios than those who work for others. For the self-employed,
46.7% of income comes from wages; 39.9%, from self-employment; 6.0%, from interests or
dividends; and 7.0%, from capital gains. Comparatively, wages constitute 90.1% of income for
those who work for others. Only 0.58% of households report negative or zero income. Because
businesses often report losses, more self-employed households (1.41%) report negative or zero
income than those working for others (0.21%). Similarly, a small percentage (0.03%) of those
whose capital losses exceed their other income report negative income. Sensitivity analyses
indicated that negative and zero income values do not change our results.
Net worth. Net worth is total household assets (financial plus nonfinancial) less total
liabilities. Financial assets include transaction accounts and certificates of deposit, bonds;
publicly traded stocks, pooled investment funds, retirement accounts, cash value of life
insurance, other managed assets (e.g., annuities, trusts); and miscellaneous financial assets (e.g.,
cash, future proceeds, and business items). Nonfinancial assets include vehicles, the primary

19
residence and other residential real estate, net equity in nonresidential real estate, net equity in
privately held businesses, and miscellaneous nonfinancial assets (e.g., jewelry, antiques, art
objects). Omitting vehicles, jewelry, antiques, and art does not change our results because these
assets have little value for most households. Debts include principal residence debt (e.g.,
mortgages, home equity lines of credit), lines of credit other than those secured by the primary
residence, debt for other residential property, credit card debt, installment loans, and other debt
(e.g., loans against pensions, loans against life insurance, margin loans).
Top income and net worth. We define the threshold for membership in the top one
percent of each distribution empirically: we identify the dollar value that includes one percent of
the sample, and we identify those with greater than the threshold as members of the top one
percent. A small number of cases (52 or fewer) have incomes or net worth equal to the threshold,
which results in our top one percent occasionally exceeding 1% by a small margin. For example,
16 households in 1989 and 52 households in 2001 had an income equal to the 1% threshold for
those years, resulting in 1.02% and 1.03% (respectively) of households considered in the top one
percent. Similarly, for two years (1998 for income, and 2001 for net worth), the threshold is the
midpoint between two reported income/net worth values, resulting in slightly less than 1%
(0.98% and 0.99% respectively) of households falling in the top one percent. For years in which
no households have income or net worth equivalent to the threshold, the top one percent is
exactly equal to 1%. Because income has a smaller variance than net worth, income is more
often exactly at the threshold than is net worth. These sorting rules affect few households, and
using different sorting strategies does not change our results substantively.
Independent variables. We use four dichotomous indicators to measure inheritance: (1)
the top 1% of inheritors are those who received an inheritance above the 99th
percentile for all

20
households; (2) the next 9% of inheritors are those who received an inheritance between the 90th
and 99th
percentiles; (3) the remaining inheritors are those whose inheritance was less than the
90th
percentile; and (4) non-inheritors. The SCF asks respondents to report the total value of up
to four inheritances received and the dates on which they received those inheritances; dates are
recorded for the first three instances, and the fourth includes all other funds inherited. We sum of
the four reported inheritances and inflate them to 2010 dollars; our percentiles are year-specific.
We experimented with using a dichotomous indicator for ever inheriting and a continuous
measure of the amount inherited, but the four dichotomous measures more accurately reflect the
patterns in the data. We also use dichotomous (less than college, college degree, graduate degree
or more education) measures of education because the data reveal a clear difference between
having a graduate degree and the other educational levels. Our employment variables are not
working, self-employed, working for others, and retired. We include a dichotomous indicator of
occupation: managerial/professional, with other occupations omitted. We explored including
more fine-grained occupation indicators, but the dichotomous variable produced the best-fitting
models. Finally, we control for gender, age and age squared, race/ethnicity, and marital status.
Because preliminary analyses indicated that the dichotomous race/ethnicity and marital status
controls produced the best-fitting models, we do not include more-detailed indicators of these
concepts. Finally, we include dichotomous indicators of survey year, omitting 1989, to control
for changes in economic and social conditions over time.
Research Methods
We use descriptive statistics and multinomial probit regression models to study our
propositions. First, we compare the financial profiles of those in the top of the income, net worth,
and both distributions between 1989 and 2010. Next, we examine the size of the overlap between
21
the top one percent by income and the top one percent by net worth (i.e., the size of the group
that is in the top one percent by both resources) to provide an estimate of the degree of
permeability of top positions. Finally, we use multinomial probit models to evaluate the relative
importance of various influences on being in the top of the income and net worth distributions.
The multinomial probit model simultaneously computes a set of probit regression equations
predicting membership in three mutually exclusive groups: (1) the top one percent by income
only, (2) the top one percent by net worth only, and (3) the top one percent by both income and
net worth. The omitted (i.e., base) category is membership in none of the top groups. The
multinomial probit model is a generalization of the probit model that is used when the dependent
variable has multiple categories (Greene 2009). An alternative method of estimating these
models is to use a multivariate probit model, another generalization of the probit used to jointly
estimate correlated binary outcomes and that includes a term estimating the correlation between
the occurrence of both outcomes. We experimented with using multivariate probit as well and
found no substantive differences in our results. Because we want to understand these as three
separate but interrelated groups, we report results from the single, multiclass classification rather
than independent but correlated models of each outcome. We also considered using logistic
regression; however, probit models produce more-consistent estimates when the dependent
variable includes rare events and probabilities close to 0 or 1.
Sample Weights and Imputed Values
The unique SCF sample design, the potential for nonresponse bias, and the inclusion of
multiple imputations require careful weighting; and the SCF provides a specially constructed
analytic weighting variable for this purpose (Kennickell 1999, 2000; Kennickell and Woodburn
1999). The weights correct for three issues. First, they correct for selection into the original

22
sample. The two-stage sample is critical for accurate population estimates of top incomes and
wealth, but it is not an equal-probability design. The analytic weights combine information from
the two samples to provide accurate population estimates. Second, the weights correct possible
bias from nonresponse to the survey and nonresponse to particular survey items. Some evidence
suggests that SCF response rates are low compared with other major government surveys, such
as the CPS (Kennickell 1999), and nonresponse tends to be higher for pecuniary variables (e.g.,
net worth, income). The analytic weights adjust for these issues. Third, the weights provide a
measure of the frequency with which households similar to those in the sample could be
expected to be found in the population. That is, the total sum of weights for all observations
across the five imputations is the total number of households in the United States for each survey
year. Thus, the analytic weights provide an efficient way to compute descriptive statistics and to
run multivariate analyses of continuous dependent variables. However, the multivariate analysis
of categorical dependent variables does not allow for using analytic weights; it requires sample
(or probability) weights in which the sum of the observations is equal to the sample size. We
construct sample weights by dividing the analytic weight by the average analytic weight for each
survey year, and we use these constructed sample weights in the regression analysis.
An important strength of the SCF is that the Federal Reserve Board provides five imputed
values (i.e., replicates) for each household. The primary focus of the imputations is pecuniary
(e.g., net worth, income) rather than nonpecuniary (e.g., race, age) traits. Indeed, very few of the
nonpecuniary traits are imputed: gender and marital status are not imputed, 0.26% of households
have imputed race, 0.66% of households have imputed education, 0.08% of households have
imputed employment status, 0.45% of households have imputed occupation, and 0.08% of
households have imputed age. We treat the five replicates as separate observations for three

23
reasons. First, there are large differences in net worth and income for households with the same
nonpecuniary traits. Only 18.2% of households in the SCF have the same value for net worth
across the five imputations, and less than one-half (48.6%) of households have the same income
value across the five imputations. For our dependent variable (membership in one of the top
three groups), only 31.8% of households have consistent membership across imputations. That
is, only about one-third of households are consistently in the top income only, top net worth
only, or top of both groups across replicates. Second, the same household often has a different
value on the weight variable across imputations depending on its imputed net worth and income
values. It follows that to create population estimates (our focus), it is necessary to treat the
replicates as separate observations. Third, the SCF defines the population as total U.S.
households (i.e., 117.6 million in 2010). The weight variables are created such that the sum of
the weights across observations for each replicate is one-fifth of the U.S. population, suggesting
that the SCF intends for the five imputations to be treated as independent observations.5
(Table 1 about here)
Results: Financial Profiles of the Three Groups
Table 1 illustrates the distinctive income and net worth holdings for the three top groups.
The columns show estimates by year as well as for the pooled 1989–2010 data. The income and
net worth thresholds are the lowest observed value for each measure; these thresholds indicate
the income and net worth required for membership in the one percent. As we would expect, those
5 Running our multivariate analyses using the imputed values as five estimates for the same household
decreases our sample size from 177,565 to 35,513; it also increases the standard errors and makes some
previously significant variables insignificant. However, treating the imputed values in this way does not
change the substance of our results.
24
with only top income have higher median income and receive larger portions of total household
income than those with only high net worth in each year. In the years prior to the 2007–2009
recession, the income gap between these groups became notably larger, consistent with research
showing that income gains to the top one percent of income earners grew during the economic
bubble (Smeeding et al. 2011). The income threshold is also instructive: for those with top
income only, the income threshold ranged from over $343,000 in 1992 to more than $727,000 in
2007. In contrast, for those with top net worth only, the income threshold was zero in every year
except 1989 (when it was only $26,391). Of those in the top one percent by net worth only,
1.69% have zero income, 89.6% of whom are self-employed (details available upon request).
For each year, those with only top net worth have higher median net worth and own
larger portions of total net worth than those with high income only. Again, that gap grew in the
years prior to the 2007–2009 recession, as other work on that period suggested it would (Wolff,
Owens and Burak 2011). The net worth threshold underscores how different these groups are.
For those who are top net worth only, the net worth threshold ranged from just under $3.5
million in 1995 to more than $8.7 million in 2007. For those with top income only, the net worth
threshold is negative in the majority of years, exceeding –$20 million in 1989, 1995, and 1998.
Those in the top of both distributions are distinct from those in the other two groups and
are extremely privileged: they have higher median income and net worth and control higher
percentages of each resource than those in the other two groups in each year. Median income for
those in the top of both distributions ranged from nearly $700,000 in 1992 to more than $1.5
million in 2007; they received between 6.65% and 14.42% of total household income. Notice
that summing the percentage of total income earned by those in the top one percent by income
only and the percentage earned by those in the top of both distributions yields the percentage that

25
is typically cited as being earned by the top one percent of income earners; a significant portion
of this is earned by those at the top of both distributions. Similarly, those at the top of both
distributions had median net worth ranging from more than $6.5 million in 1992 to nearly $16
million in 2007, and they owned between 16.94% and 22.26% of total household net worth. Note
that those in the top of both distributions are not the same as the top 0.5 percent of either
distribution. The top 0.5 percent are certainly privileged, and the top 0.5 percent of income
earners have a higher median income and greater portions of the total house income than the top
of both distributions (see Appendix Table A). Likewise, the top 0.5 percent net worth holders
have higher median net worth and larger shares of the total household net worth. Nevertheless,
those in the top of both distributions are distinctive in that they have higher net worth profiles
than the top 0.5 percent of income earners and higher income profiles than the top 0.5 percent net
worth holders. Moreover, 38.55% of the top 0.5 percent income earners are not the top one
percent net worth holders, and 44.52% of the top 0.5 percent net worth holders are not the top
one percent income earners (not shown). This suggests that those at the top of both distributions
are not simply the top 0.5 percent of either the income or net worth distributions.
(Figure 1 about here)
Results: Overlap Size
The size of the overlap between the top of the income and net worth distributions
contains important initial evidence regarding the permeability of the one percent. To be clear, we
are not asking why resources are more concentrated at the top of the distributions of income and
net worth; rather, this result speaks to who occupies top positions within a context of growing
inequality. Figure 1 shows that the overlap has been relatively stable recently, ranging from .41
to .54. The average overlap for the eight years included in the figure is .46. Both the range of
values and the average indicate that there is neither complete overlap nor complete separation of

26
the top groups. In fact, the overlap value is very close to .5, consistent with our expectation that
this value would approach the midpoint between 0 and 1.6 Whereas it is difficult to imagine a
society in which there is complete nonoverlap (i.e., overlap of 0)—having completely distinct top
income earners and net worth owners—the opposite (i.e., overlap of 1) is relatively easy to
envision. Indeed, much of the sociology literature on elites assumes or explicitly argues that the
elite (which it takes as synonymous with the one percent) is a coherent group that is impervious
to outside entrants (Khan 2012). Similarly, wealth and inheritance research often suggests that
membership in top positions is virtually guaranteed to be passed across generations, implying
that outsiders are highly unlikely to have access to these positions (Keister 2000a; Spilerman
2000). Although there is no question about the advantages of a privileged upbringing, Figure 1
suggests a more-nuanced picture than the elite and wealth literatures suggest. Having high
income certainly increases the likelihood of membership in the top net worth group, with the
majority of top net worth holders also in the top one percent by income. Yet, the incomplete
overlap of the tops of the two distributions suggests that there are multiple combinations of traits
that can contribute to membership in top positions. Also noteworthy is that the overlap is
relatively constant over time except for the changes around 2004, during the economic bubble
and lead-up to the financial crisis. Of course, the overlap provides only preliminary evidence that
the one percent is permeable. A more thorough understanding of who occupies top positions
requires a direct consideration of how ascribed and achieved traits are associated with
membership in top positions. Our remaining analyses explore this question.
(Table 2 about here)
6 The size of the overlap is about 0.5, or half of the top one percent. The general pattern does not change
if we use different cutoffs (e.g., top five percent, top ten percent) to define top income earners and top net
worth owners.

27
Results: Constant Overlap Despite Changing Income Composition
There is debate in the literature on the one percent about the income composition of top
earners. Early evidence (Piketty and Saez 2003) suggested that the working rich (i.e., those with
predominantly labor income) had replaced rentiers (i.e., those with predominantly capital
income) at the top of the income distribution. Other work, however, has found that capital
income is an increasingly important component of the total income of top earners (Wolff and
Zacharias 2009; Piketty 2013). Our objective is not to address this debate, but if either of these
changes holds, it might follow that the overlap between the top one percent of the income and net
worth distributions would be changing rather than remaining stable.
Yet, we find that the overlap between top income earners and top net worth holders has
been relatively constant. There are two broad reasons that the overlap would remain stable even
if income composition is changing. First, the composition of total household income varies
considerably for those in the top by income, by net worth, and by both; and it is this variation,
rather than the size of capital or labor income alone, that affects the overlap (and thus
permeability). Table 2a shows the distribution of those in the top one percent of capital income
earners across the top three groups in our analyses, where capital income includes interest,
dividends, and capital gains. The table shows that large portions of top capital income earners are
not in any of our top groups: for example, in 1989, 13.45% of top capital income earners were in
the top one percent by income only, 9.08% were top net worth owners only, a mere 26.96% were
in the top of both distributions, and 50.5% were not in any top group. The pattern is similarly
high across all years in our data.
Most importantly, Table 2a shows that capital income is not strongly associated with net
worth holdings. Indeed, the correlation between capital income and net worth is rather modest (at

28
.35), and 54% to 64% of those in the top one percent by capital income are not in the top one
percent by net worth. As a result, the overlap between top income earners and top net worth
owners would not necessarily increase even if income composition were changing.
Similarly, other changes to the income composition of top earners do not change the
overlap size substantially, at least in the short run. For example, as Table 2b demonstrates,
growing wage income accruing to top income earners does not change the overlap; this table
shows the location in our top three groups of those whose wage income puts them in the top one
percent of wage income earners. Consistent with the finding that wage income has become more
important for top earners over the period we study (Piketty and Saez 2003), 48.16% (27.24 +
20.92) of top wage earners were at the top of the income distribution in 1989, but 57.55%
(37.50+20.05) were at the top of income distribution in 2010 (Table 2b). Yet, this change does
not affect the overlap size because the top three groups consist of qualitatively different members
(see Table 1 as well). Table 2c shows the distribution of several combinations of those in the top
one percent by wage, business, and capital income. In this table, the columns represent all those
in the one percent of each top group (i.e., the columns sum to 100%). Among top income
households, those in the top one percent by wages are the majority group (43.7%), followed by
those in the top one percent by business income (19.3%) and households not in the top one
percent by wage, business, or capital income (10.8%). By contrast, among top households of
both income and wealth distributions, households with multiple top income sources constitute
the majority group (48%). Thus, overlap size is a function of the degree to which households
have multiple income sources rather than the extent to which one source dominates total income.
The very long-term effect of these income composition changes on the overlap size may be more
pronounced, but the short-term effect is minimal.

29
The second reason that the overlap is likely to stay constant despite changing income
composition is that other social processes override changing economic conditions. Underlying all
our findings is the fact that social factors—including status attainment processes and elite
circulation—are operative. Life course processes are particularly important contributors to the
composition of the top three groups that we study. Younger high-earners are more likely to be
members of the top one percent by income only, the middle-aged rich are more likely to be in the
top of both distributions, and the older rich are likely to be at the top of the net worth distribution
only. These life course patterns have not changed markedly in recent decades, and thus the
overlap has not changed. Finally, inheritance, human capital, entrepreneurship may also
contribute to the stable overlap size. Irrespective of changes in macroeconomic factors, social
factors consistently affect mobility prospects. That is, the three groups seem to have distinct
members who are defined by their backgrounds. As long as the members of top three groups are
selected with social filters, the overlap size should be constant over time.
(Table 3 about here)
Results: Demographic Profiles of the Three Groups
Demographic profiles of the three top groups, shown in Table 3, provide additional
evidence of some permeability of top positions.7 The table also begins to identify the
combinations of traits that lead to membership in top positions and the mechanisms through
which households arrive at these positions. The table shows that members of each of the three
top groups were more likely than other households to inherit, and when they did inherit, those at
the top inherited larger amounts than the rest of the population. More importantly, the three top
7 In the ―everyone else‖ column in Table 3, 72% are male because the SCF includes gender for head of
household. The household is our unit of analysis because most assets are owned jointly by married
couples; as a result, we do not deal directly with gender differences.
30
groups clearly differ in inheritance: those in the top of the net worth distribution only and those
in both distributions were more likely to inherit than those at the top of the income distribution
only. Consistent with Proposition 2A, the amount inherited is much larger for those in top net
worth positions (net worth only and top of both distributions) than for those in top income
positions: mean inheritance for those in top income positions (when we calculate the mean
including all respondents) is slightly less than $170,000. By contrast, top net worth owners
received more than $930,000 in inheritance, and those at the top of both distributions inherited
the largest amounts, at more than $1.1 million. Differences in inheritance across top groups are
even more extreme when we calculate the mean for just those who inherited any amount. In this
case, the amount inherited by those at the top of both distributions is more than $2 million
greater than the amount inherited by those at the top of the income distribution only. Naturally,
these extremes are less pronounced when we consider the median, but the median inheritance is
still larger for top net worth owners than for top income earners. We do not include the median
inheritance for all respondents because the value is zero across all groups. Notably, median
inheritance is lower for those at the top of both distributions than for those at the top of the net
worth distribution only. One conclusion that could be drawn from this is that inheritance can
increase the odds of being a member of the one percent by net worth, but it does less to move
people into top income positions. Given that high incomes can ultimately lead to high net worth,
some individuals might follow a path that starts with entry into top income positions and
eventually leads to membership in top net worth positions as well. Of course, high net worth also
contributes to high income, and those who inherit, in particular, might follow this path .
(Figure 2 about here)
Figure 2 illustrates the relationship between inheritance and membership in the one

31
percent slightly differently: it shows the percentage of households, by level of inheritance, that
are in our three top income and net worth groups. Along the horizontal axis is the percentile for
amounts inherited. For example, p99 represents those whose total inheritance places them in the
top one percent of inheritors. That is, these are bivariate relationships between the amount
inherited and membership in any of the three top groups. As the figure illustrates, those who
inherit relatively small amounts are not likely to be members of any of the top groups.
Membership in the one percent begins to increase only for those whose inheritance was above
the 90th
percentile, and even then, the relationship is relatively unremarkable. The influence of
inheritance at the 98th
percentile, however, is striking: membership in top net worth positions
increases dramatically. Above the 99th
percentile by inheritance, membership in the top one
percent by net worth is virtually assured. Indeed, it is this relationship—which is visible in
popular fascination with wealth— that likely creates the foundation for the assumption that
inheritance is a guarantee of top status (Khan 2012). Yet, Figure 2 shows that the reality is more
nuanced: even receiving an extremely large inheritance (i.e., in the 99th
percentile) does little to
affect membership in top income positions, and it has only a modest bivariate association with
membership in the top of both distributions. This pattern is consistent with prior literature
studying membership in the one percent by income (indirectly using income components) that
has found an overrepresentation of earned income among top earners (Piketty and Saez 2003).
Again, though, because our finding is bivariate, it is only suggestive.
The descriptive statistics are agnostic on the role of education in determining membership
in top positions, but they are consistent with our expectations regarding self-employment and
membership in the one percent. Table 2 shows that educational levels are higher for members of
all three top groups than for other households, but it shows no notable difference in educational

32
levels across the members of the top three groups. In contrast, the percentage of those in the top
three groups who are self-employed varies across the three groups. Members of all three groups
are more likely to be self-employed than those who are not in the one percent. Consistent with
Proposition 2E, the three top groups differ on self-employment: 47% of top income earners, 51%
of top net worth owners, and 58% of those in the one percent by both resources are self-
employed. This suggests that self-employment may be an important path to top income and net
worth; we explore this in more detail in the multivariate models included in upcoming Table 4.
Other demographic traits also provide insight into the distinctiveness of the three top
groups. Those in the top one percent only by income were very likely to be employed by
someone else and to be managers, suggesting that they might be top CEOs; that is, many are
likely to be corporate managers who have high salaries but not enough net worth to place them in
the top of the net worth distribution. Unfortunately, the SCF does not provide sufficient
information to determine whether the respondent is a corporate CEO or to identify particular
professions. Those who are top income earners and not top net worth owners are relatively
young, consistent with the idea that they may still become members of the top of both
distributions. The group of top net worth owners who are not also top income earners includes
large percentages of the self-employed and retirees; notably, the self-employed may still become
members of both top groups, but retirees, who may once have had top incomes as well, are
unlikely to become top income earners (or return to the top of both distributions).
(Table 4 about here)
Results: Inheritance, Education, and Self-employment
The results shown in Table 4 show more clearly that multiple combinations of traits
contribute to membership in top positions, providing support for our proposal that different traits
33
are associated with membership in the top one percent of income earners, the top one percent of
net worth owners, and the top of both distributions. Recall that the multinomial probit models
simultaneously compute a set of probit regression equations predicting membership in our three
top groups. Consistent with Proposition 2A, Model 1 shows that receiving a large inheritance
(i.e., top one percent or the next nine percent of inheritors) is strongly associated with
membership in each top group; but the association is stronger for membership in top net worth
positions (coefficients = 1.452 and 1.227, respectively, for top net worth and top income and net
worth) than for top income positions (coefficient = 0.48). The coefficients suggest that being
among the top one percent of inheritors increases the probability of membership in the top net
worth only and in the top of both distributions by 1.1% and 0.75%, respectively.8 By contrast, it
increases the probability of membership in the top income group (only) by just 0.11%.
Those who receive a modest inheritance (i.e., below the 90th
percentile) are less likely
than non-inheritors to be members of any of the top income and net worth positions, consistent
with Proposition 2B. Supplementary analyses (not shown) indicate that the negative effect is
driven largely by the upper tails of the inheritance distribution: inheritors who receive an amount
just below the 90th
percentile do not enter top income or net worth positions. For those in the 83rd
through 89th
percentiles by inheritance, inheritance has a negative effect on membership in top
income and net worth positions. Although we cannot say with certainty that lack of motivation
caused by inheriting a modestly large sum accounts for this pattern, the finding is consistent with
that interpretation.
Educational differences across those in top income and net worth positions appear minor
in the descriptive statistics (Table 2), but education is strongly and positively correlated with
8 We report average marginal effects, an estimate of the population average marginal effect, because it
controls sample composition and is thus more robust (Greene 2011; Mitchell 2012).
34
membership in these positions when other factors are controlled (Table 4, Model 1). Consistent
with Proposition 2C, high levels of education increase the likelihood of membership in all three
top positions; however, the effect is stronger for membership in the top one percent by income
(coefficient = 1.118) and the top of both the income and net worth distributions (coefficient =
1.103) than for the top one percent by net worth (coefficient = 0.765). Holding a graduate degree,
on average, increases the probability of membership in top net worth (only) positions by only
0.54%, but it increases the probability of membership in top income (only) positions and in the
top of both distributions by 0.92% and 0.72%, respectively. The models shown in Table 4
include measures for having a graduate degree and having a college degree and omit those with
less than a college education. Although a college degree is positively associated with top
membership, the effect of having a graduate degree is stronger. The finding that education, net of
other factors (including inheritance), increases membership in top income positions more than
membership in top net worth positions adds additional evidence that top positions are permeable:
it suggests that top income positions may be a gateway to individual membership in the one
percent and may portend longer-term family well-being if that income is also translated into high
levels of net worth. The somewhat stronger effect of having a graduate degree compared with a
college degree is noteworthy, as well. Although status attainment research has acknowledged the
critical role of educational attainment in generating adult status, a focus on differences between
college completion and completion of graduate programs has been minimal in prior research.
This is partly because when early status attainment models were developed, graduate school
degrees were more rare than they are today (Sewell, Haller and Ohlendorf 1970; Sorensen 1979;
Treiman and Terrell 1975). Yet, contemporary research using a status attainment framework has
found relatively minimal differences in some outcomes, including net worth status, between

35
those with college degrees and graduate school degrees (Keister 2005; Warren and Hauser 1997).
Our finding suggests that, at least for understanding membership in top positions, this distinction
is important. Ideally, we would be able to differentiate within the broad category of graduate
degrees to identify the importance of types of degrees (e.g., business, law, medicine, and various
doctorates), but this level of detail is not available in the SCF.
Self-employment is another important correlate of membership in top positions.
Consistent with Proposition 2D, self-employment is strongly associated with membership in all
three top positions, although the effect is weaker than the effect of inheritance or education: the
coefficient relating self-employment to membership in the top of both distributions is 0.732,
compared with 1.227 for being a top inheritor and 1.103 for having a graduate degree. The
association between self-employment and membership in the top of both distributions appears to
be strongest, but the difference in the effect of self-employment across top positions is not
statistically significant. The role of self-employment in membership in top positions is
noteworthy and highlights the importance of self-employment as a means for achievement and
for permeating top positions—a finding that would not surprise Pareto. Indeed, if there were a
single, contemporary indicator of Pareto’s concept of innovative tendencies, it would perhaps be
self-employment. Pareto’s idea that those with a proclivity to innovate, regardless of their
starting position in life, are likely to become a society’s elite is clearly manifest in the association
we find between self-employment and membership in top positions. Pareto would probably
prefer that we use an indicator of individual orientations to study this more directly, and future
research might usefully address that challenge. We are unable to do so using the SCF, which
does not include psychological or social psychological measures.
Naturally, inheritance, education, and self-employment do not operate independently. To

36
explore the connections among these important traits, we include estimates from a second
multinomial probit model in Table 4. Model 2 includes a set of dummy variables: (1) being a top
inheritor (top one percent of inheritors); (2) having a graduate school degree; (3) being self-
employed; (4) being a top inheritor and having a graduate school degree; (5) being a top inheritor
and being self-employed; (6) having a graduate degree and being self-employed; and (7) being a
top inheritor, having a graduate degree, and being self-employed. The omitted reference group is
those who are non-inheritors, have less than a college degree, and are currently not working.
Figure 3 illustrates more clearly the mechanisms underlying top membership and the
various combinations of traits that lead to these elite positions. The figure graphs predicted
margins generated using Table 4 (Model 2) to illustrate the relative weight of these interactions
in generating membership in each of the three top positions. We used the average marginal (or
partial) effects method to calculate the predicted probabilities, a widely used method for
calculating predicted probabilities for nonlinear models that has the added advantage of
accounting for correlations between the focal variables and other covariates (Cameron and
Trivedi 2005; Greene 2011; Wooldridge 2002). Using Model 2 in Table 4, we calculated the
predicted probability of being in the top three positions for every observation in the sample by
manipulating the values corresponding to every combination of top inheritance, self-
employment, and having a graduate degree while retaining original values for other covariates.
We then averaged the calculated predicted probabilities across all observations.
Figure 3 shows that multiple combinations of traits lead to membership in top positions.
The combination effects are clearly an important part of the explanation for membership in top
positions. Inheritance still matters, but consistent with Proposition 2E, inheritors who also have
graduate degrees or are self-employed are more likely to retain their privileged positions. Among

37
top inheritors who not only have a graduate degree but also are self-employed, 2.25% are
predicted to be top income earners; 4.78%, to be top net worth holders; and 8.08%, to be at the
top in the both distributions. Of these, 15.11% (i.e., 2.25% + 4.78% + 8.08%) are predicted to be
in either the top income or the top net worth group; thus, 84.89% are predicted to hold no top
membership. These predicted probabilities are much higher than 0.5%, the expected probability
of membership in each top position for all respondents. These results also show that those who
simply inherit (and do not attain high levels of education or start a business) are at a clear
disadvantage for retaining their top positions. Conversely, for those who did not inherit, the
combination of completing a graduate school degree and becoming self-employed is the most
likely route to membership in top positions, as Proposition 2F predicted. Self-employed non-
inheritors with a graduate degree have a higher probability than simply top inheritors of being
top income earners (2.56% compared with 0.62%) and of being at the top in the both
distributions (2.40% compared with 1.12%). These findings are consistent with Pareto’s notion
of circulation: those who start at the top but are not innovators and do not otherwise distinguish
themselves may, indeed, move down and free up space for those with less advantaged
backgrounds to move up. Again, because we do not have longitudinal data on the same
individuals, we cannot say with certainty whether these are the same people moving up over their
lives, but future research might explore this more directly.
(Figure 3 about here)
A related issue is whether different sources of inherited wealth will differentially affect
the likelihood of membership in top income and net worth positions. Unfortunately, because the
SCF does not include detailed information on the sources of inherited wealth, we are unable to
evaluate the effect of different inheritance sources on top memberships directly. Nevertheless,

38
our results indirectly provide insight into this issue. First, we assume (using Model 2 of Table 4)
that those who inherit a large family business are most likely to be self-employed top inheritors
(with or without graduate degrees) and that those who inherit a large amount of money (other
than a family business) are most likely to be top inheritors (with or without graduate degrees).
Then, we can compare two groups: top inheritors versus self-employed top inheritors, and top
inheritors with graduate degrees versus self-employed top inheritors with graduate degrees. As
Figure 3 illustrates, those who inherited a large business (self-employed inheritors and self-
employed inheritors with graduate degrees) are more likely to be in the top of both the income
and net worth distributions than those who inherited a large amount of money (top inheritors and
top inheritors with graduate degrees). The predicted probabilities of being in the top of both
distributions for self-employed inheritors and self-employed inheritors with graduate degrees are
1.98% and 7.39%, respectively; the predicted probabilities for top inheritors and top inheritors
with graduate degrees are 1.15% and 3.53%, respectively. This suggests—albeit indirectly—that
receiving a large business inheritance provides a notable advantage in generating high income
and net worth over receiving a large nonbusiness inheritance.
Given that we do not have data on the same individuals over time, it is not possible to
draw conclusions about life course processes. However, the age and age-squared coefficients
offer some insight into the role that life stage might play in generating membership in the top of
the income, net worth, and both distributions. That is, the age/age-squared inflection point varies
for each of our top three groups: it is 57.8 for those who are top income earners only, 78.8 for
those who are top net worth owners only, and 66.2 for those who are at the top of both
distributions. This pattern highlights the potential for top income status to serve as a gateway to
membership into top net worth positions and positions at the top of both distributions. That is,

39
the age pattern suggests that at least part of the process underlying our findings is a movement
over the course of a career into the top of the income distribution (i.e., as earnings increase but
assets have not yet reached top net worth levels) and then into the top of both distributions as
asset values increase. For many, the next step is then, in retirement, into the top of the net worth
distribution only. Again, this interpretation is speculative, but it hints at an underlying dynamic
life course process that drives circulation at the top of these distributions.
Conclusion and Discussion
The one percent has attracted renewed attention in recent years, and although basic facts
about their income and net worth are now well-known, it is less clear who has access to these top
positions. In this paper, we studied the relative weight of ascribed and achieved traits in
predicting who occupies top income and net worth positions. We made two primary
contributions. First, we proposed that a redefinition of the one percent is in order. In particular,
rather than looking at the top one percent either by income or by net worth, we looked at three
groups: top income earners, top net worth owners, and those at the top of both distributions. We
showed that these three groups are, indeed, distinct and that disaggregating them clarifies our
understanding of resource concentration and adds new insight into what we know about the
determinants of membership in top income and net worth positions. Although all three groups
are privileged, our results show that those at the top of both distributions receive higher median
incomes and larger percentages of total household income than those who are in the top one
percent by income only. We also found that those at the top of both distributions own higher
levels of net worth and control larger percentages of total net worth than those who are in the one
percent only by net worth. Conceptualizing the one percent in this slightly different fashion
underscores the degree to which income and net worth are concentrated in the United States.

40
More importantly, however, our findings show that there is a more-privileged group at the top of
both the income and net worth distributions that is more advantaged than previous research
might have anticipated. Notably, our supplementary analyses show that those at the top of both
distributions are not simply the very top (i.e., the top 0.5 percent) of either the income or the net
worth distributions. Approximately 40% of the top 0.5 percent income or net worth group does
not overlap with the top of both distributions.
Our second main contribution was to draw on ideas from research on status attainment
and elite circulation to develop a set of propositions regarding the permeability of top income
and net worth positions. We proposed that disaggregating the one percent into three top groups
would likely show that there is some permeability at the top and that different traits are
associated with membership in each of the top three positions. Our analyses of the overlap
between top income and top net worth positions provided initial evidence for permeability: the
overlap between the top one percent by income and net worth was relatively constant across the
years we studied. Recall that this indicates that the top positions are neither completely separate
nor completely identical. We also found that the overlap has been relatively constant despite
capital income becoming a more pronounced form of income for top earners, a reflection of the
importance of having multiple top income sources for membership in top positions. Given that
having multiple top income sources is a function of various socioeconomic traits, individual
traits rather than financial profiles are more fundamental determinants of top membership.
To explore which traits are associated with top membership and to address the issue of
permeability more directly, we then turned to evaluating the relative weight of inheritance,
education, and occupation (particularly self-employment, which we proposed has contemporary
significance as an occupational status) in generating membership in top positions. We found that

41
a large inheritance is certainly an advantage it increased the likelihood of membership in all three
top groups, particularly top net worth positions. Moreover, we found that not all those who
inherit continue to occupy top income and net worth positions. Rather, inheritors who also
complete college or, more importantly, graduate school or are self-employed increase their
chances of remaining in top positions, particularly top net worth positions. We found important
evidence that a modest inheritance can actually have a negative effect on membership in top
positions, perhaps reflecting a dampening of motivations among inheritors that becomes apparent
for those whose inherited assets are not sufficient to guarantee membership in top income and
net worth positions. Those with high levels of education and the self-employed are also
advantaged in attaining membership in top positions, and these effects vary by top income group:
the effect of education is stronger for top income positions, while the effect of self-employment
is relatively constant across the three groups.
Although our research question is closely related to issues discussed by scholars of class,
we were unable to address some of the important issues addressed in that literature. In particular,
we were unable to study the social processes that underlie membership in any of the positions we
studied. For example, we could not speculate about the degree to which social closure motivates
those at the top of the income and net worth distributions. We could not determine whether those
who occupy top positions act to deliberately prevent others from entering their ranks. Similarly,
we drew on Pareto’s ideas about elite circulation to develop our ideas about whether there is
permeability of top positions; however, we were unable to test his ideas about human
propensities (e.g., innovation, consolidation) that constitute the mechanisms for circulation.
Theorists remind us that it is not necessary to test directly each component of a theory (Cohen
1988), but we recognize that this is unsatisfying. It would be preferable to study individuals in

42
various portions of the income and net worth distributions to better understand their motivations.
Researchers studying elites have made considerable progress in this area. Domhoff’s work, in
particular, is exemplary and offers important insights that suggest social closure is, indeed, in
operation at the top (Domhoff 2013b). An important next step would be to use Domhoff’s ideas
to generate representative survey data with social psychological measures to test the ideas across
the income and net worth distributions.
Our research also opens the door for asking other, related questions. Although the SCF
data are an excellent resource for studying top income earners and net worth owners, they are not
perfect. The SCF contains information on key indicators, but the data are cross-sectional. Ideally,
we would have data that follow the same individuals over time to allow us to study whether there
is intragenerational mobility by income and net worth. The National Longitudinal Survey of
Youth and the Panel Study of Income Dynamics have both been used effectively to study income
and net worth over time, but neither of these data sets contains sufficient numbers of households
with high income or high net worth to address questions about the one percent. Information on
inheritance is also suboptimal in these longitudinal data sets, which would make it difficult to
thoroughly explore the role of inherited resources. Similarly, the SCF does not have sufficient
data to study other influences on membership in top positions. We do not have detailed
information on occupations, types of graduate degrees earned, or social networks. Another
important issue that is beyond the scope of this work is the role of race/ethnicity in generating
membership in top income and net worth positions. Our results suggest that few nonwhites
occupy top positions, but recent work shows that this trend might be changing (Zweigenhaft and
Domhoff 2003, 2006, 2014). Because the SCF provides limited information on race and ethnicity
in the SCF and because nonwhite membership in top positions is quite low, we are unable to

43
speak to the degree to which race and ethnicity matter here. Future research might address these
issues.
Finally, another important area that future research may want to explore is how these
patterns vary across countries. Our data are limited to the United States, but recent cross-national
research on inequality suggests that national context leads to important variations in the nature
and determinants of inequality and the permeability of top positions (Piketty and Saez 2006;
Skopek, Buchholz and Blossfeld 2014). One particularly interesting study compared
stratification patterns across 18 developed Western countries and showed that these countries can
usually be grouped by the nature of income and wealth inequality (Skopek, Buchholz and
Blossfeld 2014). For example, they found that countries can usually be grouped into four groups
by high and low net worth and income inequality. Spain and Portugal have relatively high
income inequality and low net worth inequality, whereas Sweden and Denmark have low income
inequality and high net worth inequality. The United States was not included in their study, but it
would fall in their third cluster, along with countries that have high inequality on both income
and net worth. The varying levels of inequality across these clusters are likely to correspond to
variation in the overlap between top income and top net worth positions that we discuss in this
paper. For example, in countries with low income inequality as a result of strong state
redistributive policies and with strong norms regarding the transfer of inheritances across
generations, the overlap across top positions is likely to be significantly less than 0.5. Exploring
these cross-national differences inform basic research and might lead to more-concrete policy
recommendations that could address the permeability of top positions.

44
Works Cited
Aldrich, Howard E., Linda A. Renzulli, and Nancy Langton. 1998. "Passing on Privilege: Resources
Provided by Self-Employed Parents to Their Self-Employed Children." Research in Social
Stratification and Mobility 16:291-317.
Atkinson, Anthony B., Thomas Piketty, and Emmanuel Saez. 2011. "Top Incomes in the Long Run
of History." Journal of Economic Literature 49:3-71.
Bartels, Larry M. 2008. Unequal Democracy: The Political Economy of the New Gilded Age.
Princeton, NJ: Princeton University Press.
Bebchuk, Lucian A., and Jesse M. Fried. 2004. Pay without Performance: The Unfulfilled Promise of
Executive Compensation. Cambridge, MA: Harvard University Press.
Bebchuk, Lucian Arye, and Jesse M. Fried. 2003. "Executive Compensation as an Agency Problem."
Journal of Economic Perspectives 17:71-92.
Bivens, Josh, and Lawrence Mishel. 2013. "The Pay of Corporate Executives and Financial
Professionals as Evidence of Rents in Top 1 Percent Incomes." Journal of Economic
Perspectives 27:57-78.
Blau, Peter, and Otis D. Duncan. 1967a. The American Occupational Structure. New York: Wiley.
Blau, Peter Michael, and Otis Dudley Duncan. 1967b. The American Occupational Structure. New
York: Wiley.
Bonica, Adam, Nolan McCarty, Keith T. Poole, and Howard Rosenthal. 2013. "Why Hasn't
Democracy Slowed Rising Inequality?" Journal of Economic Perspectives 27:103-24.
Brown, Jeffrey R., Courtney C. Coile, and Scott J. Weisbenner. 2010. "The Effect of Inheritance
Receipt on Retirement." The Review of Economics and Statistics 92:425-34.

45
Burchell, Robert A. 1989. "The Faded Dream: Inequality in Northern California in the 18602 and
1870s." Journal of American Studies 23:215-34.
Cameron, A. Colin, and Pravin K. Trivedi. 2005. Microeconometrics: Methods and Applications.
Cambridge: Cambridge University Press.
Campbell, Richard T., and John C. Henretta. 1980. "Status Claims and Status Attainment: The
Determinants of Financial Well-Being." American Journal of Sociology 86:618-29.
Cohen, Bernard P. 1988. Developing Sociological Knowledge: Theory and Method. New York:
Cengage Learning.
DiPrete, Thomas A., Gregory M. Eirich, and Matthew Pittinsky. 2010. "Compensation
Benchmarking, Leapfrogs, and the Surge in Executive Pay." American Journal of Sociology
115:1671-712.
Domhoff, G. William. 2013a. The Myth of Liberal Ascendancy. Boulder: Paradigm.
—. 2013b. Who Rules America? The Triumph of the Corporate Rich. New York: McGraw Hill.
Dunn, Alan. 2011. "Avera America vs. the One Percent." Forbes
http://www.forbes.com/sites/ey/2015/03/13/6-entrepreneurial-women-to-watch/.
Edlund, Lena, and Wojciech Kopczuk. 2009. "Women, Wealth, and Mobility." American Economic
Review 99:146-78.
Fligstein, Neil. 2002. The Architecture of Markets: An Economic Sociology of Twenty-First-Century
Capitalist Societies. Princeton: Princeton University Press.
Frank, Robert H. 2000. "Does Growing Inequality Harm the Middle Class?" Eastern Economic
Journal 26:253-64.
Gokhale, Jagadeesh, and Laurence J. Kotlikoff. 2000. "The Baby Boomers' Mega-Inheritance - Myth
or Reality?" Federal Reserve Bank of Cleveland Economic Commentary.

46
Gokhale, Jagadeesh, and Pamela Villarreal. 2006. "Wealth, Inheritance and the Estate Tax." Dallas,
TX: National Center for Policy Analysis.
Greene, William. 2009. Econometric Analysis, Sixth Edition. New York: Macmillan.
—. 2011. Econometric Analysis. Englewood Cliffs, NJ: Prentice Hall.
Hansen, Marianne Nordli. 2014. "Self-Made Wealth or Family Wealth? Changes in Intergenerational
Wealth Mobility." Social Forces 93:457-81.
Hurst, Erik, Ming Ching Luoh, and Frank P. Stafford. 1998. "Wealth Dynamics of American
Families, 1984-1994." Brookings Papers on Economic Activity 1:267-337.
Johnson, Barry, and Kevin Moore. 2005. "Consider the Source: Differences in Estimates of Income
and Wealth from Survey and Tax Data." Federal Reserve Board.
Kaplan, Steven N., and Joshua Rauh. 2013. "It's the Market: The Broad-Based Rise in the Return to
Top Talent." Journal of Economic Perspectives 27:35-56.
Keister, L.A. 2000a. Wealth in America: Trends in Wealth Inequality. New York: Cambridge
University Press.
Keister, Lisa A. 2005. Getting Rich: America's New Rich and How They Got that Way. New York:
Cambridge University Press.
—. 2007. "Upward Wealth Mobility: Exploring the Roman Catholic Advantage." Social Forces
85:1195-225.
—. 2014. "The One Percent." The Annual Review of Sociology 40:347-67.
Keister, Lisa A., and Hang Young Lee. 2014. "The One Percent: Top Incomes and Wealth in
Sociological Research." Social Currents 1:13-24.
Keister, Lisa A., Moller, Stephanie. 2000b. "Wealth Inequality in the United States." Annual Review
of Sociology 26:63-81.
47
Kennickell, Arthur B. 1999. "Revisions to the SCF Weighting Methodology: Accounting for
Race/Ethnicity and Homeownership." Federal Reserve Board Working Paper
http://www.federalreserve.gov/econresdata/scf/files/weightrevision.pdf.
—. 2000. "Revisions to the Variance Estimation Procedure for the SCF " Federal Reserve Board
Working Paper http://www.federalreserve.gov/econresdata/scf/files/variance.pdf.
—. 2007. "The Role of Over-sampling of the Wealthy in the Survey of Consumer Finances." Federal
Reserve Board.
Kennickell, Arthur B., and R. Louise Woodburn. 1999. "Consistent Weight Design for the 1989,
1992, and 1995 SCFs, and the Distribution of Wealth." Review of Income and Wealth 45:193-
215.
Kerckhoff, Alan C. 1976. "The Status Attainment Process: Socialization or Allocation?" Social
Forces 55:368-81.
Khan, Shamus Rahman. 2012. "The Sociology of Elites." Annual Review of Sociology 38:361-77.
Kim, Phillip H., Howard E. Aldrich, and Lisa A. Keister. 2004. "Household Income and Net Worth."
Pp. 49-61 in Handbook of Entrepreneurial Dynamics: The Process of Business Creation in
Contemporary America, edited by William B. Gartner. Thousand Oaks, CA: Sage.
Knottnerus, J. David. 1987. "Status Attainment Research and its Image of Society." American
Sociological Review 52:113-21.
Kopczuk, Wojciech, and Emmanuel Saez. 2004. "Top Wealth Shares in the United States: 1916-
2000: Evidence from Estate Tax Returns." National Tax Journal 57:445-87.
Kuznets, Simon. 1953. Shares of Upper Income Groups in Income and Savings. New York: National
Bureau of Economic Research.
Laitner, John. 2001. "Secular Changes in Wealth Inequality and Inheritance." Economic Journal
111:691-721.

48
Macunovich, Diane J., Richard A. Easterlin, Christine M. Schaeffer, and Eileen M. Crimmins. 1995.
"Echoes of the Baby Boom and Bust: Recent and Prospective Changes in Living Alone
Among Elderly Widows in the United States." Demography 32:17-28.
McCall, Leslie, and Christine Percheski. 2010. "Income Inequality: New Trends and Research
Directions." Annual Review of Sociology 36:329-47.
McClendon, Mckee J. 1976. "The Occupational Status Attainment Processes of Males and Females."
American Sociological Review 41:52-64.
McNamee, Stephen J., and Robert K. Miller. 1998. "Inheritance and Stratification." Pp. 193-213 in
Inheritance and Wealth in America, edited by Robert K. Miller and Stephen J. McNamee.
New York: Plenum Press.
Menchik, Paul L., and Nancy A. Jiankoplos. 1998. "Economics of Inheritance." Pp. 45-59 in
Inheritance and Wealth in America, edited by Jr. Robert K. Miller and Stephen J. McNamee.
New York: Plenum Press.
Neckerman, Kathryn M., and Florencia Torche. 2007. "Inequality: Causes and Consequences."
Annual Review of Sociology 33:335-57.
Page, Benjamin I., Larry M. Bartels, and Jason Seawright. 2013. "Democracy and the Policy
Preferences of Wealthy Americans." Perspectives on Politics 11:51-73.
Pareto, Vilfredo. 1991 [1916]. The Rise and Fall of Elites: An Application of Theoretical Sociology.
Brunswich, NJ: Transaction.
Parkin, Frank. 1979. Marxism and Class Theory: A Bourgeoise Critique. London: Tavistock.
Piketty, Thomas. 2013. Capital in the Twenty-First Century. Cambridge, MA: Harvard University
Press.

49
Piketty, Thomas, and Emmanuel Saez. 2003. "Income Inequality in the United States, 1913-2002."
Quarterly Journal of Economics 118:1-39.
—. 2006. "The Evolution of Top Incomes: A Historical and International Perspective." American
Economic Review 9:200-05.
Piketty, Thomas, Emmanuel Saez, and Stefanie Stantcheva. Forthcoming. "Optimal Taxation of Top
Labor Incomes: A Tale of Three Elasticities." American Economic Journal: Economic Policy.
Piketty, Thomas, and Gabriel Zucman. 2014. "Wealth and Inheritance in the Long Run." Paris
School of Economics Working Paper.
Reich, MIchael. 1972. "Economic Theories of Racism." in Schooling in Corporate Society, edited by
Martin Carnoy. New York: David McKay Company.
Schumpeter, Joseph A. 1934. The Theory of Economic Development: An Inquiry into Profits,
Capital, Credit, Interest, and the Business Cycle. Cambridge, MA: Harvard University Press.
Sewell, William H., Archibald O. Haller, and George W. Ohlendorf. 1970. "The Educational and
Early Occupational Status Attainment Process: Replication and Revision." American
Sociological Review 35:1014-27.
Sewell, William H., and Robert M. Hauser. 1972. "Causes and Consequences of Higher Education:
Models of the Status Attainment Process." American Journal of Agricultural Economics
54:651-61.
—. 1975. Education, Occupation, and Earnings: Achievement in the Early Career. New York:
Academic Press.
Sharlet, Jeff. 2011. "Inside Occupy Wall Street." Rolling Stone
http://www.rollingstone.com/politics/news/occupy-wall-street-welcome-to-the-occupation-20111110.
Skopek, Nora, Sandra Buchholz, and Hans-Peter Blossfeld. 2014. "National Patterns of Income and
Wealth Inequality." International Journal of Comparative Sociology 55:463-88.

50
Smeeding, Timothy M., Jeffrey P. Thompson, Asaf Levanon, and Esra Burak. 2011. "Poverty and
Income Inequality in the Early Stages of the Great Recession." Pp. 82-126 in The Great
Recession, edited by David B. Grusky, Bruce Western, and Christopher Wimer. New York:
Russell Sage.
Sorensen, Aage B. 1979. "A Model and a Metric for the Analysis of the Intragenerational Status
Attainment Process." American Journal of Sociology 85:361-84.
Spilerman, Seymour. 2000. "Wealth and Stratification Processes." Annual Review of Sociology
26:497-524.
Spilerman, Seymour, and Francois-Charles Wolff. 2012. "Parental Wealth and Resource Transfers:
How They Matter in France for Home Ownership and Living Standards." Social Science
Research 41:207-23.
Stigletz, Joseph. 2011. "Of the 1%, by the 1%, for the 1%." Vanity Fair
http://www.vanityfair.com/news/2011/05/top-one-percent-201105.
Treiman, Donald J., and Kermit Terrell. 1975. "The Process of Status Attainment in the United States
and Great Britain." American Journal of Sociology 81:563-83.
Volscho, Thomas W., and Nathan J. Kelly. 2012. "The Rise of the Super-Rich: Power Resources,
Taxes, Financial Markets, and the Dynamics of the Top 1 Percent, 1949 to 2008." American
Sociological Review 77:679-99.
Warren, John Robert, and Robert Hauser. 1997. "Social Stratification across Three Generations: New
Evidence from the Wisconsin Longitudinal Study." American Sociological Review 62:561-72.
Warren, John Robert, Laurie Knies, Steven Haas, and Elaine Hernandez. 2012. "The Impact of
Childhood Sickness on Adult Socioeconomic Outcomes: Evidence from Late 19th Century
America." Social Science & Medicine 75:1531-38.

51
Weber, Max. 1968. Economy and Society: An Outline of Interpretive Sociology. New York:
Bedminster Press.
— (Ed.). 1978. Economy and Society: An Outline of Interpretive Sociology. Berkeley: University of
California.
Wolff, Edward N. 2002. "Inheritances and Wealth Inequality Trends, 1989-1998." American
Economic Review 92:260-64.
Wolff, Edward N., and Maury Gittleman. 2011. "Inheritances and the Distribution of Wealth or
Whatever Happened to the Great Inheritance Boom? Results from the SCF and PSID." NBER
Working Paper.
Wolff, Edward N., Lindsay A. Owens, and Esra Burak. 2011. "How Much Wealth Was Destroyed in
the Great Recession?" Pp. 127-58 in The Great Recession, edited by David B. Grusky, Bruce
Western, and Christopher Wimer. New York: Russell Sage.
Wolff, Edward N., and Ajit Zacharias. 2009. "Household Wealth and the Measurement of Economic
Well-Being in the United States." The Journal of Economic Inequality 7:83-115.
Wooldridge, Jeffrey. 2002. Econometric Analysis of Cross Section and Panel Data. Cambridge, MA:
MIT Press.
Yellen, Janet L. 2014. "Perspectives on Inequality and Opportunity from the Survey of Consumer
Finances." in Conference on Economic Opportunity and Inequality. Federal Reserve Bank of
Boston, Boston, MA, http://www.federalreserve.gov/newsevents/speech/yellen20141017a.htm#f42.
Zetterberg, Hans L. 1991. "Introduction." in The Rise and Fall of Elites: An Application of
Theoretical Sociology by Vilfredo Pareto. New Brunswick, NJ: Transaction.
Zweigenhaft, Richard L., and G. William Domhoff. 2003. Blacks in the White Elite: Will the
Progress Continue? Lanham, MD: Rowman and Littlefield.

52
—. 2006. Diversity in the Power Elite: Have Women and Minorities Reached the Top? New Haven,
CT: Yale University Press.
—. 2014. The New CEOs: Women, African American, Latino, and Asian American Leaders of
Fortune 500 Companies. Lanham, MD: Rowman and Littlefield.

53
Table 1. Financial Profiles for Three Top Groups, 1989–2010
Notes: Data are from the Survey of Consumer Finances. ―Overall‖ includes all years, pooled to create a single data set.
1989 1992 1995 1998 2001 2004 2007 2010 Overall
Income threshold 411,702 343,546 358,259 476,083 629,882 561,328 726,169 614,987 343,546
Median income 791,735 699,528 786,139 1,114,467 1,146,385 1,165,200 1,575,055 1,158,819 1,007,811
% total income 12.10 6.65 9.99 10.15 11.94 12.25 14.42 10.52 11.37
Net worth threshold 3,919,764 3,523,039 3,491,267 5,071,746 7,194,167 7,313,504 8,793,817 6,821,700 3,491,267
Median net worth 8,122,885 6,520,427 7,598,782 10,548,518 13,156,721 12,622,582 15,599,492 12,065,000 11,155,581
% total net worth 18.59 16.94 20.51 19.30 18.04 22.26 21.60 19.61 20.05
Income threshold 411,702 343,546 356,808 476,083 629,882 561,328 727,247 614,987 343,546
Median income 541,898 446,143 413,376 608,629 975,057 712,592 1,005,217 791,860 719,325
% total income 5.01 5.09 4.36 6.33 8.23 4.69 6.82 6.66 6.07
Net worth threshold -35,845,453 -1,668 -20,462,054 -20,224,673 -3,953,388 612,028 819,915 175,551 -35,845,453
Median net worth 2,005,000 1,726,802 1,416,052 1,655,355 3,498,485 3,570,453 4,867,841 3,969,800 2,493,036
% total net worth 3.18 3.45 2.41 3.12 4.06 3.48 4.36 4.22 3.71
Income threshold 26,391 0 0 0 0 0 0 0 0
Median income 226,964 186,541 191,458 250,214 322,500 313,162 284,434 308,002 248,861
% total income 1.61 1.77 1.61 2.05 2.06 1.70 1.95 1.98 1.85
Net worth threshold 3,921,266 3,522,433 3,484,185 5,071,174 7,189,081 7,314,079 8,773,849 6,816,200 3,484,185
Median net worth 5,565,931 5,016,518 5,893,882 7,223,002 10,004,965 10,267,153 10,830,195 10,922,000 8,890,414
% total net worth 11.35 13.09 14.33 14.55 13.98 11.08 11.93 14.50 12.95
Top 1% both
income & net worth
Top 1% net worth
Top 1% income
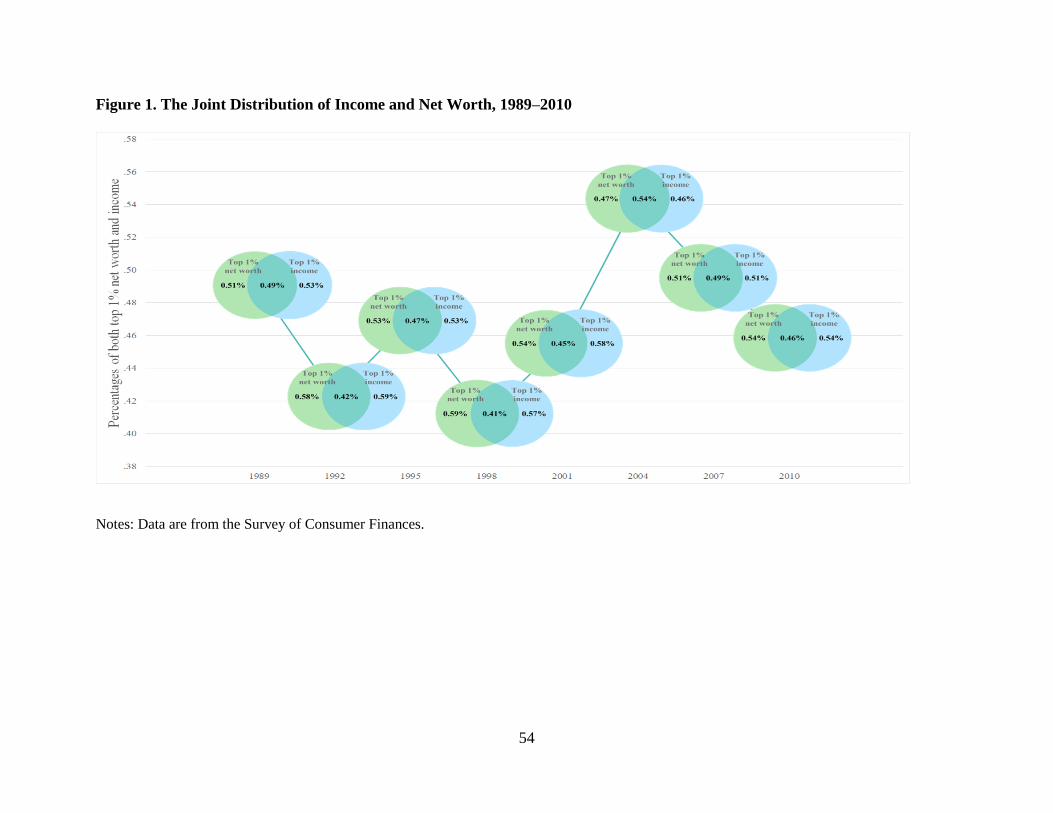
54
Figure 1. The Joint Distribution of Income and Net Worth, 1989–2010
Notes: Data are from the Survey of Consumer Finances.

55
Table 2
a. The Distribution of Top Capital Earners Across Top Three Groups
1989 1992 1995 1998 2001 2004 2007 2010
Top income only 13.45 9.68 4.59 13.49 11.01 12.28 12.97 8.76
Top net worth only 9.08 20.42 19.83 16.31 15.42 13.42 8.83 19.43
Top of both 26.96 23.98 22.37 26.99 27.43 30.64 31.13 26.3
No top group 50.5 45.93 53.22 43.21 46.14 43.66 44.07 45.5
Notes: Cells are the location in our top three groups of those whose capital income puts them in the top one percent
of capital earners. For example, 13.45% of those who have capital income in the top one percent of capital income
earners are in the top income only group in 1989.
b. The Distribution of Top Wage Income Earners Across Top Three Groups
1989 1992 1995 1998 2001 2004 2007 2010
Top income only 27.24 23.10 32.16 21.03 38.88 27.89 30.97 37.50
Top net worth only 1.59 2.67 1.92 6.06 8.36 6.33 2.34 4.27
Top of both 20.92 21.96 18.7 20.37 26.96 29.98 22.23 20.05
No top group 50.25 52.27 47.22 52.54 25.79 35.8 44.47 38.18
Notes: Cells are the location in our top three groups of those whose wage income puts them in the top one percent of
wage income earners. For example, 27.24% of those who have wage income in the top one percent of wage income
earners are in the top income only group in 1989.
c. The Distribution of Top Income Earners (Various Sources) Across Top Three Groups
Top income Top net worth Top of both
Top wage income 43.7 5.8 16.9
Top business income 19.3 16.6 13.8
Top capital income 7.4 23.7 18.1
Top wage and business income 5.8 0.4 6.8
Top wage and capital income 6.7 1.6 19.1
Top business and capital income 5.2 3.3 15.4
Top wage, business and capital income 1.1 0.4 6.8
No top income 10.8 48.2 3.1
Notes: Cells are the location in our top three groups of those whose income from various sources puts them in the
top one percent of earners. For example, 43.7% of those who have wage income in the top one percent of wage
income earners are in the top income only group in the combined 1989–2010 SCF.

56
Table 3. Demographic Profiles of Top Three Groups
Notes: Data are from the Survey of Consumer Finances, pooled over 1989–2010. Median inheritance for all
respondents is zero.
Top 1% income Top 1% net worth Top of both Everyone else
Inheritance
Ever inherited 30.72 45.02 41.64 20.25
Average amount inherited, all respondents 168,501 932,509 1,162,147 33,904
Average amount inherited, those who inherited 548,569 2,071,239 2,790,794 167,467
Median amount inherited, those who inherited 190,117 548,640 333,680 48,818
Education (mean years) 16.02 15.45 16.05 13.03
Employment
Self-employed 47.03 50.81 58.15 10.5
Work for someone else 45.09 18.63 28.12 58.89
Retired 6.39 29.12 13.09 24.78
Unemployment/ not in labor force 1.48 1.43 0.64 5.83
Occupation
Managerial/professional 79.09 54.76 73.41 24.31
Technical/sales/services 12.15 10.87 10.73 22.87
Other 0.88 3.82 2.13 22.21
Not working 7.88 30.56 13.73 30.61
Male 97.74 93.11 97.37 71.86
Age
Mean age 50.67 60.39 57.11 49.04
Age categories
< 35 4.45 2.58 1.16 23.83
35 - 44 26.81 7.68 12.29 21.37
45 - 54 36.75 22.95 29.70 18.96
55 - 64 22.00 28.64 33.29 14.32
65 - 74 6.78 24.78 17.38 11.33
≥ 75 3.22 13.37 6.18 10.18
Race/ethnicity
White non-Hispanic 91.30 92.13 95.22 74.60
Black / African American 1.40 1.07 0.75 13.09
Hispanic 3.46 1.86 0.84 8.39
Other 3.84 4.94 3.19 3.92
Marital status
Currently married 91.12 82.54 91.09 58.04

57
Figure 2. Inheritance and Membership in the One Percent
Notes: Data are from the Survey of Consumer Finances, pooled over 1989–2010. Top income indicates members of
the top one percent of income earners only, top net worth indicates members of the top one percent of net worth
owners only, and top income and net worth indicates those in the top one percent of both distributions. The
horizontal axis is the percentile for amounts inherited; for example, p99 represents those whose total inheritance
received places them in the top one percent of inheritors.

58
Table 4. Top Income, Top Net Worth, or Both? Multinomial Probit Estimates, 1989–2010
Top income Top net worth Top income & net worth Model 1 Model 2 Model 1 Model 2 Model 1 Model 2
Inheritance (ref = non-inheritors) Top 1% inheritors .480** 1.452** 1.227**
(.089) (.050) (.042)
Next 9% inheritors .094* .095* .223** .218** .112** .108**
(.039) (.039) (.032) (.033) (.032) (.032)
Remaining inheritors -.358** -.356** -.424** -.434** -.437** -.442**
(.056) (.056) (.052) (.052) (.048) (.048)
Education (ref=less than college degree) Graduate degree 1.118** .765** 1.103**
(.044) (.034) (.031)
College degree .799** .792** .725** .713** .959** .959**
(.042) (.042) (.031) (.032) (.030) (.031)
Employment status (ref=not working) Self-employed .372** .539** .732**
(.093) (.097) (.106)
Work for others -.402** -.388** -.629** -.670** -.316** -.326**
(.092) (.092) (.097) (.100) (.106) (.107)
Retired -.216* -.220* .000 -.013 .051 .051
(.101) (.101) (.097) (.099) (.107) (.108)
Interactions Top 1% inheritor .713** 1.762** 1.512**
(.123) (.086) (.073)
Graduate degree 1.044** .939** 1.198**
(.054) (.042) (.042)
Self-employed .318** .668** .819**
(.095) (.098) (.106)
Top 1% inheritor & graduate school degree 1.685** 2.392** 2.371**
(.197) (.085) (.075)
Top 1% inheritor & self-employed .441* 1.963** 1.856**
(.195) (.128) (.128)
Graduate school degree & self-employed 1.524** 1.274** 1.840**
(.105) (.108) (.112)
Top 1% inheritor, grad. degree, & self-employed 1.695** 2.202** 2.862**
(.164) (.144) (.139)
Control variables Gender (male = 1) .692** .693** .509** .508** .660** .660**
(.079) (.079) (.052) (.052) (.057) (.057)
Age .121** .121** .094** .096** .170** .170**
(.009) (.009) (.008) (.008) (.007) (.007)
Age2 -.001** -.001** -.001** -.001** -.001** -.001**
(.000) (.000) (.000) (.000) (.000) (.000)
Race (white = 1) .338** .335** .290** .291** .543** .544**
(.056) (.056) (.044) (.044) (.044) (.044)
Marital status (currently married = 1) .511** .516** .279** .276** .502** .501**
(.052) (.052) (.037) (.037) (.043) (.043)
Occupation (managerial/professional =1) .701** .702** .574** .592** .695** .698**
(.044) (.044) (.036) (.036) (.033) (.032)
Survey year
1992 -.047 -.050 .010 .005 -.167** -.169**
(.070) (.070) (.057) (.057) (.055) (.056)
1995 .028 .023 .020 .027 -.014 -.011
(.075) (.074) (.053) (.053) (.051) (.052)
1998 -.048 -.052 -.002 -.002 -.219** -.220**
(.074) (.073) (.056) (.056) (.052) (.053)
(continued)

59
(Table 4, continued)
2001 -.161* -.161* -.152** -.157** -.296** -.299** (.071) (.071) (.055) (.055) (.055) (.055)
2004 -.284** -.282** -.241** -.251** -.219** -.223**
(.071) (.071) (.056) (.056) (.051) (.052)
2007 -.178** -.181** -.148** -.149** -.205** -.203**
(.067) (.067) (.057) (.057) (.052) (.052)
2010 -.199** -.199** -.192** -.198** -.315** -.317**
(.068) (.068) (.054) (.054) (.053) (.053)
Constant -8.650** -8.636** -8.086** -8.181** -11.041** -11.094** (.271) (.272) (.285) (.284) (.239) (.239)
LL -12615.0 -12586.6 -12615.0 -12586.6 -12615.0 -12586.6 BIC 26027.7 26116.0 26027.7 26116.0 26027.7 26116.0
Notes: Data are from the Survey of Consumer Finances, pooled over 1989–2010. Estimates are from a single
multinomial probit model in which the dependent variable has three mutually exclusive categories: membership in
the top one percent by income only, the top one percent by net worth only, or the top one percent of both
distributions. Robust standard errors are shown in parentheses; n = 177,565.
** p<.01, * p<.05.
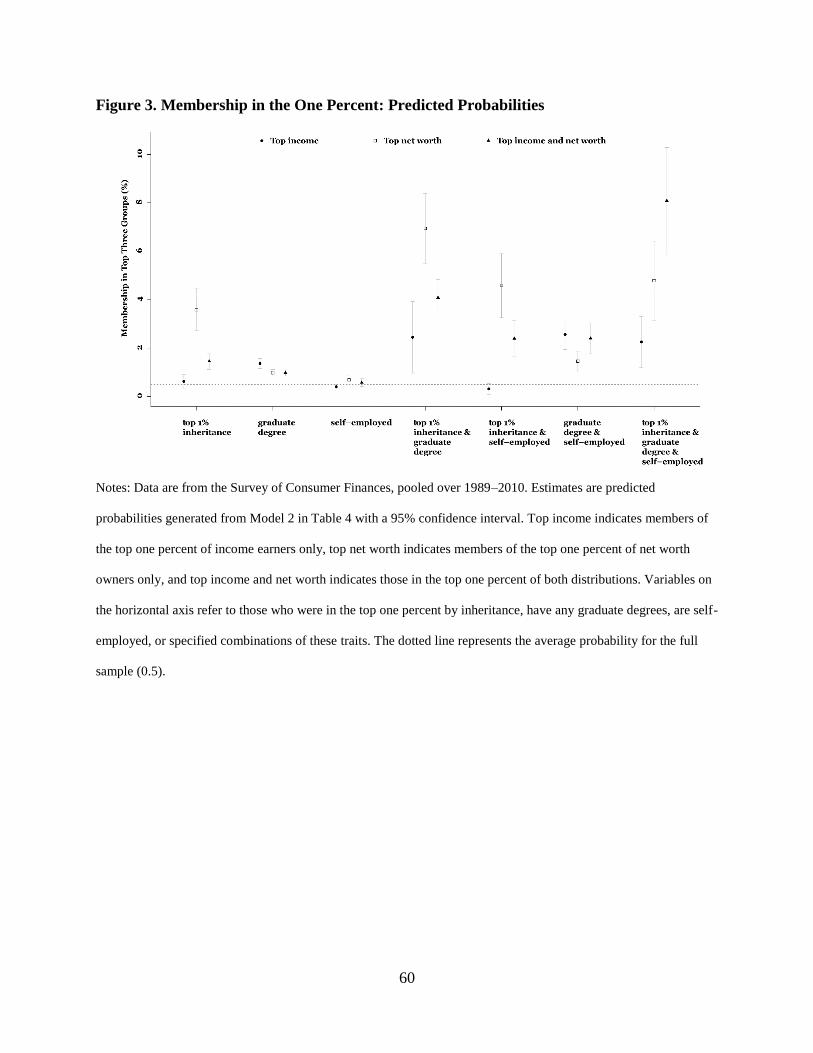
60
Figure 3. Membership in the One Percent: Predicted Probabilities
Notes: Data are from the Survey of Consumer Finances, pooled over 1989–2010. Estimates are predicted
probabilities generated from Model 2 in Table 4 with a 95% confidence interval. Top income indicates members of
the top one percent of income earners only, top net worth indicates members of the top one percent of net worth
owners only, and top income and net worth indicates those in the top one percent of both distributions. Variables on
the horizontal axis refer to those who were in the top one percent by inheritance, have any graduate degrees, are self-
employed, or specified combinations of these traits. The dotted line represents the average probability for the full
sample (0.5).

61
Appendix Table A
Notes: Data are from the Survey of Consumer Finances. Care should be taken in estimating percentages owned by using information from this
table and Table 2. For example, some households that are classified as top 0.5 percent in this table might be in the top of both distributions in
Table 2. For example, it is not possible to calculate the percentage held by the top 0.5% and the ―next‖ 0.5% by subtracting values taken from both
tables.
1989 1992 1995 1998 2001 2004 2007 2010 Overall
Income threshold 619,312 512,987 517,807 689,779 1,074,579 840,220 1,131,273 940,270 512,987
Median income 1,055,646 763,262 897,823 1,165,862 1,461,326 1,335,371 1,950,099 1,311,295 1,232,549
% total income 13.45 8.35 11.20 12.65 15.31 12.99 16.27 12.47 13.18
Net worth threshold -35,800,000 2,274 -20,500,000 -20,200,000 301,439 1,068,490 1,018,556 1,034,500 -35,845,453
Median net worth 4,857,540 4,030,315 5,153,479 6,580,068 6,760,303 10,300,000 12,500,000 8,738,800 7,649,000
% total net worth 14.93 14.58 18.07 17.14 13.48 18.44 19.23 17.46 16.97
Income threshold 26,391 0 0 0 0 0 0 0 0
Median income 462,725 379,299 381,466 463,910 655,077 740,954 1,185,143 680,044 592,571
% total income 9.80 5.82 8.38 8.41 8.78 9.92 11.95 8.08 9.10
Net worth threshold 6,252,598 5,494,231 6,379,176 7,848,596 11,000,000 11,000,000 12,500,000 11,200,000 5,494,231
Median net worth 9,717,946 7,933,569 10,600,000 12,600,000 16,100,000 16,300,000 18,300,000 16,100,000 14,286,531
% total net worth 22.68 22.57 27.27 25.54 23.27 24.47 24.79 25.37 24.56
Top .5% income
Top .5% net worth