Embed Size (px)
Citation preview
Liquid State Physics of the MgO-SiO2 System at
Deep Mantle Pressures
by
Nico Pieter Jan de Koker
A dissertation submitted in partial fulfillmentof the requirements for the degree of
Doctor of Philosophy(Geology)
in The University of Michigan2008
Doctoral Committee:
Professor Lars P. Stixrude, Co-chairpersonProfessor Rebecca A. Lange, Co-chairpersonProfessor John KiefferProfessor Larry J. RuffAssociate Professor Udo Becker
c© Nico Pieter Jan de Koker 2008All Rights Reserved
To Johan, Verelene and Estelle
ii
ACKNOWLEDGEMENTS
Most importantly, my sincere gratitude to Lars Stixrude. I feel truly privileged
to have had the opportunity to work under his guidance. He always challenged me,
while affording me the freedom to explore and experiment. I continue to be inspired
by the depth and breadth of his knowledge and skill, and the clarity with which he
willingly shares this with students.
I am deeply grateful to my MSc advisor, Carolina Lithgow-Bertelloni, who self-
lessly encouraged me as I became increasingly fascinated by mineral physics. I wish
her and Lars the greatest success and happiness in London.
Discussions with Larry Ruff, Udo Becker and Becky Lange invariably deepened
my insight and broadened my perspective. I’d like to thank Becky for stepping in
as co-chair when the need arose. I also appreciate the willingness of John Kieffer in
Material Science and Engineering to serve as cognate member of my committee.
I further wish to acknowledge the help and support of my collaborators, Bijaya
Karki at LSU, Stephen Stackhouse, Mainak Mookherjee and Ni Sun. Bijaya gave
valuable input on the manuscripts presented in Chapters II and IV.
Finally, I would not have ventured abroad without the encouragement and sincere
interest shown by Lew Ashwal, Chris Engelbrecht and Sue Webb. This dissertation
is a confluence of the interests in petrology, condensed matter physics and global
geophysics they instilled in me as an undergraduate.
iii
TABLE OF CONTENTS
DEDICATION . . . . . . . . . . . . . . . . . . . . . . . . . . . . . . . . . . . . . . . . . . ii
ACKNOWLEDGEMENTS . . . . . . . . . . . . . . . . . . . . . . . . . . . . . . . . . . iii
LIST OF FIGURES . . . . . . . . . . . . . . . . . . . . . . . . . . . . . . . . . . . . . . vi
LIST OF TABLES . . . . . . . . . . . . . . . . . . . . . . . . . . . . . . . . . . . . . . . viii
LIST OF APPENDICES . . . . . . . . . . . . . . . . . . . . . . . . . . . . . . . . . . . ix
CHAPTER
I. Introduction . . . . . . . . . . . . . . . . . . . . . . . . . . . . . . . . . . . . . . . 1
II. Thermodynamics, Structure, Dynamics, and Freezing of Mg2SiO4 Liquidat High Pressure . . . . . . . . . . . . . . . . . . . . . . . . . . . . . . . . . . . . 8
2.1 Abstract . . . . . . . . . . . . . . . . . . . . . . . . . . . . . . . . . . . . . . 82.2 Introduction . . . . . . . . . . . . . . . . . . . . . . . . . . . . . . . . . . . . 92.3 Computational Technique . . . . . . . . . . . . . . . . . . . . . . . . . . . . . 112.4 Results . . . . . . . . . . . . . . . . . . . . . . . . . . . . . . . . . . . . . . . 17
2.4.1 Equation of State . . . . . . . . . . . . . . . . . . . . . . . . . . . . 172.4.2 Melting Curve . . . . . . . . . . . . . . . . . . . . . . . . . . . . . . 182.4.3 Mg2SiO4 Hugoniot . . . . . . . . . . . . . . . . . . . . . . . . . . 192.4.4 Liquid Structure . . . . . . . . . . . . . . . . . . . . . . . . . . . . 202.4.5 Transport Properties . . . . . . . . . . . . . . . . . . . . . . . . . . 22
2.5 Discussion . . . . . . . . . . . . . . . . . . . . . . . . . . . . . . . . . . . . . 232.6 Conclusions . . . . . . . . . . . . . . . . . . . . . . . . . . . . . . . . . . . . 282.7 Acknowledgements . . . . . . . . . . . . . . . . . . . . . . . . . . . . . . . . 29
III. Self-Consistent Thermodynamic Description of Silicate Liquids, with Ap-plication to Shock Melting of MgO Periclase and MgSiO3 Perovskite . . . . 48
3.1 Abstract . . . . . . . . . . . . . . . . . . . . . . . . . . . . . . . . . . . . . . 483.2 Introduction . . . . . . . . . . . . . . . . . . . . . . . . . . . . . . . . . . . . 493.3 Previous Work . . . . . . . . . . . . . . . . . . . . . . . . . . . . . . . . . . . 503.4 Fundamental Thermodynamic Relations . . . . . . . . . . . . . . . . . . . . 52
3.4.1 Liquids . . . . . . . . . . . . . . . . . . . . . . . . . . . . . . . . . . 543.4.2 Solids at High Temperature . . . . . . . . . . . . . . . . . . . . . . 57
3.5 First Principles Molecular Dynamics Simulations . . . . . . . . . . . . . . . . 593.6 Results . . . . . . . . . . . . . . . . . . . . . . . . . . . . . . . . . . . . . . . 62
3.6.1 Liquids . . . . . . . . . . . . . . . . . . . . . . . . . . . . . . . . . . 623.6.2 Solids . . . . . . . . . . . . . . . . . . . . . . . . . . . . . . . . . . 64
iv
3.7 Applications . . . . . . . . . . . . . . . . . . . . . . . . . . . . . . . . . . . . 643.8 Discussion . . . . . . . . . . . . . . . . . . . . . . . . . . . . . . . . . . . . . 673.9 Conclusion . . . . . . . . . . . . . . . . . . . . . . . . . . . . . . . . . . . . . 713.10 Acknowledgements . . . . . . . . . . . . . . . . . . . . . . . . . . . . . . . . 72
IV. Structure and Mixing of Liquids on the MgO − SiO2 Join and the Originof Liquid Immiscibility . . . . . . . . . . . . . . . . . . . . . . . . . . . . . . . . . 94
4.1 Abstract . . . . . . . . . . . . . . . . . . . . . . . . . . . . . . . . . . . . . . 944.2 Manuscript . . . . . . . . . . . . . . . . . . . . . . . . . . . . . . . . . . . . . 954.3 Acknowledgements . . . . . . . . . . . . . . . . . . . . . . . . . . . . . . . . 99
V. Conclusion . . . . . . . . . . . . . . . . . . . . . . . . . . . . . . . . . . . . . . . . 106
APPENDICES . . . . . . . . . . . . . . . . . . . . . . . . . . . . . . . . . . . . . . . . . . 110
BIBLIOGRAPHY . . . . . . . . . . . . . . . . . . . . . . . . . . . . . . . . . . . . . . . . 118
v
LIST OF FIGURES
Figure
1.1 Ambient pressure phase diagram of the MgO-SiO2 join . . . . . . . . . . . . . . . . 72.1 Snapshots of the simulated liquid at 3000 K, for V/VX = 1.0 and V/VX = 0.5 . . . 352.2 Equation of state of liquid Mg2SiO4 . . . . . . . . . . . . . . . . . . . . . . . . . . 362.3 (a) Isochoric heat capacity (CV ) and (b) Gruneisen parameter (γ) of liquid (red
circles) and forsterite (green squares) as a function of volume . . . . . . . . . . . . 372.4 First principles melting curve for forsterite . . . . . . . . . . . . . . . . . . . . . . . 382.5 Density contrast expected during incongruent melting of forsterite . . . . . . . . . 392.6 Theoretical Hugoniot for Mg2SiO4 liquid . . . . . . . . . . . . . . . . . . . . . . . . 412.7 (a) Si-O and Mg-O coordination, and (b) Si-O bond lengths as a function of volume 422.8 Polymerization state of the liquid as a function of volume, at 3000 K and 6000 K,
as expressed by the abundance of [Z]SiOB species . . . . . . . . . . . . . . . . . . . 432.9 Free and bridging oxygen abundance as a function of Si-O coordination . . . . . . 442.10 Time series of atomic movement within a 3.5 A sphere relative to a reference silicon
atom, illustrating dynamic speciation changes . . . . . . . . . . . . . . . . . . . . . 452.11 Mean square displacement as a function of time . . . . . . . . . . . . . . . . . . . . 462.12 Self-diffusion coefficient (DN ) of Mg2SiO4 liquid, fit with an Arrhenius relation
(equation 2.19) . . . . . . . . . . . . . . . . . . . . . . . . . . . . . . . . . . . . . . 473.1 Pressure (P ), internal energy (E) and thermal electronic entropy (Sel) of MgO liquid 813.2 Pressure (P ), internal energy (E) and thermal electronic entropy (Sel) of Mg2SiO4
liquid . . . . . . . . . . . . . . . . . . . . . . . . . . . . . . . . . . . . . . . . . . . . 823.3 Pressure (P ), internal energy (E) and thermal electronic entropy (Sel) of MgSiO3
liquid . . . . . . . . . . . . . . . . . . . . . . . . . . . . . . . . . . . . . . . . . . . . 833.4 Pressure (P ), internal energy (E) and thermal electronic entropy (Sel) of SiO2 liquid 843.5 Gruneisen parameter (γ) and isochoric heat capacity (CV ) for the respective liquid
compositions . . . . . . . . . . . . . . . . . . . . . . . . . . . . . . . . . . . . . . . 863.6 Thermodynamics of vaporization in Mg2SiO4 liquid . . . . . . . . . . . . . . . . . . 873.7 Pressure (P ) and internal energy (E) of MgO periclase . . . . . . . . . . . . . . . . 883.8 Pressure (P ) and internal energy (E) of MgSiO3 perovskite . . . . . . . . . . . . . 893.9 Shock melting of MgO periclase . . . . . . . . . . . . . . . . . . . . . . . . . . . . . 913.10 Shock melting of MgSiO3 perovskite . . . . . . . . . . . . . . . . . . . . . . . . . . 934.1 Silicon (ZSi−O) coordination and Gruneisen parameter (γ) along the MgO-SiO2 join1024.2 The distribution of oxygen species at 6000 K and 136 GPa (top), and 3000 K and
0 GPa (bottom) . . . . . . . . . . . . . . . . . . . . . . . . . . . . . . . . . . . . . . 1034.3 Liquid density along the MgO-SiO2 join . . . . . . . . . . . . . . . . . . . . . . . . 1044.4 Enthalpy and volume of mixing along the MgO-SiO2 join . . . . . . . . . . . . . . 105B.1 Pressure (P ), internal energy (E) and thermal electronic entropy (Sel) of Mg5SiO7
liquid . . . . . . . . . . . . . . . . . . . . . . . . . . . . . . . . . . . . . . . . . . . . 114B.2 Pressure (P ), internal energy (E) and thermal electronic entropy (Sel) of Mg3Si2O7
liquid . . . . . . . . . . . . . . . . . . . . . . . . . . . . . . . . . . . . . . . . . . . . 115B.3 Pressure (P ), internal energy (E) and thermal electronic entropy (Sel) of MgSi2O5
liquid . . . . . . . . . . . . . . . . . . . . . . . . . . . . . . . . . . . . . . . . . . . . 116
vi
B.4 Pressure (P ), internal energy (E) and thermal electronic entropy (Sel) of MgSi3O7
liquid . . . . . . . . . . . . . . . . . . . . . . . . . . . . . . . . . . . . . . . . . . . . 117
vii
LIST OF TABLES
Table
2.1 Equation of state fit parameters for equations 2.4-2.13 . . . . . . . . . . . . . . . . 302.2 Comparison of liquid equation of state to experimental data at 2163 K, 0 GPa . . . 312.3 Comparison of crystalline equation of state with experimental values computed
from the model of Stixrude and Karki (2005) at 1000 K, 0 GPa . . . . . . . . . . . 322.4 Comparison of simulated liquid structure to experimental data (Kohara et al., 2004) 332.5 Self-diffusion coefficient Arrhenius relation fit parameters (equation 2.19) . . . . . . 343.1 Limiting behavior of excess thermodynamic properties, and values of n and m
required for these limits to hold . . . . . . . . . . . . . . . . . . . . . . . . . . . . . 733.2 m values used in liquids Fxs fits . . . . . . . . . . . . . . . . . . . . . . . . . . . . 743.3 Thermodynamic properties of FPMD MgO liquid at 0 GPa, 3000 K . . . . . . . . 753.4 Thermodynamic properties of FPMD Mg2SiO4 liquid at 0 GPa, 1773 K . . . . . . 763.5 Thermodynamic properties of FPMD MgSiO3 liquid at 0 GPa, 1773 K . . . . . . . 773.6 Thermodynamic properties of FPMD SiO2 liquid at 0 GPa, 3000 K . . . . . . . . . 783.7 Thermodynamic properties of FPMD MgO periclase at 0 GPa, 2000 K . . . . . . . 793.8 Thermodynamic properties of FPMD MgSiO3 perovskite at 0 GPa, 2000 K . . . . 804.1 Thermodynamic properties of mixed liquids on the MgO-SiO2 join at 0 GPa, 3000 K 1004.2 Interaction parameters for Hmix obtained from fit of Equation 4.2 . . . . . . . . . 101
viii
LIST OF APPENDICES
Appendix
A. Fxs coefficients . . . . . . . . . . . . . . . . . . . . . . . . . . . . . . . . . . . . . . . . 111
B. Equations of state for intermediate composition liquids . . . . . . . . . . . . . . . . . 114
ix
CHAPTER I
Introduction
The chemical history of a terrestrial planet such as Earth is intimately tied to its
thermal history through fractionation processes associated with cooling of a magma
ocean and partial melting of a solid mantle. Sufficient energy sources have been iden-
tified for the planet to have been entirely molten during the late stages of accretion
(Urey, 1955; Tonks and Melosh, 1993; Ruff and Anderson, 1980; Hanks and Ander-
son, 1969). Seismic observations suggest the presence of partial melt atop the 410 km
discontinuity, (Revenaugh and Sipkin, 1994; Song et al., 1994) and at the base of
the mantle (Williams and Garnero, 1996; Revenaugh and Meyer, 1997; Garnero and
Helmberger, 1995). Also, while decompression melting at mid-ocean ridges occurs at
depths of 50 − 200 km (McKenzie and Bickle, 1988; Asimow et al., 1995), evidence
from xenoliths suggests that melt has reached the surface from significantly greater
depths (Haggerty and Sautter, 1990; Collerson et al., 2000). Despite this variety of
planetary settings where melts play a role, the physics of the liquid phase over the
pressure and temperature range relevant to these settings is not well understood.
Of especial interest are the transport and thermodynamic properties, and how these
relate to the characteristics of liquid structure. Accurate estimates of freezing tem-
peratures can therefore provide key constraints on the composition, thermal profile,
1
2
dynamics and evolution of the mantle.
The goal of this dissertation is to apply state of the art theoretical methods to
elucidate the properties of silicate liquids at pressures and temperatures relevant to
the entire extent of the Earth’s mantle. First principles methods describe the system
directly in terms of the charge density by means of the Hohenberg-Kohn theorem
and density functional theory (Hohenberg and Kohn, 1964; Kohn and Sham, 1965,
DFT). The method is independent of experimental input, and the underlying theory
is equally valid at ambient as well as very high pressure. It has been successfully
applied to solids at high pressure (Karki et al., 2001; Stixrude, 2001; Oganov et al.,
2001b), and has recently been used to simulate silicate liquids at pressures and
temperatures relevant to the entire extent of Earth’s mantle (Stixrude and Karki,
2005; Karki et al., 2007; Wan et al., 2007; Trave et al., 2002).
Reasons for focussing on liquids in the MgO-SiO2 system are as follows. Firstly,
MgO and SiO2 are the two most abundant oxide components in the mantle, and
account for a dominant fraction of the composition of a terrestrial magma ocean
after core-mantle segregation. Secondly, the system has relatively few valence elec-
trons, enabling extensive investigation of compositional space via computationally
intensive first principles molecular dynamics (FPMD) simulations. Finally, the re-
fractive nature of forsterite and periclase has limited the liquid compositions that
have been studied experimentally. Our calculations can therefore test the existing
extrapolations by which their properties are currently estimated.
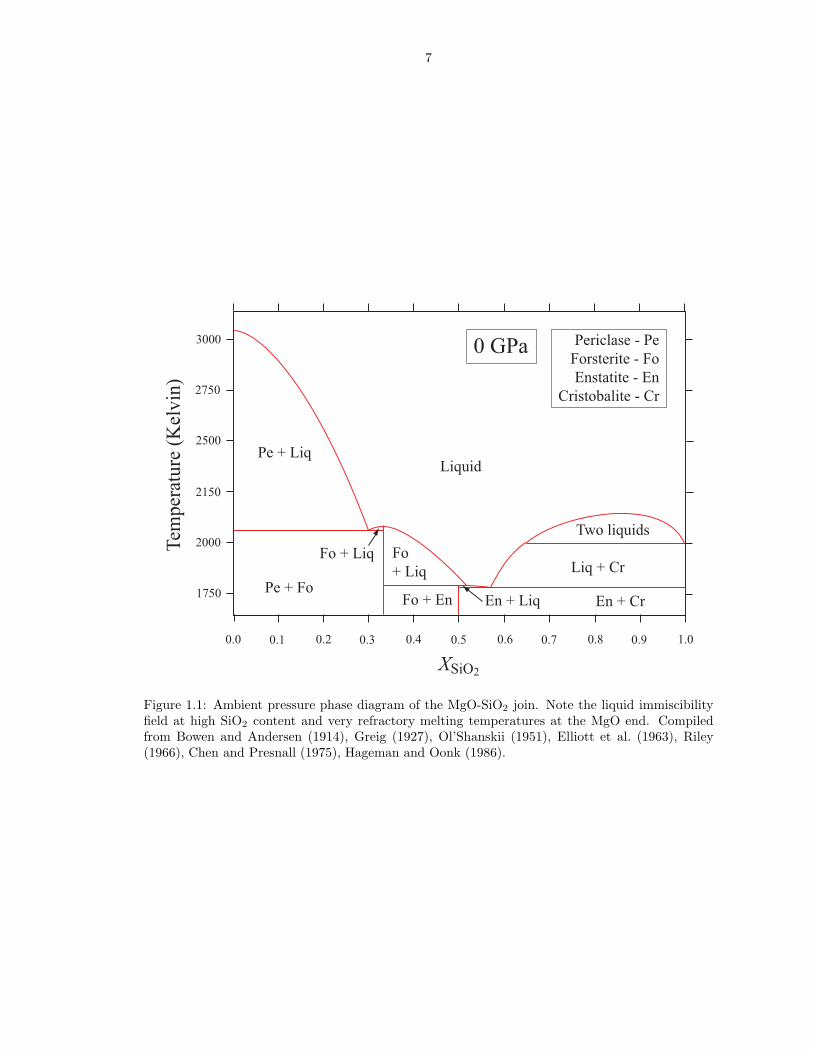
The MgO-SiO2 phase diagram at ambient pressure (Figure 1.1) is experimentally
well constrained (Bowen and Andersen, 1914; Greig, 1927; Ol’Shanskii, 1951; El-
liott et al., 1963; Riley, 1966; Chen and Presnall, 1975; Hageman and Oonk, 1986).
Melts are by their very nature high temperature phenomena, the experimental study
3
of which pose non-trivial technical challenges even at ambient pressure. Partial
molar models based on extensive measurement of liquid state density (Lange and
Carmichael, 1987; Lange, 1997), heat capacity (Stebbins et al., 1984; Lange and
Navrotsky, 1992) and sound speed (Rivers and Carmichael, 1987; Ai and Lange,
2008) at ambient pressures continue to serve as the foundation for the thermody-
namic investigation of silicate liquids. With higher pressure, static experiments are
limited by progressively smaller sample sizes. Piston cylinder and multi anvil experi-
ments have nonetheless elucidated upper mantle melting phase relations (Boyd et al.,
1964; Davis and England, 1964; Ohtani and Kumazawa, 1981; Presnall and Walter,
1993; Presnall and Gasparik, 1990; Presnall et al., 1998; Dalton and Presnall, 1997)
and the equations of state (Suzuki and Ohtani, 2003; Ohtani et al., 1993; Agee and
Walker, 1993) of liquids in the upper mantle. At lower mantle pressures, melting
has been measured with the laser heated diamond anvil cell (Zerr and Boehler, 1993,
1994; Shen and Lazor, 1995; Heinz and Jeanloz, 1987; Knittle and Jeanloz, 1989;
Sweeney and Heinz, 1993). Measurement of the high pressure equation of state and
melting has recently been made upon shock loading of solid samples (Mosenfelder
et al., 2007; Akins et al., 2004; Luo et al., 2004, 2002; Hicks et al., 2006).
As with the experimental studies of liquid thermodynamics, high temperatures
also hamper measurement of the structure of silicate liquids, and its response to
pressure. The earliest inferences were based on X-Ray diffraction (XRD) studies
of glasses (Warren and Biscoe, 1938; Mozzi and Warren, 1969), and later expanded
through in situ conductivity (Bockris et al., 1948), XRD (Waseda and Toguri, 1977)
and nuclear magnetic resonance (NMR) (Stebbins and Farnan, 1992) studies of liq-
uids. These studies revealed silicate liquids to comprise fourfold coordinated silicon
atoms arranged in a network modified to varying extent by other cations (network
4
modifiers) (Bottinga and Weill, 1972). Pressure induced coordination increases were
first predicted in analogy to changes in solids (Waff, 1975), and inferred from changes
in glass measured by spectroscopy (Williams and Jeanloz, 1988) and NMR (Allwardt
et al., 2007). Atomistic simulations have revealed that some liquids also accommo-
date compression by changing ring statistics (Stixrude and Bukowinski, 1990b).
In spite of the large contributions which these studies have made, large discrep-
ancies exist and important problems remain. These include the pressure and compo-
sitional dependence of structural response to compression, the nature of the density
contrast between melt and solid, high pressure melting temperatures, the possible
presence of immiscibility at deep Earth pressure, as well as identifying the underly-
ing structural response mechanisms responsible for thermodynamic phenomena. The
functional form by which to describe liquid state thermodynamics as a function of
pressure, temperature and composition also remains the subject of debate. These
are the main issues addressed in this thesis.
Mg2SiO4 liquid has a high ambient freezing temperature (Bowen and Andersen,
1914, 2163±25 K) and is very fragile, with the result that its structure has only been
inferred from studies of flash quenched glasses (Cooney and Sharma, 1990; Williams,
1990; Kohara et al., 2004), while its thermodynamic properties are only known from
extrapolation of partial molar values (Lange and Carmichael, 1987; Stebbins et al.,
1984; Rivers and Carmichael, 1987) and from measurements in the super cooled
state (Tangeman et al., 2001; Navrotsky et al., 1989). A density crossover within the
stability field of olivine has been observed for high Mg-number peridotite melts (Agee
and Walker, 1993), but forsterite melting curve measurements are disparate (Ohtani
and Kumazawa, 1981; Presnall and Walter, 1993) and show no evidence of a density
crossover in Mg2SiO4 liquid. However, at much higher pressure (150 − 200 GPa)
5
shock density measurements do predict a liquid denser than the solid (Mosenfelder
et al., 2007). To shed light on these important issues, the liquid structure, equation
of state, Hugoniot, forsterite coexistence curve and transport properties of Mg2SiO4
liquid are explored in Chapter II.
Chapter III presents a detailed consideration of the description of silicate liquid
thermodynamics over large pressure intervals. The finite strain expansion of the
energy (Birch, 1952, 1978) is often used to represent the liquid equation of state
(Rigden et al., 1988; Ghiorso et al., 2002; Lange, 2003, 2007; Stixrude and Karki,
2005; Karki et al., 2006, 2007), yet concerns over its suitability for liquids has been
raised (Ghiorso, 2004; Hofmeister, 1993), while the suitable treatment of tempera-
ture dependence has not been explored self consistently. Using theoretical relations
for simple liquids as a starting point, I extend the finite strain free energy expansion
to self consistently include temperature dependence. FPMD simulations provide a
unique set of constraints with which to test this description, while also affording an
account of the electronic free energy contribution. The resulting parameterization
of silicate liquid thermodynamics is combined with a description of solids at high
temperature to compute high pressure melting curves and Hugoniot loci for MgO
periclase and MgSiO3 perovskite, and make predictions of the changes in tempera-
ture, density and sound speed expected upon shock melting of these compounds.
To apply this thermodynamic description to liquids of arbitrary composition along
the join, an appropriate model of mixing is required. The regular solution model,
applied with the assumption of pressure independent enthalpy of mixing, works well
over the limited range of composition and pressure considered in model parameter-
izations of experimental data (Ghiorso and Sack, 1995; Ghiorso et al., 2002; Lange
and Carmichael, 1987; Stebbins et al., 1984; Lange, 1997; Ai and Lange, 2008), but
6
the extent to which this assumption holds over larger ranges of composition and
pressure needs to be rigorously explored. Notable contrasts exist in the response of
structure and thermodynamics to compression found for MgO (Karki et al., 2006),
Mg2SiO4 (Chapter II), MgSiO3 (Stixrude and Karki, 2005) and SiO2 (Karki et al.,
2007). In Chapter IV, thermodynamic and structural properties are computed for
four additional intermediate liquid compositions along the join (Mg5SiO7, Mg3S2iO7,
MgSi2O5 and MgSi3O7) and combined with existing results to explore the enthalpy
and volume of mixing, as well as the underlying structural controls.
Chapter II is already published, while Chapters III and IV will be submitted for
publication. Citations are as follows.
N. P. de Koker, L. Stixrude, and B. B. Karki. Thermodynamics, Structure, Dynam-
ics, and Freezing of Mg2SiO4 Liquid at High Pressure. Geochimica et Cosmochi-
mica Acta, 72:1427-1441, 2008a.
N. P. de Koker and L. Stixrude. Self-Consistent Thermodynamic Description of Sil-
icate Liquids, with Application to Shock Melting of MgO Periclase and MgSiO3
Perovskite. to be submitted to Geophysical Journal International, 2008b.
N. P. de Koker, L. Stixrude and B. B. Karki. Structure and Mixing of Liquids on
the MgO − SiO2 Join and the Origin of Liquid Immiscibility. to be submitted to
Nature, 2008c.
7
En + Cr
Two liquids
Liq + CrFo+ Liq
Fo + En En + LiqPe + Fo
Pe + Liq
Fo + Liq
Liquid
0.5 0.6 0.7 0.8 0.9 1.00.0 0.1 0.2 0.3 0.4
XSiO2
Tem
pera
ture
(K
elvi
n)
0 GPa3000
2500
2750
2150
2000
1750
Periclase - PeForsterite - FoEnstatite - En
Cristobalite - Cr
Figure 1.1: Ambient pressure phase diagram of the MgO-SiO2 join. Note the liquid immiscibilityfield at high SiO2 content and very refractory melting temperatures at the MgO end. Compiledfrom Bowen and Andersen (1914), Greig (1927), Ol’Shanskii (1951), Elliott et al. (1963), Riley(1966), Chen and Presnall (1975), Hageman and Oonk (1986).
CHAPTER II
Thermodynamics, Structure, Dynamics, and Freezing of
Mg2SiO4 Liquid at High Pressure
2.1 Abstract
We perform first principles molecular dynamics simulations of Mg2SiO4 liquid and
crystalline forsterite. On compression by a factor of two, we find that the Gruneisen
parameter of the liquid increases linearly from 0.6 to 1.2. Comparison of liquid and
forsterite equations of state reveals a temperature dependent density crossover at
pressures of ∼ 12 − 17 GPa. Along the melting curve, which we calculate by inte-
gration of the Clapeyron equation, the density crossover occurs within the forsterite
stability field at P = 13 GPa and T = 2550 K. The melting curve obtained from the
root mean square atomic displacement in forsterite using the Lindemann law fails
to match experimental or calculated melting curves. We attribute this failure to the
liquid structure that differs significantly from that of forsterite, and which changes
markedly upon compression, with increases in the degree of polymerization and co-
ordination. The mean Si coordination increases linearly from 4 in the uncompressed
system to 6 upon two-fold compression. The self-diffusion coefficients increase with
temperature and decrease monotonically with pressure, and are well described by the
Arrhenian relation. We compare our equation of state to the available high pressure
shock wave data for forsterite and wadsleyite. Our theoretical liquid Hugoniot is con-
8
9
sistent with partial melting along the forsterite Hugoniot at pressures 150 − 170 GPa,
and complete melting at 170 GPa. The wadsleyite Hugoniot is likely sub-liquidus at
the highest experimental pressure to date (200 GPa).
2.2 Introduction
The Earth’s mantle is almost entirely solid, yet liquids play a disproportionately
large role in our understanding of terrestrial chemical and thermal evolution. Silicates
melt incongruently, and in the shallow mantle, the partial melt is readily separated
from the residuum as a result of the large density contrast and low viscosity of the
liquid. To accurately describe these processes, knowledge of the changes in liquid
physical properties with pressure and temperature is needed, especially the density,
Gruneisen parameter, chemical diffusivity and melting temperature. Furthermore,
an understanding of liquid structure that ultimately governs these physical properties
is key to predicting properties at conditions previously unexplored, and also offers
deep insight into the physics of the liquid state.
Olivine and its polymorphs of dominantly Mg2SiO4 composition make up approx-
imately 60 % of the upper mantle and transition zone. With increasing pressure, the
eutectic composition on the MgO − SiO2 join moves towards Mg2SiO4 (Ohtani and
Kumazawa, 1981; Kato and Kumazawa, 1985; Presnall and Gasparik, 1990). The
properties of Mg2SiO4 liquid are thus crucial to deep earth studies involving a liquid
phase. These include magma ocean dynamics, lunar formation and mantle melting
as the source for komatiitic and basaltic magmas. Buoyantly stable partial melt has
been proposed to exist atop the 410 km discontinuity on the basis of seismic observa-
tions (Revenaugh and Sipkin, 1994; Song et al., 1994). In addition, the discovery of
a ultra-low-velocity zone (ULVZ) at the core-mantle boundary (CMB) (Garnero and
10
Helmberger, 1995; Williams and Garnero, 1996) has lead to the speculation of the
presence of partial melt in the bottom most part of the mantle. Indeed, estimates of
the mantle geotherm in the lowermost mantle are similar to estimates of the lower
mantle solidus (Holland and Ahrens, 1997; Luo et al., 2004; Stixrude and Karki,
2005).
The high melting temperature of forsterite (2163 ± 25 K; Bowen and Andersen,
1914) has made accurate in situ experimental measurement of Mg2SiO4 liquid prop-
erties difficult. The volume at ambient pressure and its pressure and temperature
derivatives are estimated from experimental measurements at lower temperature and
more silica rich compositions, combined with the assumption of linear additivity of
partial molar properties (Lange and Carmichael, 1987; Lange, 1997; Ai and Lange,
2008), or from fusion curve analysis and calorimetric data (Bottinga, 1985). The
value of CP measured for the supercooled liquid (225 J.mol−1.K−1; Tangeman et al.,
2001) differs significantly from the model value calculated from partial molar heat ca-
pacities (285 − 295 J.mol−1.K−1; Stebbins et al., 1984; Lange and Navrotsky, 1992).
Studies of non-crystalline structure have been limited to Mg2SiO4 glass (Cooney and
Sharma, 1990; Kohara et al., 2004).
Here we apply first principles molecular dynamics to simulate Mg2SiO4 liquid
and forsterite at pressures and temperatures relevant to the mantle. We investigate
the equation of state, liquid structure and transport properties and compare with
experiments and previous results based on semi-empirical inter atomic force models.
By combining the liquid equation of state with that of forsterite, calculated using the
same method, we integrate the Clapeyron equation to obtain the forsterite melting
curve.
11
2.3 Computational Technique
The power and robustness of density functional theory (DFT) as a tool for de-
termining the properties of earth materials at conditions relevant to planetary in-
teriors have been extensively explored (Stixrude, 2001; Gillan et al., 2006). DFT
was recently applied in combination with Born-Oppenheimer molecular dynamics to
the simulation of silicate liquids over the entire mantle pressure-temperature regime
(Stixrude and Karki, 2005; Karki et al., 2007).
DFT is based on the Hohenberg-Kohn theorem (Hohenberg and Kohn, 1964; Kohn
and Sham, 1965), through which the wave function and total energy may be expressed
as a unique functional of the ground state electron density. Although the theorem is
exact, approximations are needed to account for the unknown exchange-correlation
functional. In this study we adopt the most widely applied approximation, the local
density approximation (LDA; Ceperley and Alder, 1980).
The influence of the core electronic wave functions of Mg, Si and O is approximated
using ultrasoft pseudopotentials with core radii of 1.06 A, 0.95 Aand 0.82 A, and
valence shells representing the 3s2, 3s23p2 and 2s22p4 electrons, respectively (Kresse
and Hafner, 1994), as implemented in the VASP code (Kresse and Furthmuller, 1996).
We perform molecular dynamics in the canonical ensemble (constant NVT), via a
thermostat (Nose, 1984). In order to make simulation with systems of sufficient size
computationally feasible, the size of the plane-wave basis set is limited to a cutoff
energy Ecut = 400 eV, for which we account by applying a finite basis set (Pulay)
correction (Gomes Dacosta et al., 1986; Francis and Payne, 1990) to the calculated
pressures (see below).
Simulations contain 112 atoms (16 formula units) with periodic boundary condi-
12
tions (Figure 2.1). The initial condition is a 2× 1× 2 supercell of forsterite homoge-
neously strained to a cubic cell shape and the desired volume. The Brillouin zone is
sampled at the gamma point only. We simulate the liquid at volumes of V/VX = 1.2,
1.1, 1.0, 0.9, 0.8, 0.7, 0.6 and 0.5 where VX = 52.36 cm3/mol is an estimate of the vol-
ume of Mg2SiO4 liquid at the ambient melting point (Lange and Carmichael, 1987).
The initial configuration is melted at 6000 K, and then cooled isochorically to 3000 K
and 4000 K. We also perform simulations of crystalline forsterite at 1000 K, 2000 K
and 3000 K, and at volumes V/VX = 1.0, 0.9, 0.8 and 0.7. We initiate crystalline
simulations with the cell shape obtained by static structural relaxation at each vol-
ume, and then adjust cell parameters until the stress tensor is hydrostatic to within
statistical uncertainty (Oganov et al., 2001b). The phase present in the simulation
(crystal or liquid) is verified by inspection of the radial distribution function and the
mean square displacement. Simulations of both liquid and solid are performed using
a time step Δt = 1 fs, with each simulation running for at least 3000 time steps. The
first 600 steps allow the system to converge, with equilibrium properties calculated
over the remaining time. We estimate the uncertainty in the energy (E) and pres-
sure (P ) by applying the blocking method (Flyvberg and Petersen, 1989). Tests of
convergence with respect to system size (70 and 336 atom supercells), run duration
(6 ps), initial configuration (strained ringwoodite) and k-point sampling (2 × 2 × 2
Monkhorst and Pack (1976) grid) show that variations are well within the mean
statistical uncertainty of the simulations (σE = 8.8 kJ/mol; σP = 1.5 GPa). Slow
cooling over 3000 fs from 6000 K to 3000 K showed no cooling rate dependence of the
thermodynamic or structural properties.
Two corrections are applied to the pressures calculated in the simulations as
13
follows
(2.1) P (V ) = PMD(V ) + PPulay(V ) + Pemp(V ).
We compute the Pulay correction as
(2.2) PPulay(V ) = PS(V ; Ecut = 600 eV) − PS(V ; Ecut = 400 eV),
where PS is the static pressure of the fully relaxed structure of forsterite computed
with a 2 × 2 × 2 Monkhorst Pack k-point mesh, and 600 eV as has been found
in previous studies to yield fully converged results (Karki et al., 2001). We find
that PPulay increases monotonically from 2.6 GPa at V/VX = 1.0 to 5.1 GPa at
V/VX = 0.5. Values calculated for different atomic configurations obtained from
the simulations, as well as for wadsleyite and ringwoodite, differ from the forsterite
value by less than 0.2 GPa. The empirical correction accounts for the well known
and systematic over-binding of LDA (Karki et al., 2001; Oganov et al., 2001a) and
is computed as
(2.3) Pemp = −PS(Vexp; Ecut = 600 eV),
where Vexp is the experimental zero-pressure volume of forsterite at static condi-
tions computed via the thermodynamic model of Stixrude and Lithgow-Bertelloni
(2005). For forsterite we find Pemp = 1.6 GPa. Values calculated for wadsleyite and
ringwoodite are 1.4 GPa and 1.7 GPa, respectively.
We fit the simulation pressure and internal energy results to the Mie-Gruneisen
equation of state,
(2.4) P (V, T ) = PC(V, T0) +γ(V )CV (V )
V[T − T0] ,
(2.5) E(V, T ) = E0 + EC(V, T0) + CV (V ) [T − T0] ,
14
(2.6) PC(V, T0) = 3K0f (1 + 2f)5/2[1 + a1f + · · ·
],
(2.7) EC(V, T0) = T0
∫ V
V0
γ(V ′)CV (V ′)V ′ dV ′ + 9K0V0f
2[1
2+
a1
3f + · · ·
],
(2.8) a1 =3
2
[K ′
0 − 4],
(2.9) f =1
2
[(V0
V
)2/3
− 1],
where the expression for the internal energy follows from the Eulerian finite strain
expansion of the Helmholtz free energy, F , (Birch, 1952; Stixrude and Bukowinski,
1990a), the Euler relation, E = F + TS, and the Maxwell identity (∂S/∂V )T =
(∂P/∂T )V . E0, V0, K0 and K ′0 are respectively the internal energy, volume, isother-
mal bulk modulus (KT ) and its first pressure derivative at zero pressure and tem-
perature T0. The isochoric heat capacity (CV ) and Gruneisen parameter (γ), are
determined from our simulations as the dependence of internal energy and pressure
on temperature at constant volume, and are found to be linear to within our resolu-
tion:
(2.10) CV =
(∂E
∂T
)V
,
(2.11)γ
V=
(∂P
∂E
)V
.
The volume dependence of CV and γ are described accurately as
(2.12) CV (V ) = CV (VX) + C ′V
[ V
VX− 1
]+ · · · ,
15
(2.13) γ(V ) = γ(VX) + γ′[ V
VX
− 1]
+ · · · .
We estimate the uncertainty in a thermodynamic quantity at a given volume and
temperature by repeated fitting of the equation of state to a Monte-Carlo sampling
of the simulation data within its error estimates (values converge after about 104
iterations).
The melting curve is computed via the Clausius-Clapeyron relation
(2.14)∂TM
∂P=
ΔV
ΔH/TM,
where the volume and enthalpy differences are taken from our simulations, and the
integration constant is set to the experimental melting point at ambient conditions
(2163 ± 25 K; Bowen and Andersen, 1914). This hybrid approach, in which we take
only the initial melting temperature from experiment, and compute the melting tem-
perature at all other pressures from our simulations is much more efficient than the
fully first principles determination of melting temperatures (Sugino and Car, 1995;
Alfe, 2005). Moreover, our approach is justified by the good agreement with ex-
perimental melting temperatures found in extremely demanding fully first principles
computations of melting, which have not yet been attempted on systems as complex
as forsterite. In order to compute the melting curve, we compare the properties of
the liquid and the solid at constant pressure. This is accomplished via interpolation,
and the error in the volume is estimated from that in the pressure as
(2.15) σV =
(∂V
∂P
)T
σP .
Our forsterite simulations allow the determination of the mean square displace-
ment of all the atoms (〈urms〉) as a function of pressure and temperature. Together
with the mean inter-atomic distance (a), the Lindemann law melting curve can be
16
calculated in its original formulation (Lindemann, 1910)
(2.16) fc =〈urms〉
a,
by determining the value of the constant critical fraction (fc) at the experimental
ambient melting point (Gilvarry, 1956).
We calculate the theoretical Hugoniot pressure (PH), temperature (TH) and in-
ternal energy (EH) at a given volume (VH) by iteratively solving equations 4 and 5
to satisfy the Rankine-Hugoniot relation,
(2.17) (EH − ER) = −1
2(PH + PR) (VH − VR) ,
where ER and VR is the internal energy and volume of the unshocked sample at
reference pressure PR and temperature TR.
The self-diffusion coefficient DN for the N -particle periodic system is computed
via
(2.18) DN = limt→∞
〈[r(t)]2〉6t
,
where is the mean square displacement. The pressure and temperature dependence
of is described by the Arrhenius relation,
(2.19) DN(P, T ) = D0N exp
[− Ea + PVa
RT
],
where Ea and Va are the activation energy and volume. We account for finite size ef-
fects in the periodic system by applying a correction based on the Kirkwood-Riseman
theory of polymer diffusion (Yeh and Hummer, 2004; Zhang et al., 2004). The diffu-
sivity for an infinitely large system is calculated as
(2.20) D∞ = DN +kBTξ
6πηL,
17
where DN is the diffusivity from the N -particle simulation, ξ is a constant (≈
2.837297), L is the size of the box and η is the viscosity of the liquid. The vis-
cosity is estimated by the Eyring relation
(2.21) η =kBT
D∞λ,
where λ was found by Lacks et al. (2007) to have a value of 16 RO for Mg2SiO4
liquid, RO = 1.4 A being a canonical value for the ionic radius of oxygen.
2.4 Results
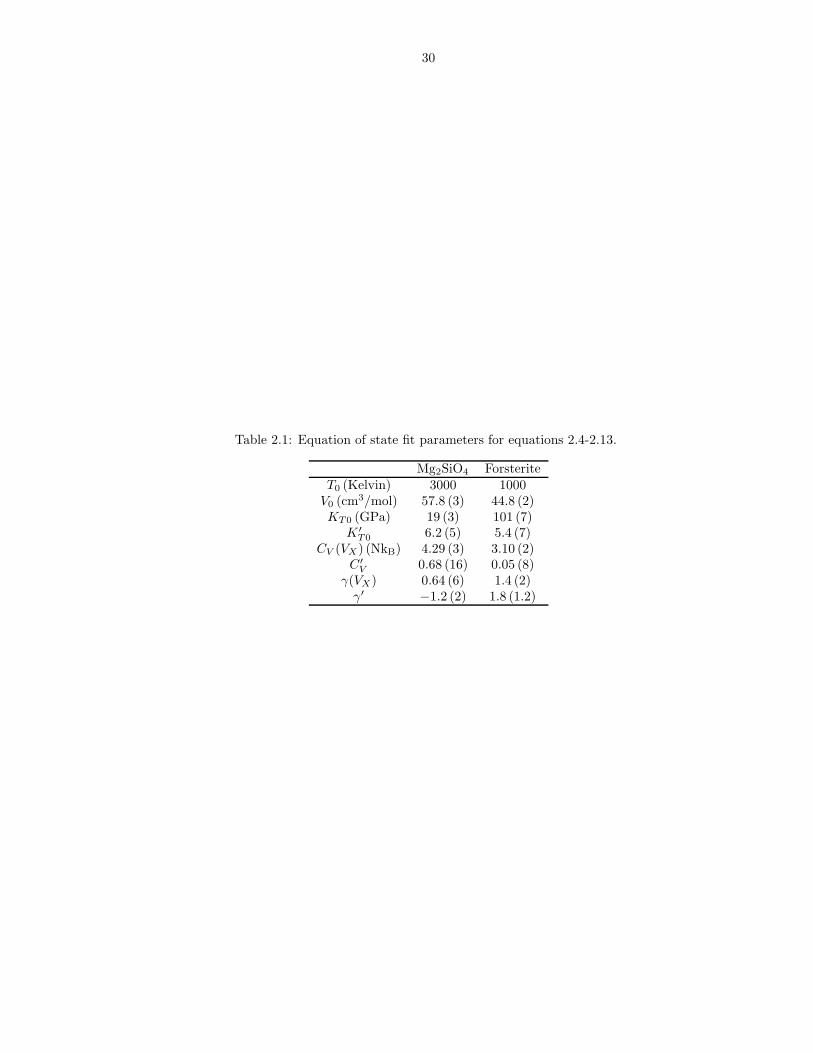
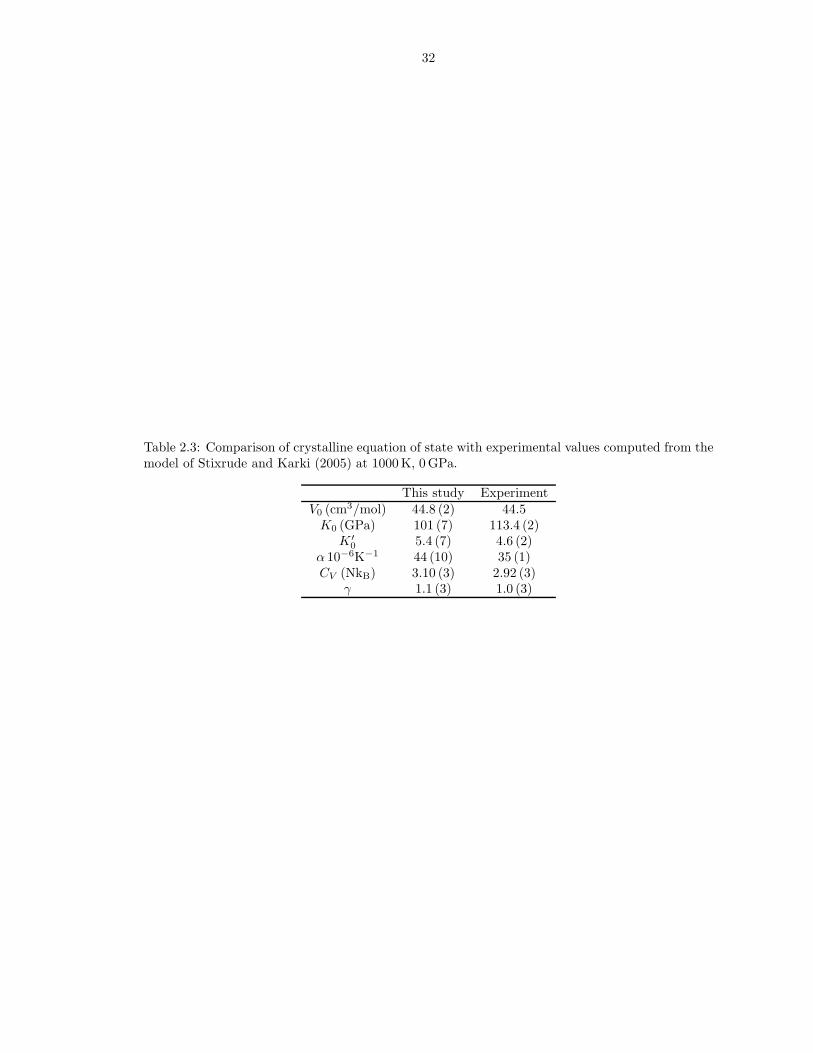
2.4.1 Equation of State
We find the third order expansion in f (equations 2.4 and 2.5) to be sufficient to
represent the equation of state results (Figure 2.2), with the isochoric heat capacity
(CV ) and Gruneisen parameter (γ) as linear functions of volume (equations 2.12-2.13;
Figure 2.3). Values of the parameters in equations 2.4-2.13 for liquid and forsterite
are reported in Table 2.1. Tables 2.2 and 2.3 compare theoretical and experimental
values for liquid and solid, respectively.
Our computed values of the physical properties of the liquid at the ambient melt-
ing point are consistent with previous experimental data (Stebbins et al., 1984; Bot-
tinga, 1985; Lange and Carmichael, 1987; Rivers and Carmichael, 1987; Rigden et al.,
1989; Lange, 1997; Tangeman et al., 2001; Ai and Lange, 2008). Agreement with the
volume, thermal expansivity and bulk modulus is excellent. The computed value of
K ′0 is much larger than a previous estimate based on fusion curve analysis, and more
similar to values found for other silicate liquids by direct measurement of the equation
of state (Rigden et al., 1989). Our value of the heat capacity lies between two pre-
vious experimental estimates. Our value of V0 is very similar to that (57.9 cm3/mol)
found by Lacks et al. (2007) using empirical potentials. However, with compression
18
their computed pressure deviates systematically and increasingly from our predic-
tions, being 1.4 GPa less at the smallest volume of their study (33.5 cm3/mol) and
3000 K.
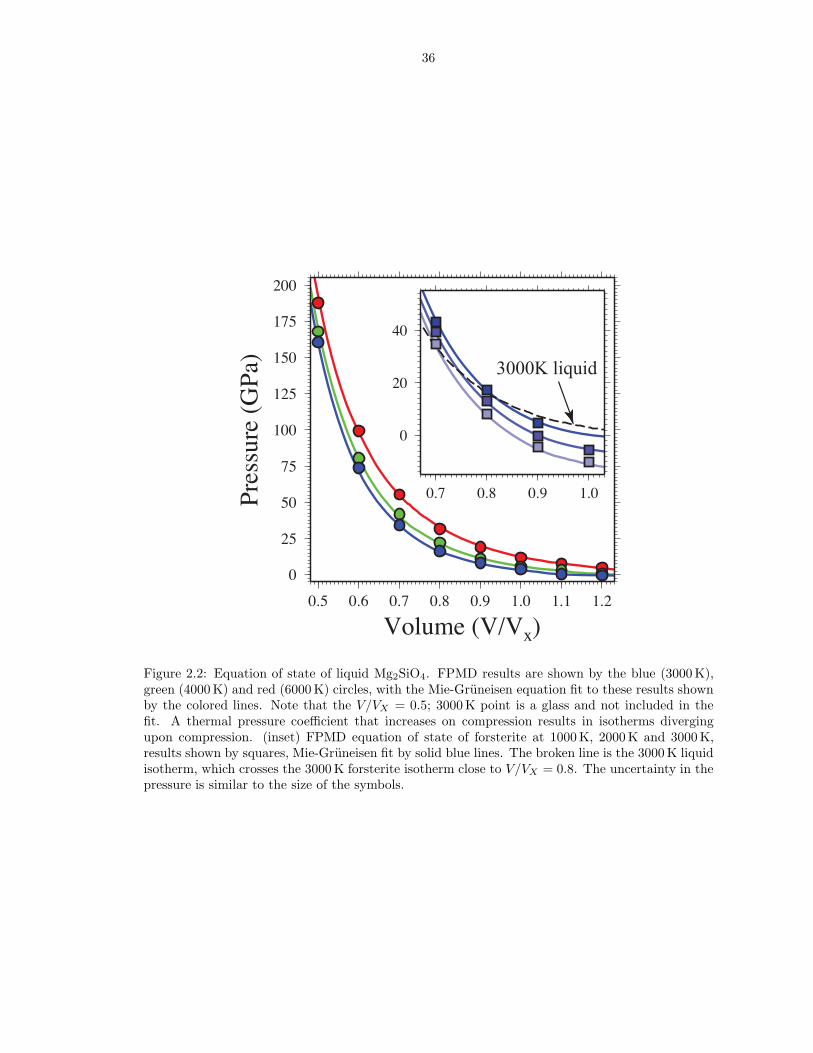
We find that liquid state isotherms diverge upon compression: the thermal pres-
sure coefficient B = (∂P/∂T )V = γCV /V increases as the volume decreases. The iso-
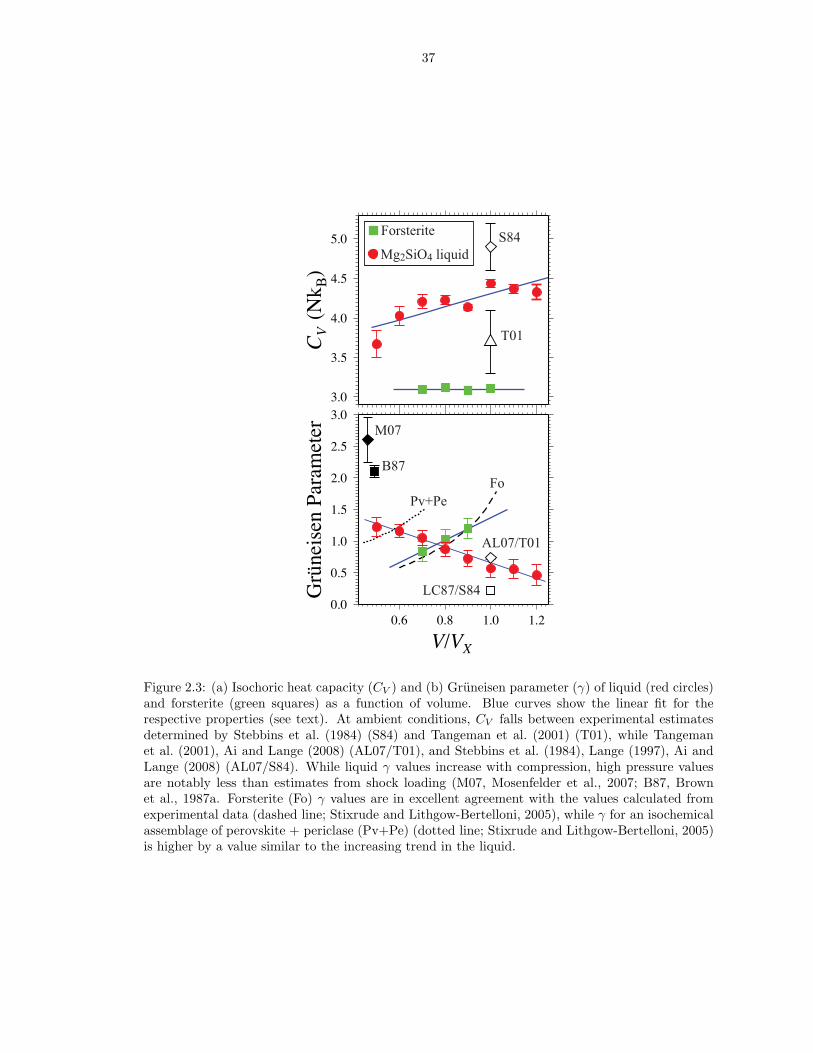
choric heat capacity decreases from 4.4 NkB at V/VX = 1.0 to 3.7 NkB at V/VX = 0.5,
and the Gruneisen parameter of the liquid increases from 0.6 to 1.2 over the same
range of compression (Figure 2.3), in contrast to the behavior of crystalline forsterite
for which CV remains essentially constant at a value of about 3.1 NkB and the
Gruneisen parameter decreases on compression. Along the 3000 K isotherm, the
enthalpy difference between liquid and solid decreases steadily, while the difference
in volume reveals a density crossover at 16± 3 GPa (Figure 2.2, inset). The pressure
of the density crossover decreases with decreasing temperature.
2.4.2 Melting Curve
We find that the melting temperature reaches a maximum of T = 2550 K at
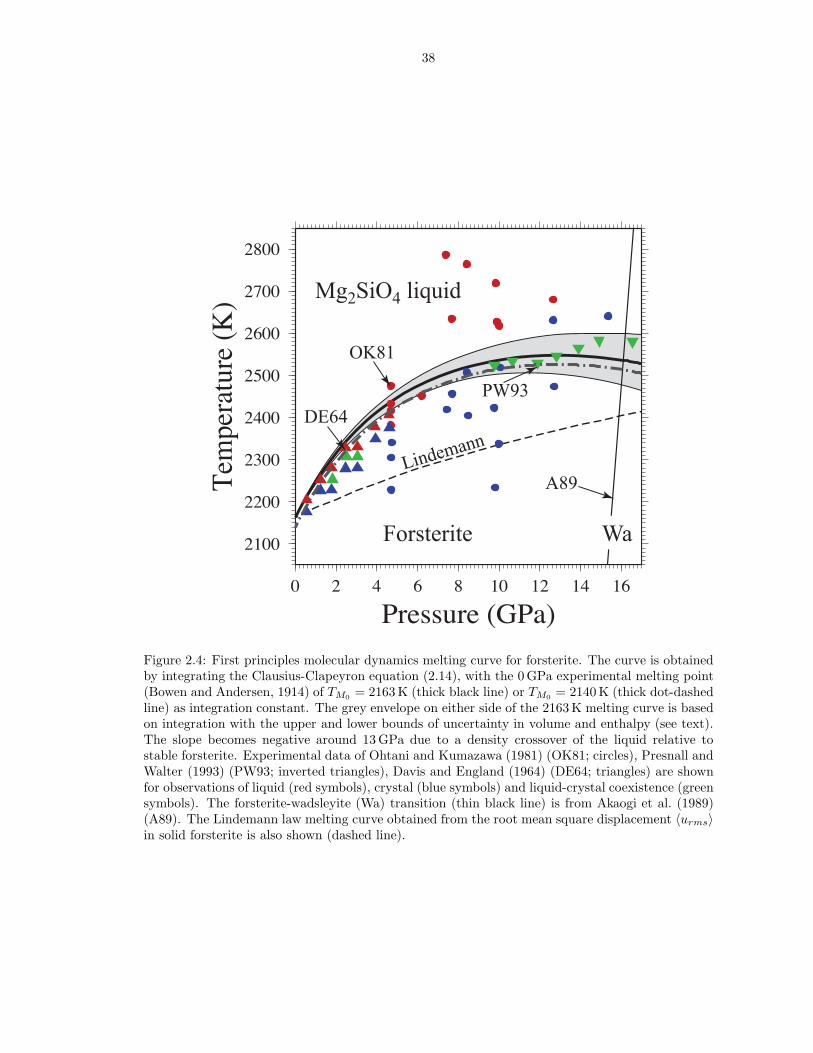
P = 13 GPa, well within the forsterite stability field (Akaogi et al., 1989), and has a
negative slope at higher pressures as a result of a density crossover (Figure 2.4). The
entropy and volume of fusion at ambient conditions (ΔH/TM = 0.95 ± 0.04 NkB,
ΔV = 5.7 ± 0.1 cm3/mol) agree with experimental estimates (ΔH/TM = 0.91 ±
0.16 NkB (Navrotsky et al., 1989; Lange and Carmichael, 1987; Lange, 1997)). The
entropy of fusion (ΔH/TM) along the melting curve decreases to 0.75 NkB at 20 GPa,
significantly lower than the entropy of melting of MgSiO3 perovskite (∼ 1.5 NkB)
found in a previous simulation study (Stixrude and Karki, 2005).
Experimentally determined melting curves of forsterite disagree with one another
above 10 GPa (Davis and England, 1964; Ohtani and Kumazawa, 1981; Presnall and
19
Walter, 1993). At high pressures, our melting curve is in excellent agreement with
the measurements of Presnall and Walter (1993), while at lower pressures it is slightly
higher than the experimental measurements of both Davis and England (1964) and
Ohtani and Kumazawa (1981).
Experimental evidence shows that, towards the high pressure end of the forsterite
stability field, forsterite melts incongruently to a more silica rich liquid (Ohtani
and Kumazawa, 1981; Kato and Kumazawa, 1985; Presnall and Gasparik, 1990)
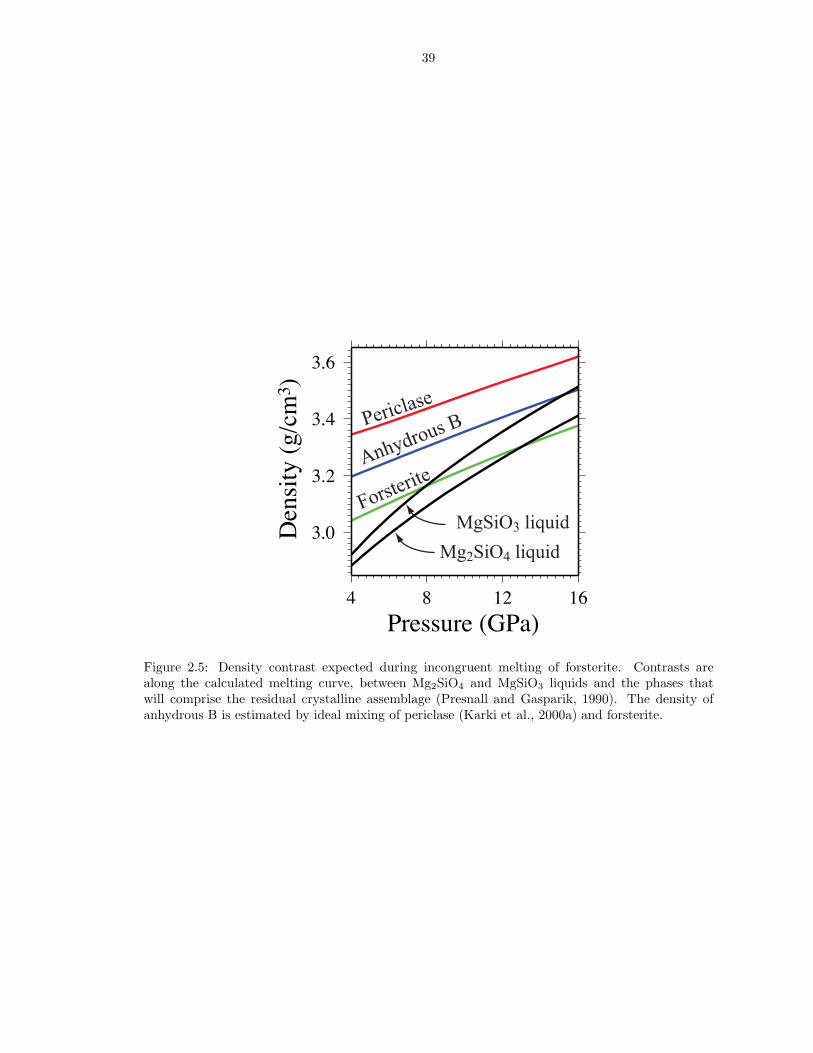
and either anhydrous B or periclase. Figure 2.5 illustrates that a more silica rich
liquid is denser than both forsterite and Mg2SiO4 liquid, though less dense than
crystalline anhydrous B and periclase (Karki et al., 2000a). Therefore partial melting
of forsterite at high pressure produces a liquid denser than crystalline forsterite. The
liquidus phases on Mg2SiO4 composition at the base of the upper mantle (periclase
and anhydrous B) are denser than the liquid.
The mean 〈urms〉 in forsterite varies between 0.05 A2 at 1000 K and 0.3 A2 at
3000 K, with a weak volume dependence of about 0.0065 A2.mol.cm−3. Our Linde-
mann melting curve computed from interpolated values of 〈urms〉 (Figure 2.4), shows
poor agreement with experimental data and fails to capture the slope as well as
its change with pressure (curvature) seen in both our FPMD results as well as the
experimental data (Presnall and Walter, 1993).
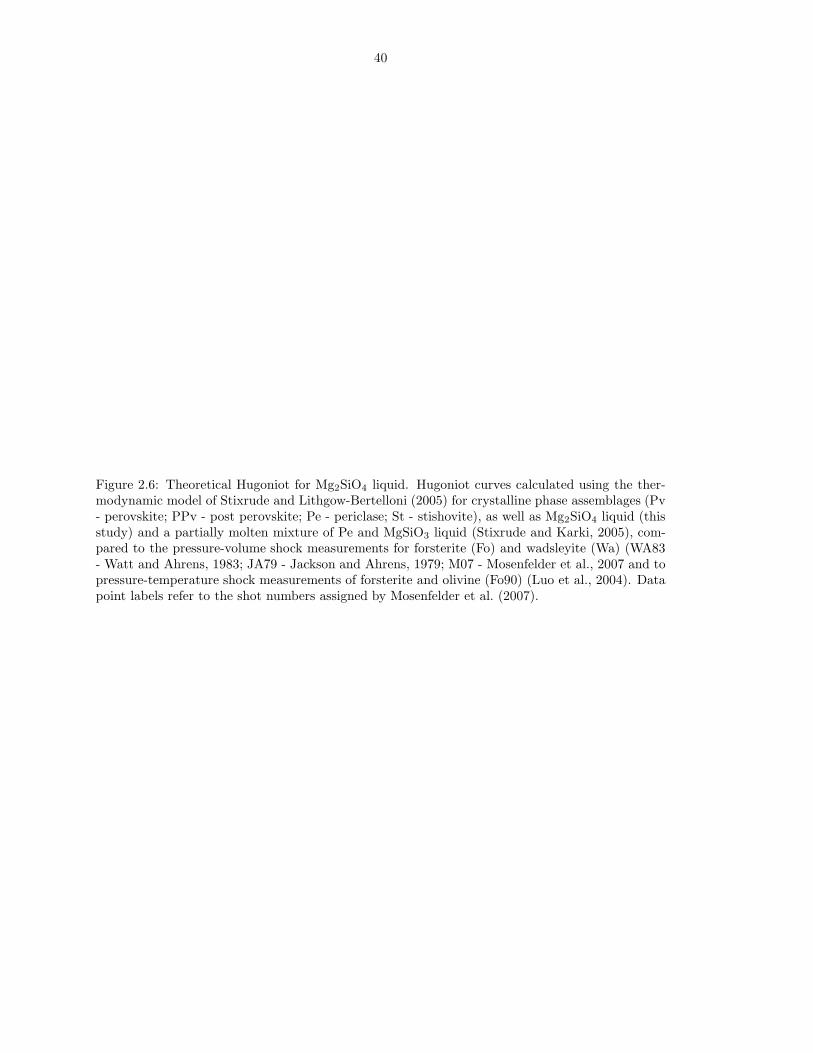
2.4.3 Mg2SiO4 Hugoniot
We compare our theoretical Hugoniot for Mg2SiO4 liquid, together with Hugoniots
for a partially molten sample of periclase + MgSiO3 liquid (Stixrude and Karki,
2005), and solid phase assemblages perovskite + periclase (Pv+Pe), post-perovskite
+ periclase (PPv+Pe) and stishovite + periclase (St+Pe) (Stixrude and Lithgow-
Bertelloni, 2005), to the published high pressure shock data for forsterite and wads-
20
leyite (Jackson and Ahrens, 1979; Watt and Ahrens, 1983; Brown et al., 1987a,b;
Luo et al., 2004; Mosenfelder et al., 2007) (Figure 2.6).
Pressure-density and temperature measurements on the forsterite Hugoniot agree
well with our computed Hugoniots of the sub-solidus assemblage (PPv+Pe) at pres-
sures below 150 GPa, a mixture of periclase and MgSiO3 liquid between 150 −170 GPa, and with pure Mg2SiO4 liquid at higher pressures. We find that the
pressure-volume relation on the wadsleyite Hugoniot (there are no temperature mea-
surements) is consistent with the sub-solidus assemblage at 140 GPa, and pure liquid
or a mixture of periclase and Mg2SiO4 liquid at 200 GPa. Shot #349 on wadsleyite is
not consistent with any of our computed Hugoniots. The discrepancy with Mg2SiO4
liquid for wadsleyite shot #349 (almost 50 GPa) is much larger than the uncertainty
in the simulated pressure (1.4 GPa), which includes the uncertainty estimates for
PPulay and Pemp (equation 2.1).
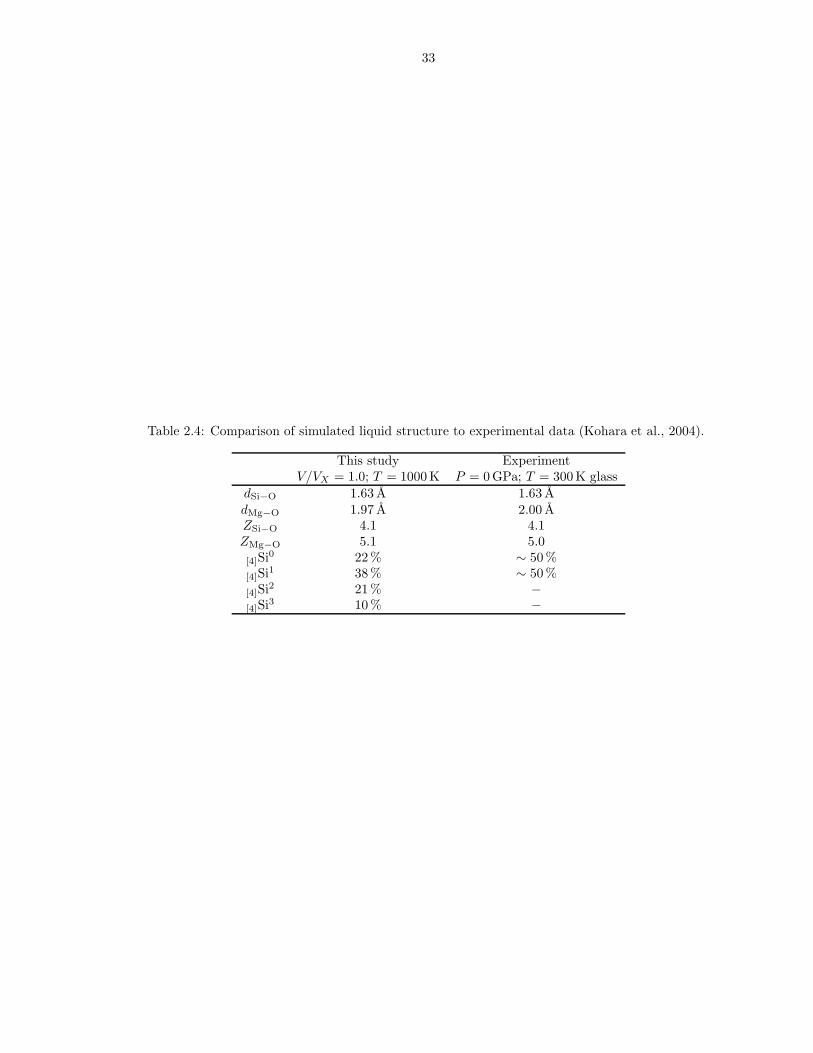
2.4.4 Liquid Structure
We define the bond length as the mode of the first peak in the partial radial
distribution function (RDF) (McQuarrie, 1984). Upon compression, the Si-O bond
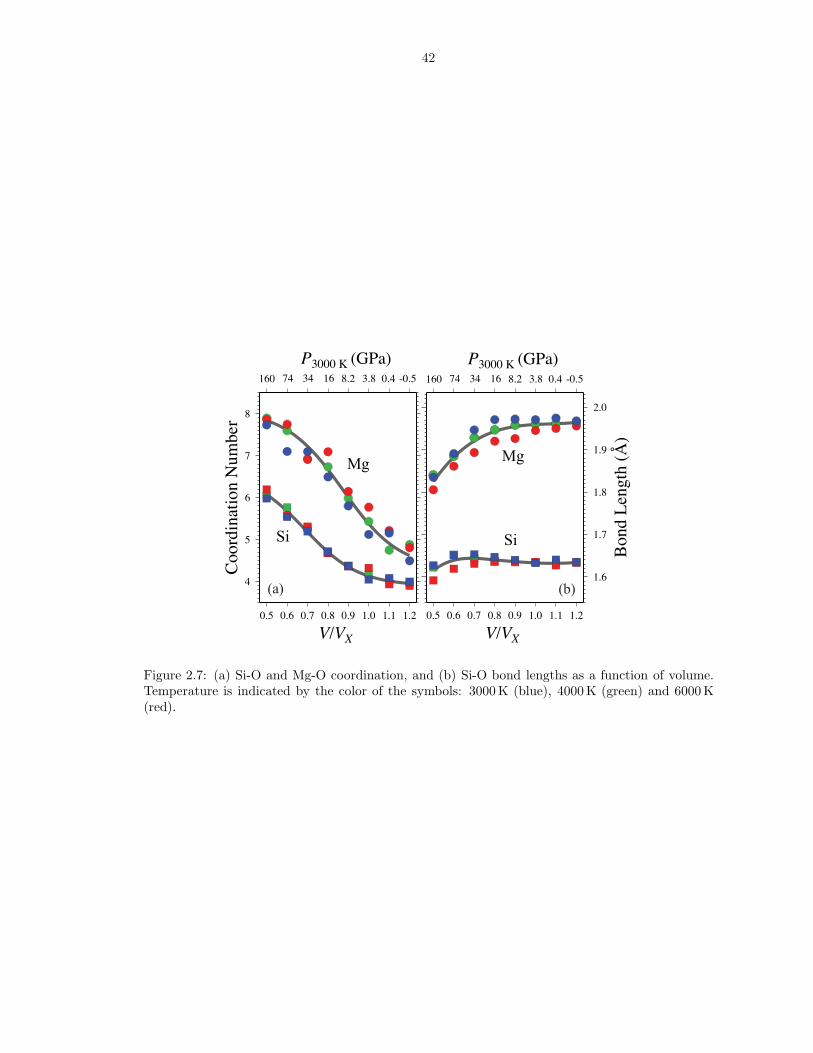
length increases initially from a value of 1.63 A (Figure 2.7) to 1.64 A at V/VX = 0.7
and then decreases to 1.62 A at 3000 K and the highest compression considered.
Over the same compression interval the Mg-O bond length decreases from 1.97 A to
1.83 A. The mode and median of the first peak diverge, as the radial distribution
function broadens with increasing distortion of the polyhedra on compression. Si-O
and Mg-O bond lengths and coordination numbers at low pressure compare very well
with experimental data (Kohara et al., 2004) on the structure of Mg2SiO4 glasses
(Table 2.4).
The coordination number (Zαβ) is computed as the integral of the radial distri-
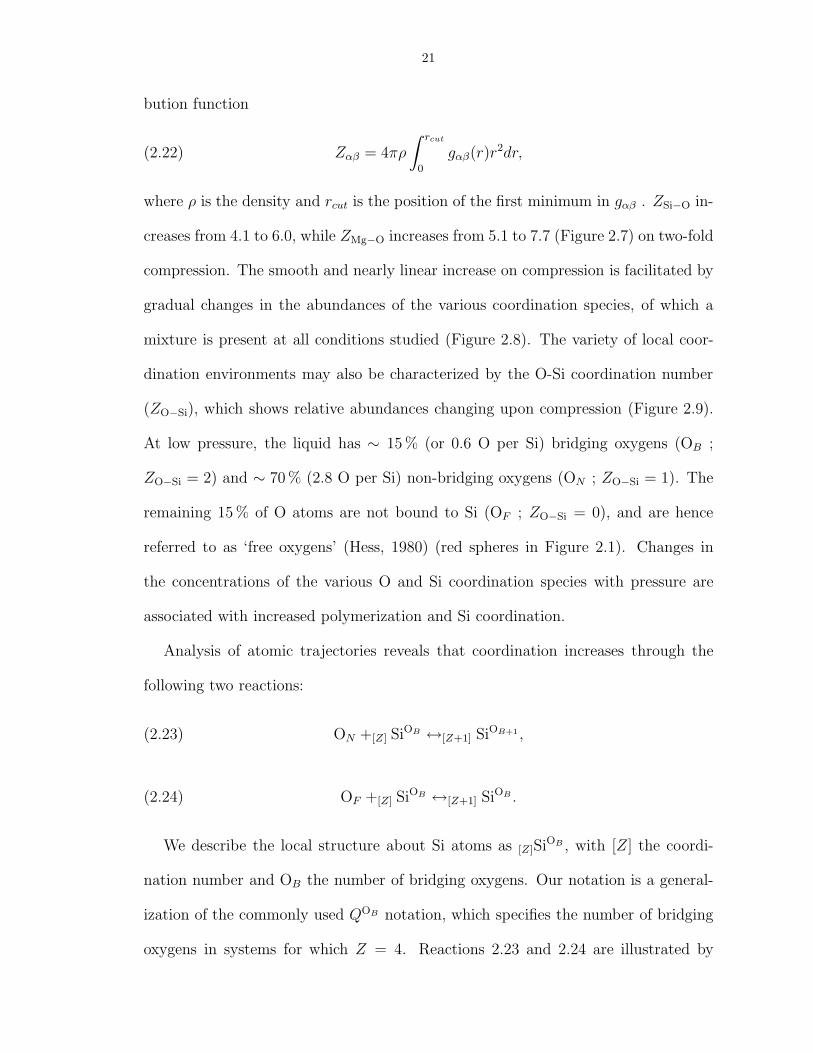
21
bution function
(2.22) Zαβ = 4πρ
∫ rcut
0
gαβ(r)r2dr,
where ρ is the density and rcut is the position of the first minimum in gαβ . ZSi−O in-
creases from 4.1 to 6.0, while ZMg−O increases from 5.1 to 7.7 (Figure 2.7) on two-fold
compression. The smooth and nearly linear increase on compression is facilitated by
gradual changes in the abundances of the various coordination species, of which a
mixture is present at all conditions studied (Figure 2.8). The variety of local coor-
dination environments may also be characterized by the O-Si coordination number
(ZO−Si), which shows relative abundances changing upon compression (Figure 2.9).
At low pressure, the liquid has ∼ 15 % (or 0.6 O per Si) bridging oxygens (OB ;
ZO−Si = 2) and ∼ 70 % (2.8 O per Si) non-bridging oxygens (ON ; ZO−Si = 1). The
remaining 15 % of O atoms are not bound to Si (OF ; ZO−Si = 0), and are hence
referred to as ‘free oxygens’ (Hess, 1980) (red spheres in Figure 2.1). Changes in
the concentrations of the various O and Si coordination species with pressure are
associated with increased polymerization and Si coordination.
Analysis of atomic trajectories reveals that coordination increases through the
following two reactions:
(2.23) ON +[Z] SiOB ↔[Z+1] SiOB+1 ,
(2.24) OF +[Z] SiOB ↔[Z+1] SiOB .
We describe the local structure about Si atoms as [Z]SiOB , with [Z] the coordi-
nation number and OB the number of bridging oxygens. Our notation is a general-
ization of the commonly used QOB notation, which specifies the number of bridging
oxygens in systems for which Z = 4. Reactions 2.23 and 2.24 are illustrated by
22
the increase in the proportion of bridging oxygens as the proportion of free oxygens
decreases on compression (Figure 2.9). Bridging oxygens are almost never added to
the coordination shell of another silicon and therefore do not contribute significantly
to the coordination increase, consistent with Raman, infrared, and nuclear magnetic
resonance spectroscopic observations in alkali-silicate glasses (Wolf et al., 1990; Xue
et al., 1991) showing coordination increases primarily at the expense of non-bridging
oxygens. Examples of reactions 2.23 and 2.24 are illustrated in Figure 2.10 in which
[4]Si1 is shown transforming into [4]Si0 (top panel), and [4]Si3 to [3]Si2 and then to
[5]Si4(bottom panel).
2.4.5 Transport Properties
Characteristic bond lifetimes calculated from the bond breaking rate (Kubicki and
Lasaga, 1991) reveal a strong decrease in the average Si-O bond lifetime from 2000 fs
at ambient pressure and 3000 K to 500 fs at high pressure. Mg-O bond lifetimes
increase only slightly over the same pressure range from 300 fs to 400 fs. Over the
same compression range, the long lifetimes of OF and ON at low pressure (∼ 1500 fs
at 3000 K) decrease to values similar to that of OB (500 fs at 3000 K) which remain
essentially unchanged as a function of volume.
Self-diffusion coefficients increase with temperature and decrease with pressure
(Figure 2.12), and do not show the initial increase with increasing pressure seen in
more highly polymerized silicate liquids (Angell et al., 1982; Karki et al., 2007): The
pressure and temperature dependence is well described by the Arrhenius relation.
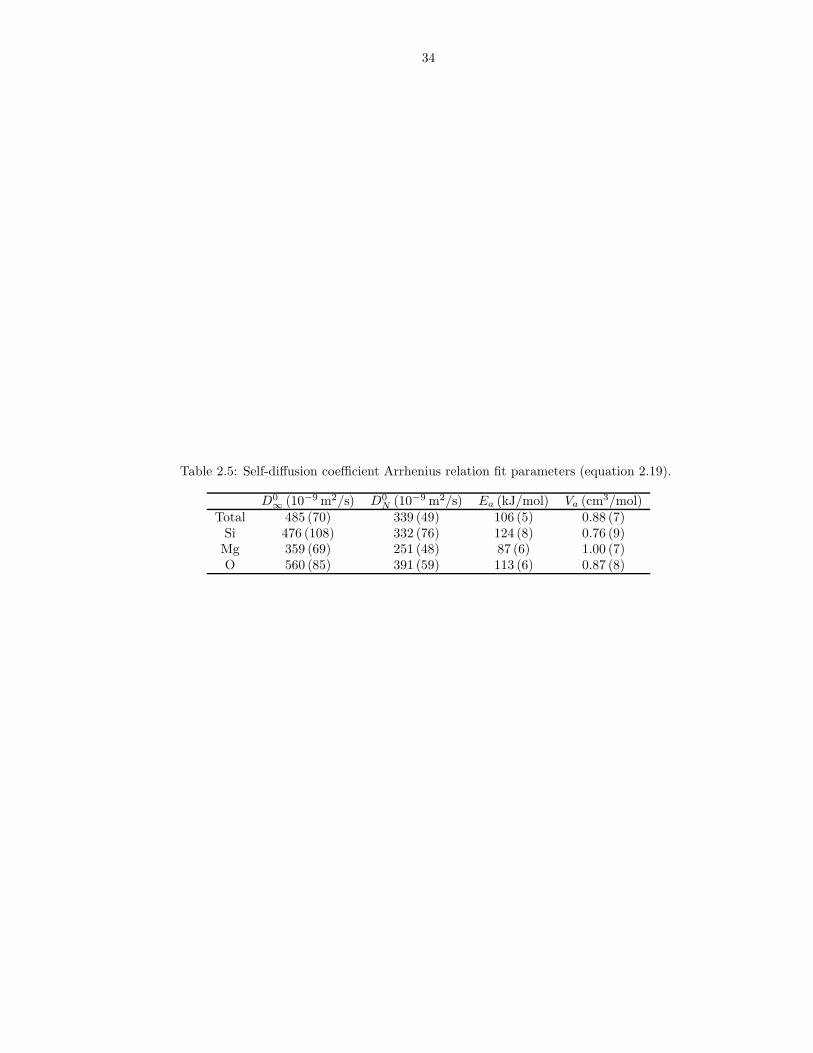
Fit parameters for Mg, Si, O and total self-diffusion (Table 2.5) are found to be
independent of temperature over the range investigated.
By comparing with longer runs, we find 2400 ergodic timesteps to be sufficient to
determine robust values of the self-diffusion coefficient values from the mean square
23
displacement 〈[r(t)]2〉 (Figure 2.11), for all simulations except the V/VX = 0.5; T =
4000 K and V/VX = 0.6; T = 3000 K points, for which 5000 timesteps are sufficient.
The V/VX = 0.5; T = 3000 K point is not included in the analysis of thermodynamic
and transport properties, because we find it to be a glass: 〈[r(t)]2〉 flattens out at
0.25 A2, similar to values found in the solid at low pressure, though somewhat higher
than solid values extrapolated to V/VX = 0.5 (0.17 A2).
Equation 2.20 implies a N−1/3 dependence of diffusivity on system size. The
corrected total diffusivity at V/VX = 1.0; T = 3000 K, (D∞ = 6.13±0.6×10⁻⁹ m2/s)
calculated with equation 2.20 is similar to the value (D∞ = 6.7 ± 0.7 × 10⁻⁹ m2/s)
we find from the linear relation
(2.25) DN = D∞ + aN−1/3,
fit to our results for 112 and 336 atoms.
2.5 Discussion
The structure of Mg2SiO4 liquid differs markedly from that of crystalline forsterite.
Whereas in forsterite all O are bonded to Si, with SiO4 tetrahedra isolated from one
another (entirely Q0 or [4]Si0 in our notation), in the liquid free oxygens and tetra-
hedral linkages ( Q≥1 or [4]Si0 ) appear. Free oxygens are also present in the high
pressure crystalline polymorph wadsleyite, in which all tetrahedra exist as dimers
(Si2O7). The difference in structure between Mg2SiO4 liquid and forsterite is impor-
tant as it accounts for the very large enthalpy of vitrification of Mg2SiO4 (Kohara
et al., 2004) and the failure of the Lindemann law in this system. Evidence of
dimers in amorphous Mg2SiO4 had previously been obtained only for the glass, via
vibrational spectroscopy, nuclear magnetic resonance, and x-ray diffraction (McMil-
lan, 1984; Williams et al., 1989; Cooney and Sharma, 1990; Williams, 1990; Kohara
24
et al., 2004). While experimental studies have found evidence only for Q0 and Q1
species, we also find a substantial number of Q2 and Q3. We find that the abundance
of Q2 and Q3 species decreases with decreasing temperature so that they may not be
detectable in the glass. The liquid also differs from the structure of crystalline phases
in having ZMg−O = 5.1, substantially less than that in the tetrahedrally coordinated
crystalline polymorphs (ZMg−O = 6), which accounts for the volume of melting.
The structure of the liquid remains distinct from that of crystalline phases at
elevated pressure. The Si-O (and Mg-O) coordination number of the liquid increases
monotonically with compression over the entire range studied, in sharp contrast to
that of the crystalline phases in which the coordination number remains ZSi−O = 4
up to the transformation of ringwoodite to perovskite + periclase near 24 GPa, where
it increases to ZSi−O = 6. Liquid structure is also distinct in that it shows an initial
increase in Si-O bond length on compression, which we attribute to the increase in
coordination number.
We suggest an alternative interpretation of the dynamic compression of forsterite
that is consistent with our computed Hugoniots, the shock temperature measure-
ments of Luo et al. (2004) and the pressure-volume data of Mosenfelder et al. (2007)
except the wadsleyite portion of shot #349. Dynamic loading of forsterite produces
incongruent melting to periclase and a more silica-rich liquid at 150 − 170 GPa. At
higher pressures, pure Mg2SiO4 liquid is present on the forsterite Hugoniot, while at
lower pressures, sub-solidus assemblages (PPv+Pe) are present on the Hugoniot.
This picture has important implications for the interpretation of the wadsleyite
Hugoniot (Mosenfelder et al., 2007) and of sound speed data (Brown et al., 1987a,b).
We find the wadsleyite Hugoniot to be 1000−1400 K colder than that of forsterite at
150−200 GPa. It is therefore likely that even the highest pressure wadsleyite point of
25
Mosenfelder et al. (2007) (shot #350) is either sub-solidus or only partially molten.
We therefore suggest that determination of a liquid phase value of the Gruneisen
parameter based on this datum should be treated with caution. While Mosenfelder
et al. (2007) find that the Gruneisen parameter increases on compression in the
liquid, in general agreement with the trend that we find, their value (2.6) is much
higher than our predictions. This discrepancy is explained if the measured portion of
the wadsleyite Hugoniot is less than completely molten. Our interpretation cannot
account for shot #349 on wadsleyite of Mosenfelder et al. (2007) which lies at much
lower pressures than all our computed Hugoniots. Sound speed measurements have
been interpreted to indicate melting on the forsterite Hugoniot above 150 GPa. The
measured value of the sound speed at 168 GPa (10.8 km.s−1) is considerably less than
what we find at the same pressure: 11.5 km.s−1 varying little with temperature from
3000 to 6000 K. The smaller experimental value may be due to incongruent melting:
a solid-liquid mixture with proportions varying as the shock front passes. Because
the experimental sample may be only partially molten, the value of the Gruneisen
parameter determined (2.1), which is substantially higher than our predicted value,
may not be representative of the liquid state. Indeed, at higher pressures (195 GPa)
the experimental sound velocity (12.2 km.s−1 (Brown et al., 1987a)) agrees well with
extrapolation of our results (12.4± 0.2 km.s−1), consistent with complete melting in
the shocked sample.
The behavior of the Gruneisen parameter that we calculate in the liquid - in-
creasing on compression - is contrary to that of all mantle crystalline phases, for
which the Gruneisen parameter decreases with compression (Figure 2.3). This be-
havior was first recognized in silicate liquids by Stixrude and Karki (2005), and has
also been found in studies of non-silicate liquids (Davis and Gordon, 1967; Knopoff
26
and Shapiro, 1970; Boehler and Kennedy, 1977; Vocadlo et al., 2003; Karki et al.,
2006). The increase of the Gruneisen parameter on compression in the liquid can
be understood as follows. While γ decreases with compression in crystalline phases,
it increases across pressure induced phase transitions associated with an increase in
Si coordination (Jeanloz and Roufosse, 1982) (Figure 2.3). Since the coordination
number increases gradually and continuously in the liquid, we expect the Gruneisen
parameter also to increase on compression as it adopts values characteristic of higher
coordinated states.
Increasing coordination is further expressed as a density crossover, providing fun-
damental insight into the contrasting behavior of complex liquids and solids upon
compression. Our results reveal the origin of olivine floatation in compositions
thought to be representative of an initial magma ocean (Stolper et al., 1981; Agee
and Walker, 1988; Ohtani, 1988; Trønnes and Frost, 2002). The density crossover
originates primarily in the structure of the liquid and occurs, even in forsterite com-
position, at 13 GPa along the solidus, where the Si-O coordination number of the
liquid is 4.4, greater than that in the crystal. In natural compositions the density
of the liquid will be further enhanced relative to that of coexisting solids by the
incompatibility of abundant heavy elements, such as Fe and Ca. The isochemical
density crossover that we find supports the notion that buoyantly stable silicate melt
may exist at the base of the olivine stability field in the mantle at 410 km depth
(Revenaugh and Sipkin, 1994).
The discrepancy between our melting curve and experimental data at low pres-
sures may be related to uncertainty in the ambient melting point of forsterite. To
illustrate, also shown in Figure 2.4 is an alternative melting curve obtained by us-
ing TM0 = 2140 K, which represents the lower bound of the quoted uncertainty for
27
the ambient melting temperature determined by Bowen and Andersen (1914). In-
tegration of the Clausius-Clapeyron equation (2.14) based on our results and this
value of TM0 improves agreement with the data of Davis and England (1964), while
maintaining agreement at high pressure with the data of Presnall and Walter (1993).
The failure of the Lindemann law to capture the change in slope of the melting
curve with pressure is not surprising, since it assumes that the structure of the liquid
remains constant along the melting curve (Ross, 1969). The changes in liquid struc-
ture that we find reduce the volume of the liquid relative to the Lindemann picture,
causing the melting slope to decrease rapidly with pressure. We thus reinforce the
overall conclusion of Wolf and Jeanloz (1984) that the Lindemann criterion should
not be used to extrapolate melting temperatures of mantle phases, although those
authors found good agreement in the case of forsterite between the Lindemann law
and the data of Ohtani and Kumazawa (1981), in notable contrast to other minerals
considered in their study, and with our findings.
The short lifetime of the Mg-O bond relative to that of the Si-O bond is consistent
with the smaller activation energy and higher self-diffusion coefficients found for Mg
compared to Si (Table 2.5). While our activation energy values are similar to those
obtained by Kubicki and Lasaga (1991), our finite size-corrected self-diffusion coef-
ficients are much larger. Conversely, our low pressure self-diffusion coefficients are
similar to results of Lacks et al. (2007), but the pressure dependence of their results
implies a higher activation volume (Figure 2.12). These previous simulations are
based on semi-empirical interatomic potentials, and differences likely reflect uncer-
tainties related to the construction of inter atomic force models in the earlier studies,
emphasizing the importance of our parameter free first principles simulations. No
experimental values of self-diffusion in forsterite liquid exist; data that have been
28
obtained are on more silica rich compositions. For example, the experimental value
of the activation energy for diffusion of silicon and oxygen in CaMgSi2O6 melt (Ku-
bicki et al., 1990; Reid et al., 2001), is much greater than our value for forsterite.
This difference may reflect the difference in silica content, and therefore fragility
(Angell, 1995) of forsterite versus diopside composition melts, as well as the lower
temperature range over which the experimental value is obtained.
2.6 Conclusions
Our First Principles Molecular Dynamics calculations for Mg2SiO4 liquid show
the Gruneisen parameter and thermal pressure coefficient increasing upon compres-
sion. Comparison of the liquid equation of state to that we calculate for forsterite
shows the presence of a density crossover at pressures of 12 − 17 GPa and temper-
atures of 2000 − 3500 K. Along the melting curve we determine by integration of
the Clausius-Clapeyron equation, the density crossover is found at 13 GPa, within
the stability field of forsterite. Comparison of our melting curve to an extrapolation
of the ambient melting temperature through the Lindemann law indicates that such
extrapolations for silicates cannot yield accurate results, due to significant differences
in structure between the liquid and the solid, and significant changes in liquid struc-
ture on compression, primarily expressed as a continuous increase in coordination and
polymerization. Comparison of the liquid equation of state to the available high pres-
sure shock wave data is consistent with partial melting along the forsterite Hugoniot
at pressures above 150 GPa, and complete melting at pressures above 170 GPa; and
sub-liquidus conditions on the wadsleyite Hugoniot up to the highest pressures mea-
sured to date (200 GPa). Liquid diffusivities increase with temperature and decrease
monotonically with pressure, and are found to be well described by the Arrhenian
29
relation.
2.7 Acknowledgements
This research was supported by the National Science Foundation under Grants
EAR-0409074 and EAR-0409121. Computing facilities were provided by CCT at
Louisiana State University.
30
Table 2.1: Equation of state fit parameters for equations 2.4-2.13.
Mg2SiO4 ForsteriteT0 (Kelvin) 3000 1000
V0 (cm3/mol) 57.8 (3) 44.8 (2)KT0 (GPa) 19 (3) 101 (7)
K ′T0 6.2 (5) 5.4 (7)
CV (VX) (NkB) 4.29 (3) 3.10 (2)C′
V 0.68 (16) 0.05 (8)γ(VX) 0.64 (6) 1.4 (2)
γ′ −1.2 (2) 1.8 (1.2)
31
Table 2.2: Comparison of liquid equation of state to experimental data at 2163 K, 0 GPa.
This study ExperimentV (cm3/mol) 53.55 53.5 (2)a
KT (GPa) 23 (8) 24.3 (1)b, 59c
K ′T 7 (1) 3.75c, 6.9d,†
α 10−6K−1 121 (50) 122 (7)a
CV (NkB) 4.4 (5) 3.7 (4)a,e,‡, 4.9 (3)a,f
γ 0.6 (1) 0.22 (4)a,f , 0.56 (3)a,b,f , 0.74 (4)a,b,e
a Lange (1997), b Ai and Lange (2008), c Bottinga (1985), d Rigden et al. (1989), e
Tangeman et al. (2001), f Stebbins et al. (1984)† K′
T for CaMgSi2O6 liquid‡ Supercooled liquid at 1040 − 1773 K
32
Table 2.3: Comparison of crystalline equation of state with experimental values computed from themodel of Stixrude and Karki (2005) at 1000 K, 0 GPa.
This study ExperimentV0 (cm3/mol) 44.8 (2) 44.5
K0 (GPa) 101 (7) 113.4 (2)K ′
0 5.4 (7) 4.6 (2)α 10−6K−1 44 (10) 35 (1)CV (NkB) 3.10 (3) 2.92 (3)
γ 1.1 (3) 1.0 (3)
33
Table 2.4: Comparison of simulated liquid structure to experimental data (Kohara et al., 2004).
This study ExperimentV/VX = 1.0; T = 1000 K P = 0 GPa; T = 300 K glass
dSi−O 1.63 A 1.63 AdMg−O 1.97 A 2.00 AZSi−O 4.1 4.1ZMg−O 5.1 5.0[4]Si0 22 % ∼ 50 %[4]Si1 38 % ∼ 50 %[4]Si2 21 % −[4]Si3 10 % −
34
Table 2.5: Self-diffusion coefficient Arrhenius relation fit parameters (equation 2.19).
D0∞ (10−9 m2/s) D0N (10−9 m2/s) Ea (kJ/mol) Va (cm3/mol)
Total 485 (70) 339 (49) 106 (5) 0.88 (7)Si 476 (108) 332 (76) 124 (8) 0.76 (9)Mg 359 (69) 251 (48) 87 (6) 1.00 (7)O 560 (85) 391 (59) 113 (6) 0.87 (8)
35
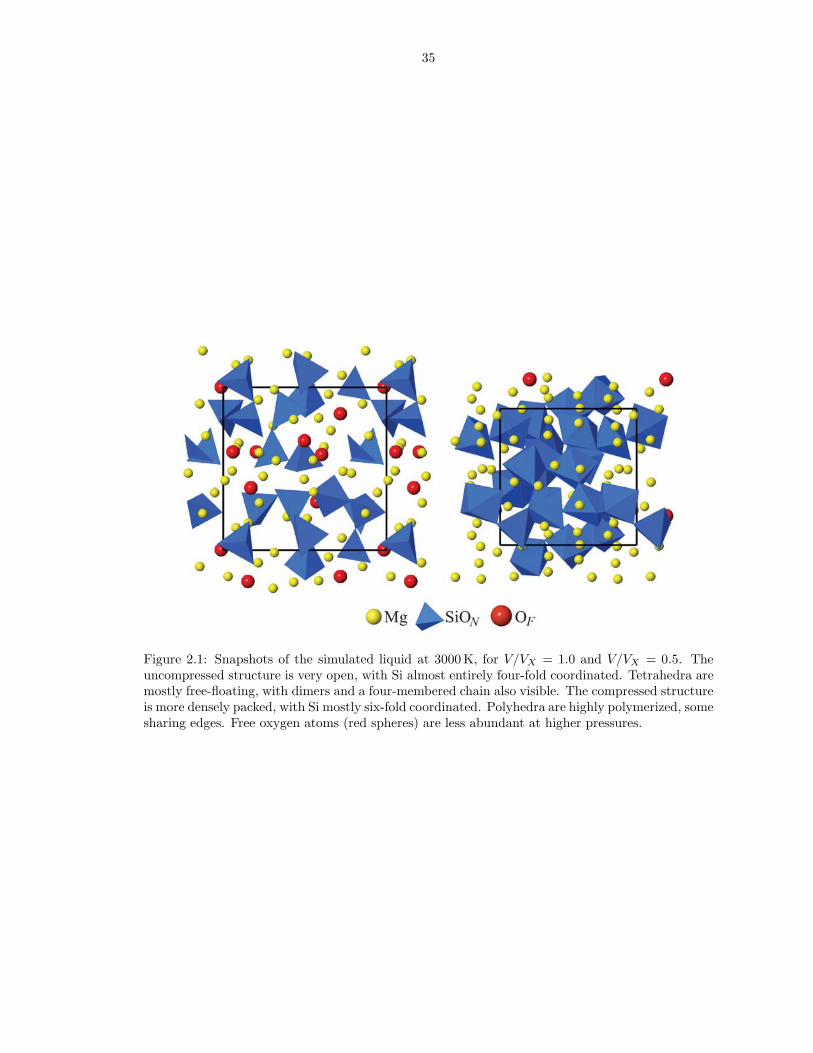
Figure 2.1: Snapshots of the simulated liquid at 3000 K, for V/VX = 1.0 and V/VX = 0.5. Theuncompressed structure is very open, with Si almost entirely four-fold coordinated. Tetrahedra aremostly free-floating, with dimers and a four-membered chain also visible. The compressed structureis more densely packed, with Si mostly six-fold coordinated. Polyhedra are highly polymerized, somesharing edges. Free oxygen atoms (red spheres) are less abundant at higher pressures.
36
0
25
50
75
100
125
150
175
200
Pres
sure
(G
Pa)
0.5 0.6 0.7 0.8 0.9 1.0 1.1 1.2
Volume (V/Vx)
0
20
40
0.7 0.8 0.9 1.0
3000K liquid
Figure 2.2: Equation of state of liquid Mg2SiO4. FPMD results are shown by the blue (3000 K),green (4000 K) and red (6000 K) circles, with the Mie-Gruneisen equation fit to these results shownby the colored lines. Note that the V/VX = 0.5; 3000 K point is a glass and not included in thefit. A thermal pressure coefficient that increases on compression results in isotherms divergingupon compression. (inset) FPMD equation of state of forsterite at 1000 K, 2000 K and 3000 K,results shown by squares, Mie-Gruneisen fit by solid blue lines. The broken line is the 3000 K liquidisotherm, which crosses the 3000 K forsterite isotherm close to V/VX = 0.8. The uncertainty in thepressure is similar to the size of the symbols.
37
CV
0.0
0.5
1.0
1.5
2.0
2.5
3.0
Grü
neis
en P
aram
eter
0.6 0.8 1.0 1.2
V/VX
M07
B87
LC87/S84
AL07/T01
3.0
3.5
4.0
4.5
5.0
(N
k B)
T01
S84Mg2SiO4 liquid
Forsterite
Pv+PeFo
Figure 2.3: (a) Isochoric heat capacity (CV ) and (b) Gruneisen parameter (γ) of liquid (red circles)and forsterite (green squares) as a function of volume. Blue curves show the linear fit for therespective properties (see text). At ambient conditions, CV falls between experimental estimatesdetermined by Stebbins et al. (1984) (S84) and Tangeman et al. (2001) (T01), while Tangemanet al. (2001), Ai and Lange (2008) (AL07/T01), and Stebbins et al. (1984), Lange (1997), Ai andLange (2008) (AL07/S84). While liquid γ values increase with compression, high pressure valuesare notably less than estimates from shock loading (M07, Mosenfelder et al., 2007; B87, Brownet al., 1987a. Forsterite (Fo) γ values are in excellent agreement with the values calculated fromexperimental data (dashed line; Stixrude and Lithgow-Bertelloni, 2005), while γ for an isochemicalassemblage of perovskite + periclase (Pv+Pe) (dotted line; Stixrude and Lithgow-Bertelloni, 2005)is higher by a value similar to the increasing trend in the liquid.
38
2100
2200
2300
2400
2500
2600
2700
2800T
empe
ratu
re (
K)
0 2 4 6 8 10 12 14 16
Pressure (GPa)
Forsterite Wa
Lindemann
OK81
DE64
A89
PW93
Mg2SiO4 liquid
Figure 2.4: First principles molecular dynamics melting curve for forsterite. The curve is obtainedby integrating the Clausius-Clapeyron equation (2.14), with the 0 GPa experimental melting point(Bowen and Andersen, 1914) of TM0 = 2163 K (thick black line) or TM0 = 2140 K (thick dot-dashedline) as integration constant. The grey envelope on either side of the 2163 K melting curve is basedon integration with the upper and lower bounds of uncertainty in volume and enthalpy (see text).The slope becomes negative around 13 GPa due to a density crossover of the liquid relative tostable forsterite. Experimental data of Ohtani and Kumazawa (1981) (OK81; circles), Presnall andWalter (1993) (PW93; inverted triangles), Davis and England (1964) (DE64; triangles) are shownfor observations of liquid (red symbols), crystal (blue symbols) and liquid-crystal coexistence (greensymbols). The forsterite-wadsleyite (Wa) transition (thin black line) is from Akaogi et al. (1989)(A89). The Lindemann law melting curve obtained from the root mean square displacement 〈urms〉in solid forsterite is also shown (dashed line).
39
MgSiO3 liquid
Mg2SiO4 liquid3.0
3.2
3.4
3.6
Den
sity
(g/
cm3 )
4 8 12 16
Pressure (GPa)
Forsterite
Anhydrous BPericlase
Figure 2.5: Density contrast expected during incongruent melting of forsterite. Contrasts arealong the calculated melting curve, between Mg2SiO4 and MgSiO3 liquids and the phases thatwill comprise the residual crystalline assemblage (Presnall and Gasparik, 1990). The density ofanhydrous B is estimated by ideal mixing of periclase (Karki et al., 2000a) and forsterite.
40
Figure 2.6: Theoretical Hugoniot for Mg2SiO4 liquid. Hugoniot curves calculated using the ther-modynamic model of Stixrude and Lithgow-Bertelloni (2005) for crystalline phase assemblages (Pv- perovskite; PPv - post perovskite; Pe - periclase; St - stishovite), as well as Mg2SiO4 liquid (thisstudy) and a partially molten mixture of Pe and MgSiO3 liquid (Stixrude and Karki, 2005), com-pared to the pressure-volume shock measurements for forsterite (Fo) and wadsleyite (Wa) (WA83- Watt and Ahrens, 1983; JA79 - Jackson and Ahrens, 1979; M07 - Mosenfelder et al., 2007 and topressure-temperature shock measurements of forsterite and olivine (Fo90) (Luo et al., 2004). Datapoint labels refer to the shot numbers assigned by Mosenfelder et al. (2007).
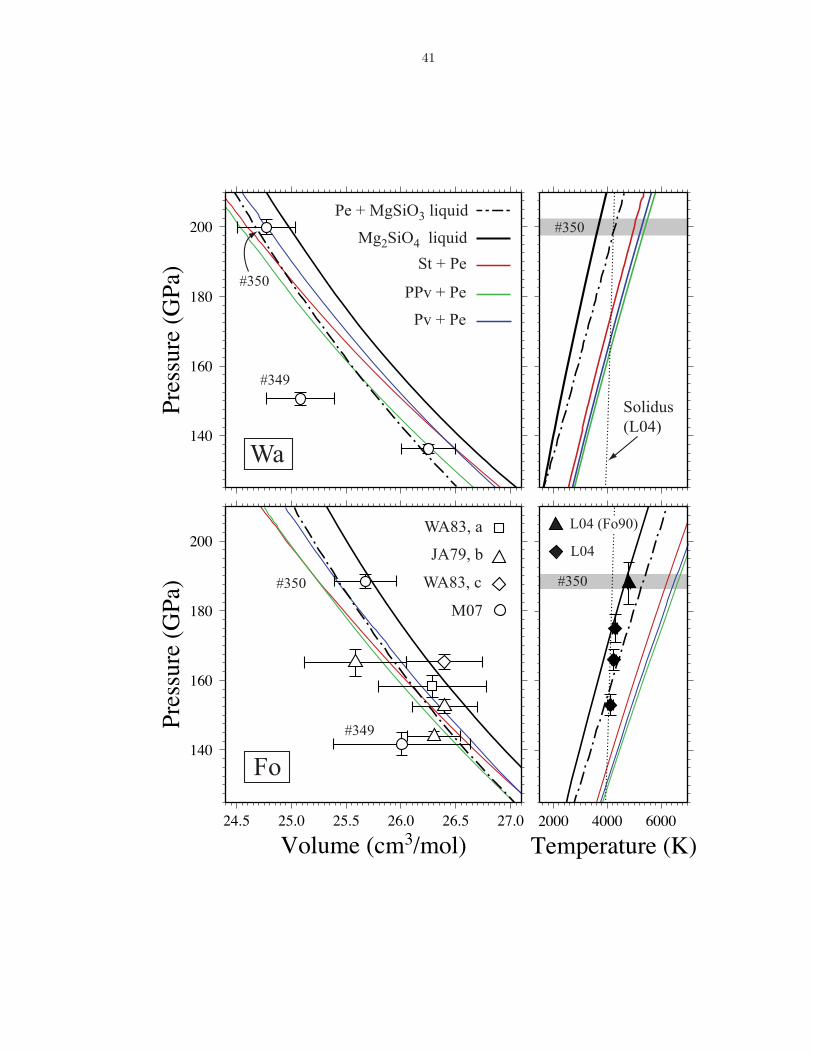
41
2000 4000 6000
Temperature (K)
#350
#350
Wa
#350
#349
Fo
#350
#349
WA83, a
JA79, b
WA83, c
M07
Mg2SiO4 liquid
Pe + MgSiO3 liquid
Pv + Pe
PPv + Pe
St + Pe
140
160
180
200
Pres
sure
(G
Pa)
24.5 25.0 25.5 26.0 26.5 27.0
Volume (cm3/mol)
140
160
180
200
Pres
sure
(G
Pa)
Solidus(L04)
L04
L04 (Fo90)
42
Mg
Si
(b)4
5
6
7
8
Coo
rdin
atio
n N
umbe
r
0.5 0.6 0.7 0.8 0.9 1.0 1.1 1.2
V/VX
Mg
Si
(a)1.6
1.7
1.8
1.9
2.0
Bon
d L
engt
h (Å
)0.5 0.6 0.7 0.8 0.9 1.0 1.1 1.2
V/VX
-0.58.216 3.8 0.43474160
P3000 K (GPa)-0.58.216 3.8 0.43474160
P3000 K (GPa)
Figure 2.7: (a) Si-O and Mg-O coordination, and (b) Si-O bond lengths as a function of volume.Temperature is indicated by the color of the symbols: 3000 K (blue), 4000 K (green) and 6000 K(red).
43
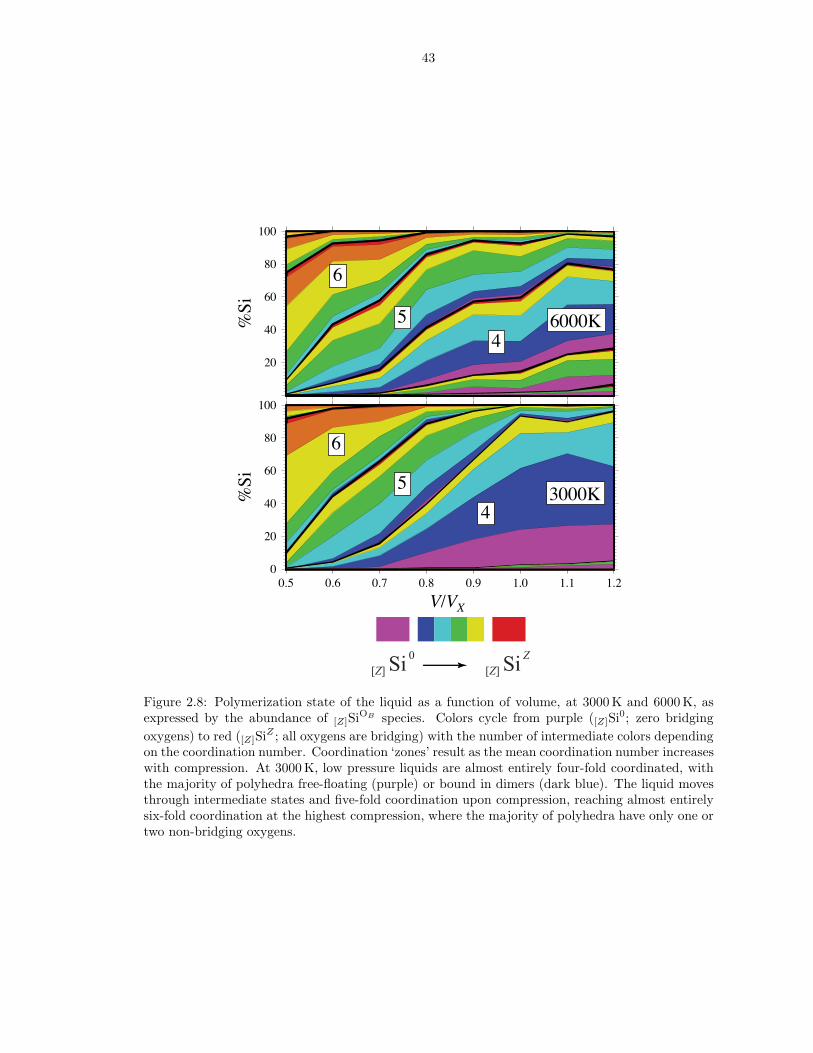
Si 0[Z] Si Z
[Z]
20
40
60
80
100%
Si
0
20
40
60
80
100
%Si
0.5 0.6 0.7 0.8 0.9 1.0 1.1 1.2
V/VX
6
6
5
4
54
3000K
6000K
Figure 2.8: Polymerization state of the liquid as a function of volume, at 3000 K and 6000 K, asexpressed by the abundance of [Z]SiOB species. Colors cycle from purple ([Z]Si0; zero bridgingoxygens) to red ([Z]SiZ ; all oxygens are bridging) with the number of intermediate colors dependingon the coordination number. Coordination ‘zones’ result as the mean coordination number increaseswith compression. At 3000 K, low pressure liquids are almost entirely four-fold coordinated, withthe majority of polyhedra free-floating (purple) or bound in dimers (dark blue). The liquid movesthrough intermediate states and five-fold coordination upon compression, reaching almost entirelysix-fold coordination at the highest compression, where the majority of polyhedra have only one ortwo non-bridging oxygens.
44
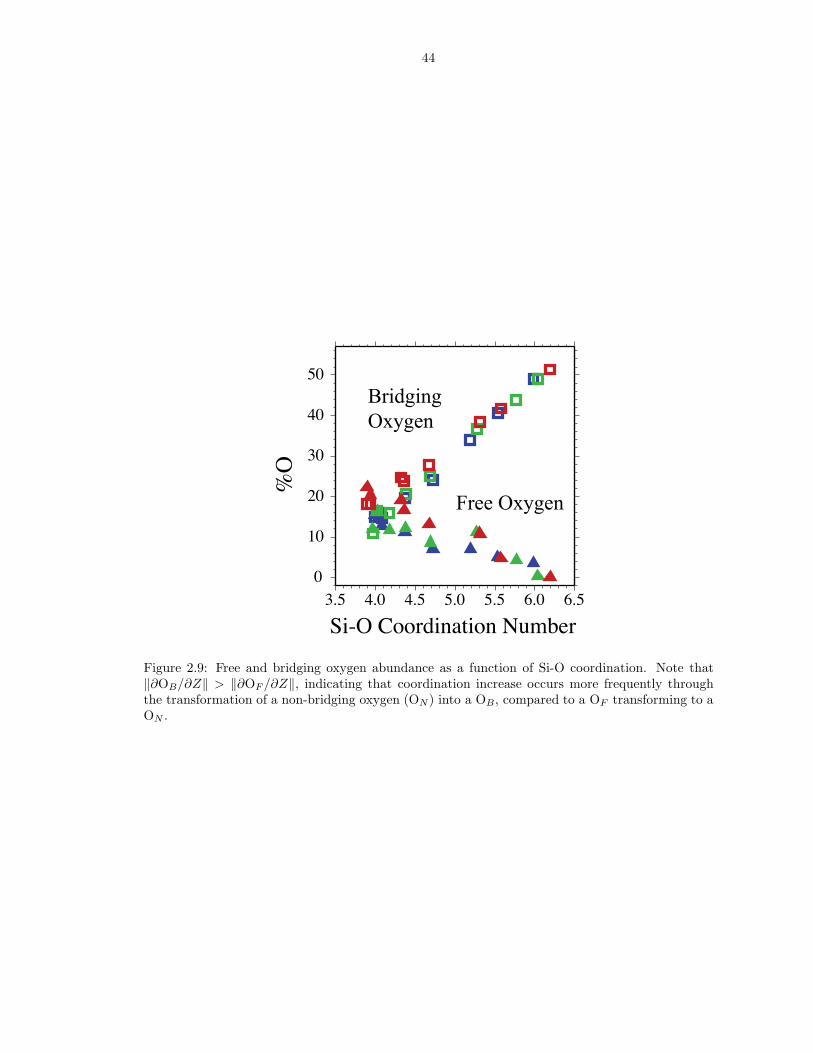
0
10
20
30
40
50
%O
3.5 4.0 4.5 5.0 5.5 6.0 6.5
Si-O Coordination Number
BridgingOxygen
Free Oxygen
Figure 2.9: Free and bridging oxygen abundance as a function of Si-O coordination. Note that‖∂OB/∂Z‖ > ‖∂OF /∂Z‖, indicating that coordination increase occurs more frequently throughthe transformation of a non-bridging oxygen (ON) into a OB, compared to a OF transforming to aON .
45
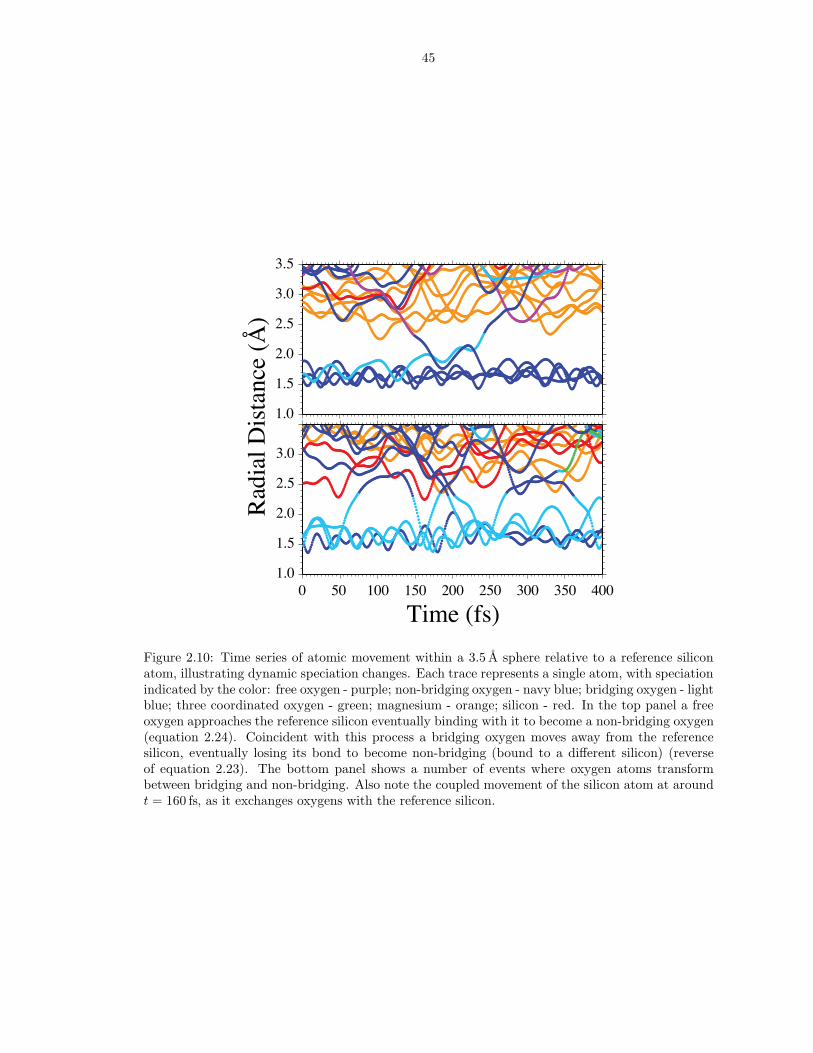
1.0
1.5
2.0
2.5
3.0
3.5R
adia
l Dis
tanc
e (Å
)
1.0
1.5
2.0
2.5
3.0
0 50 100 150 200 250 300 350 400
Time (fs)
Figure 2.10: Time series of atomic movement within a 3.5 A sphere relative to a reference siliconatom, illustrating dynamic speciation changes. Each trace represents a single atom, with speciationindicated by the color: free oxygen - purple; non-bridging oxygen - navy blue; bridging oxygen - lightblue; three coordinated oxygen - green; magnesium - orange; silicon - red. In the top panel a freeoxygen approaches the reference silicon eventually binding with it to become a non-bridging oxygen(equation 2.24). Coincident with this process a bridging oxygen moves away from the referencesilicon, eventually losing its bond to become non-bridging (bound to a different silicon) (reverseof equation 2.23). The bottom panel shows a number of events where oxygen atoms transformbetween bridging and non-bridging. Also note the coupled movement of the silicon atom at aroundt = 160 fs, as it exchanges oxygens with the reference silicon.
46
0
10
20
30
40
0
5
10
15
0
2
4
6
0 600 1200 1800 2400
Time (fs)
6000 K
4000 K
3000 K 1.0
0.9
0.8
0.6
0.7
1.0
0.9
0.8
0.7
0.6
0.5
1.0
0.9
0.8
0.7
0.6
0.5
<[r(t
)]2 > (
Å2 )
<[r(t
)]2 > (
Å2 )
<[r(t
)]2 > (
Å2 )
0.5
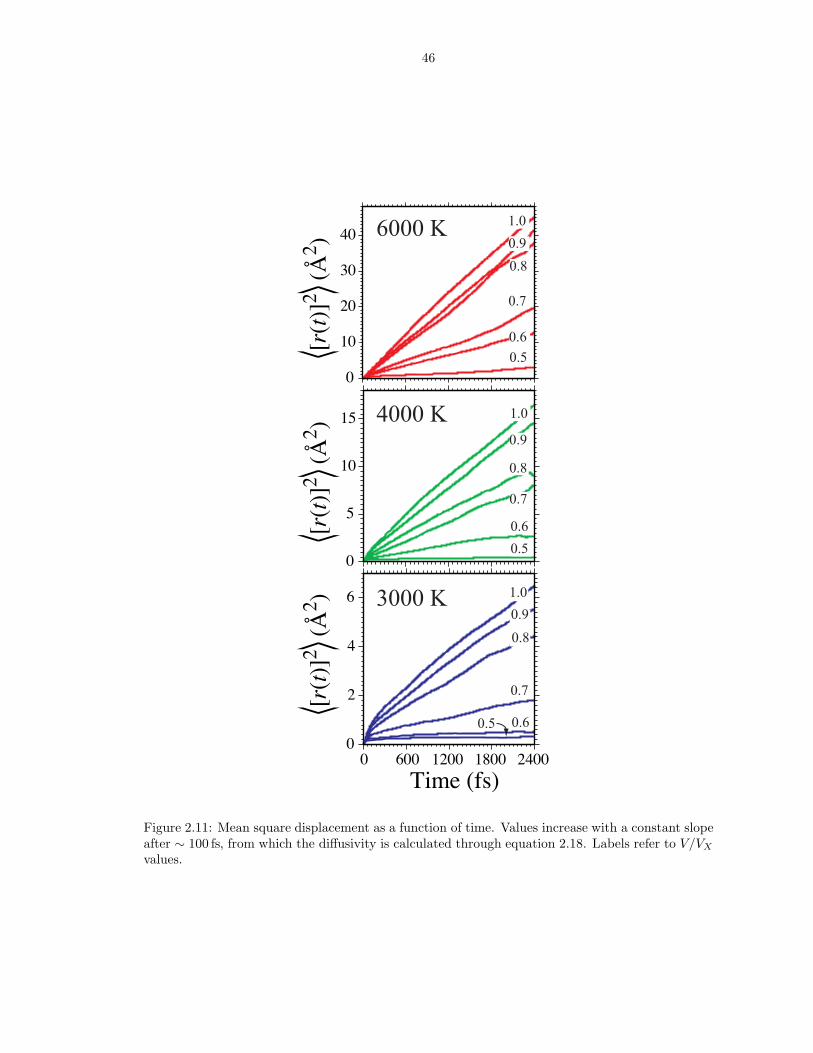
Figure 2.11: Mean square displacement as a function of time. Values increase with a constant slopeafter ∼ 100 fs, from which the diffusivity is calculated through equation 2.18. Labels refer to V/VX
values.
47
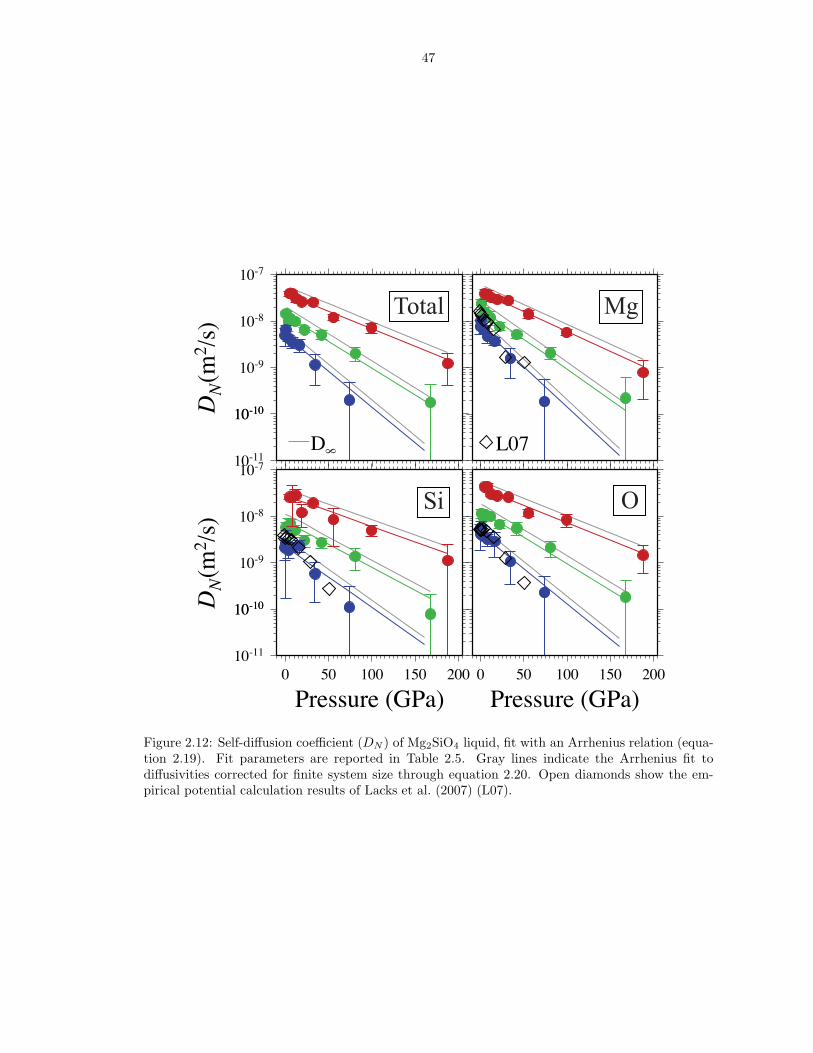
D 8
Total Mg
Si O
0 50 100 150 200
Pressure (GPa)
10-11
10-1010-10
10-9
10-8
10-7
DN
(m2 /
s)
0 50 100 150 200
Pressure (GPa)
10-11
10-1010-10
10-9
10-8
10-7
DN
(m2 /
s)
L07
Figure 2.12: Self-diffusion coefficient (DN ) of Mg2SiO4 liquid, fit with an Arrhenius relation (equa-tion 2.19). Fit parameters are reported in Table 2.5. Gray lines indicate the Arrhenius fit todiffusivities corrected for finite system size through equation 2.20. Open diamonds show the em-pirical potential calculation results of Lacks et al. (2007) (L07).
CHAPTER III
Self-Consistent Thermodynamic Description of Silicate
Liquids, with Application to Shock Melting of MgO Periclaseand MgSiO3 Perovskite
3.1 Abstract
We develop a self-consistent thermodynamic description of silicate liquids appli-
cable across the entire mantle pressure and temperature regime. The description
combines the finite strain free energy expansion with an account of the temperature
dependence of liquid properties into a single fundamental relation, while honoring
the expected limiting behavior at high volume and temperature. We find that the
fundamental relation describes well previous experimental and theoretical results for
liquid MgO, MgSiO3, Mg2SiO4 and SiO2. We apply the description to calculate
melting curves and Hugoniots of solid and liquid MgO and MgSiO3. For periclase,
we find a melting temperature at the CMB of 7360± 350 K, with the solid Hugoniot
crossing the melting curve at 344 GPa, 8880 K, and the liquid Hugoniot crossing at
452 GPa, 9170 K. For complete shock melting of periclase we predict a density in-
crease of 0.12 g/cm3 and a sound speed decrease of 2.3 km/s. For perovskite, we find
a melting temperature at the CMB of 5320 ± 210 K with the perovskite section of
the enstatite Hugoniot crossing the melting curve at 155 GPa, 5520 K, and the liquid
Hugoniot crossing at 242 GPa, 6290 K. For complete shock melting of perovskite
48
49
along the enstatite principle hugoniot, we predict a density increase of 0.10 g/cm3,
with a sound speed decrease of 2.6 km/s.
3.2 Introduction
Liquid state thermodynamics have long played a central role in the study of mantle
petrology and geochemistry. The chemical history of a terrestrial planet is intimately
tied to its thermal history through fractionation processes associated with cooling
of a magma ocean and melting of a solid mantle (Miller et al., 1991b; Ohtani, 1988;
Solomatov and Stevenson, 1993; Agee and Walker, 1993; Ohtani and Sawamoto,
1987). Furthermore, seismic observations suggest the presence of partial melt atop
the 410 km discontinuity, (Revenaugh and Sipkin, 1994; Song et al., 1994) and at
the base of the mantle (Williams and Garnero, 1996; Revenaugh and Meyer, 1997;
Garnero and Helmberger, 1995). Accurate estimates of the solidus temperature of
the mantle at those depths can thus provide key constraints on the composition and
geothermal profile of the mantle. Decompression melting close to the free surface
is responsible for the mafic and ultramafic igneous rocks that, together with mantle
xenoliths, provide our most direct chemical observations of the Earth’s deep interior.
Accurate estimates of the equations of state and phase equilibria of melts constrain
the pressures at which melting primarily occurs (Asimow et al., 1995; McKenzie and
Bickle, 1988) and the depth limits from which melts can reach the surface (Agee and
Walker, 1988, 1993; Stolper et al., 1981; Rigden et al., 1989; de Koker et al., 2008a).
While the equations of state of many solid mantle phases have been measured
to lower mantle pressures (Stixrude and Lithgow-Bertelloni, 2005, and references
therein), the experimental study of silicate liquids remains challenging, even at low
pressures (Shen and Lazor, 1995; Rigden et al., 1989; Lange and Carmichael, 1987;
50
Lange and Navrotsky, 1992; Ai and Lange, 2008). First principles molecular dynam-
ics (FPMD) studies (Stixrude and Karki, 2005; Karki et al., 2006, 2007; de Koker
et al., 2008a; Wan et al., 2007; Sun, 2008; Trave et al., 2002; Laudernet et al., 2004)
have recently focused on silicate liquids at pressures and temperatures relevant to the
full extent of the Earth’s mantle, and revealed rich structural and thermodynamic
compressional behavior. Thermodynamic properties were found to be significantly
different from those of solids: the isochoric heat capacity (CV ) is generally larger
than the high temperature limit seen in solids (3 NkB) and varies significantly on
compression; the Gruneisen parameter (γ) increases with compression, whereas it
always decreases during isostructural compression of solids.
In this study, we develop a self consistent thermodynamic description of liquid
state thermodynamics relevant to silicate liquids at pressures and temperatures char-
acteristic of mantles and magma oceans associated with terrestrial planets. We apply
our thermodynamic formalism to the description of FPMD results, using these as
a guide to the functional forms and the relevant physics. In addition, we derive an
anharmonic fundamental relation for solids at high temperature (i.e. in the classical
limit), which we combine with the liquid descriptions to obtain melting curves and
theoretical Hugoniot loci for MgO periclase and MgSiO3 perovskite.
3.3 Previous Work
PV T equations of state were first described for the ideal gas (Boyle, 1662; Clapey-
ron, 1834). This equation of state treats particles as independent, and is thus unable
to describe the liquid-vapor transition. At high pressures, this relation is commonly
applied to stellar interiors (Chandrasekhar, 1939; Phillips, 1994), but it does not
capture the comparative incompressibility of terrestrial materials such as silicate liq-

51
uids at the conditions characteristic of planetary interiors. Subsequent Van der Waals
(van der Waals, 1873) and Redlich-Kwong (Redlich and Kwong, 1949) equations were
formulated to capture critical behavior and the liquid-vapor transition, but are only
valid close to ambient conditions, predicting very incompressible behavior at higher
pressure. Modified Redlich-Kwong forms (Brodholt and Wood, 1993; Halbach and
Chatterjee, 1982; Holland and Powell, 1991) address this problem, but require many
free parameters to constrain. Similarly, other empirical and semi-empirical forms,
developed primarily for interpolation of large datasets of liquid and gas thermo-
dynamic properties (Pitzer and Sterner, 1994; Belonoshko and Saxena, 1992; Span
and Wagner, 1997), also require large numbers of free parameters with consequent
poor extrapolation and unphysical oscillations in thermodynamic properties. None
of these existing forms are thus able to capture the essentials of silicate liquids over
a geophysically interesting pressure range with sufficiently few free parameters.
The Thomas-Fermi model (Slater and Krutter, 1935; Feynman et al., 1949; Mar-
shak and Bethe, 1940) gives an approximate description of the equation of state at
very high pressures, based on a simplified model of the electronic charge density. It
has been successfully applied to stellar and gas giant interiors, but is too approxi-
mate to offer detailed insight into the behavior of materials within the Earth’s interior
(Knopoff and Uffen, 1954; Birch, 1952). In high pressure hydrodynamic simulations
these problems are remedied to some extent by the quotidian equation of state (More
et al., 1988; Young and Corey, 1995), but it assumes a number of simplifying rela-
tionships, in particular the Dulong-Petit law and the Lindemann law, which have
been shown not to hold for silicate melts (Stixrude and Karki, 2005; Karki et al.,
2007; de Koker et al., 2008a; Jeanloz and Roufosse, 1982; Stebbins et al., 1984).
Experimental studies of the equation of state of silicate liquids have been almost
52
entirely limited to ambient and uppermost mantle pressures (Lange and Carmichael,
1987; Lange, 1997; Courtial et al., 1997; Ai and Lange, 2008; Agee and Walker, 1988,
1993; Bottinga, 1985), with only a few shock loading and multi-anvil measurements
giving insight into the equation of state at pressures characteristic of the lower mantle
(Mosenfelder et al., 2007; Rigden et al., 1984, 1989; Chen et al., 2002; Miller et al.,
1991a; Suzuki and Ohtani, 2003; Sakamaki et al., 2006; Matsukage et al., 2005).
These results have shown that simple polynomial descriptions of P (V, T ) or V (P, T )
(Ghiorso and Sack, 1995) are inadequate at high pressure (Ghiorso, 2004). The Birch-
Murnaghan equation of state (Birch, 1952, 1978) has been widely used (Lange, 2003,
2007; Ghiorso et al., 2002; Rigden et al., 1989; Sakamaki et al., 2006; Matsukage
et al., 2005; Suzuki and Ohtani, 2003), but more high pressure data are needed to
test its validity, while its suitability for silicate liquids has been questioned on a
theoretical basis (Hofmeister, 1993; Ghiorso, 2004).
A key issue which has not been carefully addressed, is the thermal contribution to
the liquid equation of state. In describing the temperature and pressure dependence
of a material simultaneously, great care must be taken to preserve thermodynamic
self consistency (Ghiorso et al., 2002; Ghiorso, 2004; Dorogokupets, 2000; Pavese,
2002; Ai and Lange, 2008). The main goal of the work presented here is to derive
a thermodynamic treatment of silicate liquids which self consistently describes their
pressure and temperature dependence.
3.4 Fundamental Thermodynamic Relations
We obtain an expression for the Helmholtz free energy
(3.1) F = F (V, T ),
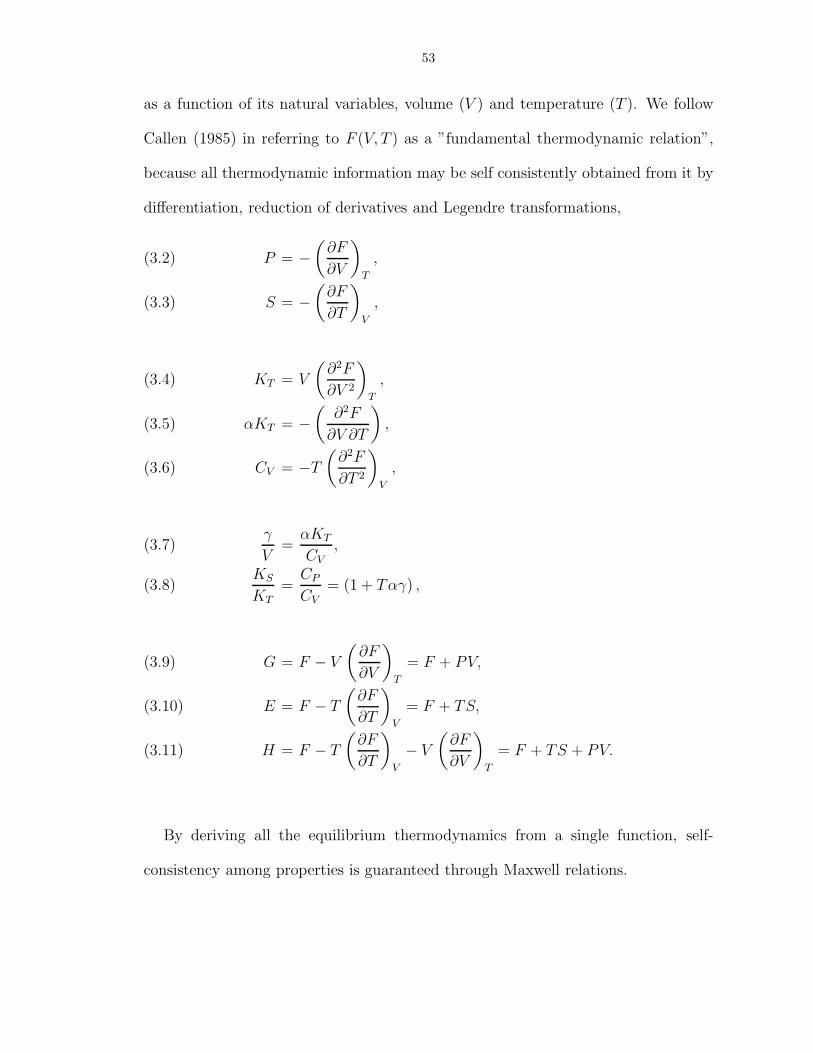
53
as a function of its natural variables, volume (V ) and temperature (T ). We follow
Callen (1985) in referring to F (V, T ) as a ”fundamental thermodynamic relation”,
because all thermodynamic information may be self consistently obtained from it by
differentiation, reduction of derivatives and Legendre transformations,
P = −(
∂F
∂V
)T
,(3.2)
S = −(
∂F
∂T
)V
,(3.3)
KT = V
(∂2F
∂V 2
)T
,(3.4)
αKT = −(
∂2F
∂V ∂T
),(3.5)
CV = −T
(∂2F
∂T 2
)V
,(3.6)
γ
V=
αKT
CV,(3.7)
KS
KT=
CP
CV= (1 + Tαγ) ,(3.8)
G = F − V
(∂F
∂V
)T
= F + PV,(3.9)
E = F − T
(∂F
∂T
)V
= F + TS,(3.10)
H = F − T
(∂F
∂T
)V
− V
(∂F
∂V
)T
= F + TS + PV.(3.11)
By deriving all the equilibrium thermodynamics from a single function, self-
consistency among properties is guaranteed through Maxwell relations.
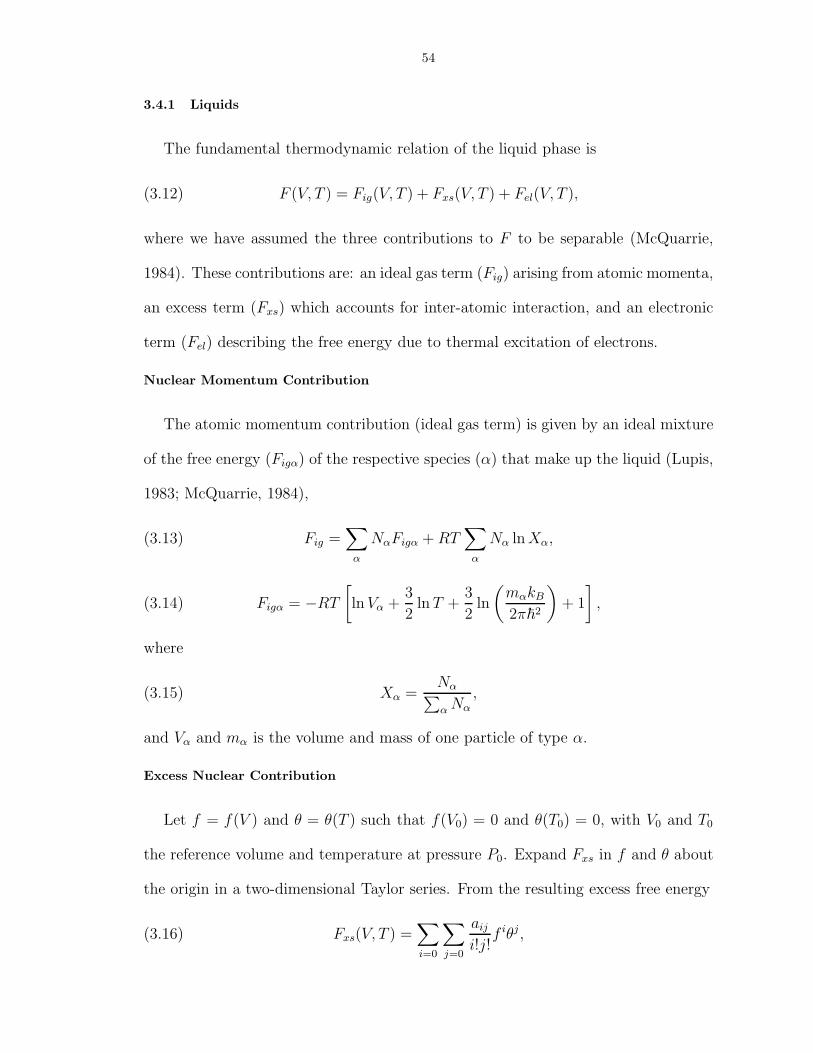
54
3.4.1 Liquids
The fundamental thermodynamic relation of the liquid phase is
(3.12) F (V, T ) = Fig(V, T ) + Fxs(V, T ) + Fel(V, T ),
where we have assumed the three contributions to F to be separable (McQuarrie,
1984). These contributions are: an ideal gas term (Fig) arising from atomic momenta,
an excess term (Fxs) which accounts for inter-atomic interaction, and an electronic
term (Fel) describing the free energy due to thermal excitation of electrons.
Nuclear Momentum Contribution
The atomic momentum contribution (ideal gas term) is given by an ideal mixture
of the free energy (Figα) of the respective species (α) that make up the liquid (Lupis,
1983; McQuarrie, 1984),
(3.13) Fig =∑
α
NαFigα + RT∑
α
Nα ln Xα,
(3.14) Figα = −RT
[ln Vα +
3
2ln T +
3
2ln
(mαkB
2π�2
)+ 1
],
where
(3.15) Xα =Nα∑α Nα
,
and Vα and mα is the volume and mass of one particle of type α.
Excess Nuclear Contribution
Let f = f(V ) and θ = θ(T ) such that f(V0) = 0 and θ(T0) = 0, with V0 and T0
the reference volume and temperature at pressure P0. Expand Fxs in f and θ about
the origin in a two-dimensional Taylor series. From the resulting excess free energy
(3.16) Fxs(V, T ) =∑i=0
∑j=0
aij
i!j!f iθj ,
55
follows
(3.17) Pxs(V, T ) = − ∂f
∂V
∑i=0
∑j=0
iaij
i!j!f i−1θj ,
(3.18) Sxs(V, T ) = − ∂θ
∂T
∑i=0
∑j=0
jaij
i!j!f iθj−1,
(3.19) Exs(V, T ) =∑i=0
∑j=0
aij
i!j!f iθj−1
(θ − jT
∂θ
∂T
).
(3.20) KTxs(V, T ) = V∑i=0
∑j=0
iaij
i!j!θj
[(∂2f
∂V 2
)f i−1 +
(∂f
∂V
)2
(i − 1)f i−2
]
(3.21) αKTxs(V, T ) = −(
∂f
∂V
) (∂θ
∂T
) ∑i=0
∑j=0
ijaij
i!j!f i−1θj−1
(3.22) CV xs(V, T ) = −T∑i=0
∑j=0
jaij
i!j!f i
[(∂2θ
∂T 2
)θj−1 +
(∂θ
∂T
)2
(j − 1)θj−2
]
We follow Birch (1952) and choose
(3.23) f =1
n
[(V0
V
)n3
− 1
],
which reduces to the Eularian finite strain for n = 2. For T = T0, Equation 3.17
reduces to the Birch-Murnaghan equation of state.
By describing the thermal variable as
(3.24) θ =
[(T
T0
)m
− 1
],
the internal energy (Equation 3.19) becomes
(3.25) Exs(V, T ) =∑i=0
∑j=0
aij
i!j!f iθj−1
[(T
T0
)m
− 1
]j−1 [(T
T0
)m
(1 − jm) − 1
],
which after rearrangement of terms, may be summarized as
(3.26) Exs(V, T ) =∑j=0
bj(f)T jm,
where the coefficients bj are polynomials in f that contain the excess free energy
expansion coefficients aij .
56
Thermal Electronic Contribution
In a simple metallic system, the electronic heat capacity is (Wallace, 2002)
(3.27) CcondV el (V, T ) =
π2
3n(εf )kBT,
where n(εf ) is the electronic density of states at the Fermi level, εf .
Silicate liquids are known to become conductive at high temperatures (Hicks et al.,
2006). Thus we adapt Equation 3.27 to apply only above the temperature of onset
(Tel) where the liquid becomes conductive
(3.28) CV el(V, T ) =
⎧⎪⎨⎪⎩
β(V ) [T − Tel(V )] T ≥ Tel
0 T < Tel
.
With the electronic entropy (Sel) and free energy (Fel) zero at Tel, integration
yields
(3.29) Sel = β
[T − Tel − Tel ln
T
Tel
],
(3.30) Fel = −β
[1
2
(T 2 − T 2
el
) − TTel lnT
Tel
],
from which the electronic energy (Eel) and pressure (Pel) follow as
(3.31) Eel =1
2β [T − Tel]
2 ,
(3.32) Pel =∂β
∂V
[1
2
(T 2 − T 2
el
) − TTel lnT
Tel
]+ β
∂Tel
∂V
[(T − Tel) − T ln
T
Tel
].
The volume dependence of β and Tel is described by a power law relation
(3.33) β = β0
(V
V0
)ξ
,
(3.34) Tel = Tel0
(V
V0
)η
.
57
Limiting Behavior
The liquid relation is designed such that the infinite temperature and volume
limits capture the expected material properties at those conditions, given suitable
values of n and m. Limiting values of the excess properties, derived from Equations
3.17-3.22 are summarized in Table 3.1. Total values follow from addition of ideal gas,
excess and thermal electronic terms, with the exception of the Gruneisen parameter,
which is not additive.
Also, the non-electronic portion of the liquid relation captures the physics of the
liquid-vapor transition at moderately high volumes. The power law parameterization
of volume dependence in the thermal electronic contribution does not capture the
limiting behavior of Fel as V → ∞.
3.4.2 Solids at High Temperature
We follow previous studies (Stixrude and Lithgow-Bertelloni, 2005; Stixrude and
Bukowinski, 1990a) and describe the solid by
(3.35) F = F0 + Fcmp + Fth,
with the assumption that the various contributions to F are separable. F0 is the free
energy at reference volume (V0) and temperature (T0), Fcmp and Fth are the compres-
sional and thermal contributions to the free energy, respectively. The contribution
due to atomic momentum (Fig) is negligible, and the thermal electronic contribution
(Fel) is zero for silicate minerals.
Fcmp is expressed as an expansion in terms of the Eularian finite strain (f) (Birch,
58
1952, 1978)
Fcmp = 9KT0V0
[1
2f 2 +
1
6a3f
3 +1
24a4f
4 + · · ·]
,(3.36)
a3 = 3 (K ′T0 − 4) ,(3.37)
a4 = 9 [KT0K′′T0 + K ′
T0 (K ′T0 − 7)] + 143,(3.38)
f =1
2
[(V0
V
) 23
− 1
].(3.39)
The familiar form of the Birch-Murnaghan equation of state follows as the isothermal
volume derivative of Equation 3.36. V0, KT0, K ′T0, and K ′′
T0 are the volume, bulk
modulus, and its frst and second pressure derivatives at zero pressure and a reference
temperature (T0).
Fth is obtained by integration of the entropy
(3.40) Fth = −∫ T
T0
S(V, T ′)dT ′,
with the entropy obtained as
(3.41) S(V, T ) = S(V0, T0) +
∫ V
V0
αKT (V ′, T0)dV ′ +∫ T
T0
CV (V, T ′)T ′ dT ′,
with
(3.42) αKT =CV γ
V.
CV is taken as constant, although its value is not constrained to allow for anhar-
monicity. Through the Maxwell relation
(3.43)1
T
(∂CV
∂V
)T
=1
V
(∂CV γ
∂T
)V
,
CV independent of V and T implies that γ is independent of T . We describe γ(V )
as
(3.44) γ = γ0 + γ1V−n/3 + γ2V
−2n/3,
59
which follows from
(3.45) γ = γ′0 + γ′
1f + γ′2f
2,
a form akin to Equation 44 of Stixrude and Lithgow-Bertelloni (2005).
Fth now follows as
Fth(V, T ) = −S0 [T − T0] − CV
[T ln
T
T0− [T − T0]
]
−CV
[γ0 ln
(V
V0
)− 3
nγ1(V
−n3 − V
−n3
0 )
− 3
2nγ2(V
− 2n3 − V
− 2n3
0 )
][T − T0] ,(3.46)
Applying Equations 3.2, 3.3 and 3.10 to Equation 3.35, we have
E(V, T ) = E0 + 9KT0V0
[1
2f 2 +
1
6a3f
3 +a4
24f 4 + · · ·
]+ CV [T − T0]
+T0CV
[γ0 ln
(V
V0
)− 3
nγ1(V
−n3 − V
−n3
0 ) − 3
2nγ2(V
− 2n3 − V
− 2n3
0 )
],(3.47)
P (V, T ) = 3KT0(1 + 2f)52
[f +
a3
2f 2 +
a4
6f 3 + · · ·
]+CV
[γ0
V+ γ1V
− (n+3)3 + γ2V
− (2n+3)3
][T − T0] .(3.48)
3.5 First Principles Molecular Dynamics Simulations
To test the solid and liquid fundamental relations, we use FPMD simulation results
for MgO periclase, MgSiO3 perovskite (Stixrude and Karki, 2005), as well as liquid
MgO (Karki et al., 2006), MgSiO3 (Stixrude and Karki, 2005), Mg2SiO4 (de Koker
et al., 2008a) and SiO2 (Karki et al., 2007). With the application to shock melting
in mind, we supplement the MgSiO3 and MgO liquid data of Stixrude and Karki
(2005) and Karki et al. (2006) at high pressures. These systems are melted at higher
60
temperatures (8000 K and 15000 K, respectively), and then cooled isochorically as
in previous calculations. Mg2SiO4 and MgSiO3 liquid simulations at 2000 K are also
added to improve constraints at ambient pressure.
Our computational technique is described in detail in our previous work, and we
only highlight a few salient points here. FPMD simulations based on DFT (Ho-
henberg and Kohn, 1964; Kohn and Sham, 1965) are performed as implemented in
the VASP plane-wave code (Kresse and Furthmuller, 1996), using pseudopotentials
(Kresse and Hafner, 1994), the local density approximation (LDA, Ceperley and
Alder (1980)) and a single k-point at the Brillouin zone center (Γ). Systems consist
of 64 (MgO liquid and periclase), 112 (Mg2SiO4 liquid), 80 (MgSiO3 liquid and per-
ovskite) and 72 atoms (SiO2 liquid) in a periodic simulation cell. The cell is cubic
for liquid simulations, with solid cell dimensions adjusted to obtain a hydrostatic
stress tensor. Simulations are performed in the canonical ensemble (constant NV T )
through the use of a thermostat (Nose, 1984). We use a time increment of 1.0 fs and
run durations of at least 3000 fs, sufficient for converged values of the pressure and
internal energy, the mean values of which are obtained using the blocking method
(Flyvberg and Petersen, 1989).
The pressure is adjusted to correct for the finite basis set (Francis and Payne,
1990) and overbinding of the LDA (Karki et al., 2001; Oganov et al., 2001b). Be-
cause atomic motion is entirely classical at all temperatures (Allen and Tildesley,
1987), energy values do not capture the quantum effects characteristic of atomic vi-
brations at low temperature in solids, and are thus only physical in the limit of high
temperatures. Quantum corrections can be applied (Wigner, 1932; Kirkwood, 1933;
Oganov et al., 2001a), but our interest here is in solids close to melting where such
corrections will be negligible.
61
The electronic entropy is obtained from the electronic eigenvalues (ε) as (Kresse
and Furthmuller, 1996; Mermin, 1965)
(3.49) SDFTel = −2kB
∑i
[φ(εi) ln φ(εi) + [1 − φ(εi)] ln [1 − φ(εi)]] ,
where
(3.50) φ(εi) =1
eβ(εi−εf ) + 1
is the Fermi-Dirac distribution function, with β = kBT . The Fermi energy (εf ) is
determined by the number criterion.
We stress that our FPMD simulations do not give information on the value of
the entropy. S0 must be constrained by additional information. In liquids it is
obtained by specifying the free energy of the coexisting solid at a fixed melting
point, chosen from the available experimental estimates. For solids, S0 may be found
from the vibrational density of states, which we obtain here using an experimental
implementation of the Debye approximation which partially accounts for intrinsic
anharmonicity (Stixrude and Lithgow-Bertelloni, 2005). However, E, H , P and all
second and higher order derivatives may be derived without knowing the value of S0;
it is only needed for values of the entropy (S) and free energy (F and G), properties
crucial to phase equilibria calculations.
To perform the fit for the liquid, the order to which the excess free energy is
expanded must be determined and n and m specified. We denote the respective
orders of expansion in f and θ as Of and Oθ. Considering its overwhelming success
in fitting and extrapolating high pressure equations of state, we adopt the Eularian
finite strain in our description for melts as well, i.e. we use n = 2. Similarly, the
correct limiting behavior as T → ∞ requires m < 1 for Oθ = 1 and m < 1/2 for
62
Oθ = 2. The value of m is therefore allowed to vary based on the composition and
the value of Oθ required to fit the data.
To constrain the liquid relation, electronic entropy is fit to Equation 3.29, with
the subsequent Eel and Pel removed from the total E and P values to obtain the
excess values. Exs and Pxs are fit to Equations 3.19 and 3.17 in a single least squares
inversion to constrain coefficients aij , which in turn are related to physical proper-
ties at the reference pressure (P0) and temperature (T0) (Equations A.5-A.19). To
minimize the number of free parameters, we explicitly exclude coefficients that do
not notably improve the fit.
The free parameters which describe the solid - E0, CV , γ0, γ1, γ2, K0, K ′0 - are
similarly determined by inversion of the total E and P from FPMD to Equations
3.47 and 3.48.
3.6 Results
3.6.1 Liquids
Consistent with the conclusions in the original studies, we find that MgO, Mg2SiO4
and MgSiO3 liquid equations of state are sufficiently described with a third order
finite strain expansion (Of = 3), while SiO2 requires a fifth order expansion (Of = 5)
(Figures 3.1-3.4). Values of m that optimize the first (Oθ = 1) and second (Oθ = 2)
order fits to the FPMD data, are noted in Table 3.2. The quality of the optimal
Oθ = 1 fit is only sufficient in the case of MgO, and marginally so for Mg2SiO4.
High temperature low density points are poorly accounted for in all three silicate
compositions, with the misfit increasing with SiO2 content. These discrepancies are
remedied using Oθ = 2. However, in SiO2 the Oθ = 2 fit is significantly further
improved when excluding the T = 6000 K, V/VX = 0.8, 0.9 and 1.0 points (white
circles in Figure 3.4). These points are at pressures below 15 GPa, where 6000 K is
63
of less geophysical importance.
For the Of = 3 cases, we find that allowing a31 to vary as a free parameter
improves the Of = 3, Oθ = 1 fits notably, as does including a31, a22, and a32 for
Oθ = 2. In contrast, a51, a42, and a52 does not improve the SiO2 fit to a meaningful
extent, and are thus explicitly excluded to reduce the number of free parameters.
Thermodynamic properties at ambient pressure for the respective liquids are com-
pared to previous experimental and theoretical estimates in Tables 3.3 - 3.6. Only
partial molar experimental data for MgO liquid is available, and we mostly compare
to previous theoretical estimates. Equation of state parameters differ slightly from
those of Karki et al. (2006), because all the data are used in obtaining the equation
of state fit. The added simulations at 2000 K for Mg2SiO4 and MgSiO3 enable us to
draw a direct comparison to experimental data collected at 1773 K. As with MgO,
the 3000 K equation of state parameters parameters of SiO2 also differ somewhat
from those obtained by Karki et al. (2007). Notable discrepancies with α, CV , and
CP likely result from the large thermal extrapolation. Uncertainties in each thermo-
dynamic property is estimated by repeated fitting to a Monte-Carlo perturbation of
the simulation data, constrained by its error estimates. Changes in CV and γ with
compression are shown in Figure 3.5.
The ability of the liquid relation to capture the thermodynamics of the liquid-
vapor transition is illustrated by extrapolating the Mg2SiO4 3000 K isotherm to very
large volumes (Figure 3.6). We ignore the thermal electronic contribution here,
as it will likely vanish at these large volumes. The extrapolation yields a liquid-
vapor coexistence pressure of 0.13 GPa, and a heat of vaporization of 1420 kJ/mol,
comparible to the heat of vaporization of forsterite used in giant impact studies (Benz
et al., 1989; Canup, 2004).
64
3.6.2 Solids
A third order finite strain expansion is sufficient to fit the periclase simulations up
to a compression ratio of V/VX = 0.45, but we find that a fourth order expansion is
required to account for the points at higher pressures (Figure 3.7). Thermodynamic
parameters at ambient pressure and reference temperature compare favorably with
values from experiment and previous theoretical calculations (Table 3.7). Compar-
ison of γ at high pressure with experiment and theory are also good (Figure 3.7,
inset).
As found by Stixrude and Karki (2005), a third order finite strain expansion is
sufficient to fit the perovskite results, including the added data points at V/VX = 0.4
(Figure 3.8). Comparison of 0 GPa thermodynamic parameters to previous FPMD
results is excellent (Table 3.8). The compressional decrease of γ compares reasonably
with previous first principles estimates (Oganov et al., 2001a; Karki et al., 2000b)
(Figure 3.8, inset).
3.7 Applications
To illustrate the power of our method, we compute ambient pressure thermody-
namic properties as well as high pressure melting curves and Hugoniots for MgO
periclase and MgSiO3 perovskite (enstatite unshocked state), and the corresponding
liquid phases. Our aim is to obtain a direct comparison of our simulation results to a
broad range of low pressure measurements and high pressure shock loading data and
make predictions of trends to expect where measurements have not yet been made.
Melting curves are obtained by finding the loci of pressure and temperature where
solid and liquid Gibbs free energies correspond. As we use a reference melting tem-
perature to constrain the liquid free energy from that of the solid, this approach is
65
equivalent to integration of the Clapeyron equation, with integration done analyti-
cally rather than numerically.
For a given volume (Vh) or density (ρh), the theoretical Hugoniot state is given
by the temperature (Th) at which the pressure (Ph) and internal energy (Eh) satisfy
the Rankine-Hugoniot relation,
(3.51) (Eh − Er) = −1
2(Ph + Pr) (Vh − Vr) ,
where Er and Vr is respectively the internal energy and volume of the unshocked
state defined by pressure Pr and temperature Tr. We compute Er from first principles
by relaxing enstatite and periclase at the experimental volume Vr, and applying a
thermal correction to account for the difference in energy between static conditions
and 300 K (Stixrude and Lithgow-Bertelloni, 2005).
In a solid the longitudinal wave velocity is given by
(3.52) vP =
√KS + 4/3μ
ρ.
where μ is the shear modulus. In liquids, μ = 0, and vP reduces to the bulk sound
velocity
(3.53) vB =
√KS
ρ.
The sound velocity of the shock compressed phase can be measured in a shock loading
experiment, with a large decrease with pressure being a strong indication of shock
melting. For the liquid, we compute vB along the Hugoniot (Equation 3.8) and
compare to vP of the solid, calculated with Equation 3.52 from experimental data
using the model of Stixrude and Lithgow-Bertelloni (2005).
Consistent with previous theoretical estimates (Cohen and Gong, 1994; Vocadlo
and Price, 1996; Belonoshko and Dubrovinsky, 1996; Strachan et al., 2001; Alfe,
66
2005), our periclase melting curve (Figure 3.9), has a distinctly higher initial Clapey-
ron slope than the experimental determination of Zerr and Boehler (1994). The slope
remains positive over the entire pressure range considered. We find a melting tem-
perature at the CMB of 7360 ± 354 K, which is 780 K lower than the LDA melting
curve obtained by Alfe (2005) through FPMD simulation of direct phase coexistance.
The FPMD periclase Hugoniot agrees very well with the measured pressure-
density Hugoniot (Svendsen and Ahrens, 1987; Duffy and Ahrens, 1995; Vassiliou
and Ahrens, 1981; Marsh, 1980), but is somewhat warmer than the temperature
measurements of Svendsen and Ahrens (1987). The periclase Hugoniot crosses the
melting curve at P = 344 GPa, T = 8880 K, with the liquid phase periclase Hugoniot
crossing the melting curve at P = 452 GPa, T = 9170 K. Complete shock melting is
predicted to result in a ∼ 0.12 g/cm3 density increase and a 2.3 km/s sound velocity
decrease along the Hugoniot. Liquid-solid sound velocity contrast along the Hugo-
niot is found from the p-wave velocity of periclase, calculated from experimental data
using the model of Stixrude and Lithgow-Bertelloni (2005).
Our perovskite melting curve (Figure 3.10) is almost identical to the result of
Stixrude and Karki (2005), being somewhat colder than the measurements of Zerr
and Boehler (1993) and Shen and Lazor (1995), though warmer than the experi-
mental measurements of Knittle and Jeanloz (1989), Heinz and Jeanloz (1987) and
Sweeney and Heinz (1998), as well as the result of Stixrude and Bukowinski (1990a).
The Clapeyron slope remains positive over the entire pressure range considered. We
find a melting temperature at the CMB of 5320± 213 K, which is more than 2000 K
lower than the melting temperature obtained by Brodholt (2008) through FPMD
simulation of direct phase coexistance.
The FPMD perovskite component of the enstatite principle Hugoniot compares
67
well with the measured pressure-density Hugoniot (Akins et al., 2004) points at
149 GPa and 170 GPa, but is notably warmer than the temperature measurements
of Luo et al. (2004). The perovskite Hugoniot crosses the melting curve at P =
155 GPa, T = 5520 K, with the liquid phase Hugoniot crossing the melting curve
at P = 242 GPa, T = 6290 K. Complete shock melting is predicted to result in
a ∼ 0.10 g/cm3 density increase and a 2.6 km/s sound velocity decrease along the
Hugoniot.
3.8 Discussion
For a given order of expansion in the thermal variable (Oθ), values of m are
remarkably similar for all four compositions considered. We will highlight the impli-
cations of two aspects of this result. Firstly, the values of m obtained, especially in
the Oθ = 1 case, and secondly, the degree to which Oθ = 1 fails in Mg2SiO4, MgSiO3,
and especially in SiO2.
For Oθ = 1 and m = 3/5, the internal energy expression derived from our liquid
fundamental relation (Equation 3.26) is equivalent to the theoretical expression for
the energy of cold, dense, simple liquids (Rosenfeld and Tarazona, 1998)
(3.54) Etheory(T ) = Eig(T ) + c0 + c1T35 ,
where c0 and c1 are isochoric constants. Although one could perform independent
E(T ) fits of Equation 3.54 along individual isochors and obtain reasonable agreement
to the FPMD results, such an approach gives no information on the temperature de-
pendence of the pressure. Taking this additional information into account, as is
done in fitting the liquid fundamental relation to both P (V, T ) and E(V, T ) simulta-
neously, yields m values markedly higher than 3/5 for all the Oθ = 1 fits, though still
consistent with limiting behavior constraints. Previous semi-emprical MD studies of
68
SiO2, MgSiO3, and Mg2SiO4 liquids (Saika-Voivod et al., 2001; Ghiorso et al., 2006;
Martin et al., 2006) found Equation 3.54 to hold for individual isochors, but failed
to account for all thermodynamic properties in a self-consistent way. The contrast
of our results with these previous studies highlights the importance of describing
the liquid state thermodynamic properties in terms of a single fundamental relation
without rigid constraints on the functional form of individual properties.
For m independent of volume and temperature, Oθ = 1 fits do not sufficiently
account for all the data in Mg2SiO4, MgSiO3 and SiO2 liquids, again in contrast
to findings of the semi-emprical MD studies of these compositions (Saika-Voivod
et al., 2001; Ghiorso et al., 2006; Martin et al., 2006). This difference likely results
from changes in the Si − O bonds with temperature not captured by semi-empirical
techniques, and highlights the importance of obtaining the interatomic forces from
the electronic structure in situ during molecular dynamics.
For Oθ = 2 and Of = 3, the fit for the excess free energy contribution requires
ten free parameters (thirteen for Of = 5), in addition to the four required to fit the
electronic contribution. As a result, the Oθ = 2 relation does not extrapolate well,
and can only be applied within a grid of NV T points as we do here.
Nonetheless, Oθ = 1 fits do give reasonable results at temperatures within ∼ 1000 K
of freezing. Equation 3.16 can therefore potentially be applied to silicate liquids of
natural compositions at geophysically relevant conditions, constrained using experi-
mental data. Since a02 = 0 for Oθ = 1, Equation A.10 gives
(3.55) m =CV xs0
Sxs0+ 1,
for m �= 0. Therefore m can be found with knowledge of the liquid S and CV
at the reference point, making application of the liquid fundamental relation to
experimental data possible.
69
The theoretical suitability of a Eularian finite strain expansion for use with highly
compressible materials such as silicate liquids has been questioned (Ghiorso et al.,
2002; Ghiorso, 2004; Hofmeister, 1993). The two main concerns that have been cited
are firstly, that analytical inter-atomic potentials derived from the Birch-Murnaghan
equation of state predict non-physical effects for K ′0 > 6 (Hofmeister, 1993), and
secondly, that the equation allows liquid bulk moduli to vanish at large volumes.
Experimental and theoretical results for silicate liquids show K ′0 values to vary from
around 5 to as high as 12 (Rigden et al., 1989; Ai and Lange, 2008; Lange, 2003,
2007; Stixrude and Karki, 2005; Karki et al., 2007; de Koker et al., 2008a; Sun, 2008).
These high values reflect the ability of silicate liquids to access structural compression
mechanisms not available to solids, such as coordination and ring statistics, which
enable liquids to become very compressible at high temperature and low density.
The Hofmeister (1993) prediction only applies to simple ionic compounds, in which
only the bond length is altered upon compression, and is therefore not relevant to
silicate liquids. The second concern cited is, in fact, an asset of the finite strain
expansion. When combined with an ideal gas term, as we have done, the relation
shows a van der Waals loop (Figure 3.6), and thus also captures the thermodynamics
of the liquid-vapor transition.
The relation for solids works well over the large range of pressure and temperature
we consider, though the absence of a quantum correction requires caution in compar-
ison with experimental equation of state data below about 1000 K. The requirement
of a fourth order finite strain expansion for periclase is primarily due to the very
large pressures attained in the smallest volume considered (V/VX = 0.35). The re-
lation requires only seven (eight for periclase) free parameters, and can therefore be
extrapolated to higher temperatures and pressures with reasonable confidence.
70
The discrepancy between our respective melting curves for periclase and per-
ovskite, and those determined by FPMD simulation of two-phase coexistence by Alfe
(2005) and Brodholt (2008), highlights the pitfalls of the two-phase method. In the
FPMD implementation, these simulations are limited in size to hundreds of atoms,
with the result that the periodic boundary condition may favor the stability of the
crystalline phase, and overestimate the melting temperature. Also, surface effects at
the melt-crystal interface will alter a large portion of both the liquid and crystalline
portions in such small systems, with the result that the simulation may not reflect
the equilibrium phases, and a stable crystalline core will be absent. Of course, these
surface effects are interesting in their own right, and two-phase coexistence simula-
tions do have the advantage of giving estimates of melting completely independent
of experimental input. However, the melting temperatures of geophysically relevant
compositions are known at ambient pressures to within uncertainties far smaller than
those realistically obtainable in two-phase FPMD simulations. Therefore, combining
such experimental measurements with our approach is likely to provide the most
accurate estimate of congruent melting temperatures at very high pressure.
Agreement with pressure-density Hugoniot data for perovskite is excellent, but
poor for shock temperature measurements. Pressure-density measurements are far
more robust than shock temperature measurements, in which a number of assump-
tions about the radiative properties of the material are made, including that the
shock front is smooth and non-reflecting, and that the electronic temperature is in
equilibrium with that of the lattice at the shock front. A Hugoniot obtained using
the self consistent thermodynamic model of Stixrude and Lithgow-Bertelloni (2005),
constrained with a variety of experimental data, is very similar to the FPMD Hugo-
niot, showing similar disagreement with the shock measured temperatures. The
71
perovskite Hugoniot intersects the melting curve at a pressure slightly smaller than
where incipient melting has been inferred on the measured enstatite Hugoniot, sug-
gesting that some extent of overdriving into a superheated solid state may be present
in the experimental data. Somewhat more troubling, however, is the large discrep-
ancy between the density increase along the Hugoniot upon melting predicted by
theory and observed in experiment. The three inferred liquid points in the data of
Akins et al. (2004) are at pressures smaller than that at which the theoretical liquid
Hugoniot crosses the melting curve, and are likely only partially molten. Indeed,
extrapolation of the inferred experimental liquid Hugoniot to higher pressures gives
good agreement with the theoretical prediction. The observed large increase in den-
sity may result from processes related to shock-induced phase transformation, such
as a double shock front (Ng et al., 1991).
The fact that the liquid Hugoniot is at a larger density than that of the solid in
both periclase as well as perovskite should not be confused with a density crossover.
The larger liquid Hugoniot density results simply due to thermal contraction as
heat is absorbed during melting. Indeed, along the melting curves the densities of
periclase and perovskite remain larger than that of the respective coexisting liquids,
as reflected by the positive Clapeyron slopes.
3.9 Conclusion
By extending the finite strain description of materials at high pressure of Birch
(1952, 1978) to account for the thermal free energy contribution, we have constructed
a thermodynamic description of silicate liquids that is self-consistent and requires rel-
atively few free parameters. Application of this relation to silicate liquids simulated
by FPMD reveals that the effect of excited electronic states cannot be ignored in
72
these materials at temperatures well above that of melting, and that existing theo-
retical predictions for the temperature dependence of the liquid free energy fail for
silicate liquids at high temperature.
Of particular geophysical interest is the melting of mantle minerals at deep lower
mantle pressures, most readily achieved in shock loading experiments. Shock melt-
ing may be identified by large changes in the temperature, discontinuities in density,
and a marked decrease in the sound velocity of the shocked state measured along
the Hugoniot. We are able to apply the thermodynamic description to obtain melt-
ing curves and Hugoniot loci for perovskite and periclase, compare to existing shock
loading measurements and make quantitative predictions of each of the melting cri-
teria.
3.10 Acknowledgements
This research was supported by the National Science Foundation under Grants
EAR-0409074 and EAR-0409121. Computing facilities were provided by CCT at
Louisiana State University and by CAC at the University of Michgan.
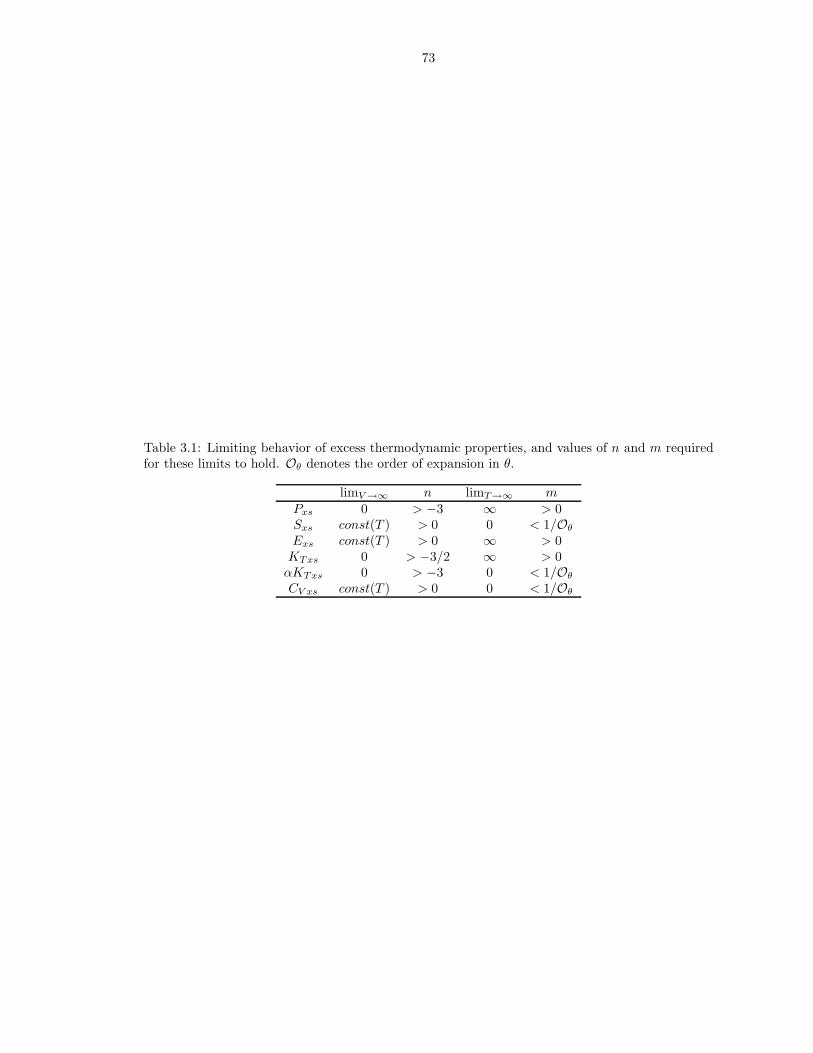
73
Table 3.1: Limiting behavior of excess thermodynamic properties, and values of n and m requiredfor these limits to hold. Oθ denotes the order of expansion in θ.
limV →∞ n limT→∞ mPxs 0 > −3 ∞ > 0Sxs const(T ) > 0 0 < 1/Oθ
Exs const(T ) > 0 ∞ > 0KTxs 0 > −3/2 ∞ > 0αKTxs 0 > −3 0 < 1/Oθ
CV xs const(T ) > 0 0 < 1/Oθ
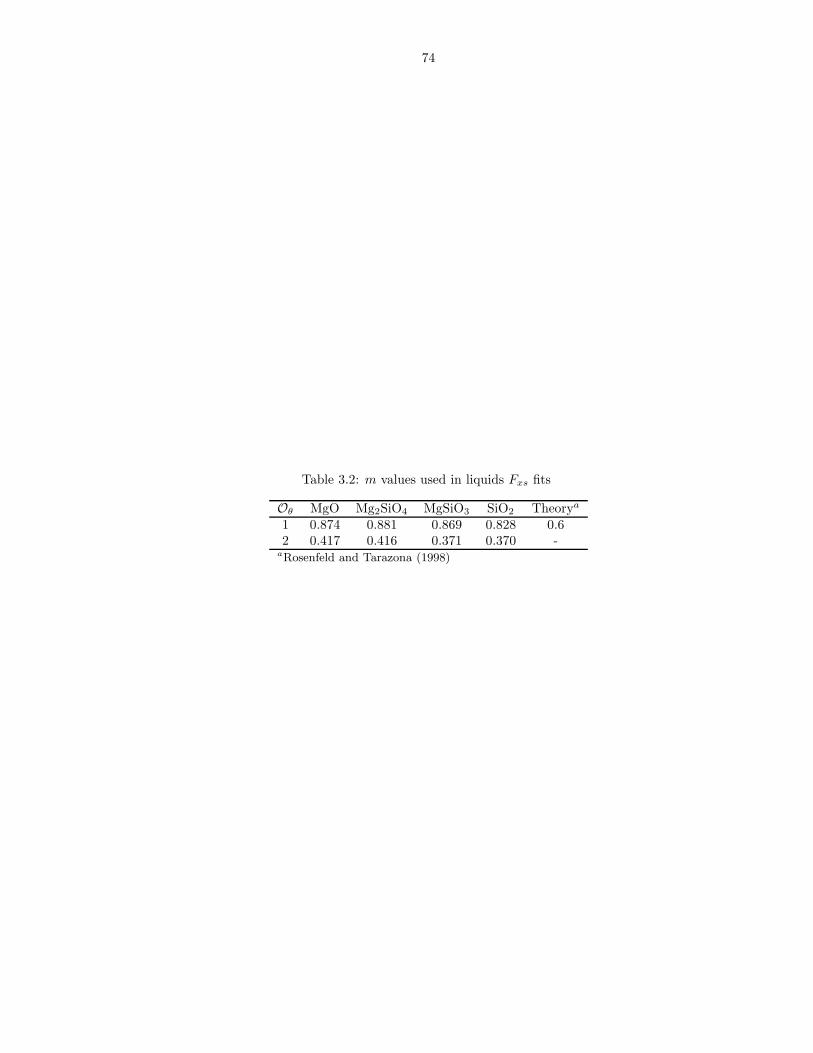
74
Table 3.2: m values used in liquids Fxs fits
Oθ MgO Mg2SiO4 MgSiO3 SiO2 Theorya
1 0.874 0.881 0.869 0.828 0.62 0.417 0.416 0.371 0.370 -
aRosenfeld and Tarazona (1998)
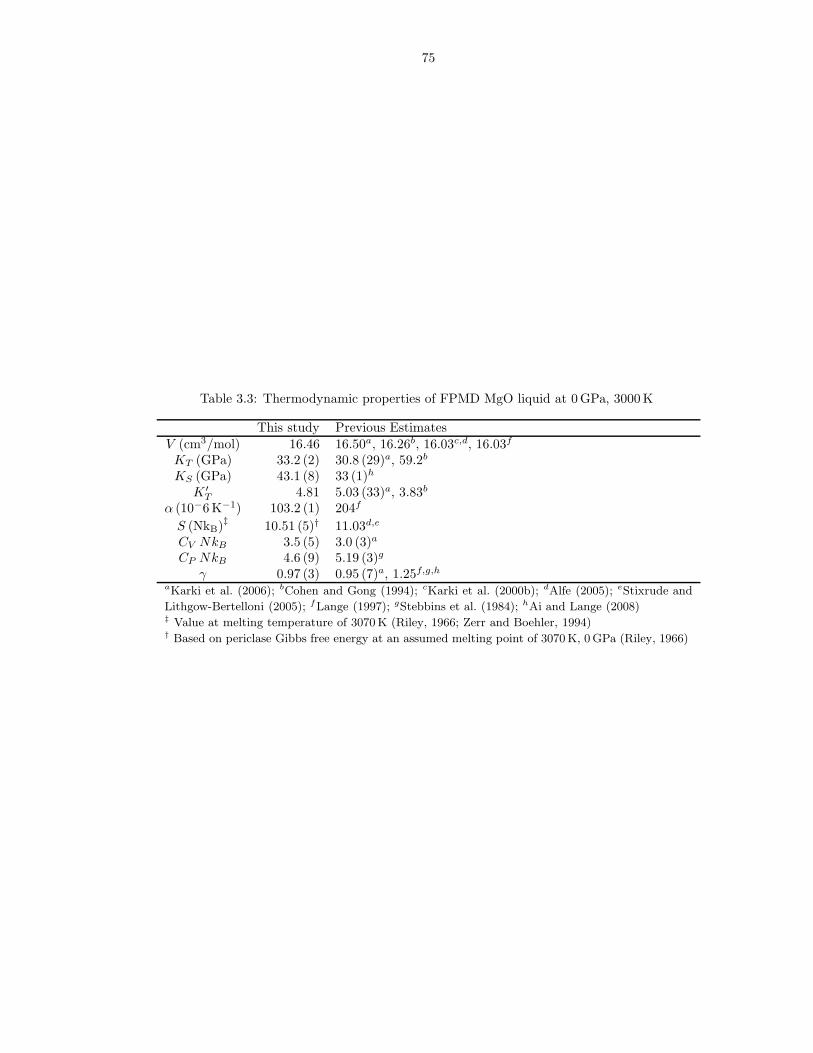
75
Table 3.3: Thermodynamic properties of FPMD MgO liquid at 0 GPa, 3000 K
This study Previous EstimatesV (cm3/mol) 16.46 16.50a, 16.26b, 16.03c,d, 16.03f
KT (GPa) 33.2 (2) 30.8 (29)a, 59.2b
KS (GPa) 43.1 (8) 33 (1)h
K ′T 4.81 5.03 (33)a, 3.83b
α (10−6 K−1) 103.2 (1) 204f
S (NkB)‡ 10.51 (5)† 11.03d,e
CV NkB 3.5 (5) 3.0 (3)a
CP NkB 4.6 (9) 5.19 (3)g
γ 0.97 (3) 0.95 (7)a, 1.25f,g,h
aKarki et al. (2006); bCohen and Gong (1994); cKarki et al. (2000b); dAlfe (2005); eStixrude and
Lithgow-Bertelloni (2005); fLange (1997); gStebbins et al. (1984); hAi and Lange (2008)‡ Value at melting temperature of 3070 K (Riley, 1966; Zerr and Boehler, 1994)† Based on periclase Gibbs free energy at an assumed melting point of 3070 K, 0 GPa (Riley, 1966)
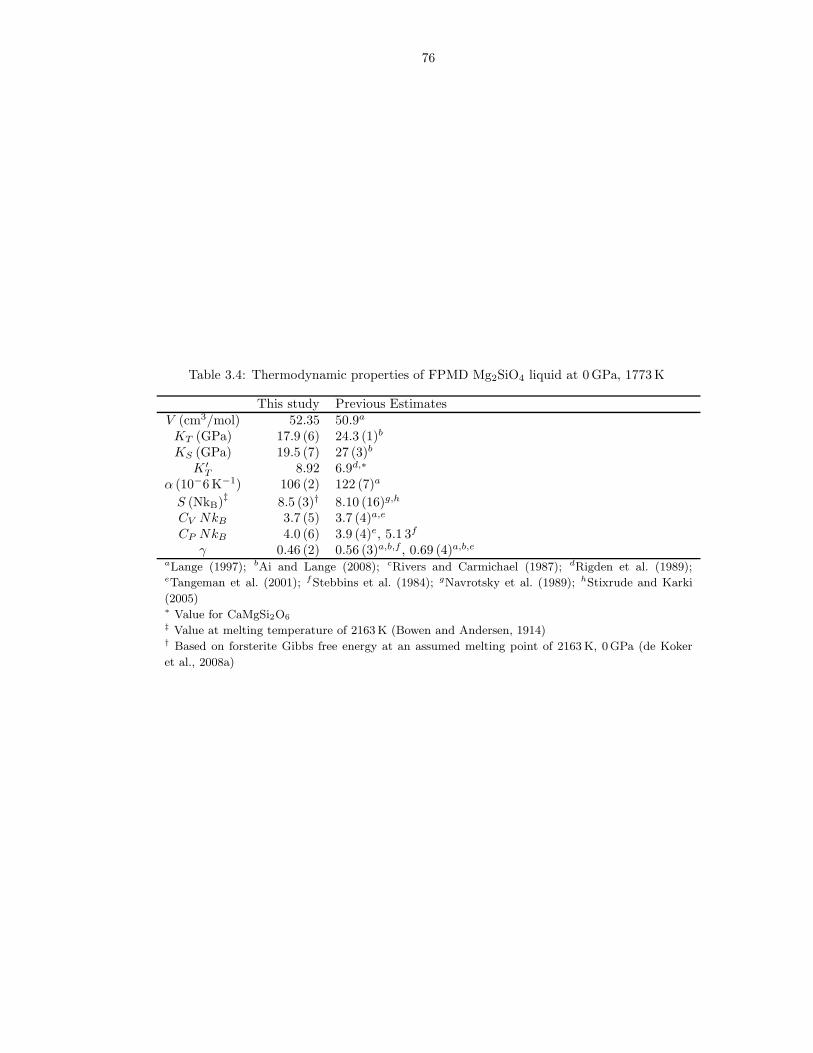
76
Table 3.4: Thermodynamic properties of FPMD Mg2SiO4 liquid at 0 GPa, 1773 K
This study Previous EstimatesV (cm3/mol) 52.35 50.9a
KT (GPa) 17.9 (6) 24.3 (1)b
KS (GPa) 19.5 (7) 27 (3)b
K ′T 8.92 6.9d,∗
α (10−6 K−1) 106 (2) 122 (7)a
S (NkB)‡ 8.5 (3)† 8.10 (16)g,h
CV NkB 3.7 (5) 3.7 (4)a,e
CP NkB 4.0 (6) 3.9 (4)e, 5.1 3f
γ 0.46 (2) 0.56 (3)a,b,f , 0.69 (4)a,b,e
aLange (1997); bAi and Lange (2008); cRivers and Carmichael (1987); dRigden et al. (1989);eTangeman et al. (2001); fStebbins et al. (1984); gNavrotsky et al. (1989); hStixrude and Karki
(2005)∗ Value for CaMgSi2O6‡ Value at melting temperature of 2163 K (Bowen and Andersen, 1914)† Based on forsterite Gibbs free energy at an assumed melting point of 2163 K, 0GPa (de Koker
et al., 2008a)
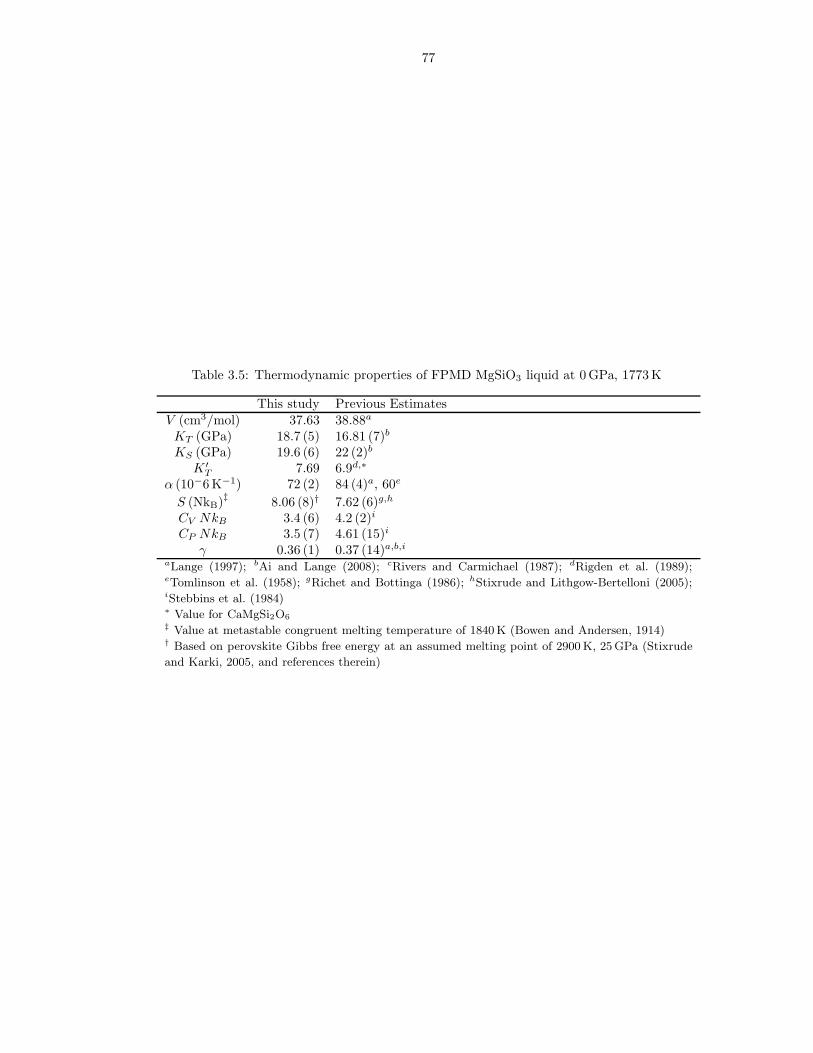
77
Table 3.5: Thermodynamic properties of FPMD MgSiO3 liquid at 0 GPa, 1773 K
This study Previous EstimatesV (cm3/mol) 37.63 38.88a
KT (GPa) 18.7 (5) 16.81 (7)b
KS (GPa) 19.6 (6) 22 (2)b
K ′T 7.69 6.9d,∗
α (10−6 K−1) 72 (2) 84 (4)a, 60e
S (NkB)‡ 8.06 (8)† 7.62 (6)g,h
CV NkB 3.4 (6) 4.2 (2)i
CP NkB 3.5 (7) 4.61 (15)i
γ 0.36 (1) 0.37 (14)a,b,i
aLange (1997); bAi and Lange (2008); cRivers and Carmichael (1987); dRigden et al. (1989);eTomlinson et al. (1958); gRichet and Bottinga (1986); hStixrude and Lithgow-Bertelloni (2005);iStebbins et al. (1984)∗ Value for CaMgSi2O6‡ Value at metastable congruent melting temperature of 1840 K (Bowen and Andersen, 1914)† Based on perovskite Gibbs free energy at an assumed melting point of 2900 K, 25 GPa (Stixrude
and Karki, 2005, and references therein)
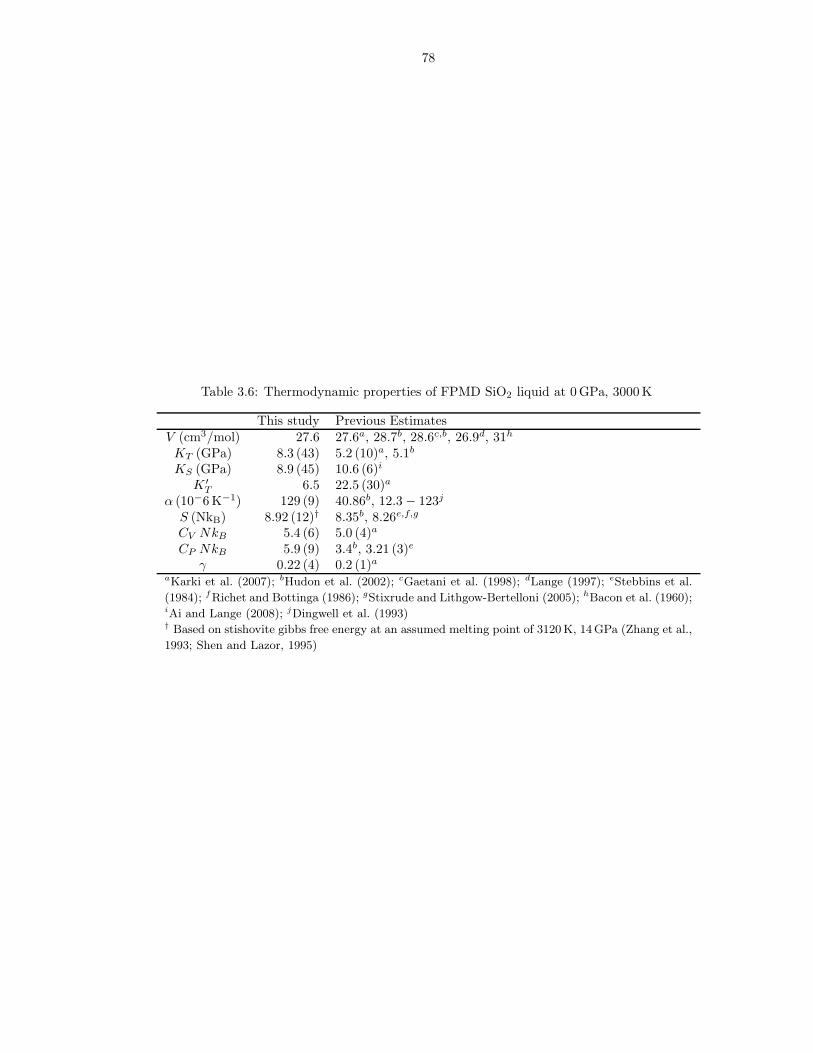
78
Table 3.6: Thermodynamic properties of FPMD SiO2 liquid at 0 GPa, 3000 K
This study Previous EstimatesV (cm3/mol) 27.6 27.6a, 28.7b, 28.6c,b, 26.9d, 31h
KT (GPa) 8.3 (43) 5.2 (10)a, 5.1b
KS (GPa) 8.9 (45) 10.6 (6)i
K ′T 6.5 22.5 (30)a
α (10−6 K−1) 129 (9) 40.86b, 12.3 − 123j
S (NkB) 8.92 (12)† 8.35b, 8.26e,f,g
CV NkB 5.4 (6) 5.0 (4)a
CP NkB 5.9 (9) 3.4b, 3.21 (3)e
γ 0.22 (4) 0.2 (1)a
aKarki et al. (2007); bHudon et al. (2002); cGaetani et al. (1998); dLange (1997); eStebbins et al.
(1984); fRichet and Bottinga (1986); gStixrude and Lithgow-Bertelloni (2005); hBacon et al. (1960);iAi and Lange (2008); jDingwell et al. (1993)† Based on stishovite gibbs free energy at an assumed melting point of 3120 K, 14GPa (Zhang et al.,
1993; Shen and Lazor, 1995)
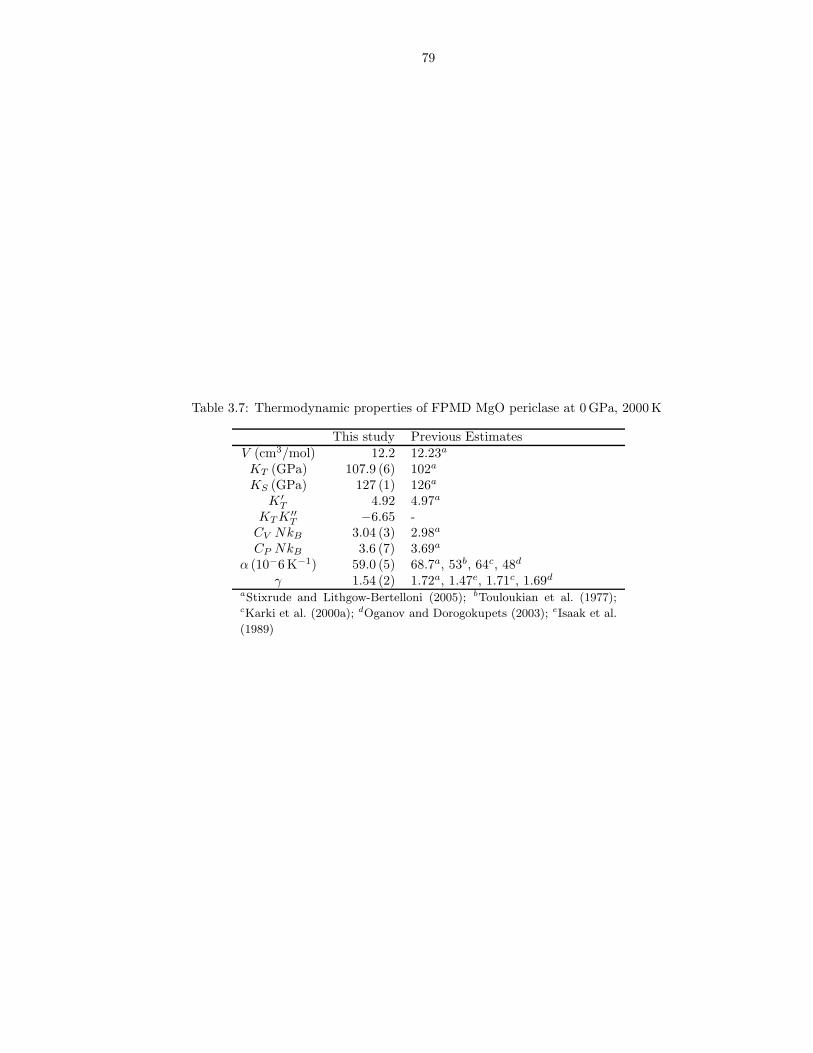
79
Table 3.7: Thermodynamic properties of FPMD MgO periclase at 0 GPa, 2000 K
This study Previous EstimatesV (cm3/mol) 12.2 12.23a
KT (GPa) 107.9 (6) 102a
KS (GPa) 127 (1) 126a
K ′T 4.92 4.97a
KT K ′′T −6.65 -
CV NkB 3.04 (3) 2.98a
CP NkB 3.6 (7) 3.69a
α (10−6 K−1) 59.0 (5) 68.7a, 53b, 64c, 48d
γ 1.54 (2) 1.72a, 1.47e, 1.71c, 1.69d
aStixrude and Lithgow-Bertelloni (2005); bTouloukian et al. (1977);cKarki et al. (2000a); dOganov and Dorogokupets (2003); eIsaak et al.
(1989)
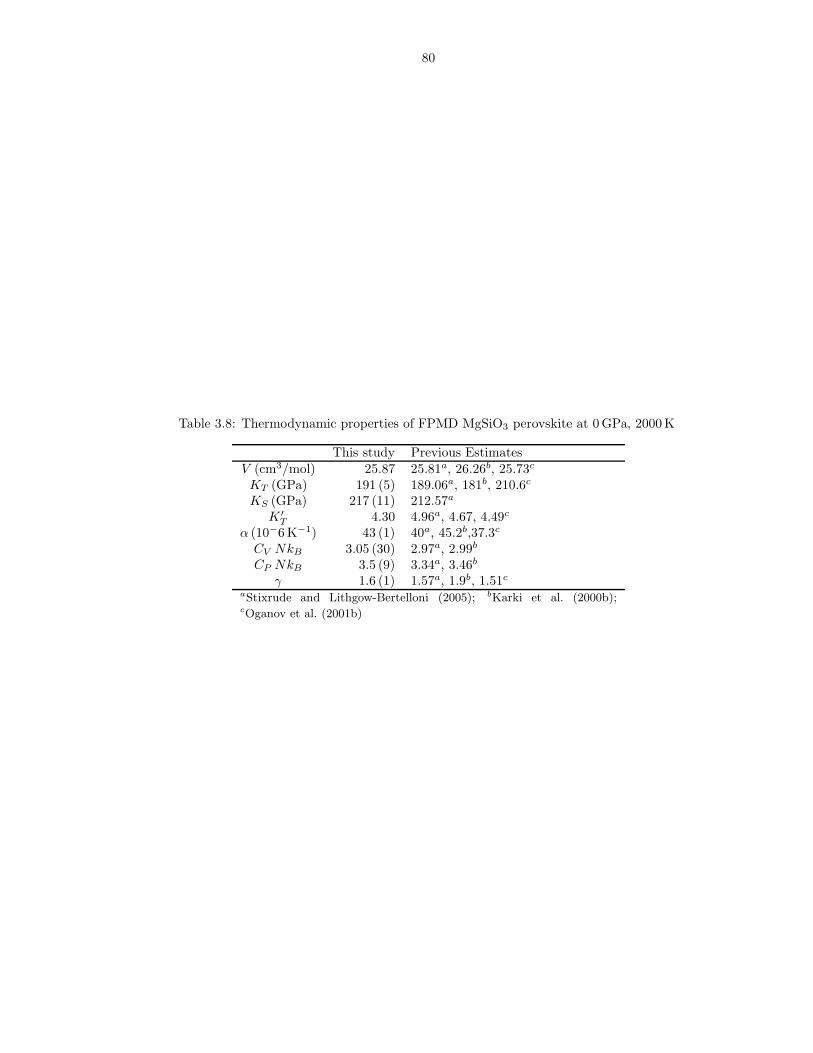
80
Table 3.8: Thermodynamic properties of FPMD MgSiO3 perovskite at 0 GPa, 2000 K
This study Previous EstimatesV (cm3/mol) 25.87 25.81a, 26.26b, 25.73c
KT (GPa) 191 (5) 189.06a, 181b, 210.6c
KS (GPa) 217 (11) 212.57a
K ′T 4.30 4.96a, 4.67, 4.49c
α (10−6 K−1) 43 (1) 40a, 45.2b,37.3c
CV NkB 3.05 (30) 2.97a, 2.99b
CP NkB 3.5 (9) 3.34a, 3.46b
γ 1.6 (1) 1.57a, 1.9b, 1.51c
aStixrude and Lithgow-Bertelloni (2005); bKarki et al. (2000b);cOganov et al. (2001b)
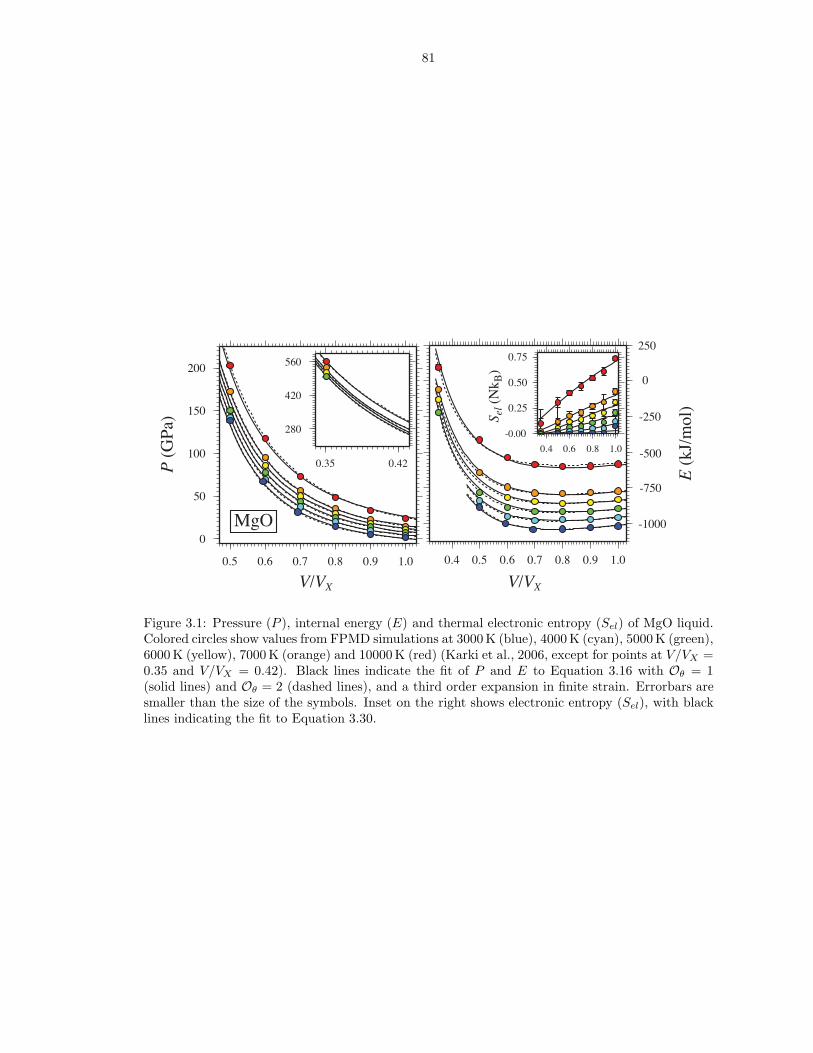
81
V/VX
0
50
100
150
200
P (
GPa
)
0.5 0.6 0.7 0.8 0.9 1.0
280
420
560
0.35 0.42
-1000
-750
-500
-250
0
250
E (
kJ/m
ol)
0.4 0.5 0.6 0.7 0.8 0.9 1.0
V/VX
-0.00
0.25
0.50
0.75
S el (
Nk B
)
0.4 0.6 0.8 1.0
MgO
Figure 3.1: Pressure (P ), internal energy (E) and thermal electronic entropy (Sel) of MgO liquid.Colored circles show values from FPMD simulations at 3000 K (blue), 4000 K (cyan), 5000 K (green),6000 K (yellow), 7000 K (orange) and 10000 K (red) (Karki et al., 2006, except for points at V/VX =0.35 and V/VX = 0.42). Black lines indicate the fit of P and E to Equation 3.16 with Oθ = 1(solid lines) and Oθ = 2 (dashed lines), and a third order expansion in finite strain. Errorbars aresmaller than the size of the symbols. Inset on the right shows electronic entropy (Sel), with blacklines indicating the fit to Equation 3.30.
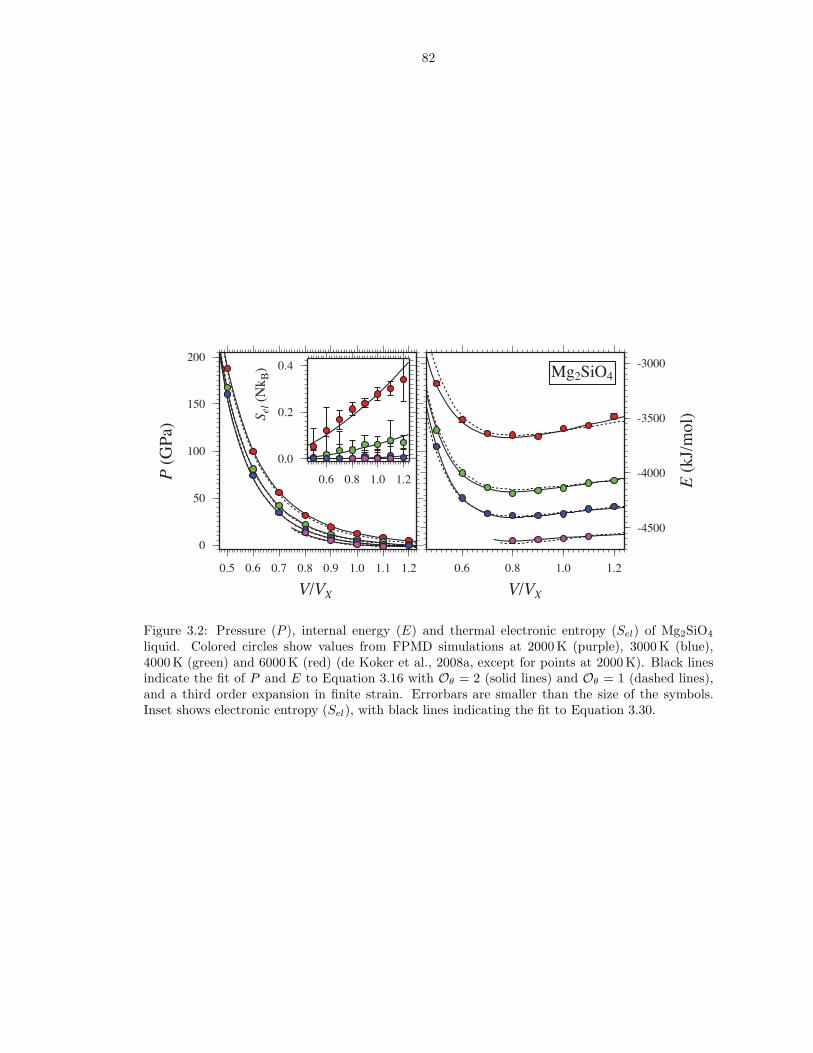
82
V/VX
P (
GPa
)
E (
kJ/m
ol)
V/VX
S el (
Nk B
)
-4500
-4000
-3500
-3000
0.6 0.8 1.0 1.2
0
50
100
150
200
0.5 0.6 0.7 0.8 0.9 1.0 1.1 1.2
Mg2SiO4
0.0
0.2
0.4
0.6 0.8 1.0 1.2
Figure 3.2: Pressure (P ), internal energy (E) and thermal electronic entropy (Sel) of Mg2SiO4
liquid. Colored circles show values from FPMD simulations at 2000 K (purple), 3000 K (blue),4000 K (green) and 6000 K (red) (de Koker et al., 2008a, except for points at 2000 K). Black linesindicate the fit of P and E to Equation 3.16 with Oθ = 2 (solid lines) and Oθ = 1 (dashed lines),and a third order expansion in finite strain. Errorbars are smaller than the size of the symbols.Inset shows electronic entropy (Sel), with black lines indicating the fit to Equation 3.30.
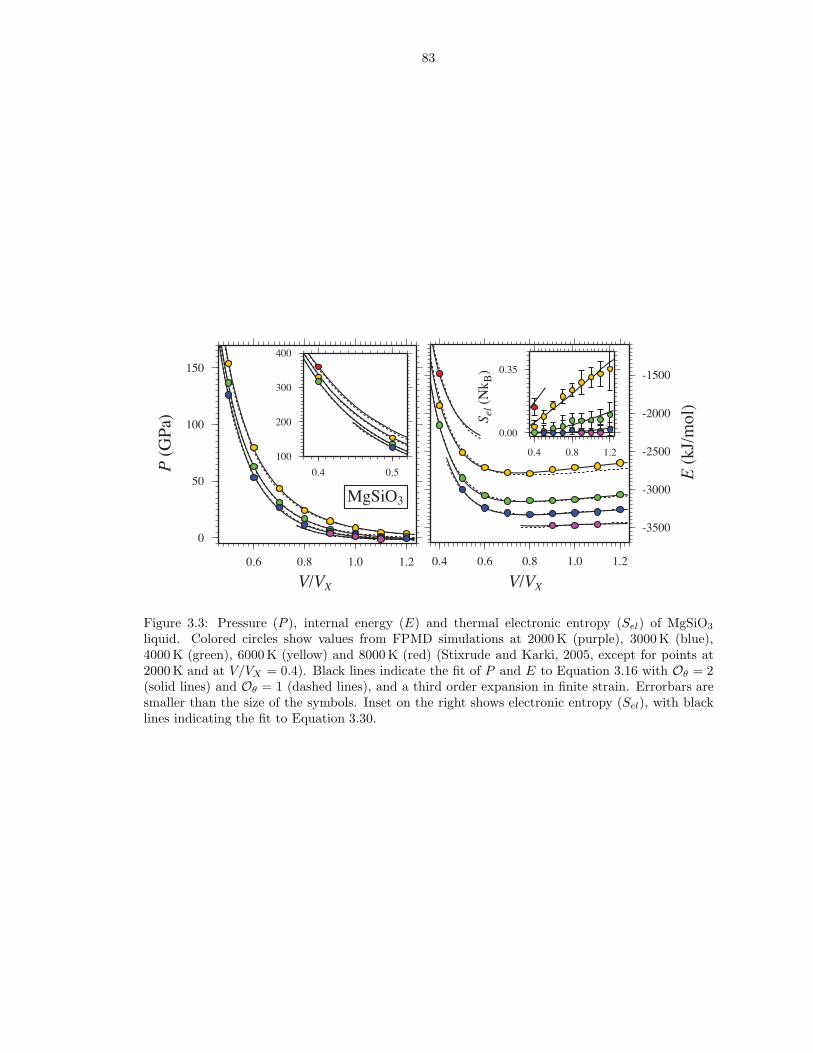
83
V/VX
P (
GPa
)
E (
kJ/m
ol)
V/VX
S el (
Nk B
)
0
50
100
150
0.6 0.8 1.0 1.2
100
200
300
400
0.4 0.5
-3500
-3000
-2500
-2000
-1500
0.4 0.6 0.8 1.0 1.2
MgSiO3
0.00
0.35
0.4 0.8 1.2
Figure 3.3: Pressure (P ), internal energy (E) and thermal electronic entropy (Sel) of MgSiO3
liquid. Colored circles show values from FPMD simulations at 2000 K (purple), 3000 K (blue),4000 K (green), 6000 K (yellow) and 8000 K (red) (Stixrude and Karki, 2005, except for points at2000 K and at V/VX = 0.4). Black lines indicate the fit of P and E to Equation 3.16 with Oθ = 2(solid lines) and Oθ = 1 (dashed lines), and a third order expansion in finite strain. Errorbars aresmaller than the size of the symbols. Inset on the right shows electronic entropy (Sel), with blacklines indicating the fit to Equation 3.30.
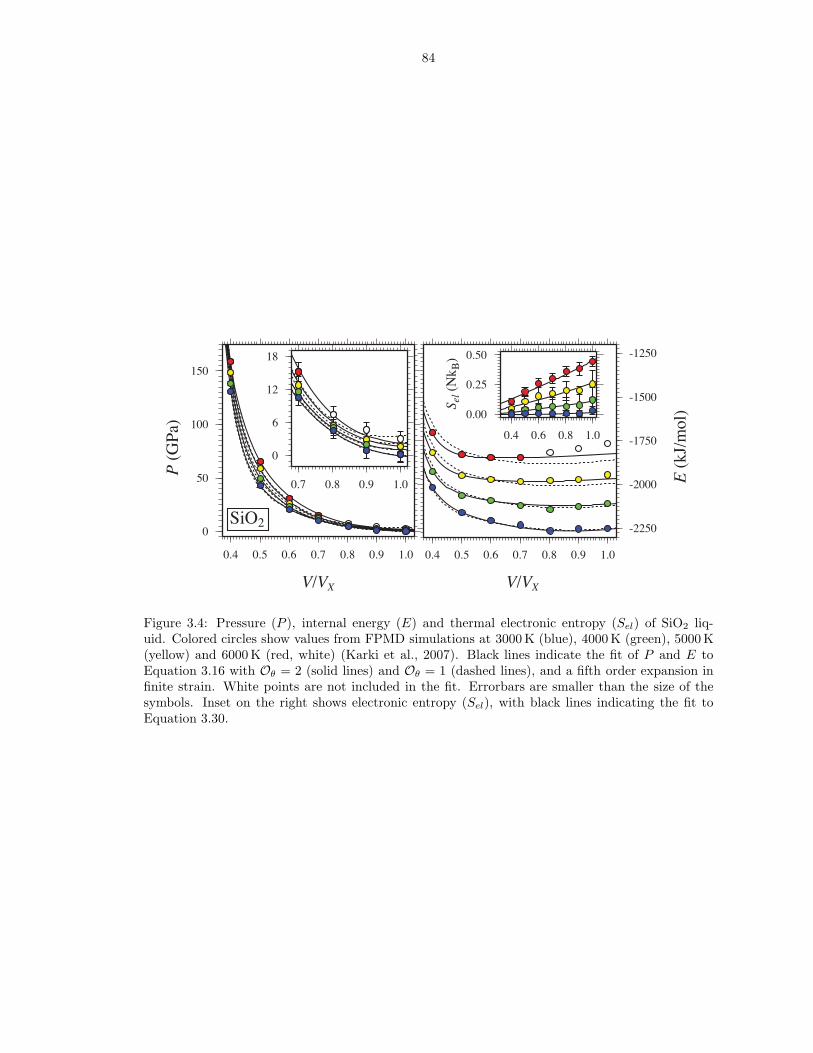
84
0.00
0.25
0.50
0.4 0.6 0.8 1.0
V/VX
P (
GPa
)
E (
kJ/m
ol)
V/VX
S el (
Nk B
)
SiO2 -2250
-2000
-1750
-1500
-1250
0.4 0.5 0.6 0.7 0.8 0.9 1.0
0
6
12
18
0.7 0.8 0.9 1.0
0
50
100
150
0.4 0.5 0.6 0.7 0.8 0.9 1.0
Figure 3.4: Pressure (P ), internal energy (E) and thermal electronic entropy (Sel) of SiO2 liq-uid. Colored circles show values from FPMD simulations at 3000 K (blue), 4000 K (green), 5000 K(yellow) and 6000 K (red, white) (Karki et al., 2007). Black lines indicate the fit of P and E toEquation 3.16 with Oθ = 2 (solid lines) and Oθ = 1 (dashed lines), and a fifth order expansion infinite strain. White points are not included in the fit. Errorbars are smaller than the size of thesymbols. Inset on the right shows electronic entropy (Sel), with black lines indicating the fit toEquation 3.30.
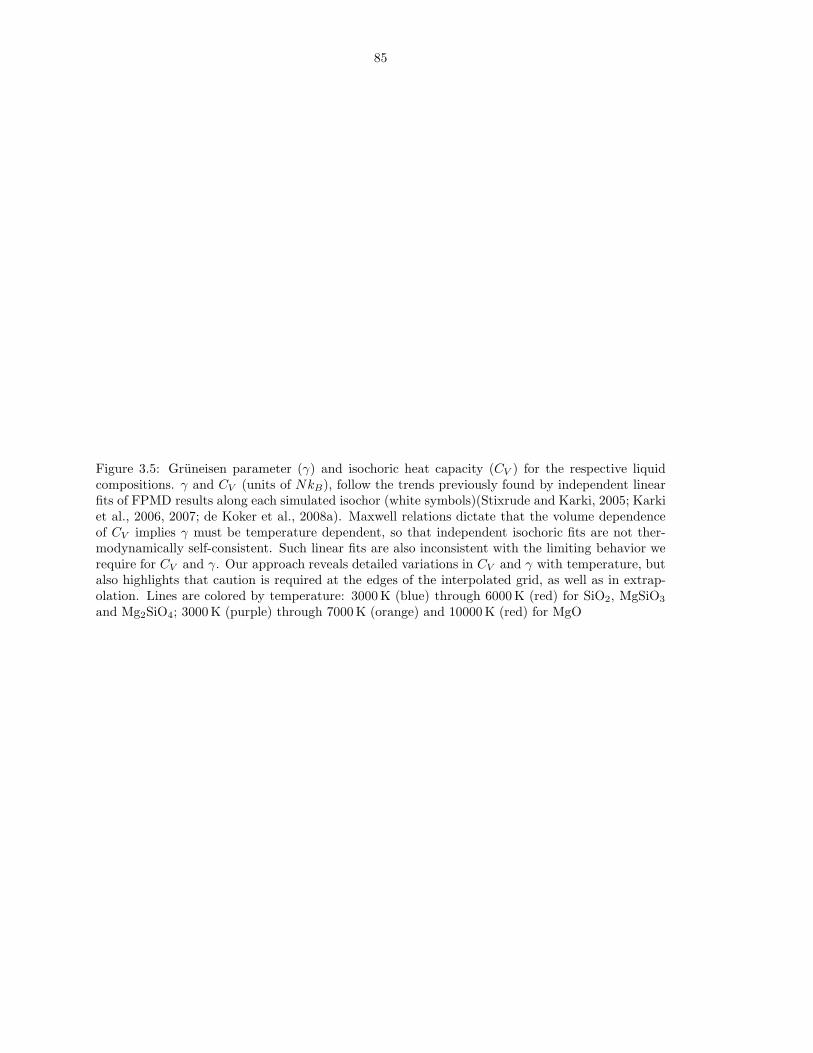
85
Figure 3.5: Gruneisen parameter (γ) and isochoric heat capacity (CV ) for the respective liquidcompositions. γ and CV (units of NkB), follow the trends previously found by independent linearfits of FPMD results along each simulated isochor (white symbols)(Stixrude and Karki, 2005; Karkiet al., 2006, 2007; de Koker et al., 2008a). Maxwell relations dictate that the volume dependenceof CV implies γ must be temperature dependent, so that independent isochoric fits are not ther-modynamically self-consistent. Such linear fits are also inconsistent with the limiting behavior werequire for CV and γ. Our approach reveals detailed variations in CV and γ with temperature, butalso highlights that caution is required at the edges of the interpolated grid, as well as in extrap-olation. Lines are colored by temperature: 3000 K (blue) through 6000 K (red) for SiO2, MgSiO3
and Mg2SiO4; 3000 K (purple) through 7000 K (orange) and 10000 K (red) for MgO
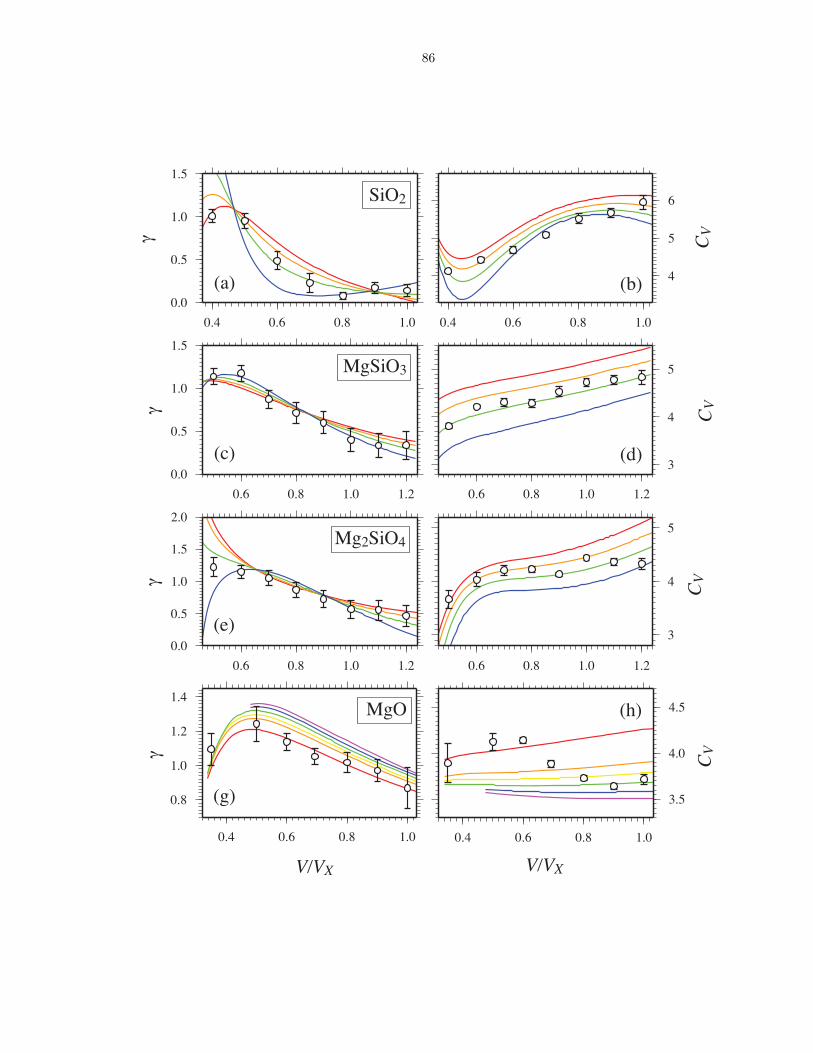
86
CVγ
CVγ
CVγ
CV
V/VX V/VX
SiO2
MgSiO3
Mg2SiO4
MgO
(g)
(a) (b)
(c) (d)
(e)
(h)
4
5
6
0.4 0.6 0.8 1.0
0.0
0.5
1.0
1.5
0.4 0.6 0.8 1.0
3
4
5
0.6 0.8 1.0 1.2
0.0
0.5
1.0
1.5
0.6 0.8 1.0 1.2
3
4
5
0.6 0.8 1.0 1.2
0.0
0.5
1.0
1.5
2.0
0.6 0.8 1.0 1.2
3.5
4.0
4.5
0.4 0.6 0.8 1.0
γ
0.8
1.0
1.2
1.4
0.4 0.6 0.8 1.0
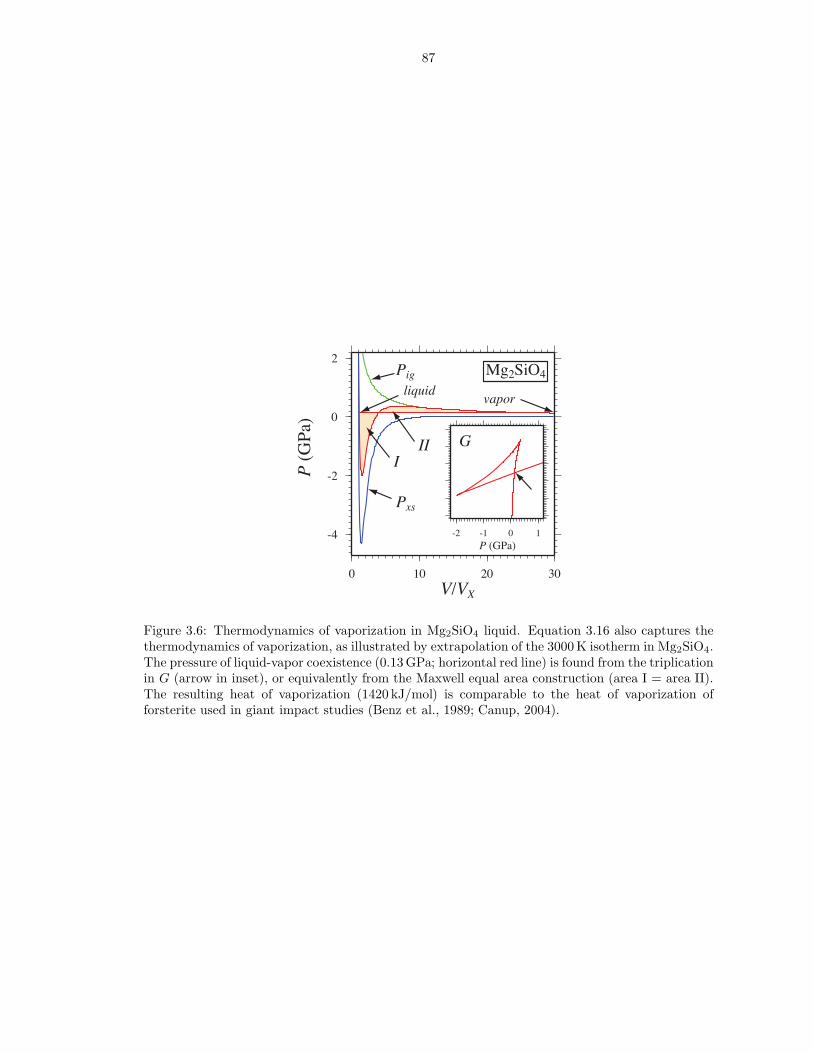
87
V/VX
P (
GPa
)
Mg2SiO4
-2 -1 0 1P (GPa)
-4
-2
0
2
0 10 20 30
liquid
Pig
Pxs
vapor
GI
II
Figure 3.6: Thermodynamics of vaporization in Mg2SiO4 liquid. Equation 3.16 also captures thethermodynamics of vaporization, as illustrated by extrapolation of the 3000 K isotherm in Mg2SiO4.The pressure of liquid-vapor coexistence (0.13 GPa; horizontal red line) is found from the triplicationin G (arrow in inset), or equivalently from the Maxwell equal area construction (area I = area II).The resulting heat of vaporization (1420 kJ/mol) is comparable to the heat of vaporization offorsterite used in giant impact studies (Benz et al., 1989; Canup, 2004).
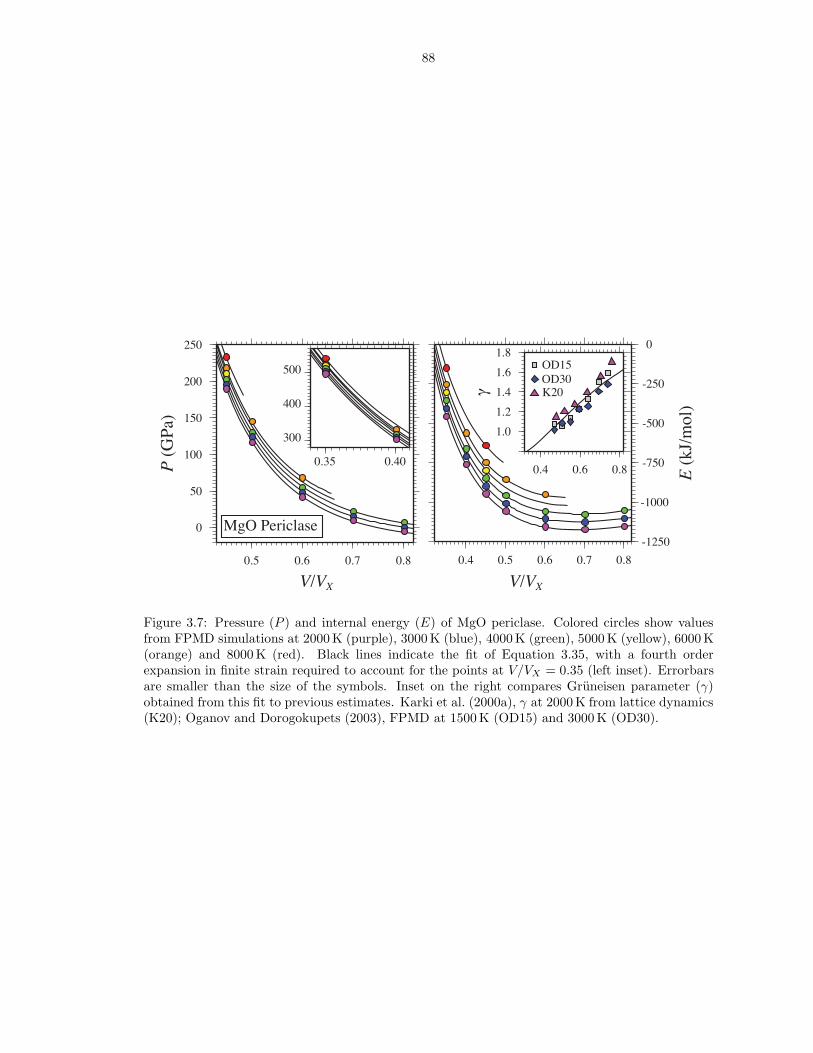
88
V/VX
P (
GPa
)
V/VX
0
50
100
150
200
250
0.5 0.6 0.7 0.8
300
400
500
0.35 0.40
-1250
-1000
-750
-500
-250
0
E (
kJ/m
ol)
0.4 0.5 0.6 0.7 0.8
MgO Periclase
γ K20
OD15OD30
1.0
1.2
1.4
1.6
1.8
0.4 0.6 0.8
Figure 3.7: Pressure (P ) and internal energy (E) of MgO periclase. Colored circles show valuesfrom FPMD simulations at 2000 K (purple), 3000 K (blue), 4000 K (green), 5000 K (yellow), 6000 K(orange) and 8000 K (red). Black lines indicate the fit of Equation 3.35, with a fourth orderexpansion in finite strain required to account for the points at V/VX = 0.35 (left inset). Errorbarsare smaller than the size of the symbols. Inset on the right compares Gruneisen parameter (γ)obtained from this fit to previous estimates. Karki et al. (2000a), γ at 2000 K from lattice dynamics(K20); Oganov and Dorogokupets (2003), FPMD at 1500 K (OD15) and 3000 K (OD30).
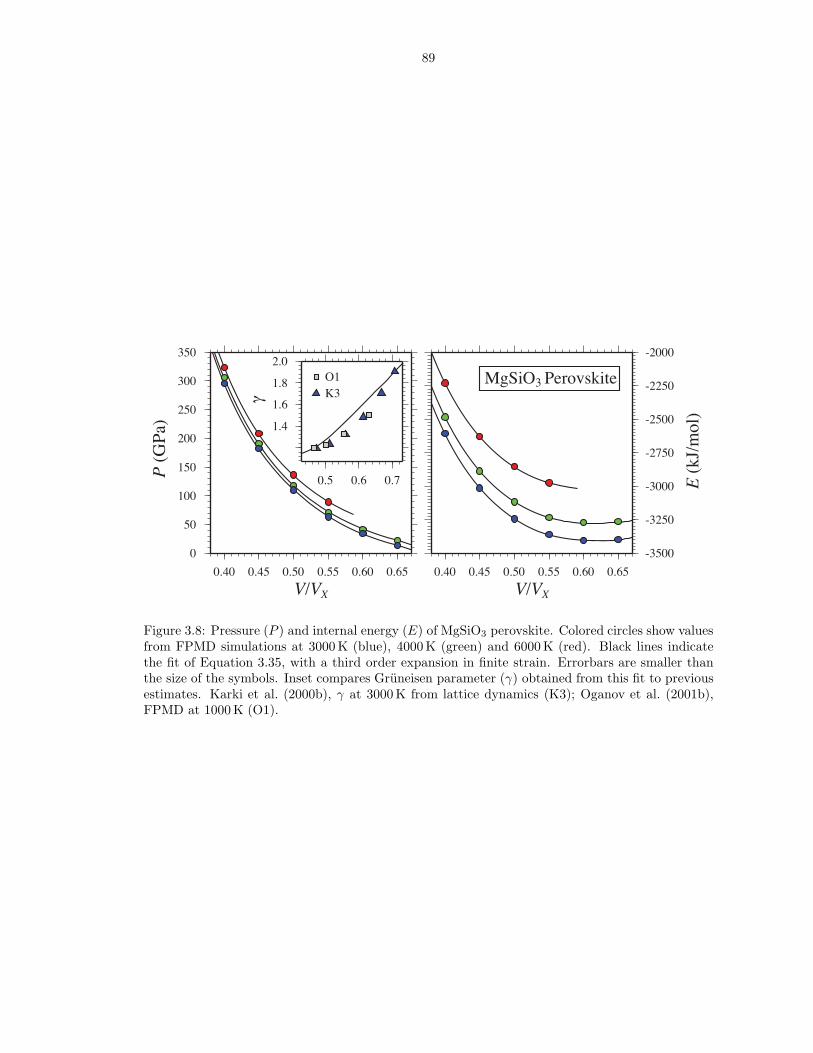
89
0
50
100
150
200
250
300
350
0.40 0.45 0.50 0.55 0.60 0.65
-3500
-3250
-3000
-2750
-2500
-2250
-2000
0.40 0.45 0.50 0.55 0.60 0.65
V/VX
P (
GPa
)
V/VX
E (
kJ/m
ol)
MgSiO3 Perovskite
1.4
1.6
1.8
2.0
0.5 0.6 0.7
γ K3O1
Figure 3.8: Pressure (P ) and internal energy (E) of MgSiO3 perovskite. Colored circles show valuesfrom FPMD simulations at 3000 K (blue), 4000 K (green) and 6000 K (red). Black lines indicatethe fit of Equation 3.35, with a third order expansion in finite strain. Errorbars are smaller thanthe size of the symbols. Inset compares Gruneisen parameter (γ) obtained from this fit to previousestimates. Karki et al. (2000b), γ at 3000 K from lattice dynamics (K3); Oganov et al. (2001b),FPMD at 1000 K (O1).
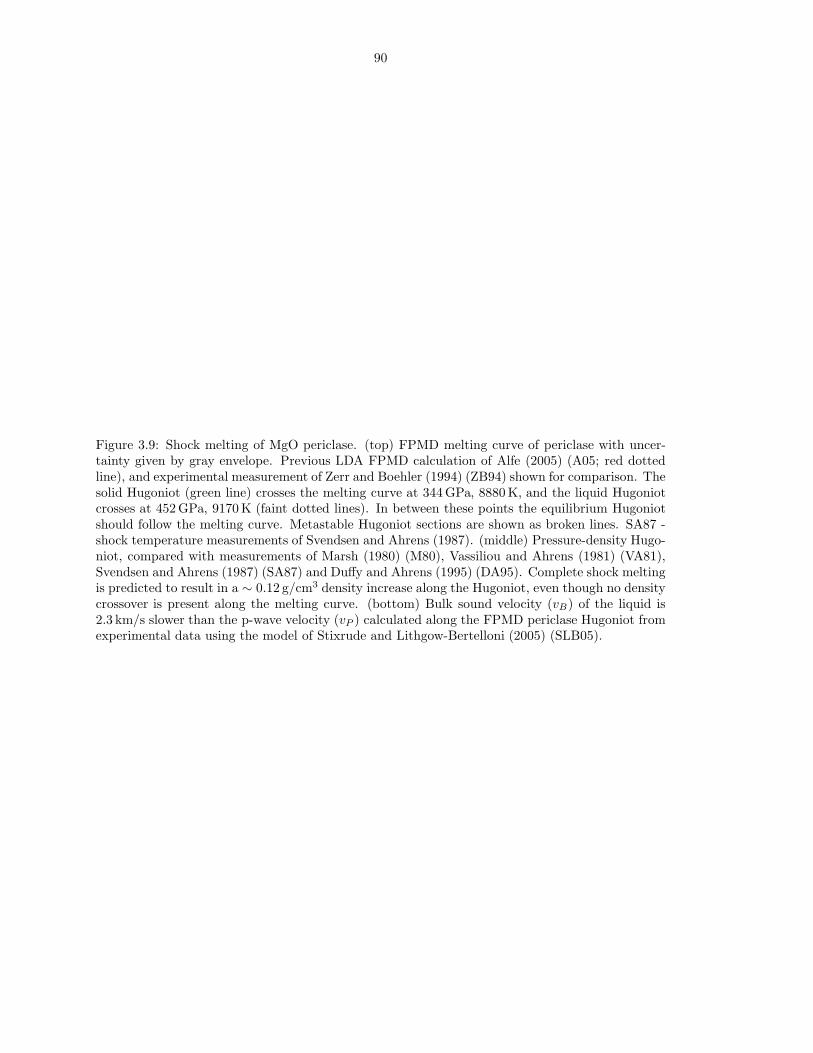
90
Figure 3.9: Shock melting of MgO periclase. (top) FPMD melting curve of periclase with uncer-tainty given by gray envelope. Previous LDA FPMD calculation of Alfe (2005) (A05; red dottedline), and experimental measurement of Zerr and Boehler (1994) (ZB94) shown for comparison. Thesolid Hugoniot (green line) crosses the melting curve at 344 GPa, 8880 K, and the liquid Hugoniotcrosses at 452 GPa, 9170 K (faint dotted lines). In between these points the equilibrium Hugoniotshould follow the melting curve. Metastable Hugoniot sections are shown as broken lines. SA87 -shock temperature measurements of Svendsen and Ahrens (1987). (middle) Pressure-density Hugo-niot, compared with measurements of Marsh (1980) (M80), Vassiliou and Ahrens (1981) (VA81),Svendsen and Ahrens (1987) (SA87) and Duffy and Ahrens (1995) (DA95). Complete shock meltingis predicted to result in a ∼ 0.12 g/cm3 density increase along the Hugoniot, even though no densitycrossover is present along the melting curve. (bottom) Bulk sound velocity (vB) of the liquid is2.3 km/s slower than the p-wave velocity (vP ) calculated along the FPMD periclase Hugoniot fromexperimental data using the model of Stixrude and Lithgow-Bertelloni (2005) (SLB05).
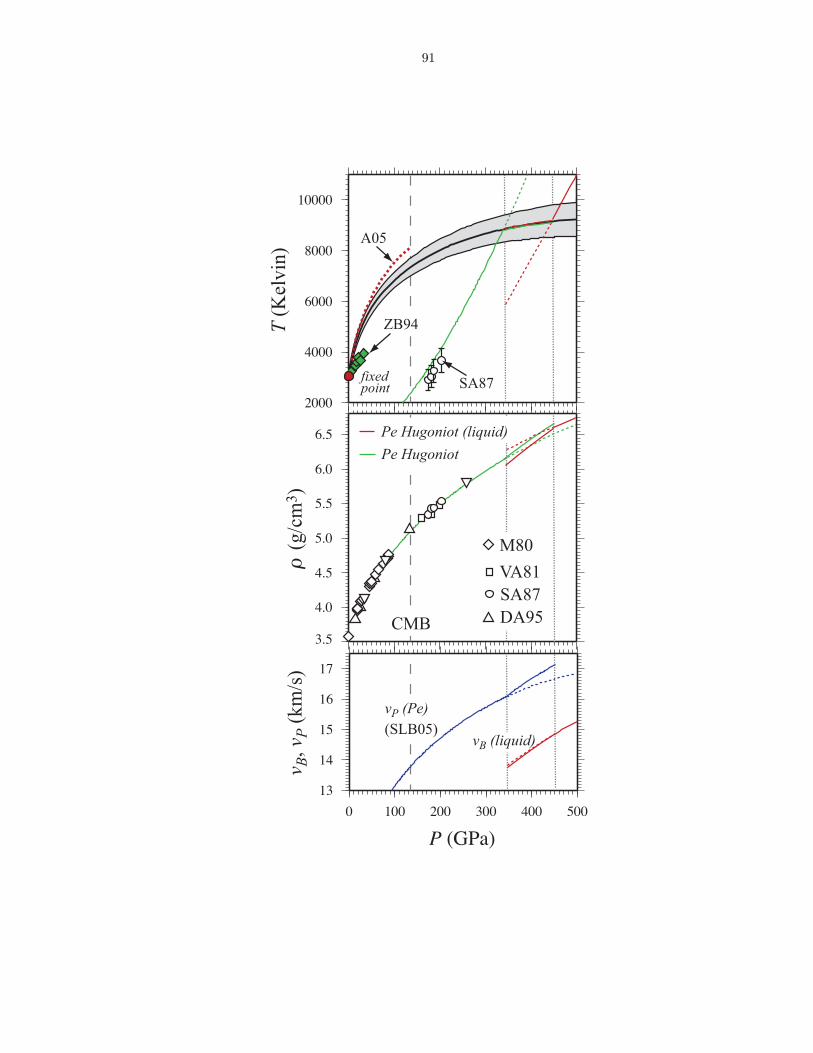
91
4.0
4.5
5.0
5.5
6.0
6.5
T (K
elvi
n)ρ
(g/
cm3 )
v B, v
P (
km/s
)
SA87DA95
M80
VA81
P (GPa)
CMB
Pe Hugoniot (liquid)
Pe Hugoniot
fixedpoint
vB (liquid)
SA872000
4000
6000
8000
10000
A05
ZB94
13
14
15
16
17
0 100 200 300 400 500
vP (Pe)(SLB05)
3.5
92
Figure 3.10: Shock melting of MgSiO3 perovskite. (top) FPMD melting curve of perovskite withuncertainty given by gray envelope. Result of Stixrude and Karki (2005) (SK05; red dotted line),and experimental measurements of Heinz and Jeanloz (1987) (HJ), Knittle and Jeanloz (1989)(KJ), Sweeney and Heinz (1998) (SH), Zerr and Boehler (1993) (ZB93), and Shen and Lazor (1995)(SL95) shown for comparison. The solid Hugoniot (green line) is almost identical to that calculatedfrom experimental data (Stixrude and Lithgow-Bertelloni, 2005), and crosses the melting curveat 155 GPa, 5520 K, with the liquid Hugoniot crossing at 242 GPa, 6290 K (faint dotted lines).In between these points the equilibrium Hugoniot should follow the melting curve. MetastableHugoniot sections are shown as broken lines. L04 - shock temperature measurements of Luo et al.(2004). (middle) Pressure-density Hugoniot, compared with measurements of Akins et al. (2004)(A04), and Luo et al. (2004) (L04). Complete shock melting is predicted to result in a ∼ 0.1 g/cm3
density increase along the Hugoniot, even though no density crossover is present along the meltingcurve. (bottom) Bulk sound velocity (vB) of the liquid is 2.6 km/s slower than the p-wave velocity(vP ) calculated along the FPMD perovskite Hugoniot from experimental data using the model ofStixrude and Lithgow-Bertelloni (2005) (SLB05).
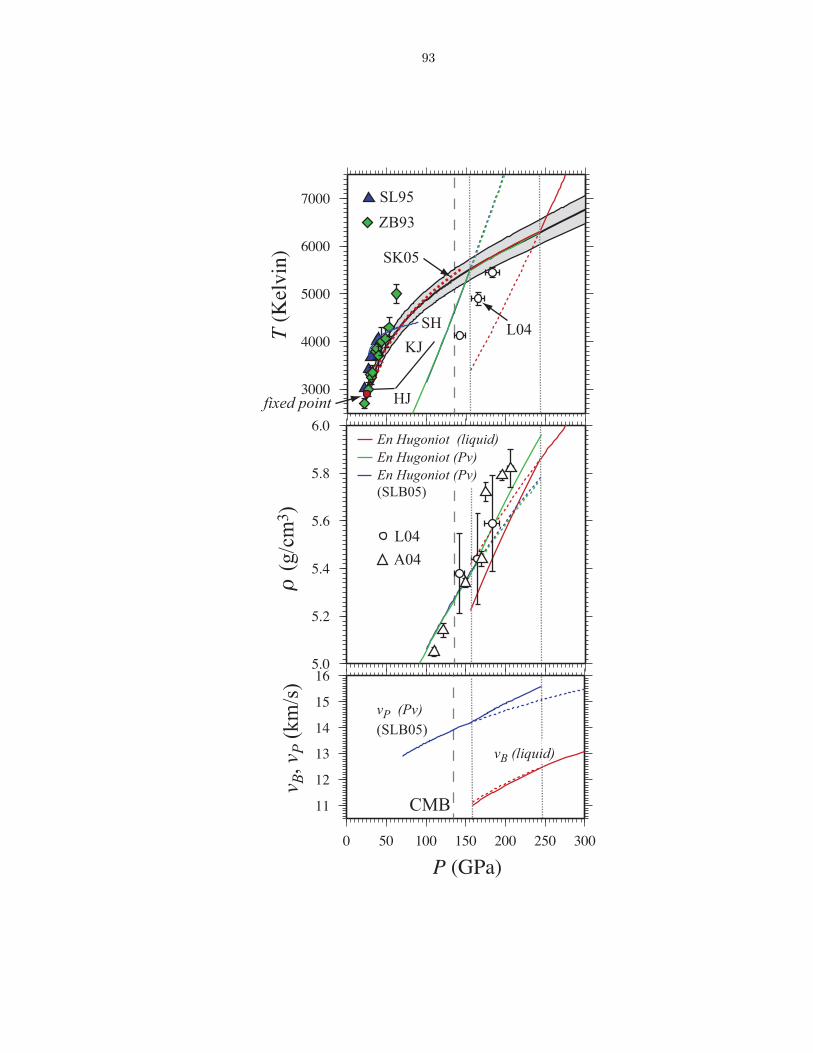
93
5.0
5.2
5.4
5.6
5.8
6.0
3000
4000
5000
6000
7000
P (GPa)
T (
Kel
vin)
v B, v
P (
km/s
)
SH
fixed point
vP (Pv)(SLB05)
SK05
ρ (
g/cm
3 )
CMB
En Hugoniot (liquid)En Hugoniot (Pv)En Hugoniot (Pv)(SLB05)
SL95
ZB93
L04
A04
vB (liquid)
L04
HJ
KJ
11
12
13
14
15
16
0 50 100 150 200 250 300
CHAPTER IV
Structure and Mixing of Liquids on the MgO − SiO2 Join and
the Origin of Liquid Immiscibility
4.1 Abstract
The properties of silicate melts in Earth’s deep interior are key to our under-
standing of its thermal and chemical evolution. Using results from first principles
molecular dynamics of six intermediate liquid compositions along the MgO-SiO2 join,
we investigate the compositional and pressure dependence of liquid state thermody-
namics and structure. At low pressure the enthalpy of mixing is notably pressure
dependent, primarily due to the disappearance with pressure of a maximum at high
silica compositions. Experimentally observed liquid immiscibility is a direct conse-
quence of this maximum. We identify the underlying contrasts in liquid structure
between pure SiO2 and intermediate composition liquids as the mechanism respon-
sible for liquid immiscibility, and illustrate its expression in other liquid properties
such as the Gruneisen parameter, isochoric heat capacity and compressibility. We
further find that the enthalpy of mixing is described by a two-parameter asymmetric
Margules solution model with pressure dependent interaction parameters.
94
95
4.2 Manuscript
It is widely recognized that the Earth was likely entirely molten during the late
stages of accretion (Urey, 1955; Tonks and Melosh, 1993; Ruff and Anderson, 1980;
Hanks and Anderson, 1969), and that melt may be present at great depth within
current day the mantle (Revenaugh and Sipkin, 1994; Song et al., 1994; Williams
and Garnero, 1996; Garnero and Helmberger, 1995). Knowledge of the eutectic
composition and temperature of the lower mantle can thus constrain the geotherm
and yield insight into the thermal and chemical evolution of the planet. Liquids in
the MgO-SiO2 system account for a major fraction of the composition of a terrestrial
magma ocean after core-mantle segregation. Liquid immiscibility is known to exist in
this system at ambient pressures (Bowen and Andersen, 1914; Hageman and Oonk,
1986; Dalton and Presnall, 1997), and its potential occurrence at great depth within
a magma ocean has notable implications for its chemical evolution. To address these
questions, knowledge of the thermodynamics of mixing at lower mantle pressures is
required to combine results from experimental and theoretical studies of individual
compositions into a universal thermodynamic model of silicate melts. Here, we use
results from first principles molecular dynamics (FPMD) simulations of a number
of liquid compositions along the MgO-SiO2 join to investigate thermodynamics of
mixing and the compositional dependence of liquid structure to very high pressures.
Our approach has been discussed extensively in previous studies (Stixrude and
Karki, 2005; de Koker et al., 2008a,b). Constant NV T FPMD (Nose, 1984) is per-
formed in the local density approximation (Ceperley and Alder, 1980, LDA) with
psuedopotentials (Kresse and Hafner, 1994) and the VASP planewave code (Kresse
and Furthmuller, 1996). We combine published simulation results for liquid MgO
96
(Karki et al., 2006), Mg2SiO4 (de Koker et al., 2008a), MgSiO3 (Stixrude and Karki,
2005) and SiO2 (Karki et al., 2007), with new simulations for intermediate com-
position liquids, Mg5SiO7, Mg3Si2O7, MgSi2O5 and MgSi3O7. These intermediate
systems are initiated by removing and/or transforming an appropriate number of
atoms from either MgSiO3 or Mg2SiO4 and evolving the resulting high energy con-
figuration to a favorable state at 10000 K for 6000 time steps by FPMD. The empirical
pressure correction which accounts for the systematic overbinding in LDA for these
compositions is determined by interpolation along the join using the known values
for MgO, Mg2SiO4, MgSiO3 and SiO2.
As found previously for Mg2SiO4 and MgSiO3, a third order finite strain and
second order thermal variable (θ) expansion is required to fit P (V, T ) and E(V, T )
for the intermediate composition liquids to the liquid state fundamental relation
(de Koker et al., 2008b) (Figures B.1 - B.4).
In all compositions Si − O coordination (ZSi−O) increases from 4 to 6 upon two-
fold compression, with this increase notably delayed in pure SiO2 (Figure 4.1). ZMg−O
is close to 5 for all systems at V/V0 = 1.0, with a strong compositional trend emerging
by V/V0 = 0.5, where ZMg−O = 7 in MgO and ZMg−O = 7.2 in Mg5SiO7 increases to
ZMg−O = 8.8 in MgSi3O7. Polymerization, as expressed by ZO−Si, changes strongly
as a function of pressure and composition. At 0 GPa and 3000 K, only free (OF;
ZO−Si = 0), non-bridging (ON; ZO−Si = 1), and bridging oxygen (OB; ZO−Si = 2) are
present. ON is present in all mixed compositions, but most abundant at XSiO2 = 0.4.
Highly coordinated oxygen species appear upon compression, with ZO−Si = 3, and
ZO−Si = 4 dominant in high silica liquids by 136 GPa and 6000 K (Figure 4.2). A
larger variety of oxygen species are present at high pressures, with abundances more
evenly spread along the join.
97
The changes in liquid structure with pressure and composition are strongly re-
flected by the thermodynamic properties. The increase in Gruneisen parameter (γ)
with compression is seen for all liquids along the join, albeit delayed in SiO2, and
highlights the relation between γ and ZSi−O (Figure 4.1). In solids, high pressure
phase transitions involving an increase in ZSi−O result in notable increases in γ, with
similar effects predicted for other cations, including Mg2+ (Jeanloz and Roufosse,
1982). The increase of γ with MgO content, and its notably weaker volume depen-
dence in MgO suggests that Mg − O bonds have intrinsically higher γ values, less
sensitive to changes in bond length. The decrease in compressibility with compres-
sion is delayed in SiO2 as well (Figure 4.3), while the decrease in KT0 values from
24 GPa in Mg5SiO7 to 9.9 GPa in MgSi3O7 is accompanied by an increase in K ′T0 from
5.88 to 8.24 (Table 4.1), consistent with a more general KT0 - K ′T0 anti-correlation
observed in silicate liquids (Lange, 2007).
At 0 GPa and 3000 K, the enthalpy of mixing (Hmix) shows a minimum of −22 kJ/mol
for Mg3Si2O7, and positive values at MgSi2O5 and MgSi3O7 (Figure 4.4). Extrapo-
lating Hmix to the critical miscibility temperature of 2250 K (Hageman and Oonk,
1986), we estimate an entropy of mixing (Smix) of 0.45 NkB at MgSi3O7. Above
7 GPa all Hmix values are negative, showing increasingly symmetric compositional
dependence. Pressure dependence in Hmix
(4.1)
(∂Hmix
∂P
)T
= Vmix (1 − Tαmix) .
results in a volume of mixing (Vmix), which displays a notably asymmetrical Vmix
minimum is at low pressure (Figure 4.4).
The contrast in compressional dependence of ZSi−O between pure SiO2 and liquid
mixtures, also reflected by γ, CV and KT , may be understood in terms of differences
in the liquid structure and its response to compression. In pure SiO2, the liquid

98
is completely polymerized, comprising an open framework topology (Karki et al.,
2007). Upon compression, this open structure initially adapts through changes in ring
statistics (Stixrude and Bukowinski, 1990b; Karki et al., 2007), before coordination
increase sets in. These mechanisms are absent in the liquid mixtures, where the
framework breaks down in the presence of a high field-strength network modifier
(Hess, 1995). The contrast in topology is further responsible for the extremes in
Hmix and Vmix at low pressure. The large density of high silica liquids relative to
pure SiO2 is consistent with the absence of an open framework. This less polymerized
structure is not energetically favorable (Kieffer and Angell, 1989), resulting in the
maximum in Hmix. Such a stability relation, whereby a low density two phase liquid
assemblage is more stable than a more dense, single liquid phase can only occur at
low pressures. The absence of a maximum in Hmix above about 7 GPa is in agreement
with the experimental observation of liquid immiscibility disappearing above 5 GPa
(Dalton and Presnall, 1997). Deep mantle liquid immiscibility can therefore not arise
by this mechanism, consistent with the compositional dependence of Hmix at deep
mantle pressures.
To model Hmix at constant P , we use a two-parameter Margules equation (Thomp-
son Jr., 1967)
(4.2) Hmix = WSiO2YSiO2(1 − YSiO2)2 + WMgO(1 − YSiO2)Y
2SiO2
,
(4.3) YSiO2 =XSiO2
λ + XSiO2(1 − λ),
where WSiO2 and WMgO are interaction parameters, and λ is a endmember scal-
ing parameter. For example λ = 3/2 changes the endmembers to Mg2O2 and
Si3O6. Interaction parameters and the required endmember scaling change notably
with pressure (Table 4.2). We thus find that the commonly applied assumption of
99
(∂Hmix/∂P )T = 0 and Vmix = 0 is insufficient for the MgO-SiO2 system. Although
this assumption has been applied with great success to modeling experimental data
for silicate liquids at low pressure (Stebbins et al., 1984; Lange and Carmichael,
1987; Ghiorso and Sack, 1995; Ghiorso et al., 2002; Ai and Lange, 2008), and has
also been shown to hold for a liquid mixture with CaAl2Si2O8 and CaMgSi2O6 as
endmembers at pressures up to 25 GPa (Rigden et al., 1989), these studies focus on
only a small section of compositional space, and are therefore unable to capture the
rich thermodynamic behavior that our results reveal. Our results serve as a reminder
that extrapolating these models outside the compositional range within which they
are parameterized must be done with caution, especially in the case of endmembers
for which liquid immiscibility is known to occur.
4.3 Acknowledgements
This research was supported by the National Science Foundation under Grants
EAR-0409074 and EAR-0409121. Computing facilities were provided by CCT at
Louisiana State University and by CAC at the University of Michgan.
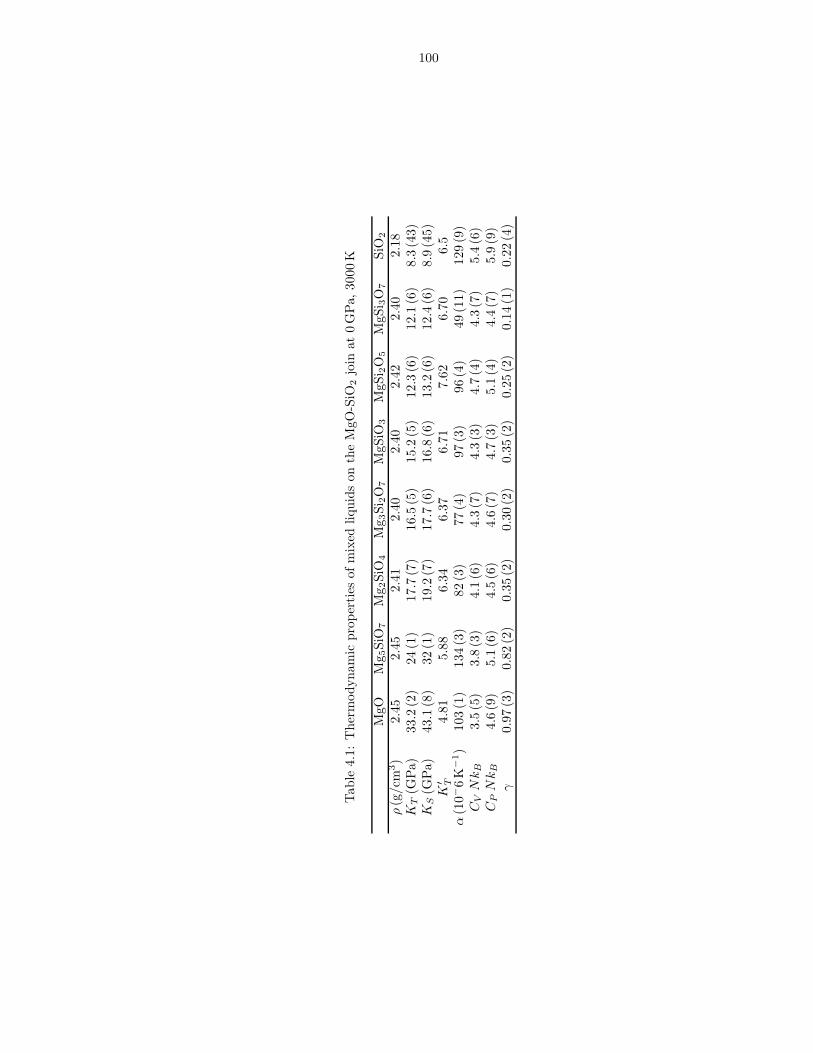
100
Tab
le4.
1:T
herm
odyn
amic
prop
erti
esof
mix
edliq
uids
onth
eM
gO-S
iO2
join
at0
GPa,
3000
K
MgO
Mg 5
SiO
7M
g 2Si
O4
Mg 3
Si2O
7M
gSiO
3M
gSi 2
O5
MgS
i 3O
7Si
O2
ρ(g
/cm
3)
2.45
2.45
2.41
2.40
2.40
2.42
2.40
2.18
KT
(GPa)
33.2
(2)
24(1
)17
.7(7
)16
.5(5
)15
.2(5
)12
.3(6
)12
.1(6
)8.
3(4
3)K
S(G
Pa)
43.1
(8)
32(1
)19
.2(7
)17
.7(6
)16
.8(6
)13
.2(6
)12
.4(6
)8.
9(4
5)K
′ T4.
815.
886.
346.
376.
717.
626.
706.
5α
(10−
6K
−1)
103
(1)
134
(3)
82(3
)77
(4)
97(3
)96
(4)
49(1
1)12
9(9
)C
VN
kB
3.5
(5)
3.8
(3)
4.1
(6)
4.3
(7)
4.3
(3)
4.7
(4)
4.3
(7)
5.4
(6)
CP
Nk
B4.
6(9
)5.
1(6
)4.
5(6
)4.
6(7
)4.
7(3
)5.
1(4
)4.
4(7
)5.
9(9
)γ
0.97
(3)
0.82
(2)
0.35
(2)
0.30
(2)
0.35
(2)
0.25
(2)
0.14
(1)
0.22
(4)
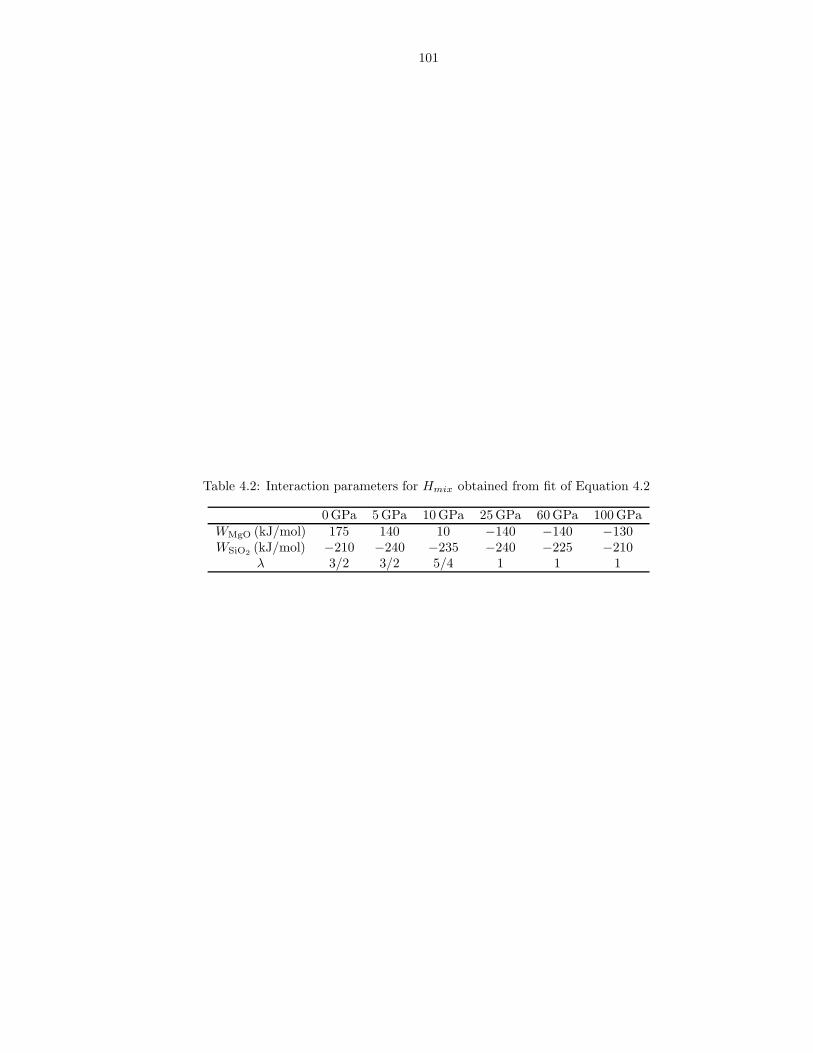
101
Table 4.2: Interaction parameters for Hmix obtained from fit of Equation 4.2
0 GPa 5 GPa 10 GPa 25 GPa 60 GPa 100 GPaWMgO (kJ/mol) 175 140 10 −140 −140 −130WSiO2 (kJ/mol) −210 −240 −235 −240 −225 −210
λ 3/2 3/2 5/4 1 1 1
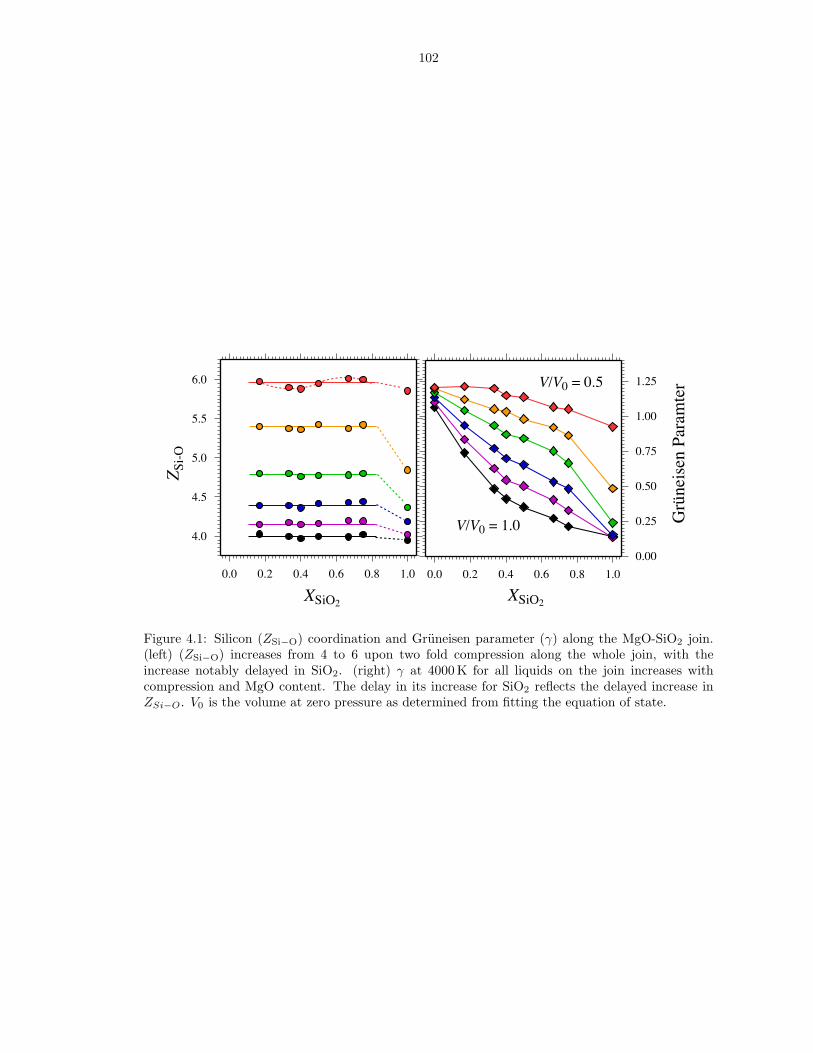
102
ZSi
-O
Grü
neis
en P
aram
ter
V/V0 = 1.0
V/V0 = 0.5
0.00
0.25
0.50
0.75
1.00
1.25
0.0 0.2 0.4 0.6 0.8 1.0
4.0
4.5
5.0
5.5
6.0
0.0 0.2 0.4 0.6 0.8 1.0
XSiO2XSiO2
Figure 4.1: Silicon (ZSi−O) coordination and Gruneisen parameter (γ) along the MgO-SiO2 join.(left) (ZSi−O) increases from 4 to 6 upon two fold compression along the whole join, with theincrease notably delayed in SiO2. (right) γ at 4000 K for all liquids on the join increases withcompression and MgO content. The delay in its increase for SiO2 reflects the delayed increase inZSi−O. V0 is the volume at zero pressure as determined from fitting the equation of state.
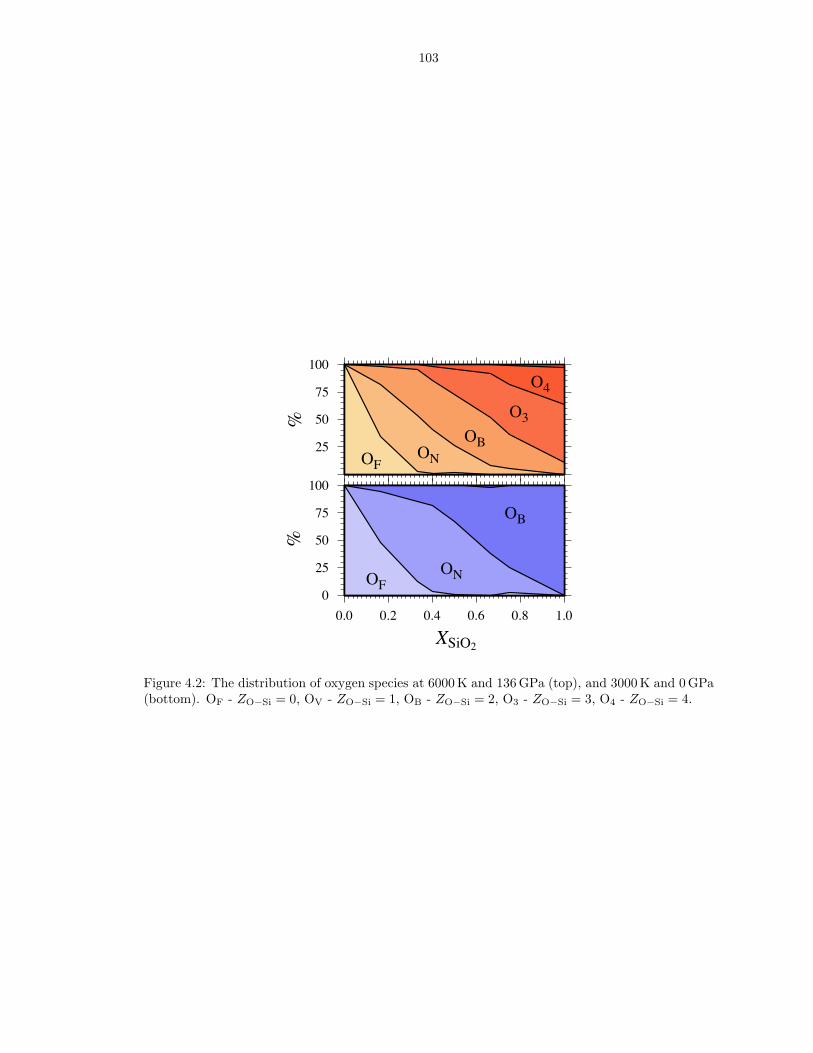
103
25
50
75
100O4
OFON
O3
OB
0
25
50
75
100
0.0 0.2 0.4 0.6 0.8 1.0
%
OFON
OB
XSiO2
%
Figure 4.2: The distribution of oxygen species at 6000 K and 136 GPa (top), and 3000 K and 0 GPa(bottom). OF - ZO−Si = 0, OV - ZO−Si = 1, OB - ZO−Si = 2, O3 - ZO−Si = 3, O4 - ZO−Si = 4.
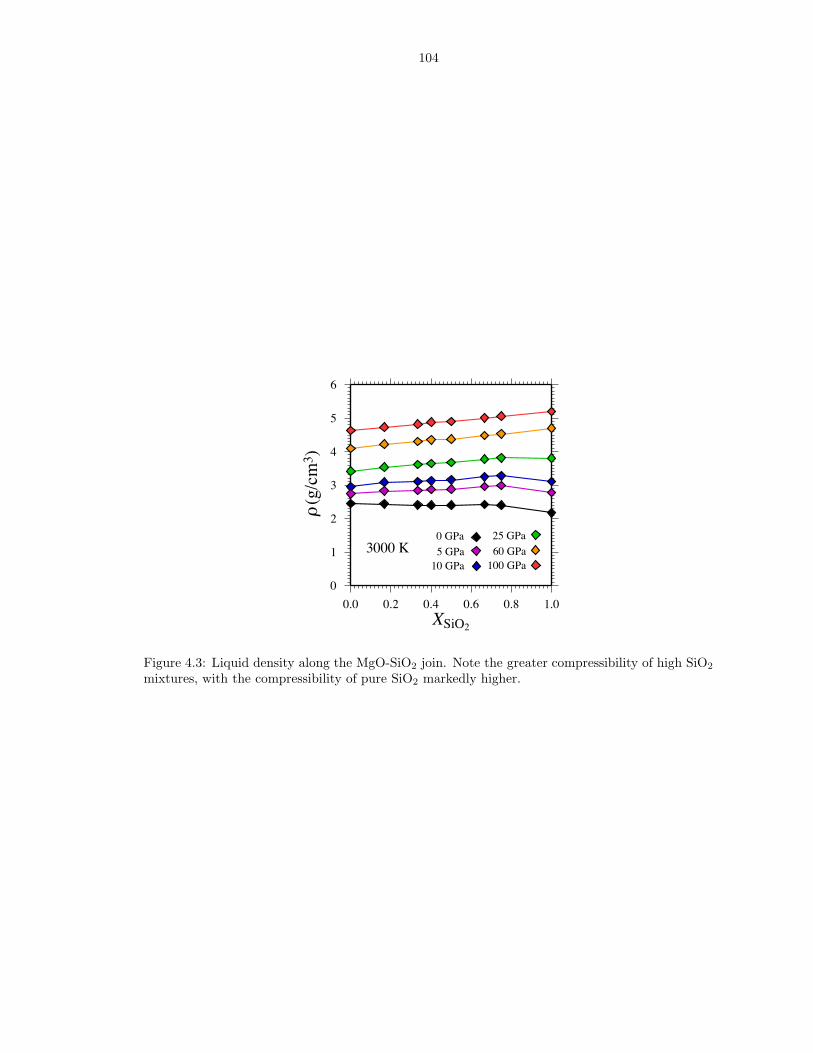
104
0 GPa
5 GPa10 GPa
25 GPa
60 GPa100 GPa
XSiO2
ρ(g
/cm
3 )
3000 K
0
1
2
3
4
5
6
0.0 0.2 0.4 0.6 0.8 1.0
Figure 4.3: Liquid density along the MgO-SiO2 join. Note the greater compressibility of high SiO2
mixtures, with the compressibility of pure SiO2 markedly higher.
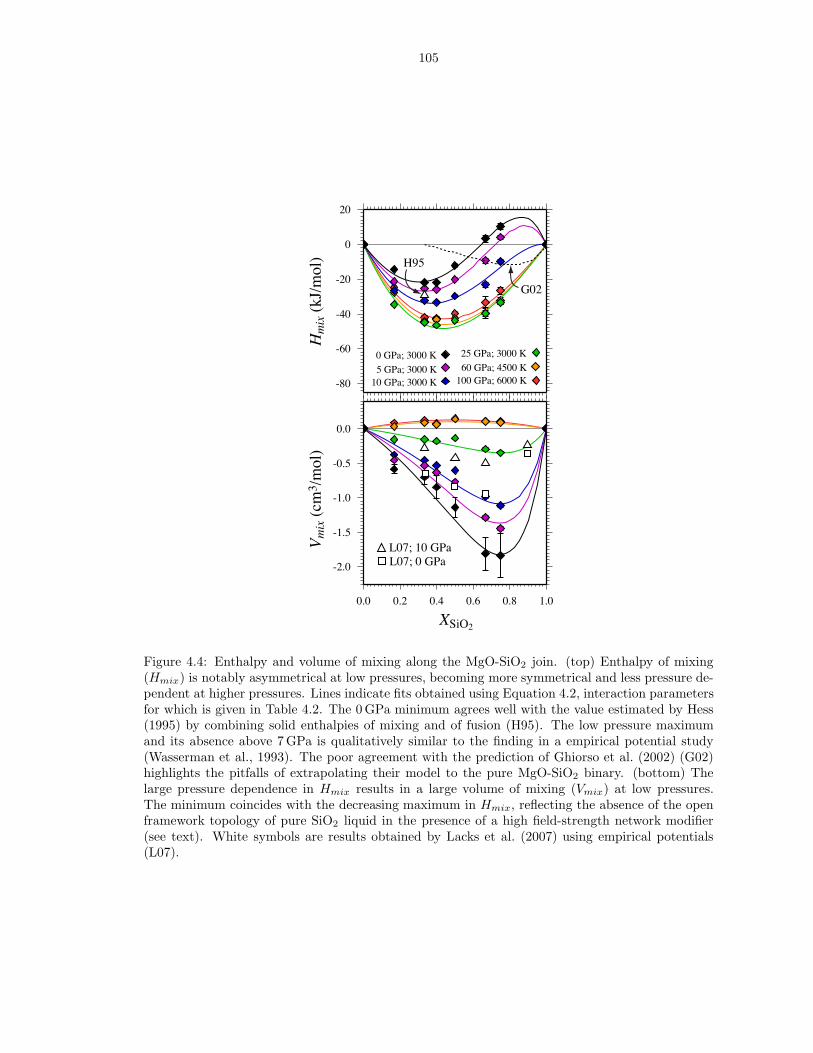
105
Hm
ix (
kJ/m
ol)
0 GPa; 3000 K
5 GPa; 3000 K10 GPa; 3000 K
25 GPa; 3000 K
60 GPa; 4500 K100 GPa; 6000 K
Vm
ix (
cm3 /
mol
)
-2.0
-1.5
-1.0
-0.5
0.0
0.0 0.2 0.4 0.6 0.8 1.0
L07; 0 GPaL07; 10 GPa
XSiO2
-80
-60
-40
-20
0
20
H95
G02
Figure 4.4: Enthalpy and volume of mixing along the MgO-SiO2 join. (top) Enthalpy of mixing(Hmix) is notably asymmetrical at low pressures, becoming more symmetrical and less pressure de-pendent at higher pressures. Lines indicate fits obtained using Equation 4.2, interaction parametersfor which is given in Table 4.2. The 0 GPa minimum agrees well with the value estimated by Hess(1995) by combining solid enthalpies of mixing and of fusion (H95). The low pressure maximumand its absence above 7 GPa is qualitatively similar to the finding in a empirical potential study(Wasserman et al., 1993). The poor agreement with the prediction of Ghiorso et al. (2002) (G02)highlights the pitfalls of extrapolating their model to the pure MgO-SiO2 binary. (bottom) Thelarge pressure dependence in Hmix results in a large volume of mixing (Vmix) at low pressures.The minimum coincides with the decreasing maximum in Hmix, reflecting the absence of the openframework topology of pure SiO2 liquid in the presence of a high field-strength network modifier(see text). White symbols are results obtained by Lacks et al. (2007) using empirical potentials(L07).
CHAPTER V
Conclusion
Two recurring conclusions emerge in the work presented here. The first is that
liquid structure, and its ability to change readily with compression, has a profound
influence on the macroscopic thermodynamic properties of the liquid. This is ex-
emplified in the origin of an isochemical density crossover along the melting curve
of forsterite (Chapter II), and of liquid immiscibility at low pressures, expressed in
the thermodynamics of mixing (Chapter IV). Properties and trends that distinguish
silicate liquids of varying composition from each other, and especially from the crys-
talline polymorphs, such as the increasing Gruneisen parameter, high compressibility
and high K ′T0 values, are all the direct expression of liquid structure and its response
to compression.
Because liquid structure depends directly on bonding, obtaining the correct liquid
structure requires the valence electronic structure to be accurately described. Indeed,
the second recurring conclusion is that describing the system directly in terms of the
charge density invariably gives superior results to that obtained by empirical poten-
tial atomistic simulation techniques. Results are accurate over a very large pressure
range, and information about the valence electronic structure and its contribution
to the free energy are computed self consistently. This is especially important in
106
107
liquids since, as we have shown in Chapter III, the thermal electronic free energy
contribution is not negligible at high temperatures.
Although we have illustrated the significant utility of first principles molecular
dynamics (FPMD), one should not lose sight of the fact that the various theoret-
ical components of our implementation, notably the local density approximation
(LDA), the Γ-point only Brillouin zone sampling, and the use of a periodic boundary
condition, are not without shortcomings. In calculating the equation of state and
transport properties, we corrected for these factors by estimating their likely effects.
The validity of these corrections remains to be tested by future studies as larger
computational resources and superior theoretical techniques become available.
In the introduction (Chapter I) we speculated regarding the presence of liquid
immiscibility and density crossovers within the deep mantle. We have subsequently
shown that liquid immiscibility is absent at pressures above about 7 GPa, and that
the structural mechanism responsible is only favorable at low pressure. We further
found that while Mg2SiO4 forsterite shows a density crossover, neither MgO peri-
clase, nor MgSiO3 perovskite melts to form a denser liquid, despite the continued
increase in cation coordination shown to be responsible for the density crossover in
forsterite. Therefore, if perovskite is the liquidus phase within a crystallizing magma
ocean, it will sink to depths where it may be re-assimilated, diminishing chemical
differentiation and prolonging the crystallization time scale.
We have also shown the increasing trend in the Gruneisen parameter (γ) to hold
for all liquids along the join. From the definition of the Gruneisen parameter and
Maxwell relations follow that
(5.1)
(∂ ln T
∂ ln ρ
)S
= γT
ρ.
Therefore, given the density profile of a magma ocean, the adiabat found for γ in-
108
creasing with density will be steeper than that found where γ decreases. An increas-
ing γ thus places existing estimates of the adiabatic profile within a magma ocean
under renewed scrutiny, since these estimates assume γ to decrease with compression
(Miller et al., 1991b).
Because the melting temperatures of liquids that contain Fe, Ca, Al and H2O will
be lower than those of the MgO-SiO2 system, our respective melting curves serve
as upper bounds for the melting temperatures of Fe-bearing olivine, perovskite and
ferropericlase, as well as for the mantle solidus. Given these estimates, should we
expect melt to be present at depth within the mantle? Our metastable congruent
melting temperature for forsterite at the experimental forsterite-wadsleyite transfor-
mation (2540± 60 K) is well above the estimated mantle temperature at the 410 km
discontinuity (1800 K; Stixrude and Lithgow-Bertelloni (2007)). The eutectic melt-
ing temperature of a garnet-peridotite mantle composition will therefore need to be
around 740 K lower to account for seismic observations. This difference is rather
high (Zhou and Miller, 1997; Presnall et al., 1998), even with a mantle geotherm
increase of 100 − 150 K associated with an upwelling plume, and additional factors,
such as water are needed for melting atop the 410 km discontinuity. Similarly, the
melting temperature of perovskite at the core-mantle boundary (5320 ± 210 km) is
well above estimates of the adiabatic temperature profile of the mantle at that depth
(2400 − 3100 K, Stixrude and Lithgow-Bertelloni (2007); Boehler (1996); Jeanloz
and Morris (1986)). Adjusting the melting temperature by 800− 1300 K (Zhou and
Miller, 1997) to account for freezing point depression and the effect due to additional
major elements is therefore not sufficient for melt to be present. However, melting
at the core-mantle boundary can occur if the geothermal profile within the thermal
boundary layer crosses the solidus. This is not unlikely, given the general estimates
109
of the melting temperature of Fe at this depth (4800±200 K, Williams et al. (1991)),
and is consistent with the observation that the ultra-low velocity zone is limited to
the very base of the D”.
Clearly a number of questions remain. We were able to compute congruent melting
curves for forsterite, perovskite and periclase, but can only approximate the effect of
incongruent melting. Accurate description of incongruent melting requires knowledge
of the chemical potential, for which both the enthalpy and entropy of mixing must
be known along the full extent of the join. We have shown that the liquid structure
comprises a number of Si − O coordination states, so that simple configurational
models for estimating the entropy of mixing (Hess, 1995; Charles, 1969) are not
sufficiently accurate to describe phase equilibria.
In relating our calculated melting curves to the mantle and its chemical composi-
tion, we make estimates of the potential effect of other major elements in the mantle,
notably Fe, Ca and Al. These estimates are based on systematics and simple ther-
modynamic arguments, and can only be accurately quantified through simulations
that include these elements. Due to the large number of valence electrons which
must be treated, FPMD simulations of Fe-bearing liquids require significantly more
computational resources, but it is certainly within reach. Studies of Ca-bearing, as
well hydrous liquids are under way (Sun, 2008; Mookherjee et al., 2008).

APPENDICES
110
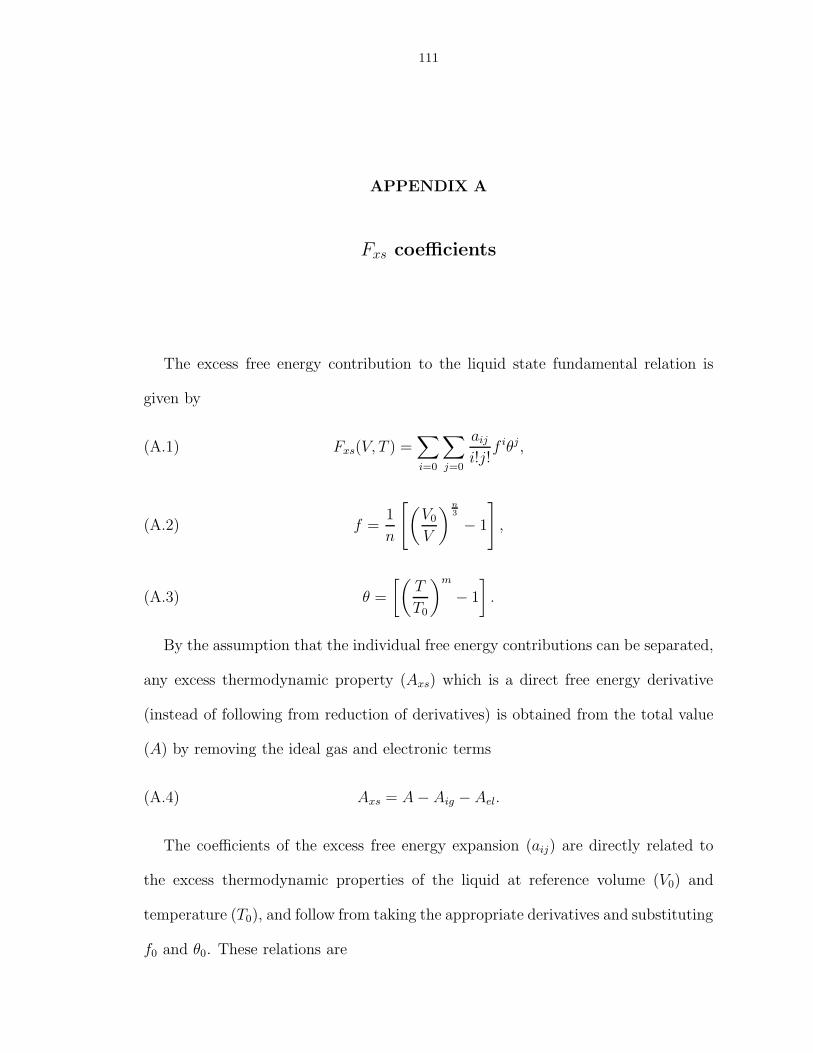
111
APPENDIX A
Fxs coefficients
The excess free energy contribution to the liquid state fundamental relation is
given by
(A.1) Fxs(V, T ) =∑i=0
∑j=0
aij
i!j!f iθj ,
(A.2) f =1
n
[(V0
V
)n3
− 1
],
(A.3) θ =
[(T
T0
)m
− 1
].
By the assumption that the individual free energy contributions can be separated,
any excess thermodynamic property (Axs) which is a direct free energy derivative
(instead of following from reduction of derivatives) is obtained from the total value
(A) by removing the ideal gas and electronic terms
(A.4) Axs = A − Aig − Ael.
The coefficients of the excess free energy expansion (aij) are directly related to
the excess thermodynamic properties of the liquid at reference volume (V0) and
temperature (T0), and follow from taking the appropriate derivatives and substituting
f0 and θ0. These relations are
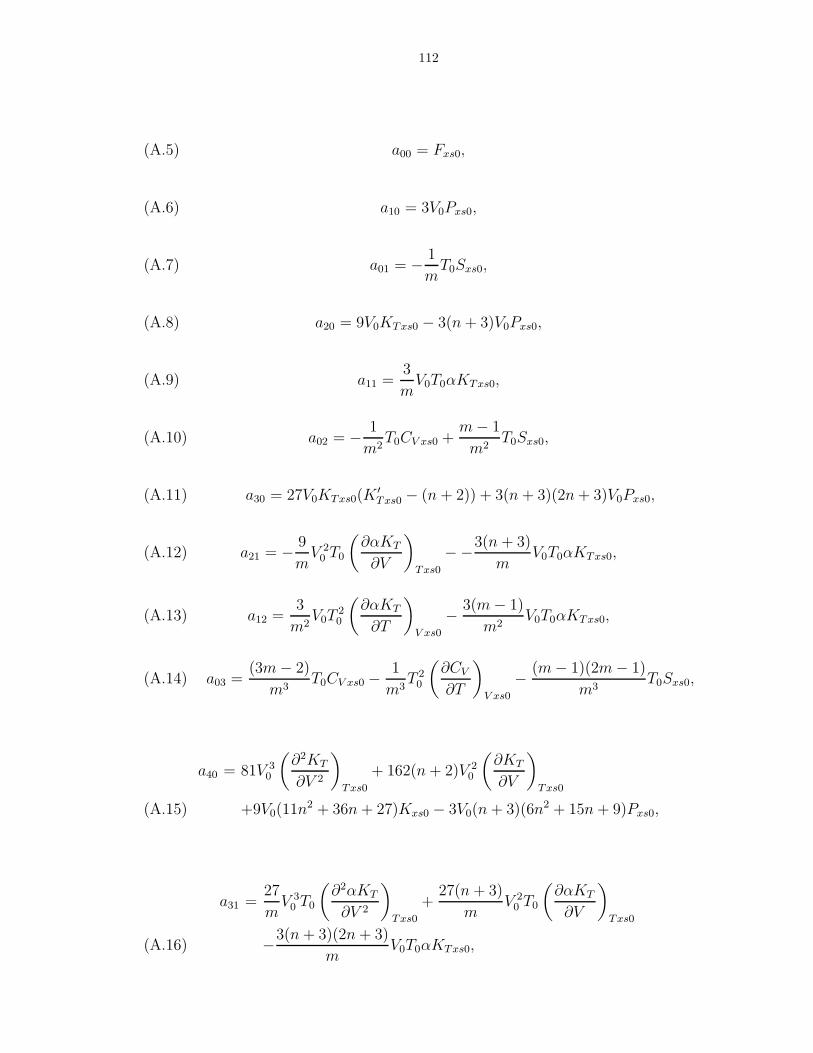
112
(A.5) a00 = Fxs0,
(A.6) a10 = 3V0Pxs0,
(A.7) a01 = − 1
mT0Sxs0,
(A.8) a20 = 9V0KTxs0 − 3(n + 3)V0Pxs0,
(A.9) a11 =3
mV0T0αKTxs0,
(A.10) a02 = − 1
m2T0CV xs0 +
m − 1
m2T0Sxs0,
(A.11) a30 = 27V0KTxs0(K′Txs0 − (n + 2)) + 3(n + 3)(2n + 3)V0Pxs0,
(A.12) a21 = − 9
mV 2
0 T0
(∂αKT
∂V
)Txs0
−−3(n + 3)
mV0T0αKTxs0,
(A.13) a12 =3
m2V0T
20
(∂αKT
∂T
)V xs0
− 3(m − 1)
m2V0T0αKTxs0,
(A.14) a03 =(3m − 2)
m3T0CV xs0 − 1
m3T 2
0
(∂CV
∂T
)V xs0
− (m − 1)(2m − 1)
m3T0Sxs0,
a40 = 81V 30
(∂2KT
∂V 2
)Txs0
+ 162(n + 2)V 20
(∂KT
∂V
)Txs0
+9V0(11n2 + 36n + 27)Kxs0 − 3V0(n + 3)(6n2 + 15n + 9)Pxs0,(A.15)
a31 =27
mV 3
0 T0
(∂2αKT
∂V 2
)Txs0
+27(n + 3)
mV 2
0 T0
(∂αKT
∂V
)Txs0
−3(n + 3)(2n + 3)
mV0T0αKTxs0,(A.16)
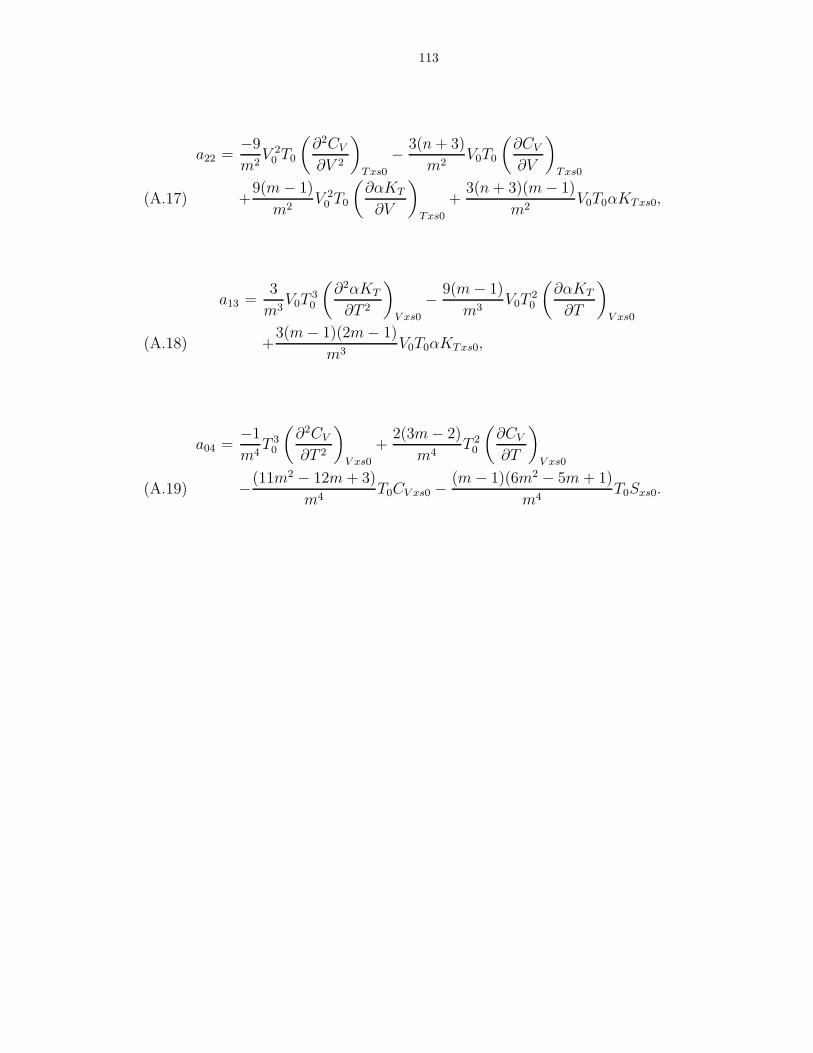
113
a22 =−9
m2V 2
0 T0
(∂2CV
∂V 2
)Txs0
− 3(n + 3)
m2V0T0
(∂CV
∂V
)Txs0
+9(m − 1)
m2V 2
0 T0
(∂αKT
∂V
)Txs0
+3(n + 3)(m − 1)
m2V0T0αKTxs0,(A.17)
a13 =3
m3V0T
30
(∂2αKT
∂T 2
)V xs0
− 9(m − 1)
m3V0T
20
(∂αKT
∂T
)V xs0
+3(m − 1)(2m − 1)
m3V0T0αKTxs0,(A.18)
a04 =−1
m4T 3
0
(∂2CV
∂T 2
)V xs0
+2(3m − 2)
m4T 2
0
(∂CV
∂T
)V xs0
−(11m2 − 12m + 3)
m4T0CV xs0 − (m − 1)(6m2 − 5m + 1)
m4T0Sxs0.(A.19)
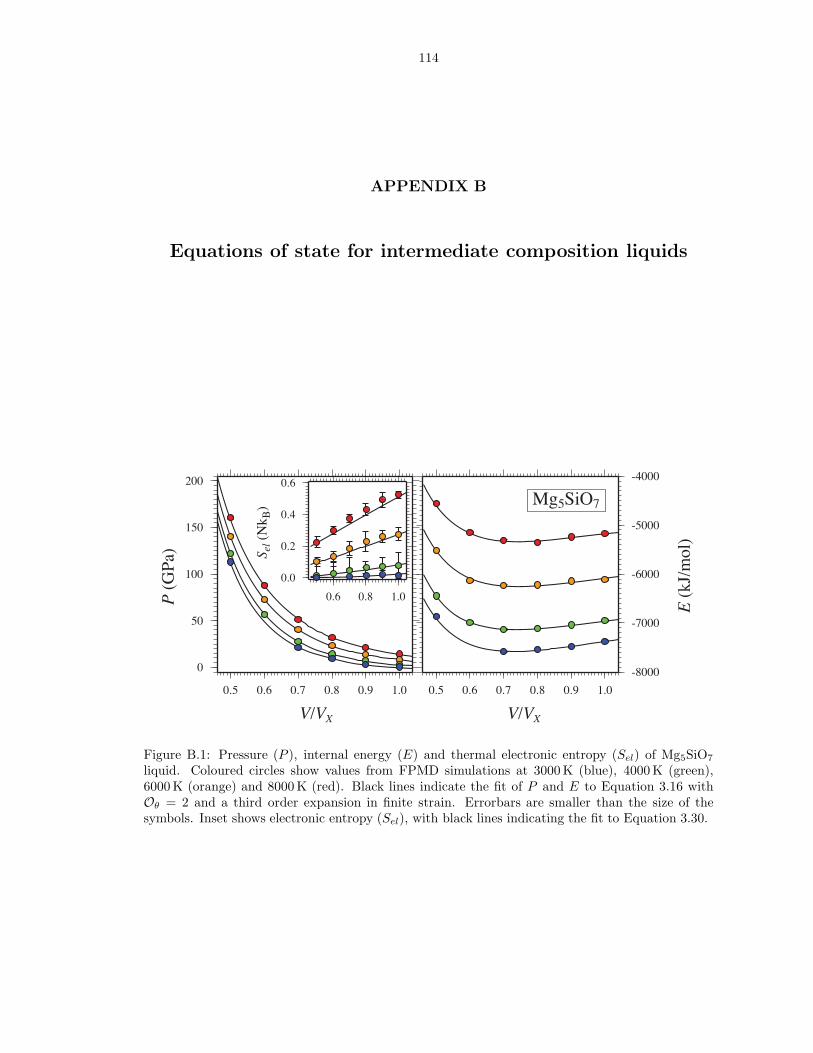
114
APPENDIX B
Equations of state for intermediate composition liquids
V/VX
P (
GPa
)
E (
kJ/m
ol)
V/VX
S el (
Nk B
) Mg5SiO7
-8000
-7000
-6000
-5000
-4000
0.5 0.6 0.7 0.8 0.9 1.0
0
50
100
150
200
0.5 0.6 0.7 0.8 0.9 1.0
0.0
0.2
0.4
0.6
0.6 0.8 1.0
Figure B.1: Pressure (P ), internal energy (E) and thermal electronic entropy (Sel) of Mg5SiO7
liquid. Coloured circles show values from FPMD simulations at 3000 K (blue), 4000 K (green),6000 K (orange) and 8000 K (red). Black lines indicate the fit of P and E to Equation 3.16 withOθ = 2 and a third order expansion in finite strain. Errorbars are smaller than the size of thesymbols. Inset shows electronic entropy (Sel), with black lines indicating the fit to Equation 3.30.
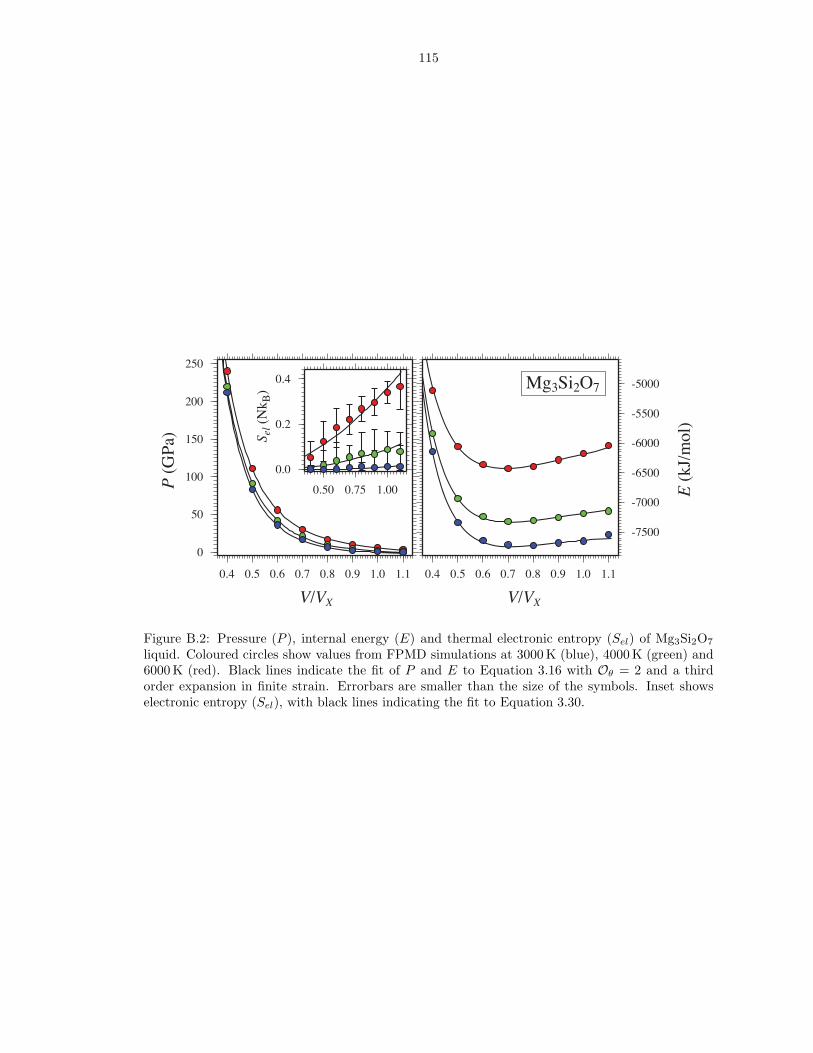
115
V/VX
P (
GPa
)
E (
kJ/m
ol)
V/VX
S el (
Nk B
) Mg3Si2O7
-7500
-7000
-6500
-6000
-5500
-5000
0.4 0.5 0.6 0.7 0.8 0.9 1.0 1.1
0
50
100
150
200
250
0.4 0.5 0.6 0.7 0.8 0.9 1.0 1.1
0.0
0.2
0.4
0.50 0.75 1.00
Figure B.2: Pressure (P ), internal energy (E) and thermal electronic entropy (Sel) of Mg3Si2O7
liquid. Coloured circles show values from FPMD simulations at 3000 K (blue), 4000 K (green) and6000 K (red). Black lines indicate the fit of P and E to Equation 3.16 with Oθ = 2 and a thirdorder expansion in finite strain. Errorbars are smaller than the size of the symbols. Inset showselectronic entropy (Sel), with black lines indicating the fit to Equation 3.30.
116
V/VX
P (
GPa
)
E (
kJ/m
ol)
V/VX
S el (
Nk B
) MgSi2O5
-5500
-5000
-4500
-4000
0.4 0.6 0.8 1.0 1.2
0
50
100
150
200
0.4 0.6 0.8 1.0 1.2
0.0
0.2
0.4
0.4 0.8 1.2
Figure B.3: Pressure (P ), internal energy (E) and thermal electronic entropy (Sel) of MgSi2O5
liquid. Coloured circles show values from FPMD simulations at 3000 K (blue), 4000 K (green) and6000 K (red). Black lines indicate the fit of P and E to Equation 3.16 with Oθ = 2 and a thirdorder expansion in finite strain. Errorbars are smaller than the size of the symbols. Inset showselectronic entropy (Sel), with black lines indicating the fit to Equation 3.30.
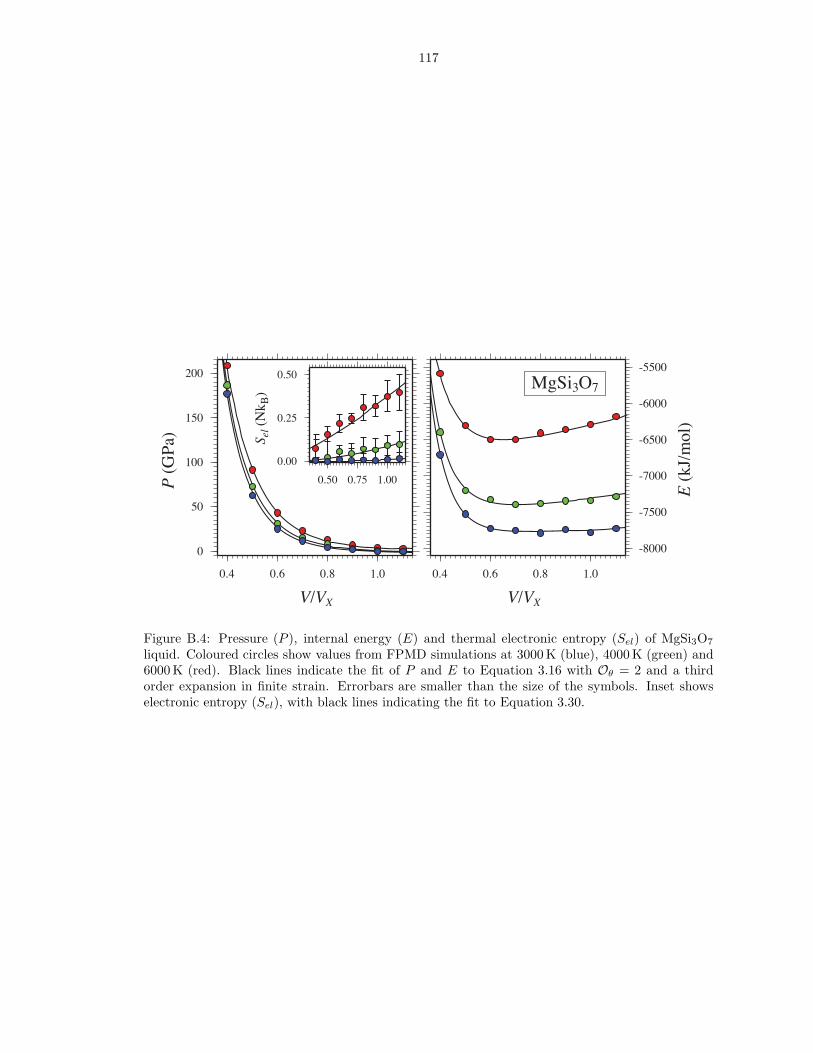
117
V/VX
P (
GPa
)
E (
kJ/m
ol)
V/VX
S el (
Nk B
)
MgSi3O7
0.00
0.25
0.50
0.50 0.75 1.00
0
50
100
150
200
0.4 0.6 0.8 1.0
-8000
-7500
-7000
-6500
-6000
-5500
0.4 0.6 0.8 1.0
Figure B.4: Pressure (P ), internal energy (E) and thermal electronic entropy (Sel) of MgSi3O7
liquid. Coloured circles show values from FPMD simulations at 3000 K (blue), 4000 K (green) and6000 K (red). Black lines indicate the fit of P and E to Equation 3.16 with Oθ = 2 and a thirdorder expansion in finite strain. Errorbars are smaller than the size of the symbols. Inset showselectronic entropy (Sel), with black lines indicating the fit to Equation 3.30.

BIBLIOGRAPHY
118
119
C. B. Agee and D. Walker. Static compression and olivine flotation in ultrabasic
silicate liquid. Journal of Geophysical Research, 93:3437–3449, 1988.
C. B. Agee and D. Walker. Olivine flotation in mantle melt. Earth and Planetary
Science Letters, 114:315–324, 1993.
Y. Ai and R. A. Lange. The compressibility of CaO-MgO-Al2O3-SiO2 liquids from
new acoustic velocity measurements: Reevaluation of the equation of state of
CaMgSi2O6-CaAl2SiO8 liquids to 25 GPa. Journal of Geophysical Research, in
press, 2008.
M. Akaogi, E. Ito, and A. Navrotsky. Olivine-modified spinel-spinel transitions in
the system Mg2SiO4-Fe2SiO4 - calorimetric measurements, thermochemical calcu-
lation, and geophysical application. Journal of Geophysical Research, 94(B11):
15671–15685, 1989.
J. A. Akins, S. N. Luo, P. D. Asimow, and T. J. Ahrens. Shock-induced melting
of MgSiO3 perovskite and implications for melts in Earth’s lowermost mantle.
Geophysical Research Letters, 31:L14612, 2004.
D. Alfe. Melting curve of MgO from first-principles simulations. Physical Review
Letters, 94:235701, 2005.
M. P. Allen and D. J. Tildesley. Computer Simulation of Liquids. Oxford University
Press, Oxford, 1st edition, 1987.
J. R. Allwardt, J. F. Stebbins, H. Terasaki, L. S. Du, D. J. Frost, A. C. Withers,
M. M. Hirschmann, A. Suzuki, and E. Ohtani. Effect of structural transitions
120
on properties of high-pressure silicate melts: 27Al NMR, glass densities, and melt
viscosities. American Mineralogist, 92:1093–1104, 2007.
C. A. Angell. Formation of glasses from liquids and biopolymers. Science, 267(5206):
1924–1935, 1995.
C. A. Angell, P. A. Cheeseman, and S. Tamaddon. Pressure enhancement of ion mo-
bilities in liquid silicates from computer-simulation studies to 800 Kilobars. Science,
218:885–887, 1982.
P. D. Asimow, M. M. Hirschmann, M. S. Ghiorso, M. J. O’Hara, and E. M. Stolper.
The effect of pressure-induced solid-solid transitions on decompression melting of
the mantle. Geochimica et Cosmochimica Acta, 59(21):4489–4506, 1995.
J. F. Bacon, A. A. Hasapis, and J. W. Wholley. Viscosity and density of molten
silica and high silica content glasses. Physics and Chemistry of Glasses, 1:90–98,
1960.
A. B. Belonoshko and L. S. Dubrovinsky. Molecular dynamics of NaCl (B1 and
B2) and MgO (B1) melting: Two-phase simulation. American Mineralogist, 81:
303–316, 1996.
A. B. Belonoshko and S. K. Saxena. A unified equation of state for fluids of C-H-O-N-
S-Ar composition and their mixtures up to very high temperatures and pressures.
Geochimica et Cosmochimica Acta, 56:3611–3626, 1992.
W. Benz, A. G. W. Cameron, and H. J. Melosh. The origin of the moon and the
single-impact hypothesis iii. Icarus, 81:113–131, 1989.
F. Birch. Elasticity and constitution of the Earth’s interior. Journal of Geophysical
Research, 57(2):227–286, 1952.
121
F. Birch. Finite strain isotherm and velocities for single-crystal and polycrystalline
NaCl at high pressures and 300 K. Journal of Geophysical Research, 83(B3):1257–
1268, 1978.
J. O. Bockris, J. A. Kitchener, and S. Ignatowicz. The electrical conductivity of
silicate melts - systems containing Ca, Mn and Al. Discussions of the Faraday
Society, pages 265–281, 1948.
R. Boehler. Melting temperature of the earth’s mantle and core: Earth’s thermal
structure. Annual Reviews of Earth and Planetary Sciences, 24:15–40, 1996.
R. Boehler and G. C. Kennedy. Pressure-dependence of thermodynamical Gruneisen
parameter of fluids. Journal of Applied Physics, 48:4183–4186, 1977.
Y. Bottinga. On the isothermal compressibility of silicate liquids at high-pressure.
Earth and Planetary Science Letters, 74:350–360, 1985.
Y. Bottinga and D. F. Weill. Viscosity of magmatic silicate liquids - model for
calculation. American Journal of Science, 272(5):438–475, 1972.
N. L. Bowen and O. Andersen. The binary system MgO − SiO2. American Journal
of Science, 37:487–500, 1914.
F. R. Boyd, J. L. England, and B. T. C. Davis. Effects of pressure on the melting
and polymorphism of enstatite, MgSiO3. Journal of Geophysical Research, 69(10):
2101–2109, 1964.
R. Boyle. New Experiments Physico-Mechanical, touching the Spring and Weight of
the Air, and its Effects. Oxford, 1662.
J. Brodholt. The melting curve of MgSiO3 perovskite from ab initio molecular dy-
122
namics using the coexistience method. 2008 APS March Meeting, New Orleans,
LA, page Abstract: J40.00001, 2008.
J. Brodholt and B. Wood. Simulations of the structure and thermodynamic pro-
preties of water at high pressures and temperatures. Journal of Geophysical
Research, 98(B1):519–536, 1993.
J. M. Brown, M. D. Furnish, and D. A. Boness. Sound velocities for San Carlos
olivine. In S. C. Schmidt and N. C. Holmes, editors, Shock Waves in Condensed
Matter. Elsevier, Amsterdam, 1987a.
J. M. Brown, M. D. Furnish, and R. G. McQueen. Thermodynamics for
(Mg, Fe)2SiO4 from the Hugoniot. In M. H. Manghnani and Y. Syono, editors,
High-Pressure Research in Mineral Physics. American Geophysical Union, Wash-
ington, D.C., 1987b.
H. B. Callen. Thermodynamics and an Introduction to Thermostatistics. John Wiley
and Sons, New York, 2nd edition, 1985.
R. M. Canup. Simulations of a late lunar-forming impact. Icarus, 168:433–456, 2004.
D. M. Ceperley and B. J. Alder. Ground-state of the electron-gas by a stochastic
method. Physical Review Letters, 45:566–569, 1980.
S. Chandrasekhar. An Introduction to the Study of Stellar Structure. University of
Chicago Press, Chicago, 1939.
R. J. Charles. The origin of immiscibility in silicate solutions. Physics and Chemistry
of Glasses, 10(5):169–178, 1969.
C. H. Chen and D. C. Presnall. The system Mg2SiO4-SiO2 at pressures up to 25
kilobars. American Mineralogist, 60:398–406, 1975.
123
G. Q. Chen, T. J. Ahrens, and E. M. Stolper. Shock-wave equation of state of molten
and solid fayalite. Physics of the Earth and Planetery Interiors, 134:35–52, 2002.
B. P. E. Clapeyron. Memoire sur la puissance motrice de la chaleur. Journal de
l’ecole polytechnique Paris, 14:153–190, 1834.
R. E. Cohen and Z. Gong. Melting and melt structure of MgO at high pressures.
Physical Review B, 50(17):12301–12311, 1994.
K. D. Collerson, S. Hapugoda, B. S. Kamber, and Q. Williams. Rocks from the
mantle transition zone: Majorite-bearing xenoliths from malaita, southwest pacific.
Science, 288:1215–1223, 2000.
T. F. Cooney and S. K. Sharma. Structure of glasses in the systems Mg2SiO4-Fe2SiO4,
Mn2SiO4-Fe2SiO4, Mg2SiO4-CaMgSiO4, and Mn2SiO4-CaMnSiO4. Journal of
Non-Crystalline Solids, 122:10–32, 1990.
P. Courtial, E. Ohtani, and D. B. Dingwell. High-temperature densities of some
mantle melts. Geochimica et Cosmochimica Acta, 61(15):3111–3119, 1997.
J. A. Dalton and D. C. Presnall. No liquid immiscibility in the system MgSiO3-SiO2
at 5.0 GPa. Geochimica et Cosmochimica Acta, 61(12):2367–2373, 1997.
B. T. C. Davis and J. L. England. Melting of forsterite up to 50 Kilobars. Journal
of Geophysical Research, 69:1113–1116, 1964.
L. A. Davis and R.B. Gordon. Compression of mercury at high pressure. Journal of
Chemical Physics, 46:2650, 1967.
N. P. de Koker, L. Stixrude, and B. B. Karki. Thermodynamics, structure, dynamics,
and freezing of Mg2SiO4 liquid at high pressure. Geochimica et Cosmochimica Acta,
72:1427–1441, doi:10.1016/j.gca.2007.12.019, 2008a.
124
N. P. de Koker, L. Stixrude, and B. B. Karki. Self-consistent thermodynamic de-
scription of silicate liquids. to be submitted to Geophysical Journal International,
2008b.
D. B. Dingwell, R. Knoche, and S. L. Webb. A volume temperature relationship
for liquid GeO2 and some geophysically relevant derived parameters for network
liquids. Physics and Chemistry of Minerals, 19:445–453, 1993.
P. I. Dorogokupets. Thermodynamic functions at zero pressure and their relation to
equations of state of minerals. American Mineralogist, 85:329–337, 2000.
T. S. Duffy and T. J. Ahrens. Compressional sound velocity, equation of state,
and constitutive response of shock-compressed magnesium oxide. Journal of
Geophysical Research, 100(B1):529–542, 1995.
J. F. Elliott, M. Gleiser, and V. Ramakrishna. Thermochemistry of Steelmaking,
Vol II. Addison-Wesley, 1963.
R. P. Feynman, N. Metropolis, and E. Teller. Equations of state of elements based
on the generalized Fermi-Thomas theory. Physical Review, 75:1561–1572, 1949.
H. Flyvberg and H. G. Petersen. Error-estimates on averages of correlated data.
Journal of Chemical Physics, 91:461–466, 1989.
G. P. Francis and M. C. Payne. Finite basis set corrections to total energy pseu-
dopotential calculations. Journal of Physics - Condensed Matter, 2(19):4395–4404,
1990.
G. A. Gaetani, P. D. Asimow, and E. M. Stolper. Determination of the partial
molar volume of SiO2 in silicate liquids at elevated pressures and temperatures: A
125
new experimental approach. Geochimica et Cosmochimica Acta, 62(14):2499–2508,
1998.
E. J. Garnero and D. V. Helmberger. A very slow basal layer underlying large-scale
low-velocity anomalies in the lower mantle beneath the pacific: evidence from core
phases. Physics of Earth and Planetary Interiors, 91:161–176, 1995.
M. S. Ghiorso. An equation of state for silicate melts. I. formulation of a general
model. American Journal of Science, 304:637–678, 2004.
M. S. Ghiorso and R. O. Sack. Chemical mass transfer in magmatic processes IV. a
revised and internally consistent thermodynamic model for the interpolation and
extrapolation of liquid-solid equilibria in magmatic systems at elevated temper-
atures and pressures. Contributions to Mineralogy and Petrology, 119:197–212,
1995.
M. S. Ghiorso, M. M. Hirschmann, P. W. Reiners, and V. C. Kress. The pMELTS:
A revision of MELTS for improved calculation of phase relations and major ele-
ment partitioning related to partial melting of the mantle to 3 GPa. Geochemistry
Geophysics Geosystems, 3(5):10.1029/2001GC000217, 2002.
M. S. Ghiorso, D. Nevins, and F. J. Spera. Molecular dynamics studies of MgSiO3
liquid to 150 GPa: An equation of state (EOS), tracer diffusivities, and a detailed
analysis of changes in atomic coordination statistics as a function of temperature
and pressure. Eos Trans. AGU, 87(52):Fall Meeting Supplement, Abstract MR43B–
1079, 2006.
M. J. Gillan, D. Alfe, J. P. Brodholt, L. Vocadlo, and G. D. Price. First-principles
modelling of Earth and planetary materials at high pressures and temperatures.
Reports on Progress in Physics, 69(8):2365–2441, 2006.
126
J. J. Gilvarry. The Lindemann and Gruneisen laws. Physical Review, 102:308–316,
1956.
P. Gomes Dacosta, O. H. Nielsen, and K. Kunc. Stress theorem in the determination
of static equilibrium by the density functional method. Journal of Physics C - Solid
State Physics, 19(17):3163–3172, 1986.
J. W. Greig. Immiscibility in silicate melts. American Journal of Science, 13(73):
1–44, 1927.
V. B. M. Hageman and H. A. J. Oonk. Liquid immiscibility in the SiO2 + MgO,
SiO2 + SrO, SiO2 + LaO3, and SiO2 + Y2O3 systems. Physics and Chemistry of
Glasses, 27(5):194–198, 1986.
S. E. Haggerty and V. Sautter. Ultradeep (greater than 300 kilometers), ultramafic
upper mantle xenoliths. Science, 248:993–996, 1990.
H. Halbach and N. D. Chatterjee. An empirical Redlich-Kwong-type equation of state
for water to 1, 000 ◦C and 100 Kbar. Contributions to Mineralogy and Petrology,
79:337–345, 1982.
T. C. Hanks and D. L. Anderson. The eartly thermal history of the earth. Physics
of the Earth and Planetery Interiors, 2:19–29, 1969.
D. L. Heinz and R. Jeanloz. Measurement of the melting curve of Mg0.9Fe0.1SiO3 at
lower mantle conditions and its geophysical implications. Journal of Geophysical
Research, 92(B11):11437–11444, 1987.
P. C. Hess. Polymerization model for silicate melts. In R. B. Hargraves, editor,
Physics of Magmatic Processes, pages 3–48. Princeton University Press, Princeton,
NJ, 1980.
127
P. C. Hess. Thermodynamic mixing properties and the structure of silicate melts.
In J. F. Stebbins, P. F. McMillan, and D. B. Dingwell, editors, Structure,
Dynamics and Properties of Silicate Melts, volume 32 of Review in Mineralogy
and Geochemistry, pages 145–189. Mineralogical Society of America, Washington,
D.C., 1995.
D. G. Hicks, T. R. Boehly, J. H. Eggert, J. E. Miller, P. M. Celliers, and G. W.
Collins. Dissociation of liquid silica at high pressures and temperatures. Physical
Review Letters, 97:doi:10.1103/PhysRevLett.97.025502, 2006.
A. M. Hofmeister. Interatomic potentials calculated from equations of state: Limita-
tion of finite strain to moderate K ′. Geophysical Research Letters, 20(7):635–638,
1993.
P. Hohenberg and W. Kohn. Inhomogeneous electron gas. Physical Review B., 136:
B864, 1964.
K. G. Holland and T. J. Ahrens. Melting of (Mg, Fe)2SiO4 at the core-mantle bound-
ary of the Earth. Science, 275:1623–1625, 1997.
T. Holland and R. Powell. A compensated-Redlich-Kwong (CORK) equation for
volumes and fugacities of CO2 and H2O in the range 1 bar to 50 kbar and 100 −
1600 ◦C. Contributions to Mineralogy and Petrology, 109:265–273, 1991.
P. Hudon, I.-H. Jung, and D. R. Baker. Melting of β-quartz up to 2.0 GPa and
thermodynamic optimization of the silica liquidus up to 6.0 GPa. Physics of the
Earth and Planetery Interiors, 130:159–174, 2002.
D. G. Isaak, O. L. Anderson, and T. Goto. Measured elastic moduli of single-crystal
MgO up to 1800 K. Physics and Chemistry of Minerals, 16:704–713, 1989.
128
I. Jackson and T. J. Ahrens. Shock wave compression of single-crystal forsterite.
Journal of Geophysical Research, 84(B6):3039–3048, 1979.
R. Jeanloz and S. Morris. Temperature distribution in the crust and mantle. Annual
Reviews of Earth and Planetary Sciences, 14:377–415, 1986.
R. Jeanloz and M. Roufosse. Anharmonic properties - ionic model of the effects
of compression and coordination change. Journal of Geophysical Research, 87:
763–772, 1982.
B. B. Karki, R. M. Wentzcovitch, S. De Gironcoli, and S. Baroni. High-pressure
lattice dynamics and thermoelasticity of MgO. Physical Review B, 61(13):8793–
8800, 2000a.
B. B. Karki, R. M. Wentzcovitch, S. de Gironcoli, and S. Baroni. Ab initio lattice
dynamics of MgSiO3 perovskite at high pressure. Physical Review B, 62(22):14750–
14756, 2000b.
B. B. Karki, L. Stixrude, and R. M. Wentzcovitch. High-pressure elastic properties
of major materials of Earth’s mantle from first principles. Reviews of Geophysics,
39:507–534, 2001.
B. B. Karki, D. Bhattarai, and L. Stixrude. First principles calculations of the
structural, dynamical and electronic properties of liquid MgO. Physical Review B,
73:174208, 2006.
B. B. Karki, D. Bhattarai, and L. Stixrude. First-principles simulations of liquid
silica: Structural and dynamical behavior at high pressure. Physical Review B, 76:
104205, 2007.
129
T. Kato and M. Kumazawa. Effect of high-pressure on the melting relation in the
system Mg2SiO4-MgSiO3. 1. eutectic relation up to 7 GPa. Journal of Physics of
the Earth, 33(6):513–524, 1985.
J. Kieffer and C. A. Angell. Structural incompatibilities and liquid-liquid phase
separation in molten binary silicates: A computer simulation. Journal of Chemical
Physics, 90(9):4982–4991, 1989.
J. G. Kirkwood. Quantum statistics of almost classical assemblies. Physical Review,
44:31–37, 1933.
E. Knittle and R. Jeanloz. Melting curve of (Mg, Fe)SiO3 perovskite to 96 GPa,
evidence for a structural transition in lower mantle melts. Geophysical Research
Letters, 16(5):421–424, 1989.
L. Knopoff and J. N. Shapiro. Pseudo-Gruneisen parameter of liquids. Physical
Review B., 1:3893, 1970.
L Knopoff and R. J. Uffen. The densities of compounds at high pressures and the
state of the Earth’s interior. Journal of Geophysical Research, 59:471–484, 1954.
S. Kohara, K. Suzuya, K. Takeuchi, C. K. Loong, M. Grimsditch, J. K. R. Weber,
J. A. Tangeman, and T. S. Key. Glass formation at the limit of insufficient network
formers. Science, 303:1649–1652, 2004.
W. Kohn and L. J. Sham. Self-consistent equations including exchange and correla-
tion effects. Physical Review, 140:1133, 1965.
G. Kresse and J. Furthmuller. Efficiency of ab-initio total energy calculations for
metals and semiconductors using a plane-wave basis set. Computational Materials
Science, 6:15–50, 1996.
130
G. Kresse and J. Hafner. Norm-conserving and ultrasoft pseudopotentials for first-
row and transition-elements. Journal of Physics - Condensed Matter, 6:8245–8257,
1994.
J. D. Kubicki and A. C. Lasaga. Molecular-dynamics simulations of pressure and tem-
perature effects on MgSiO3 and Mg2SiO4 melts and glasses. Physics and Chemistry
of Minerals, 17:661–673, 1991.
J. D. Kubicki, G. E. Muncill, and A. C. Lasaga. Chemical diffusion in melts on the
CaMgSi2O6-CaAl2Si2O8 join under high-pressures. Geochimica et Cosmochimica
Acta, 54(10):2709–2715, 1990.
D. J. Lacks, D. B. Rear, and J. A. Van Orman. Molecular dynamics investigation
of viscosity, chemical diffusivities and partial molar volumes of liquids along the
MgO-SiO2 join as functions of pressure. Geochimica et Cosmochimica Acta, 71:
1312–1323, 2007.
R. A. Lange. A revised model for the density and thermal expansivity of K2O-Na2O-
CaO-MgO-Al2O3-SiO2 liquids from 700 to 1900 K: extension to crustal magmatic
temperatures. Contributions to Mineralogy and Petrology, 130:1–11, 1997.
R. A. Lange. The fusion curve of albite revisited and the compressibility of NaAlSi3O8
liquid with pressure. American Mineralogist, 88:109–120, 2003.
R. A. Lange. The density and compressibility of KAlSi3O8 liquid to 6.5 GPa.
American Mineralogist, 92:114–123, 2007.
R. A. Lange and I. S. E. Carmichael. Densities of Na2O-K2O-CaO-MgO-FeO-Fe2O3-
Al2O3 − TiO2-SiO2 liquids - new measurements and derived partial molar proper-
ties. Geochimica et Cosmochimica Acta, 51:2931–2946, 1987.
131
R. A. Lange and A. Navrotsky. Heat capacities of Fe2O3-bearing silicate liquids.
Contributions to Mineralogy and Petrology, 110:311–320, 1992.
Y. Laudernet, J. Clerouin, and S. Mazevet. Ab initio simulations of the electrical
and optical properties of shock-compressed SiO2. Physical Review B, 70:165108,
2004.
F. A. Lindemann. uber die berechnung molekularer eigenfrequenzen. Physikalische
Zeitschrift, 11:609–612, 1910.
S. N. Luo, J. L. Mosenfelder, P. D. Asimow, and T. J. Ahrens. Direct shock wave
loading of stishovite to 235 GPa: Implications for perovskite stability relative to
an oxide assemblage at lower mantle conditions. Geophysical Research Letters, 29
(14):36, 2002.
S. N. Luo, J. A. Akins, T. J. Ahrens, and P. D. Asimow. Shock-compressed MgSiO3
glass, enstatite, olivine, and quartz: Optical emission, temperatures, and melting.
Journal of Geophysical Research, 109:B05205, 2004.
C. H. P. Lupis. Chemical Thermodynamics of Materials. Prentice-Hall Inc., New
York, 1983.
S. P. Marsh. LASL Shock Hugoniot Data. University of California Press, Berkeley,
CA, 1980.
R. E. Marshak and H. A. Bethe. The generalized Thomas-Fermi method as applied
to stars. Astrophysical Journal, 91:239–243, 1940.
B. Martin, F. J. Spera, and D. Nevins. Thermodynamic and structural properties of
liquid Mg2SiO4 at high temperatures and pressure in the range 0 − 150 GPa from
132
molecular dynamics simulation. Eos Trans. AGU, 87(52):Fall Meeting Supplement,
Abstract MR43B–1080, 2006.
K. N. Matsukage, Z. Jing, and S. Karato. Density of hydrous silicate melt at the
conditions of Earth’s deep upper mantle. Nature, 438:488–491, 2005.
D. McKenzie and M. J. Bickle. The volume and composition of melt generated by
extension of the lithosphere. Journal of Petrolgy, 29(3):625–679, 1988.
P. McMillan. A Raman spectroscopic study of glasses in the system CaO-MgO-SiO2.
American Mineralogist, 69:645–659, 1984.
D. A. McQuarrie. Statistical Mechanics. University Science Books, Sausalito, CA,
1984.
N. D. Mermin. Thermal properties of inhomogeneous electron gas. Physical Review,
137:1441, 1965.
G. H. Miller, E. M. Stolper, and T. J. Ahrens. The equation of state of a molten
komatiite. 1. shock wave compression to 36 GPa. Journal of Geophysical Research,
96(B7):11849–11864, 1991a.
G. H. Miller, E. M. Stolper, and T. J. Ahrens. The equation of state of a molten
komatiite. 2. application to komatiite petrogenesis and the hadean mantle. Journal
of Geophysical Research, 96(B7):11849–11864, 1991b.
H. J. Monkhorst and J. D. Pack. Special points for Brillouin-zone integrations.
Physical Review B., 13(12):5188–5192, 1976.
M. Mookherjee, L. Stixrude, and B. B. Karki. Hydrous silicate melt at high pressure.
Nature, in press, 2008.
133
R. M. More, K. H. Warren, D. A. Young, and G. B. Zimmerman. A new quitidian
equation of state (QEOS) for hot dense matter. Physics of Fluids, 31(10):3059–
3078, 1988.
J. L. Mosenfelder, P. D. Asimow, and T. J. Ahrens. Thermodynamic properties
of Mg2SiO4 liquid at ultra-high pressures from shock measurements to 200 GPa
on forsterite and wadsleyite. Journal of Geophysical Research, 112(B06208):
doi:10.1029/2006JB004364, 2007.
R. L. Mozzi and B. E. Warren. The structure of vitreous silica. Journal of Applied
Crystallography, 2:164–172, 1969.
A. Navrotsky, D. Ziegler, R. Oestrike, and P. Maniar. Calorimetry of silicate melts
at 1773 K - measurement of enthalpies of fusion and of mixing in the systems
diopside-anorthite-albite and anorthite-forsterite. Contributions to Mineralogy and
Petrology, 101:122–130, 1989.
A. Ng, B. K. Godwal, J. Waterman, L. DaSilva, N. W. Ashcroft, and R. Jeanloz.
Nonequilibrium shock behavior in quartz. Physical Review B, 44(10):4872–5876,
1991.
S. Nose. A unified formulation of the constant temperature molecular dynamics
methods. Journal of Chemical Physics, 81:511–519, 1984.
A. R. Oganov and P. I. Dorogokupets. All-electron and pseudopotential study of
MgO: Equation of state, anharmonicity, and stability. Physical Review B, 67:doi:
10.1103/PhysRevB.67.224110, 2003.
A. R. Oganov, J. Brodholt, and G. D. Price. Ab initio elasticity and thermal equation
134
of state of MgSiO3 perovskite. Earth and Planetary Science Letters, 184:555–560,
2001a.
A. R. Oganov, J. P. Brodholt, and G. D. Price. The elastic constants of MgSiO3
perovskite at pressures and temperatures of the Earth’s mantle. Nature, 411:934–
937, 2001b.
E. Ohtani. Chemical stratification of the mantle formed by melting in the early stage
of the terrestrial evolution. Tectonophysics, 154:201–210, 1988.
E. Ohtani and M. Kumazawa. Melting of forsterite Mg2SiO4 up to 15 GPa. Physics
of Earth and Planetary Interiors, 27:32–38, 1981.
E. Ohtani and H. Sawamoto. Melting experiment on a model chondritic mantle
composition at 25 GPa. Geophysical Research Letters, 14(7):733–736, 1987.
E. Ohtani, A. Suzuki, and T. Kato. Flotation of olivine in the peridotite melt at
high pressure. Proceedings of the Japan Academy. Series B, 69:23–28, 1993.
Y. I. Ol’Shanskii. Equilibria of two immiscible liquids. Doklady Akademii Nauk
SSSR, 76:93–96, 1951.
A. Pavese. Pressure-volume-temperature equations of state: a comparative study
based on numerical simulations. Physics and Chemistry of Minerals, 29:43–51,
2002.
A. C. Phillips. The Physics of Stars. John Wiley & Sons, Chichester, 1994.
K. S. Pitzer and S. M. Sterner. Equations of state valid continuously from zero to
extreme pressures for H2O and CO2. Journal of Chemical Physics, 101(4):3111–
3116, 1994.
135
D. C. Presnall and T. Gasparik. Melting of enstatite (MgSiO3) from 10 to 16.5 GPa
and the forsterite (Mg2SiO4) - majorite (MgSiO3) eutectic at 16.5 GPa: Implica-
tions for the origin of the mantle. Journal of Geophysical Research, 95:15771–15777,
1990.
D. C. Presnall and M. J. Walter. Melting of forsterite, Mg2SiO4, from 9.7 to 16.5 GPa.
Journal of Geophysical Research, 98:19777–19783, 1993.
D. C. Presnall, Y. H. Weng, C. S. Milholland, and M. J. Walter. Liquidus phase
relations in the system MgO − MgSiO3 at pressures up to 25 GPa - constraints
on crystallization of a molten hadean mantle. Physics of the Earth and Planetery
Interiors, 107:83–95, 1998.
O. Redlich and J. N. S. Kwong. On the thermodynamics of solutions. 5. an equation
of state - fugacities of gaseous solutions. Chemical Reviews, 44(1):233–244, 1949.
J. E. Reid, B. T. Poe, D. C. Rubie, N. Zotov, and M. Wiedenbeck. The self-diffusion
of silicon and oxygen in diopside (CaMgSi2O6) liquid up to 15 GPa. Chemical
Geology, 174:77–86, 2001.
J. Revenaugh and R. Meyer. Seismic evidence of partial melt within a possibly
ubiquitous low-velocity layer at the base of the mantle. Science, 277:670–673,
1997.
J. Revenaugh and S. A. Sipkin. Seismic evidence for silicate melt atop the 410 km
mantle discontinuity. Nature, 369(6480):474–476, 1994.
P. Richet and Y. Bottinga. Thermochemical properties of silicate glasses and liquids:
A review. Reviews of Geophysics, 24(1):1–25, 1986.
136
S. M. Rigden, T. J. Ahrens, and E. M. Stolper. Densities of liquid silicates at high
pressures. Science, 226(4678):1071–1074, 1984.
S. M. Rigden, T. J. Ahrens, and E. M. Stolper. Shock compression of molten silicate:
Results for a model basaltic composition. Journal of Geophysical Research, 93(B1):
367–382, 1988.
S. M. Rigden, T. J. Ahrens, and E. M. Stolper. High-pressure equation of state
of molten anorthite and diopside. Journal of Geophysical Research, 94(B7):9508–
9522, 1989.
B. Riley. The determination of melting points at temperatures above 2000◦ cel-
cius. Revue international des hautes temperatures et des refractaires, 3(3):327–336,
1966.
M. L. Rivers and I. S. E. Carmichael. Ultrasonic studies of silicate melts. Journal of
Geophysical Research, 92:9247–9270, 1987.
Y. Rosenfeld and P. Tarazona. Density functional theory and the asymptotic high
density expansion of the free energy of classical solids and fluids. Molecular Physics,
95(2):141–150, 1998.
M. Ross. Generalized Lindemann melting law. Physical Review, 184(1):233–242,
1969.
L. Ruff and D. L. Anderson. Core formation, evolution and convection: A geophysical
model. Physics of the Earth and Planetery Interiors, 21:181–201, 1980.
I. Saika-Voivod, F. Sciortino, and P. H. Poole. Computer simulations of liquid sil-
ica: Equation of state and liquid-liquid phase transition. Physical Review E, 63:
doi:10.1103/PhysRevE.63.011202, 2001.
137
T. Sakamaki, A. Suzuki, and E. Ohtani. Stability of hydrous melt at the base of the
Earth’s upper mantle. Nature, 439:192–194, 2006.
G. Shen and P. Lazor. Measurement of melting temperatures of some minerals under
lower mantle pressures. Journal of Geophysical Research, 100(B9):17699–17713,
1995.
J. C. Slater and H. M. Krutter. Thomas-Fermi method for metals. Physical Review,
47:559–568, 1935.
V. S. Solomatov and D. J. Stevenson. Nonfractional crystallization of a terrestrial
magma ocean. Journal of Geophysical Research, 98(E3):5391–5406, 1993.
T. R. A. Song, D. V. Helmberger, and S. P. Grand. Low-velocity zone atop the
410 km seismic discontinuity in the northwestern United States. Nature, 427(6974):
530–533, 1994.
R. Span and W. Wagner. On the extrapolation behaviour of empirical equations of
state. International Journal of Thermophysics, 18(6):1415–1443, 1997.
J. F. Stebbins and I. Farnan. Effects of high temperature on silicate liquid structure:
A multinuclear NMR study. Science, 255(5044):586–589, 1992.
J. F. Stebbins, I. S. E. Carmichael, and L. K. Moret. Heat-capacities and entropies
of silicate liquids and glasses. Contributions to Mineralogy and Petrology, 86:
131–148, 1984.
L. Stixrude. First principles theory of mantle and core phases. In R. T. Cy-
gan and J. D. Kubicki, editors, Molecular Modeling Theory: Applications in the
Geosciences, volume 42 of Review in Mineralogy and Geochemistry, pages 319–
138
343. Geochemical Society and Mineralogical Society of America, Washington, D.C.,
2001.
L. Stixrude and M. S. T. Bukowinski. Fundamental thermodynamic relations and
silicate melting with implications for the constitution of the D′′. Journal of
Geophysical Research, 95(B12):19311–19325, 1990a.
L. Stixrude and M. S. T. Bukowinski. A novel topological compression mechanism
in a covalent liquid. Science, 250:541–543, 1990b.
L. Stixrude and B. B. Karki. Structure and freezing of MgSiO3 liquid in the Earth’s
lower mantle. Science, 310:297–299, 2005.
L. Stixrude and C. Lithgow-Bertelloni. Thermodynamics of mantle minerals - i.
physical properties. Geophysical Journal International, 162:610–632, 2005.
L. Stixrude and C. Lithgow-Bertelloni. Influence of phase transformations on lateral
heterogeneity and dynamics in earth’s mantle. Earth and Planetary Science Letters,
263:45–55, 2007.
E. M. Stolper, D. Walker, B. H. Hager, and J. F. Hays. Melt segregation from
partially molten source regions - the importance of melt density and source region
size. Journal of Geophysical Research, 86:6261–6271, 1981.
A. Strachan, T. Cagin, and W. A. Goddard III. Reply to comment on ’phase dia-
gram of MgO from density-functional theory and molecular-dynamics simulations’.
Physical Review B, 63:doi: 10.1103/PhysRevB.63.096102, 2001.
O. Sugino and R. Car. Ab-initio molecular-dynamics study of first-order phase-
transitions - melting of silicon. Physical Review Letters, 74:1823–1826, 1995.
139
N. Sun. Magma in Earth’s Lower Mantle: First Principle Molecular Dynamics
Simulations of Silicate Liquids. PhD thesis, University of Michigan, 2008.
A. Suzuki and E. Ohtani. Density of peridotite melts at high pressure. Physics and
Chemistry of Minerals, 30:449–456, 2003.
B. Svendsen and T. J. Ahrens. Shock-induced temperatures of MgO. Geophysical
Journal of the Royal Astronomical Society, 91:667–691, 1987.
J. S. Sweeney and D. L. Heinz. Melting of iron-magnesium-silicate perovskite.
Geophysical Research Letters, 20(9):855–858, 1993.
J. S. Sweeney and D. L. Heinz. Laser-heating through a diamond-anvil cell: Melt-
ing at high pressures. In M. H. Manghnani and T. Yagi, editors, Properties of
Earth and Planetary Materials at High Pressure and Temperature, Geophysical
Monograph 101, pages 197–213. American Geophysical Union, Washington, D.C.,
1998.
J. A. Tangeman, B. L. Phillips, A. Navrotsky, J. K. R. Weber, A. D. Hixson, and T. S.
Key. Vitreous forsterite (Mg2SiO4): Synthesis, structure, and thermochemistry.
Geophysical Research Letters, 28:2517–2520, 2001.
J. B. Thompson Jr. Thermodynamic properties of simple solutions. Researches in
Geochemistry, 2:340–361, 1967.
J. W. Tomlinson, M. S. R. Heynes, and J. O. Bockris. The structure of liquid silicates,
part 2. molar volumes and expansivities. Transations of the Faraday Society, 54:
1822–1833, 1958.
W. B. Tonks and H. J. Melosh. Magma ocean formation due to giant impacts.
Journal of Geophysical Research, 98(E3):5319–5333, 1993.
140
Y. S. Touloukian, R. K. Kirby, E. R. Taylor, and T. Y. R. Lee. Thermophysical
Properties of Matter - the TPRC Data Series. Volume 13. Thermal Expansion -
Nonmetallic Solids. IFI/Plenum, New York, 1977.
A. Trave, P. Tangney, S. Scandolo, A. Pasquarello, and R. Car. Pressure-induced
structural changes in liquid SiO2 from ab initio simulations. Physical Review
Letters, 89(24):245504, 2002.
R. G. Trønnes and D. J. Frost. Peridotite melting and mineral-melt partitioning of
major and minor elements at 22− 24.5 GPa. Earth and Planetary Science Letters,
197:117–131, 2002.
H. C. Urey. The cosmic abundances of potassium, uranium and thorium and the heat
balances of the earth, the moon, and mars. Proceedings of the National Academy
of Sciences of the United States of America, 41(3):127–144, 1955.
J. D. van der Waals. Over de Continuiteit van den Gas- en Vloeistoftoestand. A.
W. Sijthoff, Leiden, 1873.
M. S. Vassiliou and T. J. Ahrens. Hugoniot equation of state of periclase to 200 GPa.
Geophysical Research Letters, 8(7):729–732, 1981.
L. Vocadlo and G. D. Price. The melting of MgO - computer calculations via molec-
ular dynamics. Physics and Chemistry of Minerals, 23:42–49, 1996.
L. Vocadlo, D. Alfe, M. J. Gillan, and G. D. Price. The properties of iron under
core conditions from first principles calculations. Physics of Earth and Planetary
Interiors, 140:101–125, 2003.
H. S. Waff. Pressure-induced coordination changes in magmatic liquids. Geophysical
Research Letters, 2(5):193–196, 1975.
141
D. C. Wallace. Statistical Physics of Crystals and Liquids: A Guide to Highly
Accurate Equations of State. World Scientific, Singapore, 2002.
J. T. K. Wan, T. S. Duffy, S. Scandolo, and R. Car. First-principles study of density,
viscosity, and diffusion coefficients of liquid MgSiO3 at conditions of the Earth’s
deep mantle. Journal of Geophysical Research, 112:B03208, 2007.
B. E. Warren and J. Biscoe. Fourier analysis of x-ray patterns of soda-silica glass.
Journal of the American Ceramic Society, 21(7):259–265, 1938.
Y. Waseda and J. M. Toguri. The structure of molten binary silicate systems CaO-
SiO2 and MgO-SiO2. Metallurgical Transactions B, 8(4):563–568, 1977.
E. A. Wasserman, D. A. Yuen, and R. Rustad. Compositional effects on the transport
and thermodynamic properties of MgO-SiO2 mixtures using molecular dynamics.
Physics of the Earth and Planetery Interiors, 77:189–203, 1993.
J. P. Watt and T. J. Ahrens. Shock compression of single-crystal forsterite. Journal
of Geophysical Research, 88(B11):9500–9512, 1983.
E. Wigner. On the quantum correction for thermodynamic equilibrium. Physical
Review, 40:749–759, 1932.
Q. Williams. Molten (Mg0.88Fe0.12)2SiO4 at lower mantle conditions - melting prod-
ucts and structure of quenched glasses. Geophysical Research Letters, 17:635–638,
1990.
Q. Williams and E. J. Garnero. Seismic evidence for partial melt at the base of
Earth’s mantle. Science, 273:1528–1530, 1996.
Q. Williams and R. Jeanloz. Spectroscopic evidence for pressure-induced coordina-
tion changes in silicate glasses and melts. Science, 239:902–905, 1988.
142
Q. Williams, P. McMillan, and T. F. Cooney. Vibrational spectra of olivine compo-
sition glasses: the Mg − Mn join. Physics and Chemistry of Minerals, 16:352–359,
1989.
Q. Williams, E. Knittle, and R. Jeanloz. The high-pressure melting curve of iron - a
technical discussion. Journal of Geophysical Research, 96(B2):2171–2184, 1991.
G. H. Wolf and R. Jeanloz. Lindemann melting law - anharmonic correction and test
of its validity for minerals. Journal of Geophysical Research, 89:7821–7835, 1984.
G. H. Wolf, D. J. Durben, and P. F. McMillan. High-pressure Raman spectroscopic
study of sodium tetrasilicate (Na2Si4O9) glass. Journal of Chemical Physics, 93
(4):2280–2288, 1990.
X. Xue, J. F. Stebbins, M. Kanzaki, P. F. McMillan, and B. Poe. Pressure-induced
silicon coordination and tetrahedral structural changes in alkali oxide-silica melts
up to 12 GPa: NMR, Raman, and infrared spectroscopy. American Mineralogist,
76:8–26, 1991.
I.-C. Yeh and G. Hummer. System-size dependence of diffusion coefficients and
viscosities from molecular dynamics simulations with periodic boundary conditions.
Journal of Physical Chemistry B, 108:15873–15879, 2004.
D. A. Young and E. M. Corey. A new global equation of state model for hot, dense
matter. Journal of Applied Physics, 78(6):3748–3755, 1995.
A. Zerr and R. Boehler. Melting of (Mg, Fe)SiO3-perovskite to 625 Kilobars: Indi-
cation of a high melting temperature in the lower mantle. Science, 262:553–555,
1993.
143
A. Zerr and R. Boehler. Constraints on the melting temperature of the lower mantle
from high-pressure experiments on MgO and magnesiowustite. Nature, 371:506–
508, 1994.
J. Zhang, R. C. Liebermann, T. Gasparik, and C. T. Herzberg. Melting and sub-
solidus relations of SiO2 at 9− 14 GPa. Journal of Geophysical Research, 98(B11):
19785–19793, 1993.
Y. Zhang, G. Guo, K. Refson, and Y. Zhao. Finite-size effect at both high and low
temperatures in molecular dynamics calculations of the self-diffusion coefficient
and viscosity of liquid silica. Journal of Physics - Condensed Matter, 16:9127–
9135, 2004.
Y. Zhou and G. H. Miller. Constraints from molecular dynamics on the liquidus and
solidus of the lower mantle. Geochimica et Cosmochimica Acta, 61(14):2957–2976,
1997.


![Geochemistry 3 Volume 3, Number 11 Geophysics Geosystems · plumes [Morgan, 1972] from deep inside the mantle, presumably from the thermal boundary at the base of the mantle. These](https://img.pdfslide.us/doc/110x75/5f0ee8dc7e708231d4418972/geochemistry-3-volume-3-number-11-geophysics-plumes-morgan-1972-from-deep-inside.jpg)