Embed Size (px)
Citation preview

LIQUIDITY, VALUATIONS AND EVENTS
Jan - Mar
2017
MOVEMENTS OF MAJOR INDICES Sectoral Index Country
31st Mar 2016
31st Dec 2016
31st Mar 2017
3-Month Returns (%)
1-Year Returns (%)
NIFTY 50 India 7,738 8,104 9,174 13% 19%
S&P BSE SENSEX India 25,342 26,366 29,621 12% 17%
Hang Seng Hong Kong 20,777 21,791 24,112 11% 16%
Nasdaq US 4,870 5,432 5,912 9% 21%
Bovespa Brazil 50,055 60,227 64,984 8% 30%
DAX Germany 9,966 11,451 12,313 8% 24%
Seoul Composite South Korea 1,996 2,026 2,160 7% 8%
KLSE Composite Malaysia 1,718 1,638 1,740 6% 1%
CAC 40 France 4,385 4,838 5,123 6% 17%
Jakarta Composite Indonesia 4,845 5,303 5,568 5% 15%
Dow Jones US 17,685 19,820 20,663 4% 17%
Shanghai Composite China 3,004 3,096 3,223 4% 7%
NYSE US 10,207 11,074 11,493 4% 13%
FTSE 100 UK 6,175 7,120 7,323 3% 19%
Nikkei 225 Japan 16,759 19,145 18,909 -1% 13%
RTS Index Russia 876 1,144 1,114 -3% 27%
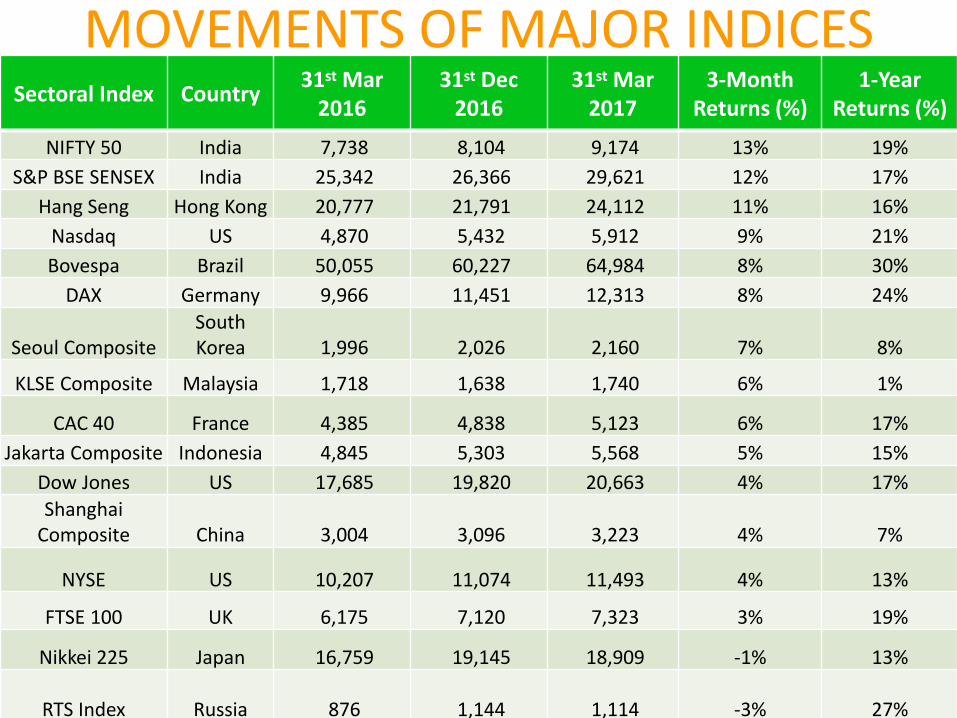
MOVEMENT OF SECTORAL INDICES Sectoral Index
31st Mar 2016
31st Dec 2016
31st Mar 2017
3-Month Returns (%)
1-Year Returns (%)
S&P BSE Consumer Durables 11,481 11,146 15,257 37% 33%
S&P BSE Realty Index 1,228 1,250 1,600 28% 30%
S&P BSE Capital Goods 12,861 13,525 16,446 22% 28%
S&P BSE BANKEX 18,392 20,565 24,421 19% 33%
S&P BSE METAL Index 7,541 10,079 11,804 17% 57%
S&P BSE Power Index 1,776 1,962 2,274 16% 28%
S&P BSE FMCG 7,692 7,998 9,270 16% 21%
NIFTY 50 7,738 8,104 9,174 13% 19%
S&P BSE OIL & GAS Index 9,162 12,031 13,564 13% 48%
S&P BSE PSU 6,107 7,628 8,597 13% 41%
S&P BSE SENSEX 25,342 26,366 29,621 12% 17%
S&P BSE AUTO Index 18,002 20,179 22,013 9% 22%
S&P BSE TECk Index 6,105 5,440 5,771 6% -5%
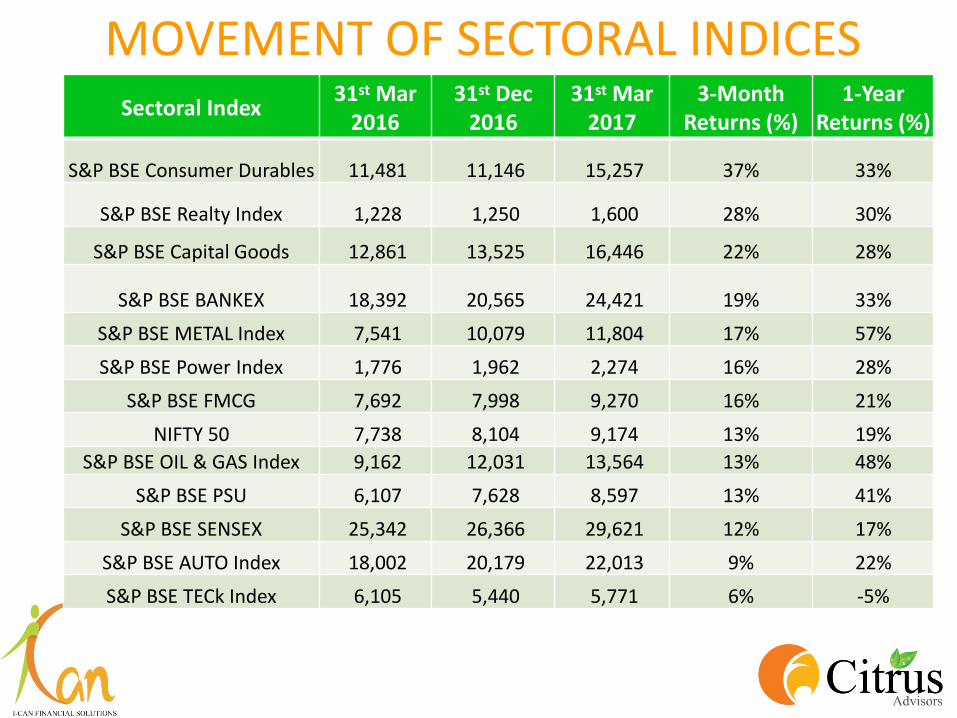
FOREIGN INSTITUTIONAL INVESTOR (FII) FLOWS
FII Flows in Equity
FII Flows in Debt
(in Rs. Million)
Jan – 17 Feb – 17 Mar – 17 TOTAL
Gross Purchase 7,92,584 10,58,443 16,48,425 34,99,452
Gross Sale 8,04,350 9,59,421 13,35,161 30,98,931 Net
Investment -11,766 99,022 3,13,265 4,00,520
(in Rs. Million)
Jan – 17 Feb – 17 Mar – 17 TOTAL
Gross Purchase 1,81,410 2,15,398 4,41,558 8,38,366
Gross Sale 2,04,602 1,55,796 1,85,384 5,45,781 Net
Investment -23,192 59,603 2,56,175 2,92,585
Total Net FII Flows in January – March 2017
Rs. 6,93,106 Million
Source: SEBI

(in Rs. Million) Jan – 17 Feb – 17 Mar – 17 TOTAL
Gross Purchase 18,01,538 12,66,516 6,55,354 37,23,409
Gross Sale 17,88,652 13,01,120 6,99,310 37,89,082
Net Investment 12,886 -34,604 -43,956 -65,673
DOMESTIC INSTITUTIONAL INVESTOR (DII) FLOWS
Source: SEBI

MF ACTIVITY
Equity
Debt
(in Rs. Million)
Jan – 17 Feb – 17 Mar – 17 TOTAL
Gross Purchase 3,58,423 3,74,733 4,34,839 11,67,995
Gross Sale 3,03,562 3,54,336 4,11,163 10,69,061 Net
Investment 54,861 20,397 23,676 98,934
(in Rs. Million)
Jan – 17 Feb – 17 Mar – 17 TOTAL
Gross Purchase 10,67,600 11,90,545 16,09,099 38,67,244
Gross Sale 7,19,721 8,02,249 12,08,247 27,30,217 Net
Investment 3,47,879 3,88,296 4,00,852 11,37,027
Total Net FII Flows in Jan – Mar’17
Rs 12,35,961 Million
Source: SEBI

DOMESTIC EVENTS

UNION BUDGET – MAJOR HIGHLIGHTS • A well balanced Budget which was a positive event for
the markets
Personal Income Tax for income range of Rs 2.5 to 5 lakh reduced from
10% to 5%
10% Surcharge for annual income range of
Rs 50 lakh to 1 crore
Income tax for companies with
turnover less than Rs 50 crore reduced to 25%
Fiscal Deficit target for FY18 is 3.2% of GDP
Major Infrastructure spending boost: Rs 3.97
lakh crore allocated
Reduction in holding period for long term
capital gains from transfer of property reduced from 3 to 2
years.
Transparency in electoral funding: Rs 2,000 maximum cash
donation
Push for digital economy Target to double farmer
income in 5 years
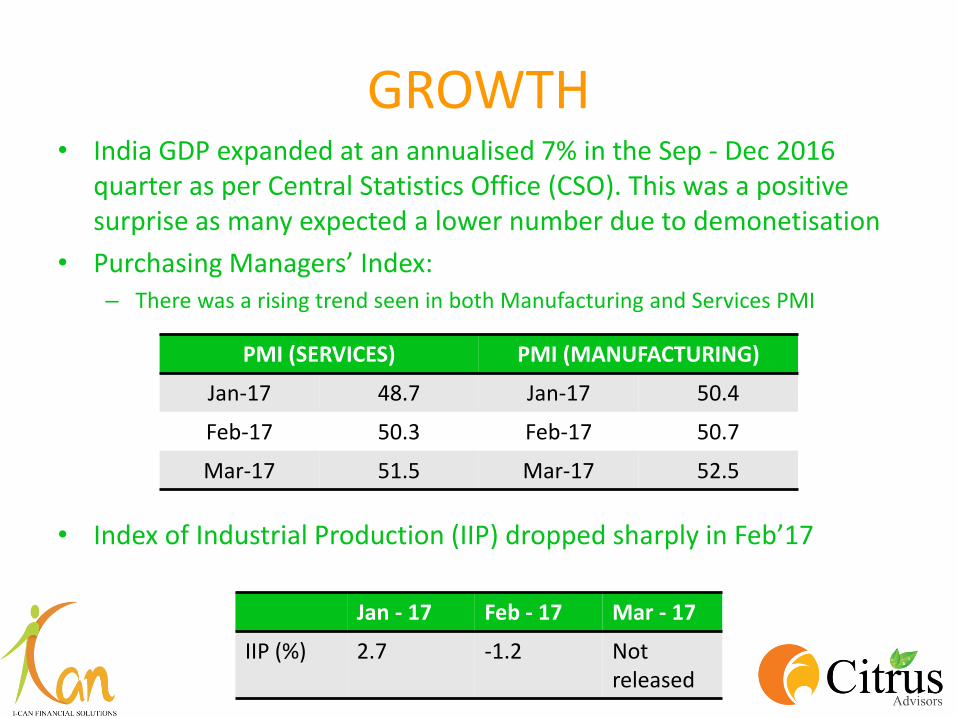
GROWTH • India GDP expanded at an annualised 7% in the Sep - Dec 2016
quarter as per Central Statistics Office (CSO). This was a positive surprise as many expected a lower number due to demonetisation
• Purchasing Managers’ Index: – There was a rising trend seen in both Manufacturing and Services PMI
• Index of Industrial Production (IIP) dropped sharply in Feb’17
PMI (SERVICES) PMI (MANUFACTURING)
Jan-17 48.7 Jan-17 50.4
Feb-17 50.3 Feb-17 50.7
Mar-17 51.5 Mar-17 52.5
Jan - 17 Feb - 17 Mar - 17
IIP (%) 2.7 -1.2 Not released

FISCAL DEFICIT • India's fiscal deficit in the first 11 months to February was 6.06 trillion
rupees (USD 93.40 billion), or 113.4% of the budgeted target for the fiscal year ending in March 2017 – The government's tax receipts usually surge March, helping it meet the
budgeted full-year fiscal deficit target.
– The government is confident of meeting the fiscal deficit target of 3.5% of GDP in FY17
• FY17 saw Rs 40,997 crore in disinvestment proceeds, which was the highest ever - 90% of the revised targeted amount of Rs 45,500 crore.
• Fiscal deficit target for FY18 is 3.2%
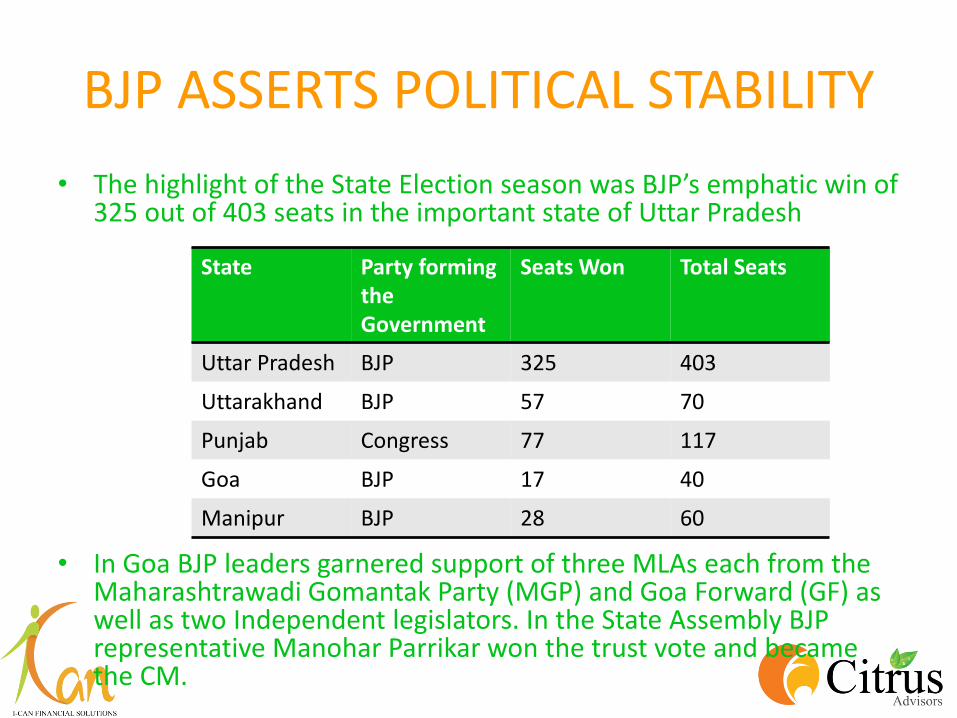
BJP ASSERTS POLITICAL STABILITY
• The highlight of the State Election season was BJP’s emphatic win of 325 out of 403 seats in the important state of Uttar Pradesh
• In Goa BJP leaders garnered support of three MLAs each from the Maharashtrawadi Gomantak Party (MGP) and Goa Forward (GF) as well as two Independent legislators. In the State Assembly BJP representative Manohar Parrikar won the trust vote and became the CM.
State Party forming the Government
Seats Won Total Seats
Uttar Pradesh BJP 325 403
Uttarakhand BJP 57 70
Punjab Congress 77 117
Goa BJP 17 40
Manipur BJP 28 60

INFLATION & NEUTRAL STANCE OF RBI
• Both WPI and CPI have been on an upward trajectory. Only wholesale price index eased in March from February levels.
• In the February Monetary Policy Review RBI decided to keep interest rates on hold owing to increased inflation expectations. RBI’s target for inflation is 4%
Jan-17 Feb-17 Mar-17
Wholesale Price Index
5.25 6.55 5.7
Consumer Price Index
3.17 3.65 3.81
FALLING INTEREST RATES
• As a result of Demonetisation the Indian economy has seen excessive liquidity in the system, which in turn led to decline in interest rates
• Average Bank Fixed deposit rates are down to 6-6.5%
STRONGER RUPEE
• The Indian Rupee has appreciated by almost 5% against the US Dollar in the first quarter of 2017 ending the quarter at Rs. 64.85/$
• Factors contributing to the rise of Rupee:
– Strong foreign fund inflows
– Weaker dollar
– Favourable domestic factors

DOMESTIC PARTICIPATION CONTINUES TO BE STRONG
• The amount raised via IPOs nearly doubled to Rs 29,018 crore in FY17 compared with Rs 14,811 crore in FY16. – 15 IPOs received over 10 times retail subscription.
• Net inflows in Mutual Funds for FY17 rose 155.66% from a year before to Rs 3.43 trillion – the highest in at least 11 years (Source: AMFI) – The net inflows in liquid, income and equity (including equity-linked
savings schemes or ELSS) categories saw fresh investments of Rs 1.2 trillion, Rs 96,000 crore and Rs 70,000 crore respectively (Source: ICRA)

GLOBAL EVENTS

GLOBAL GROWTH
• The International Monetary Fund expects world growth rate to rise to 3.5% in 2017 and 3.6% in 2018 – Global economic activity is expected to pick up
– Emerging markets expected to grow by 4.5% in 2017 and 4.8% in 2018

USA • Federal Reserve Commentary:
– In March the US Fed increased the interest rate by 25 basis points
– The US Fed continued to project two more increases this year, signaling more vigilance as inflation approaches its target
• Employment – Jobs added: 227,000 in January; 235,000 in February and 98,000 in
March, 2017
– The unemployment rate fell to 4.5% in March from 4.7% in February
• Growth – US GDP grew at 2.1% in the fourth quarter of 2016
– IMF and Wells Fargo expect the US economy to grow at 2.3% in 2017

CHINA
• The Chinese economy expanded at a faster than expected annual rate of 6.9% in the first quarter of 2017 – The government is aiming for growth of around 6.5% in 2017
– Many analysts expect the second half of the year to clock in lower growth as the effects of the stimulus measures fade away
• Debt Crisis – China has an alarmingly high debt-to-GDP ratio of almost 300%
– This is far higher than any emerging market or stabilised developed markets
– According to some reports, the productivity of this debt is declining.
EUROPE
• Netherlands Election
– Netherlands’ ruling People’s Party for Freedom and Democracy (VVD) , the party of Dutch Prime Minister Mark Rutte won the elections by securing 33 out of 150 seats in the lower house
– The election was thought to be a litmus test for the rise of populist politics across Europe.
• Growth
– PMI for Eurozone at 6-year high of 56.4 in March
– Signs of economic revival

EVENTS TO WATCH OUT FOR
• DOMESTIC
– Pace of reforms
– Onset of monsoons
– Quarterly Earnings of companies
– RBI Monetary Policy & liquidity management
– FII Inflows in India
• GLOBAL – Geopolitical tensions in Syria
– Europe Election - France
– Trend of foreign inflows into emerging markets
– Crude Oil Price trajectory

OUTLOOK FOR ASSET CLASSES Asset Class
Performance in Q1CY17
Start to End Value In Q1
Outlook for Q1CY17
Remarks
Debt 10-Year Gilt: Up 15 bps 3-M T Bill: Down 42 bps 6-M T Bill: Down 41 bps 3-M CP: Down 10 bps 6-M CP: Down 9 bps
1-Yr CP: Down 10 bps 10-Yr AAA Corp: Up 2 bps
Call Rate: Down 9 bps
6.51 – 6.66 6.20 – 5.78 6.28 – 5.87 6.71 – 6.61 7.05 – 6.96 7.34 – 7.24 7.57 – 7.59 6.13 – 6.04
Yields on long term debt may be range bound with an upward bias. Yield on Shorter term debt may be sideways.
This outlook may change if there is a sharp decline in the inflation trajectory. The yield on short term paper may rise slightly if the credit offtake picks up.
Equity Sensex: Up 12%
Nifty : Up 13%
26,366 – 29,621
8,104 – 9,174
Upward bias with the tilt in favour of mid caps
The movement may be volatile driven by events such as Quarterly performances of corporates, progress of monsoon and FII flows

Disclaimer This presentation is intended for internal use and may contain confidential information that belongs to the sender and/or legally
privileged information that is protected by the attorney-client privilege. If you are not the intended recipient of this communication, you must not disseminate copy or take any reliance on it. If you have received this message in error please notify the sender immediately, to arrange the return of the document. This document is not for public distribution and has been furnished to you solely for your information and may not be reproduced or redistributed to any other person. The manner of circulation and distribution of this document may be restricted by law or regulation in certain countries, including the United States. Persons into whose possession this document may come are required to inform themselves of, and to observe, such restrictions. This material is for the personal information of the authorized recipient, and we are not soliciting any action based upon it. This report is not to be construed as an offer to sell or the solicitation of an offer to buy any security in any jurisdiction where such an offer or solicitation would be illegal. No person associated with Citrus Advisors is obligated to call or initiate contact with you for the purposes of elaborating or following up on the information contained in this document. The material is based upon information that we consider reliable, but we do not represent that it is accurate or complete, and it should not be relied upon. Neither Citrus Advisors., nor any person connected with it, accepts any liability arising from the use of this document. The recipient of this material should rely on their own investigations and take their own professional advice. Opinions expressed are our current opinions as of the date appearing on this material only. While we endeavor to update on a reasonable basis the information discussed in this material, there may be regulatory, compliance, or other reasons that prevent us from doing so. Prospective investors and others are cautioned that any forward-looking statements are not predictions and may be subject to change without notice. We and our affiliates, officers, directors, and employees world wide, including persons involved in the preparation or issuance of this material may; (a) from time to time, have long or short positions in, and buy or sell the securities thereof, of company (ies) mentioned herein or (b) be engaged in any other transaction involving such securities and earn brokerage or other compensation or act as a market maker in the financial instruments of the company (ies) discussed herein or may perform or seek to perform investment banking services for such company(ies)or act as advisor or lender / borrower to such company(ies) or have other potential conflict of interest with respect to any recommendation and related information and opinions. The same persons may have acted upon the information contained here. No part of this material may be duplicated in any form and/or redistributed without Citrus Advisors' prior written consent. No part of this document may be distributed in India or abroad. In so far as this report includes current or historical information, it is believed to be reliable, although its accuracy and completeness cannot be guaranteed.

![MULTI-SECTORAL NUTRITION IMPLEMENTATION PLAN… · [multi-sectoral nutrition implementation plan, results framework & ] ... also goes to the world bank, ... [multi-sectoral nutrition](https://img.pdfslide.us/doc/110x75/5b0d161f7f8b9a2f788d3170/multi-sectoral-nutrition-implementation-plan-multi-sectoral-nutrition-implementation.jpg)