Embed Size (px)
Citation preview

Liquidity, Risk Premia, and the Financial
Transmission of Monetary Policy
Itamar Drechsler, Alexi Savov, and Philipp Schnabl∗
June 7, 2018
In recent years there has been a resurgence of research on the transmission of monetary policy
through the financial system, fueled in part by empirical findings showing that monetary policy
affects asset prices and the financial system in ways not explained by the New Keynesian paradigm.
In particular, monetary policy appears to impact risk premia in stock and bond prices, and to effec-
tively control the liquidity premium in the economy (the cost of holding liquid assets). We review
these findings and recent theories proposed to explain them, and outline a conceptual framework
that unifies them. The framework revolves around the central role of liquidity in risk sharing, and
how monetary policy governs its production and use within the financial sector.
∗New York University Stern School of Business and NBER, [email protected],[email protected], and [email protected]. Schnabl is also with CEPR.

I. The Pendulum Swings Back
Until the 1980s standard monetary theory held a key role for the financial system in
the transmission of policy. The standard view was that the interest rate is determined by
the amount of money created by banks, and that the central bank controls the amount
of money banks create through its supply of reserves, which banks were required to hold in
proportion to the deposits they issued. Some researchers argued that banks also had a second
important role in monetary transmission because their supply of loans was an independent
and important determinant of the availability of credit (Bernanke, 1983).
However, by the 1980s these views were losing support (Romer and Romer, 1990).
Changes in banking regulation and the availability of new types of savings deposits and
payment methods reduced holdings of the most money-like deposits (transaction accounts),
for which reserve requirements mattered most. As required reserves became a decreasingly
small fraction of bank deposits, and as some countries eliminated reserve requirements al-
together, it became increasingly clear that reserve requirements were no longer important
to the monetary transmission mechanism. The combination of regulatory and technolog-
ical changes also made existing measures of monetary aggregates unstable and unreliable
for forecasting inflation, and hence caused central banks to shift their focus from targeting
monetary aggregates to interest rate targeting.
One of the important developments during this time was the repeal of Regulation Q,
which removed the regulatory caps banks had faced on the deposit rates they could pay
(Gilbert, 1986). This meant they could raise deposit interest rates as interest rates rose and
hence avoid losing large amounts of deposits during these times. The repeal of Regulation
Q thus appeared to eliminate a key mechanism through which higher interest rates were
understood to cause a contraction in the supply of credit.
These developments shifted attention away from the role of money, and hence also banks,
in the transmission of monetary policy. Ultimately, Woodford (1998, 2003) forcefully argued
1

that there is little benefit to tracking conventional monetary aggregates in economies with
well-developed financial markets, and showed theortically that when money holdings are
small, monetary models need not reference the quantity of money (the “cashless limit”).
Without money, the standard new-Keynesian model of monetary transmission contains no
role for banks or the financial system more broadly, and hence the vast majority of monetary
theory since that time has abstracted completely from financial institutions and frictions.
However, more recently a growing body of research has returned to studying the inter-
action of monetary policy and the financial system, spurred in large part by three groups
of findings. In this article, we review these findings and discuss a framework that explains
how they work and how they are connected. The framework is based on the central role of
liquidity in the financial system and how monetary policy affects it.
Monetary policy and risk premia. The first group of findings shows that monetary
policy shocks impact the prices of large classes of assets in ways that cannot be explained
by the new-Keynesian mechanism. Bernanke and Kuttner (2005) is an early and influential
paper in this line of work. It uses high-frequency event studies around announcements of
interest rate changes to identify monetary policy shocks. It shows that surprise increases in
the short interest rate have a strong negative impact on stock returns, and estimates that this
effect is due almost entirely to an increase in the equity risk premium. This finding presents
an important challenge to monetary theory as the new-Keynesian model is completely silent
about the risk premium.
Using a similar high-frequency event study approach, Gertler and Karadi (2015) provides
a second important example of an increase in the risk premium, by showing that surprise rate
hikes are also associated with a widening of credit spreads on risky bonds.1 Hanson and Stein
(2015) provides yet a third example, and explains why it represents an important challenge
to the new-Keynesian paradigm. Using the high-frequency event study approach around
1. The empirical asset pricing literature attributes most of the credit spread and its variation to a defaultrisk premium, because these are too large to be explained by the historical frequency of defaults and averagedefault losses (the “credit spread puzzle”).
2

interest rate announcements, it shows that surprise short rate increases induce substantial
increases in long-term (e.g., 10 year) nominal and real forward rates. In contrast, monetary
theory assumes that the central bank cannot change the real rate in the long run, and in
new-Keynesian models this long run is the point at which prices are able to adjust. Thus,
the new-Keynsian model cannot account for the observed increases in long-term real forward
rates. Hanson and Stein (2015) therefore conclude that these increases reflect increases in
the risk premium on forward rates. This finding is especially important for the ability of
monetary theory to explain policy-induced fluctuations in investment, because investment
decisions depend on changes in the long-term cost of capital.
The common thread of these findings is that monetary policy seems to change risk premia
in the economy. Yet the current workhorse monetary theory cannot explain how policy is
able to have such an impact. At the same time, it is increasingly clear that variations in
the risk premium have a first-order impact on economic activity, a point made abundantly
clear by the financial crisis (Gilchrist and Zakrajsek, 2012). For this reason some researchers
have added reduced-form risk premium shocks to standard monetary DSGE models, and
find that these shocks are very important in explaining fluctuations in real activity (Smets
and Wouters, 2003; Gourio, 2012; Christiano, Motto, and Rostagno, 2014). Others seek
to generate variation in risk premia by using preferences, such as habit formation, which
is commonly used for this purpose in the asset pricing literature (Campbell, Pflueger, and
Viceira, 2015).
These findings indicate that there is a monetary transmission mechanism separate from
the new-Keynesian channel, one in which monetary policy impacts the risk premium. Since
the financial system is at the center of much of the risk taking and risk sharing of modern
economies, it is natural to conjecture that this channel runs through the financial system.
This conjecture is supported by a second group of recent findings, which show that monetary
policy has a large impact on the financial sector.
Monetary policy and bank deposits. Figure I, adapted from Drechsler, Savov, and
3

Schnabl (2017b, Figure 2), shows the relationship between the interest rate and the flows
of deposits by households into the banking system. The figure shows a strong negative
correlation: increases in the interest rate are associated with large outflows of deposits from
the banking system. This relationship is potentially of great importance, because household
deposits are banks’ largest and most stable (i.e., least run prone) source of funding. Moreover,
since banks are central in funding other parts of the financial system, deposits are in effect
an important source of funding for the broader financial system.
Drechsler, Savov, and Schnabl (2017b) show that the relationship between interest rates
and deposit flows is causal: interest rate hikes cause deposit funding to contract. The reason
is that banks have market power over deposit supply, and the extent to which they can exploit
this market power depends on the interest rate, because it sets the cost of households’ outside
option for liquidity, cash. A higher interest rate makes this outside option more expensive
and hence allows banks to more profitably exert their market power over deposits. Banks
thus optimally respond to an increase in the short rate by widening the interest spread
they charge on deposits (the gap between the short rate and the rate the deposits pay).
Households respond by withdrawing a fraction of their deposits and substituting towards
less liquid assets.
Drechsler, Savov, and Schnabl (2017b) show that this loss of deposit funding causes banks
to contract credit supply, and that the resulting decrease in credit causes a slowdown of real
activity. Thus, this “deposits channel” is an important mechanism through which monetary
policy changes are transmitted through the financial system to the real economy. Section III
further discusses this channel.
Deposits are also the main form of safe and liquid assets held directly by households.
Together with treasury bonds they represent the economy’s main sources of safe and liquid
assets. Indeed, as of September 2017 there was $11.3 trillion of total bank deposits, of which
$7.75 trillion were savings deposits held by retail accounts. The tremendous magnitude of
deposits raises an important and interesting question: do the fluctuations in the amount of
4

retail deposits due to monetary policy change the overall price of liquidity in the economy,
the liquidity premium? The third group of recent findings suggests the answer is yes.
Monetary policy and the liquidity premium. Figure II, adapted from Drechsler,
Savov, and Schnabl (2017c, Figure 1), plots the Fed funds rate against the spread of the
Fed funds rate over the yield on three-month treasury bills, a standard measure of the
liquidity premium in government bond prices, for the period 1955 to 2017. The very tight,
positive relationship between the interest rate and liquidity premium is readily apparent.
Nagel (2016) finds a similarly strong relationship between the interest rate and the liquidity
premium on a variety of liquid assets. Since deposits account for a large share of total
liquidity supply, it seems very plausible that their strong negative relationship with the
interest rate–per the deposits channel–is central to explaining how the short rate governs the
liquidity premium. Section III.B discusses this further.
Changes in the liquidity premium have potentially substantial effects on the investment
decisions of financial institutions and hence on asset prices and the cost of capital in the
economy. Holmstrom and Tirole (1998, 2011) highlight the importance of liquid asset hold-
ings in mitigating contracting frictions between firms and outside investors, thus allowing
firms to maximize the amount of outside financing they can raise. They show that when
there are aggregate shocks to liquidity, firms want liquid claims on entities outside the corpo-
rate sector, namely government bonds. This implies that by changing the liquidity premium
monetary policy impacts firms’ investment decisions.
Drechsler, Savov, and Schnabl (2017c) construct a model in which monetary policy’s
influence on the liquidity premium causes it to impact the risk premium in the economy. In
the model, financial institutions issue short-term debt to make levered investments in risky
assets. Short-term debt is subject to runs, however, which are episodes in which investors
lose faith in the soundness of financial institutions and refuse to roll-over their liabilities.
To guard against these runs, financial institutions hold buffer stocks of liquid assets. By
influencing the liquidity premium, monetary policy controls the cost of holding this buffer
5

and hence the cost of taking leverage. A higher liquidity premium makes taking leverage
more costly, which leads to less risk taking, higher risk premia, lower asset prices, and less
investment. Risk premia are also higher in the bond market, consistent with the evidence in
Hanson and Stein (2015).
Banks that rely on insured retail deposits have less to fear from runs but must instead
invest in a deposit franchise. This imposes large operating costs, which banks recoup by
gaining market power and paying low rates. Drechsler, Savov, and Schnabl (2017a) show
that this explains why commercial banks engage in maturity transformation, investing in
long-term (fixed-rate) assets while issuing (floating-rate) deposits. The standard view is
that maturity transformation allows banks to earn the term premium but exposes them to
interest rate risk (Bolvin, Kiley, and Mishkin, 2011). Specifically, when rates rise, expenses
rise but income does not, leading to large losses.
Drechsler, Savov, and Schnabl (2017a) show that this is not what we see: banks’ interest
income and expenses move together so that the difference, their net interest margin, is
almost completely flat. Moreover, bank equity prices are no more exposed to interest rate
changes than non-financial firms or the stock market as a whole. Drechsler, Savov, and
Schnabl (2017a) show that market power over deposits explains these results. When rates
rise, interest expenses rise only a little, which keeps net interest margins from falling even if
banks only hold a small amount of short-term assets. On the other hand, to guard against a
drop in interest rates, banks must hold a substantial amount of long-term (fixed-rate) assets.
Otherwise, they would not be able to meet their operating expenses and lose their deposit
franchise. Maturity transformation is therefore necessary for banks and goes hand-in-hand
with deposit taking.
From all these findings, a central theme emerges. Financial institutions are in the business
of providing liquidity. On the liabilities side, they provide liquidity to their depositors and
earn the deposit spread. On the asset side, they provide liquidity to their borrowers and
earn the term premium. Banks’ market power over deposits gives monetary policy traction
6

over deposit supply and, given the enormous size of deposits, over liquidity provision more
broadly. As rates rise and deposits contract, the price of liquidity rises for everyone. Bank
borrowers receive less credit, risk taking by financial institutions falls, and firms see a higher
cost of capital. This is the financial transmission of monetary policy.
II. Framework
Before proceeding with a further discussion of these topics, we sketch a novel conceptual
framework that unifies many of the results linking monetary policy, liquidity, and risk premia.
Our framework centers on liquidity, how it is produced and consumed by the financial sector,
and the influence that the nominal rate exerts on these processes.
We say that an asset is liquid in a given state if having to sell or redeem it quickly (liqui-
dating it) has little negative impact on the price attainable. In contrast, if an asset is illiquid
in that state, then a substantially better price can be attained by selling it gradually or with
a delay. A principal source of illiquidity is asymmetric information (Akerlof, 1970), whose
redistributive effects can overwhelm the gains from trade. Gorton and Pennacchi (1990)
show that this problem can be mitigated by creating assets whose payoffs are insensitive to
information.
The predominant private-sector source of liquid assets in the economy are the liabilities
of the financial sector. The most prominent of these is bank deposits, which are the banking
system’s largest source of funding. Other important examples of liquid assets created by the
financial sector are commercial paper, asset-backed securities, and shares of money market
mutual funds. The other major source of liquid assets in the economy are the liabilities
of the government, in particular currency, reserves, and treasury bonds. Krishnamurthy
and Vissing-Jorgensen (2015) show that government liabilities are partial substitutes for the
liabilities of banks. Sunderam (2015) extends this to shadow banks.
The distinction between government (public) liabilities and financial-sector (private) li-
abilities is central to our framework, and to the mechanism by which monetary policy is
7

transmitted through the financial system. The important difference between these liabilities
is in what happens to them in case of a financial crisis or run. This is an event in which
households lose faith in the value of claims on the financial sector and refuse to roll them over
or to buy new ones, except perhaps at a steep discount. This type of liquidity crunch was a
defining feature of the 2008 financial crisis (Brunnermeier, 2009).2 In contrast, households
do not usually lose faith in the value of government liabilities during this time. This char-
acteristic took centuries to evolve (Gorton, 2017), and is implicitly due to the government’s
unique ability to repay by levying taxes (Caballero and Farhi, 2017).3
Because public liabilities are liquid in a crisis, their prices command a liquidity premium
over those of private liabilities even in normal times. Krishnamurthy and Vissing-Jorgensen
(2012) measure the liquidity premium on public liabilities and show that it is negatively
related to their supply. This liquidity premium is at the heart of the financial transmission
of monetary policy.
Due to the catastrophic consequences of financial runs, the government guarantees some
of the financial sector’s liabilities, in particular those sold primarily to retail buyers. The most
important example is retail bank deposits. The financial liabilities that are given such public
backing are also immune to runs, and therefore command a liquidity premium over non-
guaranteed private liabilities. Yet despite the fact that these liabilities receive government
guarantees, the financial sector retains control over how many of them are produced. This
dichotomy is key to the mechanism through which monetary policy influences the financial
system. To emphasize it, and to distinguish these liabilities from liabilities that are purely
public or private, we refer to them as public-private liabilities.4
As discussed above and in Section III, banks have substantial market power over the
2. Moreira and Savov (2017) analyzes the macroeconomic impact of a liquidity crunch.3. This, too, has limits. Bailing out a highly-distressed financial sector can strain the government’s
taxation capacity and thus expose it to default risk, as in the European sovereign debt crisis (Acharya,Drechsler, and Schnabl, 2014). In this case the financial crisis can spill over into a sovereign debt crisis.
4. In practice, the distinction can be difficult. Asset-backed commercial does not have a public guarantee.However, before the financial crisis issuers of asset-backed commercial paper usually had a liquidity or creditguarantees from a commercial bank that issued private-public liabilities. Acharya, Suarez, and Schnabl (2013)argue that banks engaged in regulatory arbitrage by effectively guaranteeing asset-backed commercial paper.
8

supply of deposits, which are the main form of public-private liquidity. Crucially, the nom-
inal rate determines banks ability to exploit this power, by setting the opportunity cost of
households’ alternative option for liquidity, cash. A higher nominal rate raises the cost of
this outside option and thus increases banks’ ability to raise deposit spreads. Banks respond
to this by increasing the interest spreads they charge on deposits, but avoid raising them to
the point where households find it attractive to substitute towards cash. Nevertheless, de-
posits (and cash) become more expensive to hold, so households substitute away from liquid
holdings to less liquid claims (see Section III for more details). In this way the nominal rate
controls the price (premium) and total supply of public-quality (public + public-private)
liquidity in the economy.
While the financial sector is the major producer of public-private and private liquidity,
it is also a large consumer of (purely) public liquidity. Since government guarantees extend
only to some of the financial sector’s borrowing, mainly retail bank deposits, it remains
exposed to runs on its private liabilities. Therefore, to limit losses in the event of a crisis
the financial sector holds large buffers of public liquidity alongside its holdings of risky and
illiquid assets. It can then liquidate these buffers in the event of a crisis to reduce the need
to (fire) sell its risky and illiquid assets, whose prices drop precipitously during a crisis as a
result of the sharp decline in the financial sector’s ability to borrow and take risk.5
By controlling the liquidity premium, the nominal rate controls the cost of carrying
liquidity buffers. An increase in the nominal rate raises the liquidity premium, making
it more expensive to hold these buffers. Thus, it decreases the financial sector’s demand
for risky and illiquid assets and hence raises their risk premium in equilibrium. In other
words, an increase in the nominal rate decreases the willingness of the financial sector to
5. To partially offset this decrease in banks’ risk-taking capacity during a crisis, the central bank canact as a lender-of-last-resort and allow banks to borrow against risky collateral at below-market haircuts.This describes the European Central Bank’s main unconventional monetary policy intervention during theEuropean sovereign debt crisis (Drechsler, Drechsel, Marques-Ibanez, and Schnabl, 2016). Alternatively, itcan also increase risk-taking capacity by recapitalizing the financial sector though equity injections, assetpurchases, and debt guarantees. This describes the main policy intervention in the immediate aftermath ofthe Lehman bankruptcy in September 2008 (Philippon and Schnabl, 2013).
9

take risk and thus increases the risk premium in the economy. Since the risk premium is
a big component of the total cost of capital for most investments, an increase in the risk
premium reduces total investment (especially for riskier projects) and ultimately growth in
the economy.
Because an interest rate increase induces the financial sector to supply fewer public-
private liabilities (in order to charge higher spreads), it affects the composition of the financial
sector’s liabilities. This, in turn, further affects the financial sector’s assets. Public-private
liabilities are effectively guaranteed to be the financial sector’s most stable, run-free source
of funding, and it is therefore expensive to replace them. Hence, the decrease in their supply
forces the financial sector to contract lending, especially to illiquid borrowers. This is an
unavoidable tradeoff banks face in exploiting their market power over this source of funds.
As discussed above and in Section IV.A, the strong relationship between the interest rate
and the liquidity premium also means that the prices of longer-maturity bonds covary more
negatively with the liquidity premium. Thus, liquidity-constrained investors, such as the
financial sector, incur larger losses on long-term bonds when interest rates rise and liquidity
contracts, making them less useful as a source of liquidity—in this sense, less liquid. Investors
therefore demand additional compensation—the term premium—to hold long-term bonds.6
Lastly, as discussed above and in Section V, banks’ market power over liquidity supply
makes them natural providers of long-term loans. In other words, deposit-taking and ma-
turity transformation are natural counterparts. Interpreted within our framework, banks
can earn the liquidity premium on long-term bonds because they have an offsetting, positive
exposure to the liquidity premium through their market power over deposits. Thus, our
framework shows how the financial transmission of monetary policy is intertwined with both
banks’ liabilities and assets.
While we focus mostly on conventional monetary policy, our framework also applies to
6. This changes when the liquidity contraction is induced by a crisis rather than monetary policy. Flightto safety tends to push up the prices of long-term safe bonds (e.g., Treasuries), making them endogenouslymore liquid, see Moreira and Savov (2017). This explains why Treasury term premia collapse during crises.
10

unconventional monetary policy, which is policy conducted through means other than the
nominal interest. Examples include quantitative easing, lender-of-last-resort interventions,
and bank recapitalization. Quantitative easing works in our framework by using the central
bank’s balance sheet to increase overall risk taking, thus decreasing the economy’s effective
risk aversion. Lender-of-last resort interventions work because they allow banks to keep risky
assets on their balance sheets, which prevents fire sales. And bank recapitalization works
because it raises the financial sector’s capacity to take on risk and thus increases the supply
of credit. To sum up, we offer a new framework of how monetary policy—conventional and
unconventional—affects the financial sector and the broader economy.
III. The Deposits Channel
Even as the study of monetary economics turned its attention away from liquidity supply
in the 1980s, monetary policy continued to exert a powerful influence over it. Figure I,
adapted from Drechsler, Savov, and Schnabl (2017b, Figure 2), shows this. It plots the
annual growth rates of savings deposits (top panel) and total core deposits (bottom panel)
against the contemporaneous change in the Fed funds rate, since 1986. Savings deposits
growth is strongly negatively related to changes in the Fed funds rate; their correlation is
−60%. Moreover, the sensitivity of deposits growth to Fed fund changes is economically large:
annual savings deposits growth declines by 2.76% per 100 bps increase in the Fed funds rate.
The enormous size of savings deposits–$7.75 trillion as of September 2017–suggests that
this has important implications. The relationship for total core bank deposits is similar:
the correlation of its growth with Fed funds rate changes is −50%, and its sensitivity is
−1.11% per 100 bps. The smaller sensitivity is due to a partially offsetting inflow of small
time deposits, a type of deposit that imposes restrictions on withdrawals and is therefore
substantially less liquid. Thus, the panels highlight two related results: (1) higher interest
rates are associated with a substantial decline in total deposits, and (2) within deposits,
households substitute from more to less liquid forms of deposits. Since deposits are by far
11

the largest class of liquid assets held by households, their contraction suggests a contraction
in the overall supply of liquidity.
Figure III, also adapted from Drechsler, Savov, and Schnabl (2017b, Figure 1), reveals
the proximate cause for this contraction. The figure plots the rates paid on representative
products from the three main types of core deposits: checking, savings, and small time
deposits. It shows that banks raise deposit rates far less than one-for-one with the Fed
funds rate. This is especially true for the more liquid types of deposits, checking deposits
and savings deposits, whose rates go up by only 19 bps and 47 bps, respectively, per 100
bps Feds funds rate increase. The rate on time deposits rises by 76 bps (see also Hannan
and Berger, 1989, 1991; Diebold and Sharpe, 1990; Neumark and Sharpe, 1992; Driscoll and
Judson, 2013; Yankov, 2014). The spread between the Fed funds rate and the rate paid by
a deposit, the deposit spread, represents the opportunity cost of holding the deposit due to
foregone interest. Hence, the figure shows that when the Fed funds rate increases, deposits
become much more expensive to hold, particularly the more liquid deposits.
Together, Figures I and III show that higher interest rates are associated with a lower
quantity and higher price of deposits. Thus, monetary policy appears to shift banks’ supply
curve of deposits to households. This is precisely what one used to see under the required
reserves and rate ceiling mechanisms (Friedman and Kuttner, 2010; Gilbert, 1986), yet nei-
ther has been operative in the U.S. for decades. Thus, there must be a different mechanism
at work, one that has remained intact despite the profound regulatory and technological
changes that have occurred during this time.
Drechsler, Savov, and Schnabl (2017b) argue that this mechanism centers on banks’
market power over retail deposits. They present a model of how it works. In the model,
households have a preference for liquid assets, of which there are two: cash, which pays
no interest, and deposits, which pay an endogenous interest rate set by banks. Households
can choose among several banks in their local area, but they view each bank as somewhat
differentiated from the others. For example, they may prefer a bank whose branches are
12

more convenient for their daily routines. Differentiation could also result from relationship
or branding effects, or from households not paying full attention to the rates offered at all
other banks.7
Differentiation gives banks market power, allowing them to charge depositors a spread by
setting the deposit rate below the (risk-adjusted) rate they earn on other assets–the Fed funds
rate. Moreover, banks are able to charge a higher spread when the Fed funds rate increases
because this makes households’ outside liquidity option, cash, more expensive. Since the
most liquid deposits, such as checking and savings accounts, are the closest substitutes for
cash, the model further implies that their deposit spreads go up the most. Thus, the model
matches the behavior of deposit spreads in Figure III, both overall and by product.
The model also matches the behavior of deposit quantities, shown in Figure I. When the
Fed funds rate rises and banks increase their deposit spreads, households respond by with-
drawing some of their deposits and investing in less liquid assets, such as time deposits and
money market funds (they could also consume or pay down debt). Thus, banks experience
a net reduction in deposits, but make higher profits overall because of the ones that stay.
Thus, when the Fed funds rate rises, banks act as (partial) monopolists, charging higher
prices and restricting quantities.
Drechsler, Savov, and Schnabl (2017b) test the market power mechanism using geographic
variation in local market power. They use geographic variation for empirical identification
because of the endogeneity of monetary policy. Monetary policy is tightened when aggregate
economic conditions are improving or are expected to improve, which leads to a pro-cyclical
nominal interest rate in the aggregate time series. Therefore, they need to control for aggre-
gate economic conditions, which they do by comparing the impact of monetary policy across
different geographic regions.
Market power depends jointly on the amount of differentiation across banks as well as the
7. Hortacsu and Syverson (2004) show that there is substantial differentiation in the market for S&P 500index funds, a financial service that is a priori highly homogeneous. Gabaix, Laibson, Li, Li, Resnick, andde Vries (2016) provide a model of how high markups can persist in such a market even with a large numberof firms.
13

concentration of banks in a local area. Local concentration is readily observable, making it a
useful source of geographic variation. To control for banks’ lending opportunities, Drechsler,
Savov, and Schnabl (2017b) compare the deposit spreads of different branches of the same
bank across local markets with high and low concentration.8 The identifying assumption
is that banks are able to raise deposits at one branch and lend them at another, thereby
decoupling the local deposit-taking and lending decisions (this assumption is supported by
the literature, see Gilje, Loutskina, and Strahan, 2013). Consistent with the market power
mechanism, Drechsler, Savov, and Schnabl (2017b) find that when the Fed funds rate rises,
banks raise deposit spreads by more and experience greater deposit outflows at branches
located in more concentrated areas.
These results show that monetary policy changes the supply of deposits through banks’
market power in deposit markets. Drechsler, Savov, and Schnabl (2017b) call this transmis-
sion mechanism the deposits channel of monetary policy.
III.A. The Deposits Channel and Bank Lending
The deposits channel has important implications for bank lending. This is because de-
posits are by far the largest source of bank funding, representing 81% of aggregate bank
liabilities as of September, 2017.9 Deposits are also a special source of bank funding due to
their stability and reliability (Kashyap, Rajan, and Stein, 2002; Hanson, Shleifer, Stein, and
Vishny, 2015). This is especially true of banks’ core (i.e., retail) deposits (Federal Deposit
Insurance Corporation, 2011), which drive the deposits channel. In contrast, wholesale (i.e.,
non-deposit) funding is far more price-sensitive and run-prone because the market for it
is competitive and it is not protected by government guarantees. Consequently, wholesale
funding charges a rate that is higher and, due to adverse selection concerns, is sensitive to
8. This is akin to the within-borrower estimator used by Khwaja and Mian (2008), Schnabl (2012),Jimenez, Ongena, Peydro, and Saurina (2014) and Paravisini, Rappoport, Schnabl, and Wolfenzon (2015)but with depositors as lenders and banks as borrowers.
9. The numbers are from the Federal Reserve Board’s H.8 release.
14

the amount borrowed (Stein, 1998). Thus, wholesale funding is an expensive and imperfect
substitute for deposit funding, so that banks’ deposit supply decisions impacts their lending.
As a result, banks face a tradeoff: contracting deposit supply in order to raise deposit prices
(after an increase in the Fed funds rate)forces them to reduce lending growth.
Thus, the deposits channel generates a bank lending channel of monetary policy (Bernanke,
1983; Bernanke and Blinder, 1988; Kashyap and Stein, 1994). This is an important result
because the literature on the bank lending channel has lacked a plausible driving mechanism
for a long time. Early works relied on the cost of required reserves and the deposit rate
ceiling mechanism, but these been essentially irrelevant in the U.S. for decades (Romer and
Romer, 1990).10 At the same time, the empirical literature has continued to find strong
evidence that monetary policy impacts bank lending (Bernanke and Blinder, 1992; Kashyap,
Stein, and Wilcox, 1993; Kashyap and Stein, 2000; Jimenez, Ongena, Peydro, and Saurina,
2014). Thus, the deposits channel fills a large gap in this literature by providing a plausible
mechanism for these findings.
Drechsler, Savov, and Schnabl (2017b) test this implication of the deposits channel di-
rectly. They compare lending within a given county by banks who raise deposits in markets
with different levels of concentration. By comparing lending within the same county, this
methodology holds local lending opportunities constant and hence isolates the impact of
differences in banks’ market power over deposit supply on banks’ lending. The results show
that banks that raise deposits in more concentrated markets contract their lending by more
than other banks when the Fed funds rate increases, as predicted by the deposits channel.
This decrease in lending adds up to an aggregate effect: the paper shows that counties served
by banks with greater average market power over their deposit supply experience a greater
contraction in total lending when the Fed funds rate increases. Moreover, and consistent
with the deposits channel, it shows that the response of lending in a given county to a
10. The bank lending channel also relies on the assumption that bank lending is “special”, i.e., firms facesignificant costs in substituting to other sources of funding (Bernanke and Blinder, 1988; de Fiore and Uhlig,2011, 2015)
15

Fed funds rate change depends only on the average concentration of the markets where the
lending banks raise deposits, but not on the concentration of the county itself.
Drechsler, Savov, and Schnabl (2017b) further find that banks only substitute a fraction of
the deposit funding they lose due to the deposits channel with wholesale funding, consistent
with deposit funding being especially important. As a result, when the Fed funds rate
increases banks shrink their balance sheets, causing a contraction of all of the main categories
of assets, and especially of securities. As securities are banks’ largest source of long-duration
assets (Drechsler, Savov, and Schnabl (2017a)), their sales shorten the duration of banks’
balance sheets.
III.B. The Deposits Channel and the Liquidity Premium
Since deposits are by far the largest source of liquid assets for households ($11.3 trillion
as of September 2017), the deposits channel impacts the total supply of liquidity in the
economy. As banks increase the price and decrease the quantity of deposits, the prices of
other liquid assets are likely to rise, while the prices of more illiquid assets are likely to fall
(see Section IV). These changes affect the cost of capital of firms in the economy and the
consumption-savings decisions of households.
An example of how this works in practice is provided by money market funds. Money
market funds hold government and highly-rated private debt instruments with very short
maturities. They also allow their investors to trade in and out on a daily basis. This makes
money market funds a potential substitute for bank deposits.11 At the same time, they are
an imperfect substitute because they are not insured by the government, so they are purely
private liquidity.12
Consistent with some degree of substitutability with bank deposits, money market funds
11. Indeed, the money market fund industry got its start as a higher-yielding alternative to bank depositsin the era of deposit rate ceilings under Regulation Q (Kacperczyk and Schnabl, 2010, 2013).
12. They also do not offer the convenience of bank branches, which households appear to value, and mayrequire greater financial knowledge and sophistication. These differences help explain why retail moneymarket funds remain comparatively small despite offering higher rates than bank deposits.
16
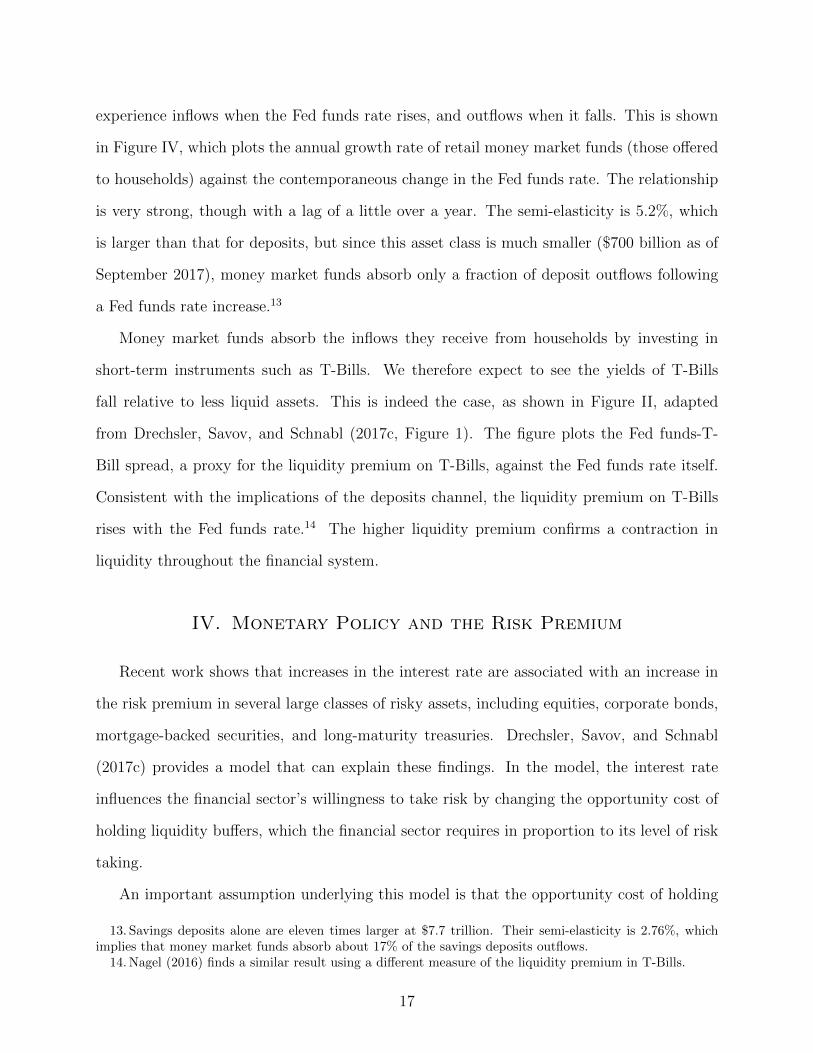
experience inflows when the Fed funds rate rises, and outflows when it falls. This is shown
in Figure IV, which plots the annual growth rate of retail money market funds (those offered
to households) against the contemporaneous change in the Fed funds rate. The relationship
is very strong, though with a lag of a little over a year. The semi-elasticity is 5.2%, which
is larger than that for deposits, but since this asset class is much smaller ($700 billion as of
September 2017), money market funds absorb only a fraction of deposit outflows following
a Fed funds rate increase.13
Money market funds absorb the inflows they receive from households by investing in
short-term instruments such as T-Bills. We therefore expect to see the yields of T-Bills
fall relative to less liquid assets. This is indeed the case, as shown in Figure II, adapted
from Drechsler, Savov, and Schnabl (2017c, Figure 1). The figure plots the Fed funds-T-
Bill spread, a proxy for the liquidity premium on T-Bills, against the Fed funds rate itself.
Consistent with the implications of the deposits channel, the liquidity premium on T-Bills
rises with the Fed funds rate.14 The higher liquidity premium confirms a contraction in
liquidity throughout the financial system.
IV. Monetary Policy and the Risk Premium
Recent work shows that increases in the interest rate are associated with an increase in
the risk premium in several large classes of risky assets, including equities, corporate bonds,
mortgage-backed securities, and long-maturity treasuries. Drechsler, Savov, and Schnabl
(2017c) provides a model that can explain these findings. In the model, the interest rate
influences the financial sector’s willingness to take risk by changing the opportunity cost of
holding liquidity buffers, which the financial sector requires in proportion to its level of risk
taking.
An important assumption underlying this model is that the opportunity cost of holding
13. Savings deposits alone are eleven times larger at $7.7 trillion. Their semi-elasticity is 2.76%, whichimplies that money market funds absorb about 17% of the savings deposits outflows.
14. Nagel (2016) finds a similar result using a different measure of the liquidity premium in T-Bills.
17

liquid assets increases with the nominal interest rate. Hence, this model fits naturally with
the deposits channel, although other economic mechanisms underlying this relationship could
work as well. The essential ingredient is a close link between the opportunity cost of money
(i.e., the nominal interest rate) and the liquidity premium on near-money assets. And, as
shown in Nagel (2016) and Drechsler, Savov, and Schnabl (2017c), there is strong empirical
support for a tight and economically large relationship between the level of the nominal rate
and the liquidity premium.
The model has two types of agents, who differ (only) in their risk aversion (γ). Agents
of type A are less risk-averse than those of type B, γA < γB. This heterogeneity creates
a demand for risk-sharing between the two agents. Thus, in equilibrium type A agents
sell risk-free claims (“deposits”) to type B agents and use this borrowing to increase their
holdings of the risky asset (take leverage). The model interprets type A agents as pooling
their net worth together to provide the equity capital of financial intermediaries. It refers
to financial intermediaries as “banks”, but interprets this term broadly as encompassing
not only commercial banks but also broker-dealers, hedge funds, and off-balance-sheet ve-
hicles. The key common trait of these institutions from the point of view of the model is
that they take leverage using short-term debt. Even more broadly, the model applies to
any intermediaries that finance holdings of risky assets using liabilities that are exposed to
funding shocks, i.e., are runnable.15 In the baseline version of the model, aggregate output
is given by an endowment process Yt and the only state variable is the wealth share of the
type-A agents, ωt =WA
t
WAt +WB
t. All agents can buy claims on the aggregate endowment, which
is the risky asset. The price of this claim is given by Pt and its return process, which is
determined in equilibrium as a function of ωt, is dRt = µt(ωt)dt + σt(ωt)dBt. Agents also
trade instantaneous risk-free bonds that pay the competitive, equilibrium real interest rate
15. For example, it applies also to open-end mutual funds, which issue shares that are redeemable dailyat net asset value. This creates funding risk that can lead to fire sales (Coval and Stafford, 2007). Indeed,long-term equity and bond funds hold 5% of total assets as cash on average, ranging from 1% for governmentbond funds to 15% for global bond funds (Investment Company Institute, 2014).
18

rt(ωt).16
The risky asset completes the market, so there would be full risk sharing in the absence
of any financial frictions. However, borrowing is subject to a friction: there is a risk that
depositors (type-B agents) lose faith in the financial sector and refuse to roll over or accept
its liabilities, causing a run/financial crisis. This forces the financial sector to de-leverage
rapidly. The difficulty is that in this scenario risky assets can only be liquidated quickly at a
steep fire-sale discount, similar to Allen and Gale (1994). To limit fire-sale losses in such an
event, the financial sector continuously holds buffers of liquid assets, which can be liquidated
rapidly at full value.17
Policymakers have indeed embraced the idea of holding liquid asset buffers as insurance
against funding risk (Stein, 2013). Recent regulations requiring liquid asset buffers include
the liquidity coverage and net stable funding ratios adopted by Basel III and US regulators
(Basel Committee on Banking Supervision, 2013, 2014). These rules are precisely meant to
ensure that banks avoid fire-sale liquidations. While the financial sector in the model self-
insures voluntarily, the implications are unchanged if they do so to comply with regulation.
Note that the financial sector’s liquidity buffer must consist of public liquidity. Claims on
other financial intermediaries, such as interbank loans, cannot act as a buffer for systematic
(financial crisis) shocks. To see this, note that in a crisis the financial sector must shrink
it’s external borrowing since households shrink their holdings of private financial sector
claims. Thus, the financial sector must also shrink its claims on entities outside the financial
sector. Clearly, holding intra-financial-sector claims does not help to achieve since they are
a liability of the financial sector (as well as an asset). Thus, they cannot serve as liquidity
buffers. Rather, liquidity buffers must consist of safe claims on entities outside the financial
system (“outside liquidity” in the language of Holmstrom and Tirole, 1998). In practice these
16. Since the rate is competitive, the bonds represent wholesale funding rather than retail deposits.17. Although the model does not microfound the occurrence of fire sales during a crisis, it suggests the
reason for them: in a crisis the financial sector needs to de-lever and thus unloads a large quantity of assetsto the more risk-averse depositors. This causes the risk aversion of the marginal buyer in the economy toincrease sharply compared to normal times and thus causes a sharp drop in the prices of risky assets.
19

are mostly bonds that are explicitly or implicitly guaranteed by the government, including
treasury and agency bonds, and agency mortgage-backed securities.
The nominal interest rate in the model is denoted by nt. Based on the tight relationship
in Figure II and the mechanism discussed in section III.B, the model assumes that the
liquidity premium on government bonds is nt/m, i.e., it is proportional to nt. The model
derives conditions under which banks hold a fraction λ of public liquidity (government bonds)
against each dollar of leverage, to avoid fire sale losses in case of a crisis/run. Then, provided
that the demand for risk sharing is sufficiently large (γb − γa exceeds a cutoff), banks take
leverage in equilibrium. Their portfolio weight in the risky asset (wAS ) is given by
wAS =
1
γA(µ− r) − λ(n/m)
σ2+ hedging terms. (1)
The difference between this expression and the standard portfolio-choice expression is the
presence of the term λ(n/m). This term reflects the marginal cost of the liquidity buffer
the bank needs to hold against its leveraged position, and shows the direct impact of the
interest rate on its risk/leverage choice. For each additional dollar of bank leverage, the bank
must increase its liquid holdings to avoid fire sales. Doing so is costly liquid assets command
a liquidity premium n/m. Since this premium is increasing in nt, a higher nominal rate
raises the cost of risk-taking/leverage. Indeed, an increase in the nominal rate works like an
increase in banks’ effective risk aversion. This decreases the overall demand for risky assets
in the economy and thus raises the equilibrium risk premium.
Drechsler, Savov, and Schnabl (2017c) compare equilibrium prices and quantities under
various interest-rate rules. They set the risk versions of the type-A and -B agents to 1.5
and 15, respectively, to get a substantial demand for risk sharing, and the population share
of type-A agents to be 10%. Since the risky asset is the endowment claim, they set its
average growth rate and volatility to 2%, consistent with standard estimates for aggregate
U.S. consumption.
20

Two important parameters are λ and 1/m, which set the size of the liquidity buffer and
government bond liquidity premium, respectively. The paper sets 1/m = 0.25 based on the
time series in Figure II and λ = 29% based on the ratio of banks’ liquid securities to deposits
(Brunnermeier, Gorton, and Krishnamurthy (2012) and Bai, Krishnamurthy, and Weymuller
(2016) undertake comprehensive analyses of banks’ funding risk.)
As an example of the impact of the interest rate, the paper compares risk-taking and the
risk premium across two constant interest-rate rules: nt = 0% and nt = 5%. These values
also depend on the state variable, so the paper plots these values for all values of ω. Under
the 0% rule, liquidity is costless, so the model is equivalent to one with no funding risk,
whereas under the 5% rule liquidity is costly and leverage is constrained. This is clear in the
results: under the 5% rule banks’ take significantly less leverage, and the risk premium and
Sharpe ratio of the risky asset increase substantially. One way to think about this increase
is to calculate the difference in the risk aversion of the economy’s implied rep agent: it
increases from 4 to 14 for common values of ω. The increase in the risk premium translates
into an increase in the total discount rate and hence a compression in the valuation of the
endowment claim (P/Y ) for all ω.18
The paper also shows that the interest rate policy can have strong effects on the volatility
of returns. In the constant-rate scenarios, there is more volatility under the lower rate
because leverage is higher and hence the wealth share is more volatile. However, under
dynamic interest-rate rules with feedback, such as a rule that captures the notion of the
“Greenspan put”, the relationship of volatility and the interest rate is more complicated and
involves a tradeoff between short-term stability and long-term instability.
Drechsler, Savov, and Schnabl (2017c) further expand the model to incorporate monetary
policy shocks (unexpected deviations from the expected interest rate rule) and a real side to
18. The real rate in the model moves opposite to the risk premium, because increased risk aversion increasesthe demand for precautionary savings. A useful extension of the model would incorporate nominal pricerigidities, as in the new Keynesian model, so that the real rate moves in tandem with the nominal rate. Inthis case, the risk premium and real rate would move in the same direction, causing an even larger impacton the total discount rate.
21
the economy, to demonstrate the effect of these on production and investment. The model
shows how a shock increase to the nominal rate reduces investment and economic growth by
raising the risk premium and causing risky asset prices to fall.
IV.A. Term Structure
As Drechsler, Savov, and Schnabl (2017c) explain, the model makes an important pre-
diction about the slope of the yield curve, and it’s response to rate shocks: it generates a
substantial term premium and hence a yield curve that is significantly upward sloping on
average. The reason is the basic mechanism; a higher nominal rate implies a higher cost of
liquidity, decreased risk-sharing, and hence a higher risk premia. Thus, a positive nominal
rate shock increases marginal utilities, and since nominal bond prices fall in these states,
agents demand a risk premium to hold them. Since long-term bond are more sensitive to
such shocks, they are riskier, and there is a term premium.
Thus, the impact of the nominal rate on the liquidity premium allows the model to explain
the term premium. Indeed, the term premium can be interpreted as the term structure of
liquidity premia. Under this interpretation investors treat long-term bonds as less liquid than
short-term bonds because their returns co-vary more negatively with the liquidity premium.
In other words, they suffer larger losses when liquidity constraints tighten in the economy,
making them a less useful source of liquidity, i.e., effectively less liquid. Because a positive
rate shock increase risk premia, it increases the risk premium in forward rates (the forward
premia), including far out on the yield curve. Hence, the model explains Hanson and Stein
(2015)’s finding that monetary policy shocks move long-term forward real rates, which cannot
be explained by the new-Keynesian paradigm.
22

V. Deposits and Maturity Transformation
One of the main functions of banks is maturity transformation, whereby banks borrow
using short-term debt but lend long-term. In so doing, they increase the supply of long-term
credit to the economy. The substantial yield premium paid by long-term credit (the term
premium) shows that such credit is in high demand; the additional yield it pays compensates
banks for providing it. The risk involved in providing maturity transformation is that it
creates a mismatch between the short duration of the liabilities and the long duration of
the assets. This implies that when the short rate increases unexpectedly, the interest rate
paid by the short-term funding will rise faster than the rate earned by the long-term assets,
causing the bank’s net interest income to fall (Bolvin, Kiley, and Mishkin, 2011). In present
value terms, the value of the bank’s assets falls more than the value of its liabilities, and
the banks suffers a loss of equity capital. According to the bank capital channel, the loss of
capital should induce the bank to shrink its balance sheet and contract lending (Peek and
Rosengren, 2010).
Drechsler, Savov, and Schnabl (2017a) document that the duration mismatch of the
aggregate banking sector is around 4 years. By a standard duration calculation this implies
that an accumulated surprise increase in the short rate of 100 basis (over any period of time)
causes banks’ assets to decline by 4% more than their liabilities. Equivalently, banks’ net
interest margin (NIM) decreases by 100 bps for 4 years running, resulting in a cumulative
4% loss. Given banks 10-to-1 leverage, this translates into a 40% loss of bank equity.
It is therefore quite surprising that no such episode of any comparable magnitude has ever
occurred.19 This is certainly not because of a lack of interest rate surprises; the short rate
rose nearly 20% from the 1950s to 1980/81, and then steadily decreased for the subsequent
19. The closest is the savings and loan (S&L) crisis that began in the mid-1980s. An unprecedented risein interest rates in the early 1980s inflicted significant losses on these institutions, which were subsequentlycompounded by risk shifting White (1991). However, unlike the S&L sector, the commercial banking sectorsaw no decline in NIM during this period. As White (1991) points out, the rise in interest rates occurredright after deposit rates were deregulated, making it difficult S&Ls to anticipate the effect of such a largeshock on their funding costs. In this sense the S&L crisis was the exception that proves the rule.
23
three decades. Both the run-up and decline were largely unanticipated at the outset and
hence generated cumulative surprises far larger than 100bps (as evidenced by comparably
large changes in long-term rates over these periods).
The reason why these accumulated surprises have not led to a banking crisis is that banks’
exposure to interest rates is far lower than implied by their duration mismatch. Using an
event-study approach around Federal Open Market Committee (FOMC) meetings, Drechsler,
Savov, and Schnabl (2017a) find that a 100 bps increase in interest rates only reduces bank
equity by 2.4% (not 40%), about the same as for the market as a whole.
To understand this, Drechsler, Savov, and Schnabl (2017a) analyze the stream of banks’
incomes and expenses. The short duration of banks’ liabilities implies that their stream of
interest expenses should be sensitive to the short rate, in contrast to the stream of interest
income from their fixed-rate, long-duration assets. However, Drechsler, Savov, and Schnabl
(2017a) find that both banks’ interest income and expenses are insensitive to the short rate.
As a result, there is very little fluctuation in banks’ net interest margin or return on assets
over the period 1955 to 2015, and no correlation between these profitability measures and
the short rate.20
Drechsler, Savov, and Schnabl (2017a) construct a simple model that explains this result.
The key assumption is that banks have a deposit franchise that gives them market power
over deposit provision, as shown in Drechsler, Savov, and Schnabl (2017b). The deposit
franchise allows banks to charge high spreads on deposits, but servicing it imposes large,
recurring operating costs (e.g., branch network, marketing, customer service). The evidence
shows that these costs are about 2% to 3% of assets.
The key insight is that, due to their ability to increase deposit spreads when the interest
rate goes up, banks pay low and insensitive rates on their deposits and hence their interest
expenses have low sensitivity to the short rate. At the same time, their other large expenses,
20. During the zero-lower-bound period after 2008, there was a mild decline in net interest margins aslong-term assets rolled off only to be replaced by new assets paying significantly lower rates. A more severecompression occurred in Europe where policy rates turned negative. Brunnermeier and Koby (2016) analyzethe implications of such a compression for the effectiveness of monetary policy.
24

their operating costs, are also largely invariant to the interest rate and hence resemble a
fixed-rate liability. Hence, the importance of the deposit franchise effectively makes banks
stream of total expenses, composed of interest and operating expenses, akin to a fixed-
rate liability. Given this, banks need to hold long-maturity fixed-rate assets, so that they
remain solvent even if interest rates decrease and compress the spreads they earn from their
deposit franchise. In other words, banks match the level of interest rate (in)sensitivity of
their liabilities and assets. Thus, banks with a bigger deposit franchise and more market
power have lower interest sensitivity of their liabilities and should therefore hold a greater
proportion of interest-insensitive assets, such as long-term bonds.
Drechsler, Savov, and Schnabl (2017a) find strong support for this matching prediction
in the cross-section of US banks. For each bank they estimate the sensitivity (beta) of
its interest expenses and interest income to changes in the Fed funds rate. They show that
there is strong matching of interest expense and income betas, both on average and bank-by-
bank. The average expense and income betas are relatively low, 0.360 and 0.379 respectively,
reflecting banks’ high level of market power. Yet, there is also substantial variation in the
cross section and yet a close to one-for-one matching of income and expense betas at the
bank level. This leaves profitability effectively unexposed to interest rates across the whole
distribution of banks, and hence shows that banks provide maturity transformation without
taking interest-rate risk.
These results have important implications for monetary policy and financial stability.
Banks’ large maturity mismatch is a common source of concern about financial stability,
leading to calls for narrow banking. Yet, these results show that if banks have market power
then they are efficient providers of long-term credit. This suggests that forcing them to
be narrow would increase the term premium and decrease their stability. More broadly,
these results explain why deposit-taking and maturity transformation coexist and are the
foundation for the business of banking.
25

VI. Conclusion
We discuss recent findings on the role of the financial sector in the transmission of mone-
tary policy. A key focus of this work is the role of liquidity in risk sharing and how monetary
policy governs its production. This research proposes a new framework that is based on
banks market power over deposits, which allows monetary policy to affect the deposit sup-
ply and, given the enormous size of deposits, to affect liquidity provision more broadly. In
this framework, monetary policy controls the liquidity premium in the economy and affects
the risk premium on bond and stocks. Monetary policy has real effect leading to changes in
the supply of credit, risk taking by financial institutions, and aggregate investment. Overall,
these findings suggest that there is a monetary transmission mechanism separate from the
new-Keynesian channel, which deserves to be studied further.
26

References
Acharya, Viral, Itamar Drechsler, and Philipp Schnabl, 2014. A pyrrhic victory? bank
bailouts and sovereign credit risk. The Journal of Finance 69, 2689–2739.
Acharya, Viral, Gustavo Suarez, and Philipp Schnabl, 2013. Securitization without risk
transfer. Journal of Financial Economics 107(3), 515–536.
Akerlof, George, 1970. The market for lemons. Quarterly journal of Economics 84, 488–500.
Allen, Franklin, and Douglas Gale, 1994. Limited market participation and volatility of asset
prices. The American Economic Review pp. 933–955.
Bai, Jennie, Arvind Krishnamurthy, and Charles-Henri Weymuller, 2016. Measuring liquidity
mismatch in the banking sector. Journal of Finance forthcoming.
Basel Committee on Banking Supervision, 2013. Basel III: The liquidity coverage ratio and
liquidity risk monitoring tools. Discussion paper, Bank for International Settlements.
, 2014. Basel III: The net stable funding ratio. Discussion paper, Bank for Interna-
tional Settlements.
Bernanke, Ben S, 1983. Nonmonetary effects of the financial crisis in the propagation of the
great depression. The American Economic Review 73, 257–276.
, and Alan S Blinder, 1988. Credit, money, and aggregate demand. The American
Economic Review 78, 435–439.
, 1992. The federal funds rate and the channels of monetary transmission. The Amer-
ican Economic Review 82, 901–921.
Bernanke, Ben S, and Kenneth N Kuttner, 2005. What explains the stock market’s reaction
to federal reserve policy?. The Journal of Finance 60, 1221–1257.
27

Bolvin, Jean, Michael T. Kiley, and Frederic C. Mishkin, 2011. How has the monetary
transmission mechanism evolved over time?. vol. 3A of Handbook of Monetary Economics
. pp. 369– 422 Elsevier.
Brunnermeier, Markus K, 2009. Deciphering the liquidity and credit crunch 2007–2008. The
Journal of economic perspectives 23, 77–100.
, Gary Gorton, and Arvind Krishnamurthy, 2012. Risk topography. NBER Macroe-
conomics Annual 26, 149–176.
Brunnermeier, Markus K., and Yann Koby, 2016. The reversal interest rate: The effective
lower bound of monetary policy. Working paper.
Caballero, Ricardo J., and Emmanuel Farhi, 2017. The safety trap. The Review of Economic
Studies p. rdx013.
Campbell, John Y., Carolin Pflueger, and Luis M. Viceira, 2015. Monetary policy drivers of
bond and equity risks. Discussion paper, .
Christiano, Lawrence J., Roberto Motto, and Massimo Rostagno, 2014. Risk shocks. Amer-
ican Economic Review 104, 27–65.
Coval, Joshua, and Erik Stafford, 2007. Asset fire sales (and purchases) in equity markets.
Journal of Financial Economics 86, 479–512.
de Fiore, Fiorella, and Harald Uhlig, 2011. Bank finance versus bond finance. Journal of
Money, Credit and Banking 43(7), 13991421.
, 2015. Corporate debt structure and the financial crisis. Journal of Money, Credit
and Banking 47(8), 15711598.
Diebold, Francis X, and Steven A Sharpe, 1990. Post-deregulation bank-deposit-rate pricing:
The multivariate dynamics. Journal of Business & Economic Statistics 8, 281–291.
28

Drechsler, Itamar, Thomas Drechsel, David Marques-Ibanez, and Philipp Schnabl, 2016.
Who borrows from the lender of last resort. The Journal of Finance 71, 1933–1974.
Drechsler, Itamar, Alexi Savov, and Philipp Schnabl, 2017a. Banking on deposits: Maturity
transformation without interest rate risk. Working paper.
, 2017b. The deposits channel of monetary policy. Quarterly Journal of Economics
132, 1819–1876.
, 2017c. A model of monetary policy and risk premia. Journal of Finance forthcoming.
Driscoll, John C, and Ruth A Judson, 2013. Sticky deposit rates. Federal Reserve Board
Working Paper.
Federal Deposit Insurance Corporation, 2011. Study on Core Deposits and Brokered Deposits
Submitted to Congress Pursuant to the DoddFrank Wall Street Reform and Consumer
Protection Act Government Printing Office, Washington, DC.
Friedman, Benjamin M., and Kenneth N. Kuttner, 2010. Chapter 24 - implementation of
monetary policy: How do central banks set interest rates?. vol. 3 of Handbook of Monetary
Economics . pp. 1345 – 1438 Elsevier.
Gabaix, Xavier, David Laibson, Deyuan Li, Hongyi Li, Sidney Resnick, and Casper G
de Vries, 2016. The impact of competition on prices with numerous firms. Journal of
Economic Theory 165, 1–24.
Gertler, Mark, and Peter Karadi, 2015. Monetary policy surprises, credit costs, and economic
activity. American Economic Journal: Macroeconomics 7, 44–76.
Gilbert, Alton R., 1986. Requiem for regulation q: What it did and why it passed away.
Federal Reserve Bank of St. Louis Review pp. 22–37.
Gilchrist, Simon, and Egon Zakrajsek, 2012. Credit spreads and business cycle fluctuations.
The American Economic Review 102, 1692–1720.
29

Gilje, Erik, Elena Loutskina, and Philip E. Strahan, 2013. Exporting liquidity: Branch
banking and financial integration. Working Paper 19403 National Bureau of Economic
Research.
Gorton, Gary, 2017. The history and economics of safe assets. Annual Review of Economics
9.
, and George Pennacchi, 1990. Financial intermediaries and liquidity creation. Journal
of Finance 45, 49–71.
Gourio, Francois, 2012. Disaster risk and business cycles. American Economic Review 102(6),
2734 66.
Hannan, T. H., and A. Berger, 1989. The price-concentration relationship in banking. Review
of Economics and Statistics 71, 291–299.
Hannan, Timothy H., and Allen Berger, 1991. The rigidity of prices: Evidence from the
banking industry. The American Economic Review 81, 938–945.
Hanson, Samuel, Andrei Shleifer, Jeremy C. Stein, and Robert W. Vishny, 2015. Banks as
patient fixed-income investors. Journal of Financial Economics 117, 449–469.
Hanson, Samuel, and Jeremy C Stein, 2015. Monetary policy and long-term real rates.
Journal of Financial Economics 111, 429–448.
Holmstrom, Bengt, and Jean Tirole, 1998. Private and public supply of liquidity. Journal of
Political Economy 106, 1–40.
, 2011. Inside and Outside Liquidity MIT Press.
Hortacsu, Ali, and Chad Syverson, 2004. Product differentiation, search costs, and compe-
tition in the mutual fund industry: A case study of s&p 500 index funds. The Quarterly
Journal of Economics 119, 403–456.
30

Investment Company Institute, 2014. 2014 Investment company fact book. Discussion paper,
Investment Company Institute.
Jimenez, Gabriel, Steven Ongena, Jose-Luis Peydro, and Jesus Saurina, 2014. Hazardous
times for monetary policy: What do twenty-three million bank loans say about the effects
of monetary policy on credit risk-taking?. Econometrica 82, 463–505.
Kacperczyk, Marcin, and Philipp Schnabl, 2010. When safe proved risky: Commercial paper
during the financial crisis of 2007-2009. Journal of Economic Perspectives 24(1), 29–50.
, 2013. How safe are money market funds?. The Quarterly Journal of Economics 128,
1073–1122.
Kashyap, Anil K, Raghuram Rajan, and Jeremy C Stein, 2002. Banks as liquidity providers:
An explanation for the coexistence of lending and deposit-taking. The Journal of Finance
57, 33–73.
Kashyap, Anil K., and Jeremy C. Stein, 1994. Monetary policy and bank lending. in Mone-
tary PolicyNBER Chapters . pp. 221–261 National Bureau of Economic Research, Inc.
, 2000. What do a million observations on banks say about the transmission of
monetary policy?. American Economic Review 90, 407–428.
Kashyap, Anil K, Jeremy C. Stein, and David W. Wilcox, 1993. Monetary policy and credit
conditions: Evidence from the composition of external finance. American Economic Review
83, 78–98.
Khwaja, Asim Ijaz, and Atif Mian, 2008. Tracing the impact of bank liquidity shocks: Evi-
dence from an emerging market. American Economic Review 98, 1413–42.
Krishnamurthy, Arvind, and Annette Vissing-Jorgensen, 2012. The aggregate demand for
treasury debt. Journal of Political Economy 120, 233–267.
31

, 2015. The impact of treasury supply on financial sector lending and stability. Journal
of Financial Economics 118, 571–600.
Moreira, Alan, and Alexi Savov, 2017. The macroeconomics of shadow banking. The Journal
of Finance.
Nagel, Stefan, 2016. The liquidity premium of near-money assets. The Quarterly Journal of
Economics 131, 1927–1971.
Neumark, David, and Steven A. Sharpe, 1992. Market structure and the nature of price
rigidity: Evidence from the market for consumer deposits. Quarterly Journal of Economics
107, 657–680.
Paravisini, Daniel, Veronica Rappoport, Philipp Schnabl, and Daniel Wolfenzon, 2015. Dis-
secting the effect of credit supply on trade: Evidence from matched credit-export data.
Review of Economic Studies 82 (1), 333–359.
Peek, Joe, and Eric S. Rosengren, 2010. The role of banks in the transmission of monetary
policy. The Oxford Handbook of Banking Oxford University Press.
Philippon, Thomas, and Philipp Schnabl, 2013. Efficient recapitalization. Journal of Finance
67(3), 1–42.
Romer, Christina D, and David H Romer, 1990. New evidence on the monetary transmission
mechanism. Brookings Papers on Economic Activity 1990, 149–213.
Schnabl, Philipp, 2012. The international transmission of bank liquidity shocks: Evidence
from an emerging market. The Journal of Finance 67, 897–932.
Smets, Frank, and Raf Wouters, 2003. An estimated dynamic stochastic general equilibrium
model of the euro area. Journal of the European Economic Association 1, 1123–1175.
32

Stein, Jeremy C, 1998. An adverse-selection model of bank asset and liability management
with implications for the transmission of monetary policy. RAND Journal of Economics
29, 466–486.
, 2013. Liquidity regulation and central banking. At the “Finding the Right Balance”
2013 Credit Markets Symposium sponsored by the Federal Reserve Bank of Richmond,
Charlotte, North Carolina.
Sunderam, Adi, 2015. Money creation and the shadow banking system. Review of Financial
Studies 28, 939–977.
White, Lawrence J, 1991. The S&L debacle: Public policy lessons for bank and thrift regu-
lation Oxford University Press New York.
Woodford, Michael, 1998. Doing without money: Controlling inflation in a post-monetary
world. Review of Economic Dynamics 1, 173–219.
, 2003. Interest and prices: Foundations of a theory of monetary policy Princeton
university press.
Yankov, Vladimir, 2014. In search of a risk-free asset. Federal Reserve Board Working Paper.
33
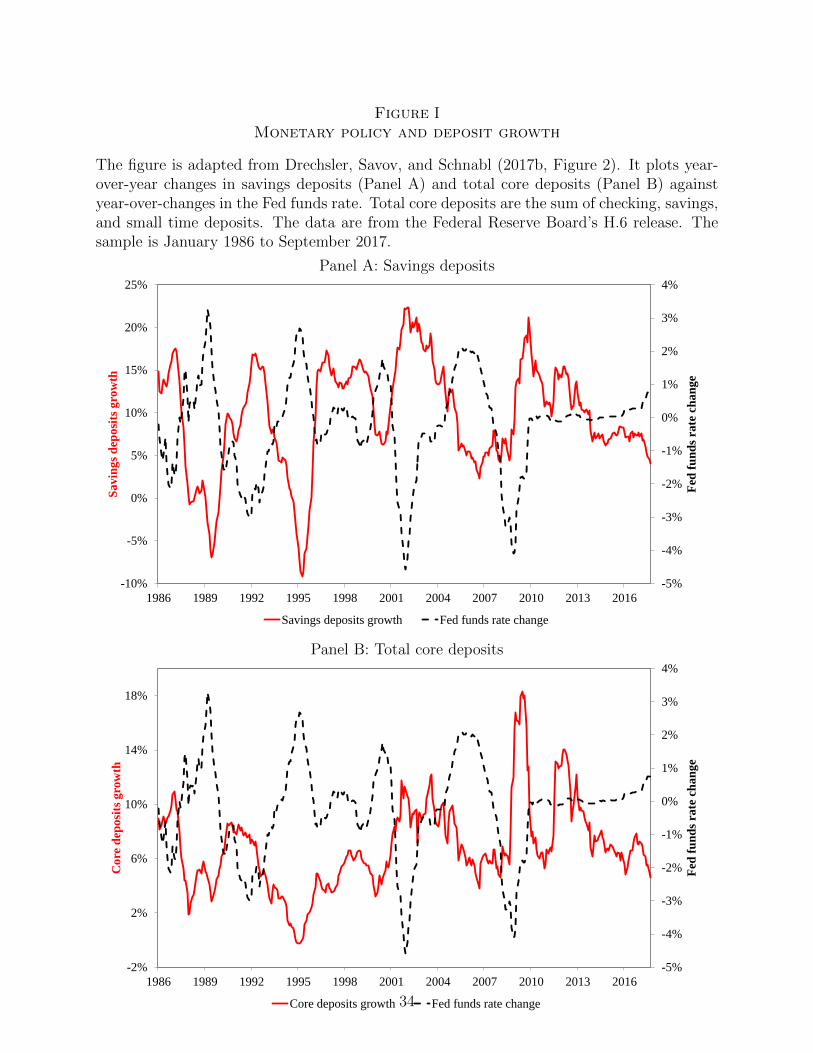
Figure IMonetary policy and deposit growth
The figure is adapted from Drechsler, Savov, and Schnabl (2017b, Figure 2). It plots year-over-year changes in savings deposits (Panel A) and total core deposits (Panel B) againstyear-over-changes in the Fed funds rate. Total core deposits are the sum of checking, savings,and small time deposits. The data are from the Federal Reserve Board’s H.6 release. Thesample is January 1986 to September 2017.
Panel A: Savings deposits
-5%
-4%
-3%
-2%
-1%
0%
1%
2%
3%
4%
-10%
-5%
0%
5%
10%
15%
20%
25%
1986 1989 1992 1995 1998 2001 2004 2007 2010 2013 2016
Fed
fu
nd
s ra
te c
ha
ng
e
Sa
vin
gs
dep
osi
ts g
row
th
Savings deposits growth Fed funds rate change
Panel B: Total core deposits
-5%
-4%
-3%
-2%
-1%
0%
1%
2%
3%
4%
-2%
2%
6%
10%
14%
18%
1986 1989 1992 1995 1998 2001 2004 2007 2010 2013 2016
Fed
fu
nd
s ra
te c
ha
ng
e
Co
re d
eposi
ts g
row
th
Core deposits growth Fed funds rate change34
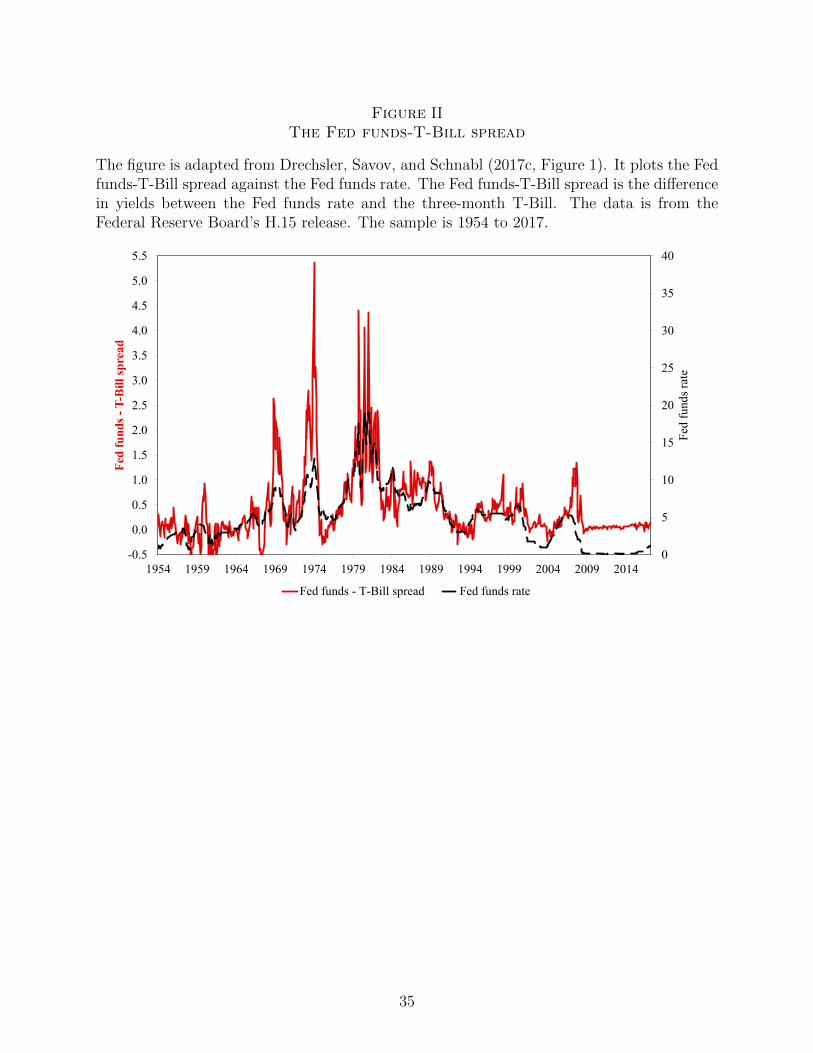
Figure IIThe Fed funds-T-Bill spread
The figure is adapted from Drechsler, Savov, and Schnabl (2017c, Figure 1). It plots the Fedfunds-T-Bill spread against the Fed funds rate. The Fed funds-T-Bill spread is the differencein yields between the Fed funds rate and the three-month T-Bill. The data is from theFederal Reserve Board’s H.15 release. The sample is 1954 to 2017.
0
5
10
15
20
25
30
35
40
-0.5
0.0
0.5
1.0
1.5
2.0
2.5
3.0
3.5
4.0
4.5
5.0
5.5
1954 1959 1964 1969 1974 1979 1984 1989 1994 1999 2004 2009 2014
Fed
fu
nd
s ra
te
Fed
fu
nd
s -
T-B
ill
spre
ad
Fed funds - T-Bill spread Fed funds rate
35

Figure IIIMonetary policy and deposit rates
The figure is adapted from Drechsler, Savov, and Schnabl (2017b, Figure 1). The figure plotsthe Fed funds rate and the average interest rates paid on representative core deposit products.The data is from Ratewatch, 1997 to 2013. The deposit products are interest checking, moneymarket deposit accounts with balances of $25,000 (a savings deposit product), and one-yearcertificates of deposit with balances of $10,000 (a time deposit). These are the most commonproducts within their respective class (checking, savings, and time deposits) in the Ratewatchdata.
Deposit rates
0%
1%
2%
3%
4%
5%
6%
7%
1997 1998 1999 2000 2001 2002 2003 2004 2005 2006 2007 2008 2009 2010 2011 2012 2013
Checking deposits Savings deposits Time deposits Fed funds rate
36

Figure IVMonetary policy and money market funds growth
This figure plots year-over-year changes in the total net assets of retail money market fundsagainst year-over-changes in the Fed funds rate. The data are from the Federal ReserveBoard’s H.6 release, Table L.121. The sample is January 1986 to September 2017.
-5.00
-4.00
-3.00
-2.00
-1.00
0.00
1.00
2.00
3.00
4.00
-30%
-20%
-10%
0%
10%
20%
30%
40%
50%
1986 1989 1992 1995 1998 2001 2004 2007 2010 2013 2016
Fed
fu
nd
s ra
te c
han
ge
Mo
ney
ma
rket
fu
nd
s g
row
th
Retail money market funds growth Fed funds rate change
37