Embed Size (px)
Citation preview

Liquidity Planning Tools and Strategy Capacity for Equity Markets
Dan diBartolomeo January 2013
www.northinfo.com Slide 2
Main Points for Today • Liquidity shortages during the Global Financial Crisis underlined the need to have
well articulated liquidity policies as part of investment strategies. • We first need to understand the potential liquidity needs of a fund and the cost of
carrying out a partial liquidation under difficult market conditions. • We will present a simple metric for “liquidity-adjusted risk”
• The second part of the presentation will provide a model of AUM capacity of particular active strategies in terms of the tradeoffs between turnover, trading costs and alpha. • We will review model output in light of the empirical data provided in Elton, Gruber and
Blake (2011). • Both of these procedures require framing the cost of transacting equity trades into true
supply/demand curves that have quantity, side and time dimensions.
www.northinfo.com Slide 3
Playing “Show and Tell”
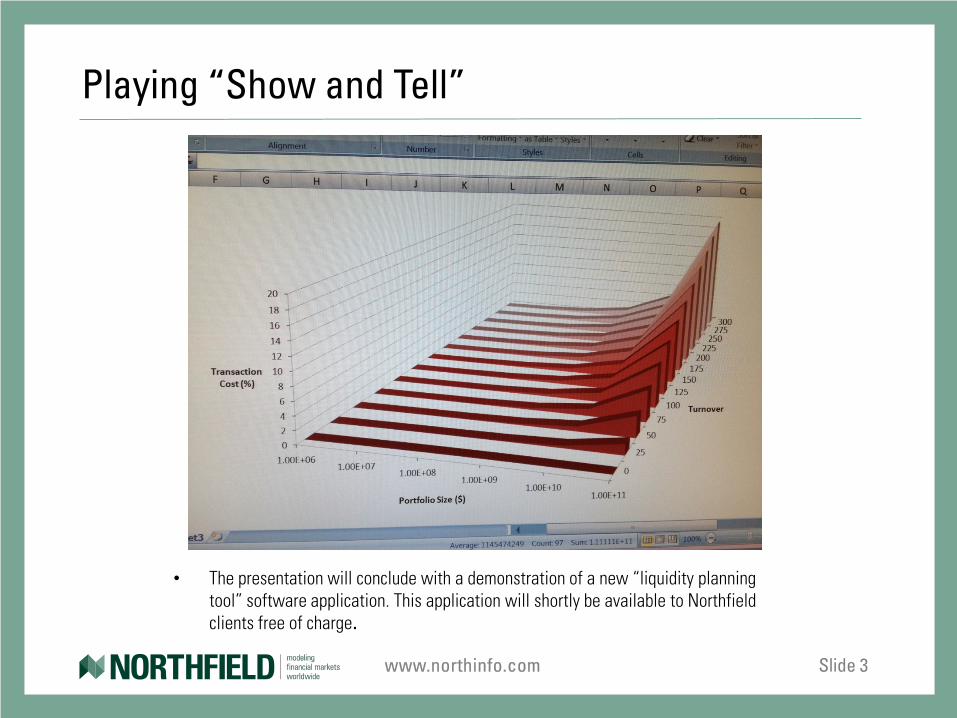
• The presentation will conclude with a demonstration of a new “liquidity planning tool” software application. This application will shortly be available to Northfield clients free of charge.
www.northinfo.com Slide 4
Key Literature
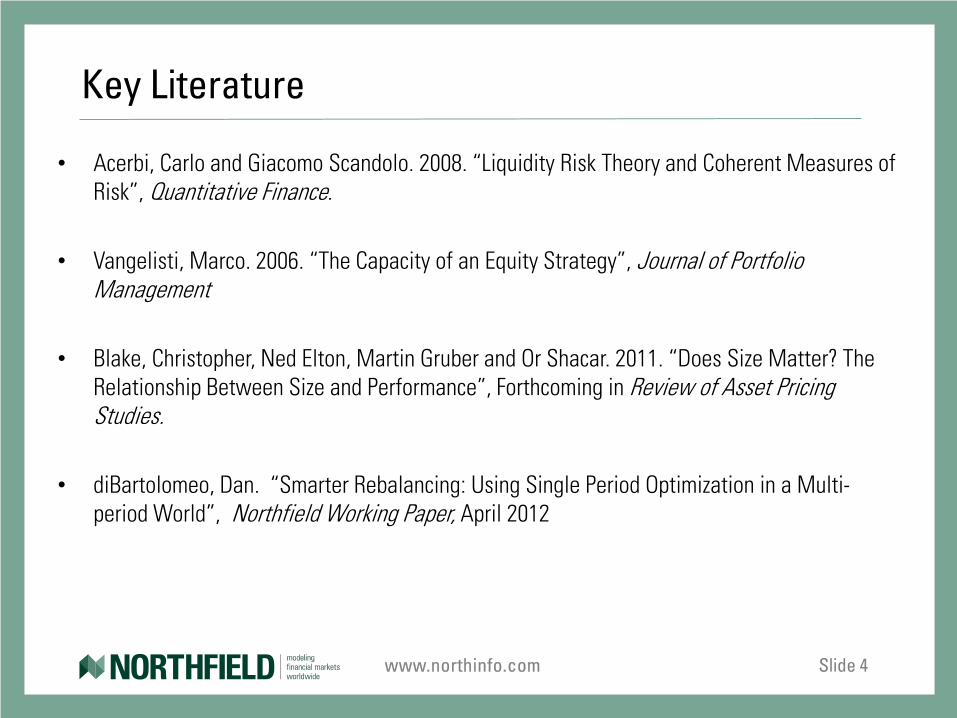
• Acerbi, Carlo and Giacomo Scandolo. 2008. “Liquidity Risk Theory and Coherent Measures of Risk”, Quantitative Finance.
• Vangelisti, Marco. 2006. “The Capacity of an Equity Strategy”, Journal of Portfolio
Management
• Blake, Christopher, Ned Elton, Martin Gruber and Or Shacar. 2011. “Does Size Matter? The Relationship Between Size and Performance”, Forthcoming in Review of Asset Pricing Studies.
• diBartolomeo, Dan. “Smarter Rebalancing: Using Single Period Optimization in a Multi-period World”, Northfield Working Paper, April 2012

www.northinfo.com Slide 5
Strategic Aspects of Portfolio Size
• As a portfolio gets larger and larger in value, it becomes more cumbersome to run in the same way that a large ship is not as agile as a small boat.
• Most importantly, the potential for active management alpha declines to some degree as funds get larger.
– Managers typically compensate by reducing turnover which theoretically reduces the “breadth” of their active strategies and their by reducing the achievable information ratio
– While all active strategies have size limitations both theory and empirical data suggest reducing turnover has less negative effects than most active managers believe
• As the market impact of larger trades increases the cost of a crisis liquidation, the effective risk level of a portfolio is a function of portfolio size
– All traditional portfolio theory is based on the assumption of infinite liquidity so risk is a function only of portfolio weights
– In the real world, trading costs are an increasing function of size so both size and weights matter in risk calculations

www.northinfo.com Slide 6
Formulating a Liquidity Policy
• Theoretical discussion is in Acerbi and Scandolo (2008) • We can formulate a liquidity policy as:
– We have to be able to liquidate X% of the portfolio in N trading days
• Given our models of cost and the size of our positions, we can estimate the cost of liquidation during crisis conditions
– Consider the impact of “crisis volatility” on trading costs
• To adjust our portfolio risk estimate for liquidity – Convert our portfolio volatility estimate to parametric Value at Risk for the
length of time specified in our liquidity policy – Add the expected cost of fulfilling liquidation to VaR – Convert the new VaR value back to the equivalent volatility
www.northinfo.com Slide 7
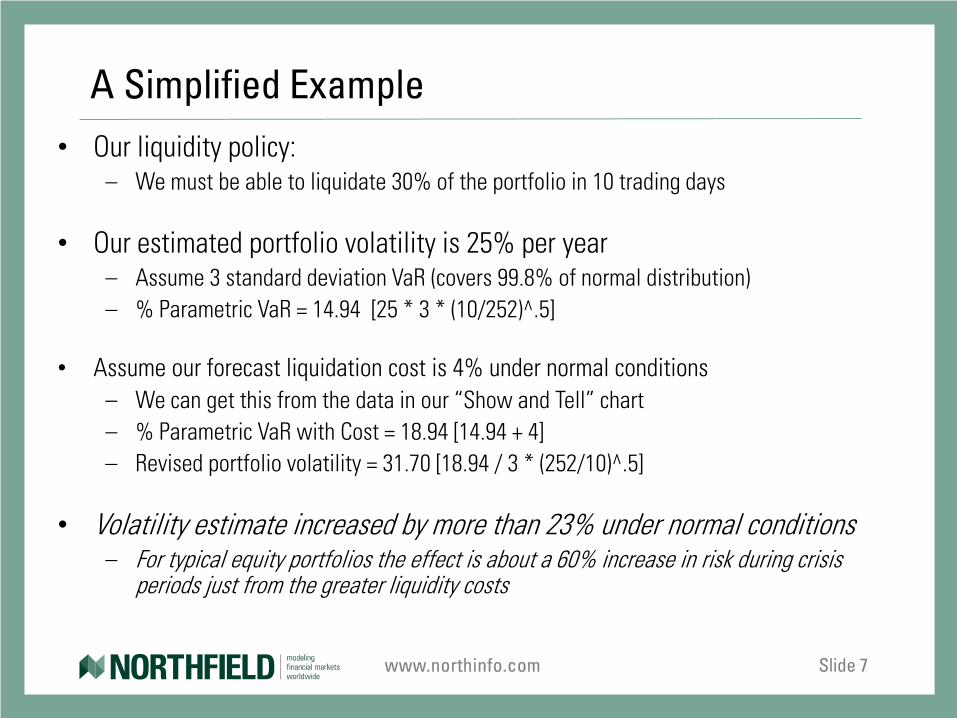
A Simplified Example • Our liquidity policy:
– We must be able to liquidate 30% of the portfolio in 10 trading days
• Our estimated portfolio volatility is 25% per year – Assume 3 standard deviation VaR (covers 99.8% of normal distribution) – % Parametric VaR = 14.94 [25 * 3 * (10/252)^.5]
• Assume our forecast liquidation cost is 4% under normal conditions
– We can get this from the data in our “Show and Tell” chart – % Parametric VaR with Cost = 18.94 [14.94 + 4] – Revised portfolio volatility = 31.70 [18.94 / 3 * (252/10)^.5]
• Volatility estimate increased by more than 23% under normal conditions – For typical equity portfolios the effect is about a 60% increase in risk during crisis
periods just from the greater liquidity costs
www.northinfo.com Slide 8
Where did I get the 4% Cost Estimate • If you liquidate your portfolio proportionately, it comes from our 3-D graph • If you want to be more sophisticated, use optimization:
– Use your regular risk tolerance. If you do not normally optimize, use RAP = TE * 6 – This rule of thumb is derived from Wilcox (2003)
• If you have alpha values, use them – If you don’t take the implied alphas from our system and adjust for long only constraints
as per diBartolomeo (2008) • Set up a constraint requiring the outcome portfolio to hold the required percentage of cash
– Choice 1: set up your normal optimization problem and run it – Choice 2: use your current portfolio (which you obviously like) and index to it – Choice 3 : Blend your existing portfolio and benchmark in a dual problem, see Wang
(1999)
www.northinfo.com Slide 9
A Return “Drag” View of Liquidity Risk
• As positions in a portfolio get larger and larger, executing trades at reasonable cost will take longer and longer, reducing opportunity to earn active returns
• An extreme case is fully illiquid investments such as real estate or private equity
– You put the first dollars in the “best” deal, the next dollars in the second best deal and so on
– The more money you allocate to an asset, the lower the expected returns become – You must allocate to higher return/higher risk assets to compensate
• Experiment on a small child
– Send them to the candy store with a small amount of money. They will buy just their favorite candy and be happy
– Send them to the candy store with a large amount of money. They will buy all sorts of stuff and end up with an upset stomach
www.northinfo.com Slide 10
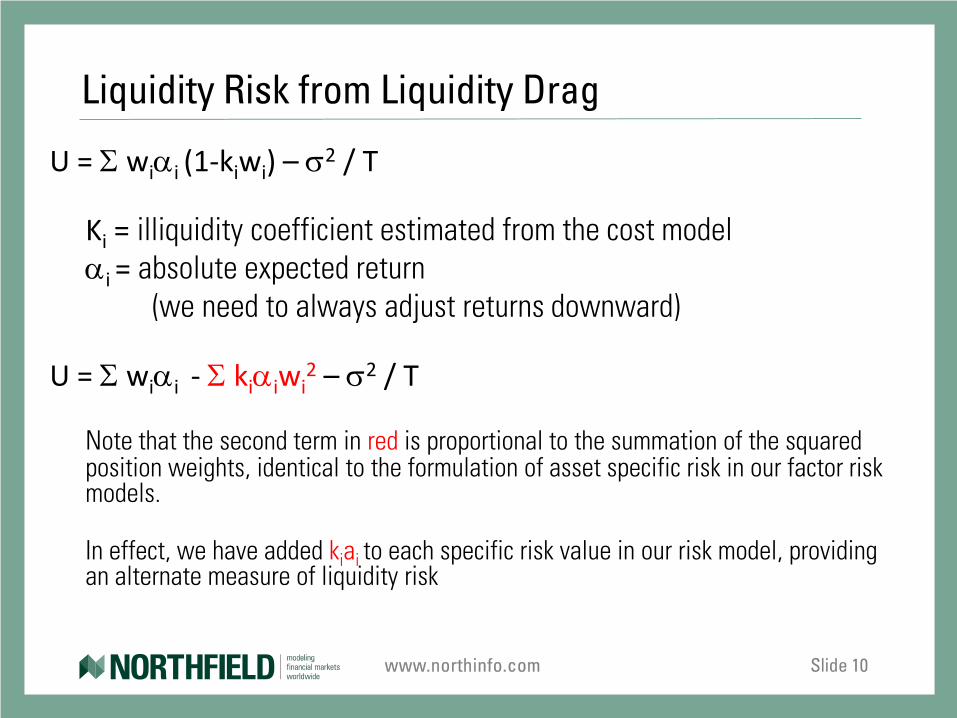
Liquidity Risk from Liquidity Drag
U = Σ wiαi (1-kiwi) – σ2 / T
Ki = illiquidity coefficient estimated from the cost model αi = absolute expected return (we need to always adjust returns downward)
U = Σ wiαi - Σ kiαiwi
2 – σ2 / T
Note that the second term in red is proportional to the summation of the squared position weights, identical to the formulation of asset specific risk in our factor risk models.
In effect, we have added kiai to each specific risk value in our risk model, providing an alternate measure of liquidity risk

www.northinfo.com Slide 11
Capacity Analysis of An Equity Strategy
• Vangelisti (2006) • Are we dealing with an exercise in investment management or
investment management ethics? • If asset managers are supposed to act in their clients “best interest”, they
should manage no more money than would begin to erode alpha • On the other hand, asset managers are profit-making enterprises not charities
that want to maximize their own revenues
• So what is the objective for investment managers? • Maximize AUM now (and therefore fees) even if alpha declines • Maximize alpha * current AUM • Maximize alpha and therefore the present value of future fees by growing
AUM as good performance draws clients
www.northinfo.com Slide 12
Fund Size, Turnover and Potential Alpha
• Grinold and Stuckelman (1993) • In the Fundamental Law of Active Management, the theoretical information ratio of a
fund is linearly related to the square root of “breadth” • The authors summarize this relationship as “half the turnover gets you three quarters of
the alpha”. • Blake, Elton, Gruber and Shacar (2011) provides a large empirical study of the actively
managed mutual funds • Before expenses the average active fund provides beats passive benchmarks on both
simple and risk adjusted bases • After expenses (mostly trading costs) the average active fund performs below
benchmarks on both simple and risk adjusted bases • The magnitude of alpha declines slightly with fund size • The magnitude of alpha declines more clearly with fund size, controlling for level of
turnover

www.northinfo.com Slide 13
Optimal Fund Size
• Once you have chosen the asset manager’s objective you can estimate the fund size and turnover level that maximizes that function
• Pre-cost alpha increases at most at the square root of turnover • Annualized transaction costs will increase roughly with turnover • If you are trying to maximize the present value of the fee income stream you have to pick a
discount rate. – Asset manager’s are a pretty high beta security so the CAPM says the discount rate
should be high • You have to estimate a growth rate of new assets as a function of alpha
– Some studies suggest this is nonlinear with investors chasing alpha when hiring new managers, but staying with existing managers despite negative alpha, see Sirri and Tufano (2002)
– Of course if you attract new assets, your performance will decline and the growth rate will slow down

www.northinfo.com Slide 14
Why Does Alpha Decline with Turnover? • If manager’s are acting optimally, they should know enough not to trade when the
costs outweigh the alpha benefits • The simplest explanation is that managers need to “look busy” in order to
justify active management fees so they trade more than is optimal • A similar explanation is that managers just have an upward biased view of
their own skill, so they are optimistic about alpha pickup relative to trading costs
• diBartolomeo (2012) • Modern Portfolio Theory (Markowitz 1952) and CAPM (Sharpe, 1964) are single period
models • Time exists only as long as return and risk parameters don’t change • Traditional optimization uses single period math in a multi-period world • Trading costs need to be scaled to reflect “the probability of realization” for your
estimated alpha improvement over a finite horizon
www.northinfo.com Slide 15
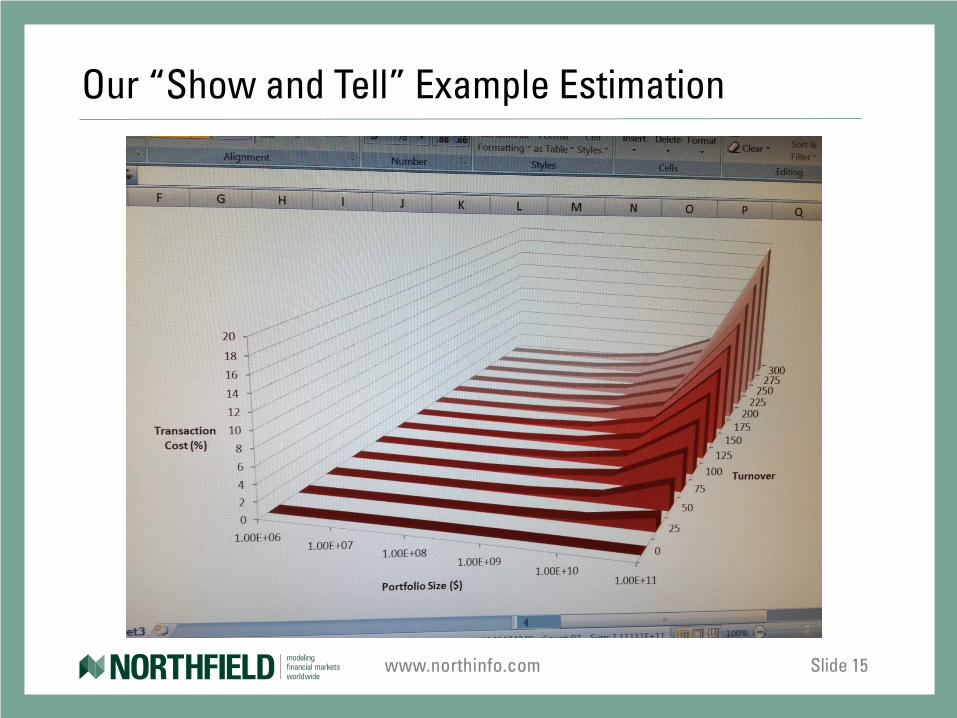
Our “Show and Tell” Example Estimation
www.northinfo.com Slide 16
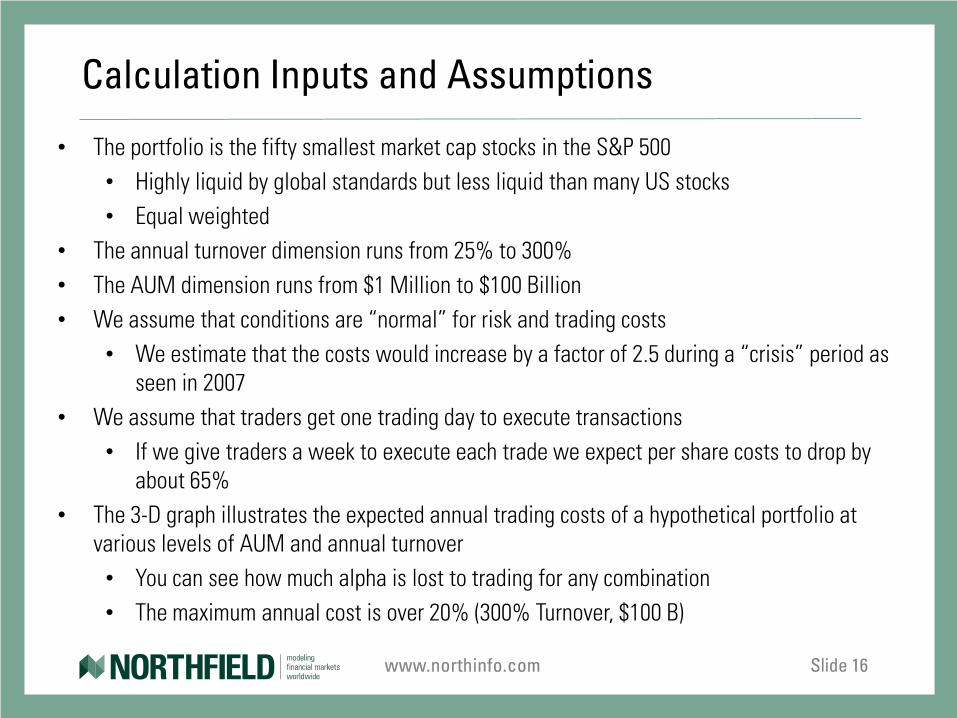
Calculation Inputs and Assumptions
• The portfolio is the fifty smallest market cap stocks in the S&P 500 • Highly liquid by global standards but less liquid than many US stocks • Equal weighted
• The annual turnover dimension runs from 25% to 300% • The AUM dimension runs from $1 Million to $100 Billion • We assume that conditions are “normal” for risk and trading costs
• We estimate that the costs would increase by a factor of 2.5 during a “crisis” period as seen in 2007
• We assume that traders get one trading day to execute transactions • If we give traders a week to execute each trade we expect per share costs to drop by
about 65% • The 3-D graph illustrates the expected annual trading costs of a hypothetical portfolio at
various levels of AUM and annual turnover • You can see how much alpha is lost to trading for any combination • The maximum annual cost is over 20% (300% Turnover, $100 B)
www.northinfo.com Slide 17
Show and Tell, Part II
• Northfield estimates the market impact portion of trading costs for over 75,000 stocks on a monthly basis.
– The methodology: http://www.northinfo.com/Documents/538.pdf – Unlike “sell side” estimates derived from empirical data on small trades our model
provides coherent estimates over all possible trade sizes • We’ve created a small software application that traders can use to estimate the cost of
doing any size trade over any number of trading days – The trader can adjust the inputs to reflect whether they believe their trading skill is
below or above average – Inputs can be expressed in various forms (shares, %ADV) – Tables and 3-D graphs can be arranged in various ways with several display options
• The “Liquidity Planning Tool” application is free to existing Northfield clients – During 2013, daily updates of trading cost estimates will be made available at an extra
charge
www.northinfo.com Slide 18
Conclusions • Traditional portfolio theory has assumed zero trading costs so liquidity effects are not well
explored in the theoretical literature. • Portfolio risk and expected return are unrealistically assumed to be independent of
portfolio size • It is imperative that both asset owners and asset managers make appropriate provision the
effects on liquidity on both expected alpha and on portfolio risk • The formulation of the “capacity” of an active strategy really depends on the “ethical view”
of the manager • The interests of both managers and investors may align if the managers are maximizing
the present value of future fee income • Empirical studies suggest that active managers add value but that turnover rates are
excessive on average • Emergency liquidity planning requires rational cost estimates for trades that are much larger
than would be routinely undertaken for active strategies, requiring different modeling from normal trading