Embed Size (px)
Citation preview
© 2020 JETIR July 2020, Volume 7, Issue 7 www.jetir.org (ISSN-2349-5162)
JETIR2007401 Journal of Emerging Technologies and Innovative Research (JETIR) www.jetir.org 812
Liquidity management: An empirical assessment of
some selected companies in Indian cement industry
Prof. Snehanshu Basu.
[Lecturer of Commerce and Management, Umes Chandra College, Kolkata]
Abstract:
India is the second largest producer of cement in the world. The Indian cement industry is dominated by a few
companies. The top twenty cement companies account for almost seventy percent of the total cement production in
the country. The cement industry in India play a major role by experiencing a boom on account of the overall
growth of the Indian economy because of increased industrial activities. It flourishing real estate business,
construction activity and also make investment in infrastructure sector. It has make remarkable improvement under
different policy regimes such as installed capacity, capacity utilization and per capita consumption and export into
different countries. The cement industry in India has experienced a complete shift in the technology of production,
from wet process to dry process. In this paper it has to examine the liquidity management of some selected
companies in order to judge their efficiency for short term debt paying capability, however they performed in a
remarkable way by earning required profit . These companies are selected based on current market capitalization.
Keywords: Liquidity Management, Profitability.
Introduction:
Finance is a like blood in our body so long as blood circulates properly in the body; we feel healthy and have
capacity to work. If circulation is not proper, it will put effect on the functioning of the body, similarly it will be
difficult for business concern to take financial decision related to the determination of the amount of long term
finance is to be raised. The optimum capital structure should be determined by keeping in mind the long term
and short requirement of finance.
The general state of corporate liquidity in India in recent years has tended to be fairly difficult. A large number of
business enterprises both in public sector and private sector, irrespective of their age, size or product line, have
been experiencing enormous difficulties in meeting their short term maturing obligation. In several cases, even
the statutory payments towards employees’ provident fund and the employee state insurance scheme have at
times been at stake and modernization of industrial plants have been relegated to the low priority in the scheme
of things because of shortage of liquid funds. A business can survive long periods of low earnings if it has
adequate cash flow and financial strength. But the opposite is not true. Thus Liquidity is a vital factor in business
operation. For the very survival of business, the firm should have requisite degree of liquidity. It should be neither
excessive nor inadequate. Excessive liquidity means accumulation of ideal funds. Which may lead to lower
profitability, increase speculation, and unjustified extension, extension of liberal credit terms, liberal dividend
policy etc; whereas inadequate liquidity result in interruptions of business operations like production
interruptions and hampers the firm’s earning capacity also. An efficient liquidity management can lead not only
to loss of profit but also to the ultimate downfall of what otherwise might be considered as promising concern. A
proper balance between these two extreme situations therefore should be maintained for efficient operation of
© 2020 JETIR July 2020, Volume 7, Issue 7 www.jetir.org (ISSN-2349-5162)
JETIR2007401 Journal of Emerging Technologies and Innovative Research (JETIR) www.jetir.org 813
business through skill full liquidity management. The need of efficient liquidity management corporate sector has
become greater in recent years.
In this paper analysis regarding the liquidity management in cement industry for the period 2008 to 2017 has
been made by selecting four companies in the industry which are Acc Ltd Cement, Gujarat Ambuja Cement, India
Cement and Ultratech Cement. Such analysis is expected to show an explanatory comparison among the
companies belonging to the same industry regarding the various aspects of their liquidity management.
About the companies:
I. ACC Ltd.: It is a public sector company engaged in the production and supply of cement in India. Acc
Ltd. or Acc is the oldest cement and concrete maker in India. The company was established in 1936. Acc
Ltd was previously known in the name of the associated cement companies Ltd. In 2005, ACC Ltd.
became a part of the reputed Holcim Group of Switzerland.The headquarters of the company are
located in Mumbai. Ten cement manufacturers owned by the Khataus, Tatas, F E Dinshaw, and Kellick
Nixon amalgamated in 1936 to create this company.
II. Ambuja cement: It is a public Ltd. company engaged in the production and supply cement in India.
Gujarat Ambuja cement was established in the year 1986 and the company has growth by leaps and
bounds in the last 10 years.The Gujarat Ambuja Cements owns some of the state-of the-art
manufacturing facilities equipped with advanced technological instrumentation. The outstanding growth
of the company was due to the use of ethical trade practices and the commitment of a dedicated work
force. The superb management was an added bonus to the company which fueled further growth.
III. India Cement: It is a private company engaged in the production and distribution of cement in India.
India cement established in the year 1946, is leading cement manufacture with a countrywide network of
production unit and marketing offices. The company is based out of Tamil Nadu and is largest cement
producer in south India and acquires 30% of country’s cement market. They are most trusted brands of
cement in southern state of India. From a two plant company having a capacity of just 1.3 million tonnes
in 1989, the company has robustly growth in the last two decades to a total capacity of 15.5million
tonnes per annum. It has 7 integrated cement plants in Tamil Nadu, Telangana and Andhra Pradesh, One
in Rajasthan (through its subsidiary,Trinetra Cement Ltd) and two grinding units, one each in Tamil
Nadu and Maharashtra.
IV. Ultratech Cement: It is a Public Ltd. Company engaged in the production and distribution of cement
in India. Ultratech Cement incorporated in the year 1987, has been a pioneer and trend – setter in Indian
Cement industry. They are 100% subsidiary of Grasim industries which is a subsidiary of Aditya Birla
Group. They have head office in Mumbai and are largest producer of grey cement in India. Their
products are exported to various countries in Middle East and neighboring Indian sub-continent
countries. It has annual production capacity of 66 Million Per Annum (MTPA) and has 12 operational
plants across India. It is the largest producer of cement in India based on turnover and market share.
Review of the related literature:
Before setting the objective of the study it is necessary to review the existing literature on the issue connected
with the study and to ascertain research gaps. The following paragraph in this section present a brief description
of some of the notable studied carried out in the recent past in India on the topic addressed in the present study
© 2020 JETIR July 2020, Volume 7, Issue 7 www.jetir.org (ISSN-2349-5162)
JETIR2007401 Journal of Emerging Technologies and Innovative Research (JETIR) www.jetir.org 814
and the last paragraph in this section deals with the identification of the research gaps. Some notable studies in
this area include-
Chakraborty and De (1994) carried out a study on the working capital management of eastern Coalfields Limited
for the period of 1979-80 to 1985-86. The study discloses that the liquidity position of the company was almost
poor. The study was revealed that long term funds were was used in large proportion to meet the company’s
short term liabilities which in turn affected the profitability of the enterprise to a great extent.
Reddy and Rao (1996) in their study made an attempt to examine the working capital management practices in
Hindustan Cables Limited (HCL), a public enterprise on the assumption that working capital policies had a great
effect on a firm’s liquidity and profitability.
Refuse (1996) quarreled that attempts to improve working capital by delaying payment to creditors are counter-
productive , and that altering debtors and creditors levels for individual tiers within a value system will rarely
produced any net benefit.
Sur (2006) studied the efficiency of the working capital management in the national thermal Power Corporation
(NTPC), and showed that the company achieved a higher level of efficiency in managing its working capital during
the post-liberalization period by adapting itself to the new environment which had emanated from liberalization,
globalization and competitiveness.
Chakraborty (2008) evaluated the relationship between working capital and profitability of Indian pharmaceutical
companies. He point out that there were no distinct school of thought on this issue, according to one school of
thought , working capital is not a factor of improving profitability and there may be a negative relationship
between them, while according to the other school of thought , investment in working capital plays a vital role to
improve corporate liquidity.
Ramachandran and Janakiraman(2009) analyzed the relationship between Working Capital Management
Efficiency(WCME) and Earnings before interest and Taxes(EBIT) of the paper industry in India during 1997-1998 to
2005-2006.
Bhunia and khan (2011) examine the overall efficiency of the management of liquidity in selected private sector steel companies.
Objective of the study:
The present study has the following objectives:
i) To compare the liquidity of all the four enterprises under study by selecting a few parameters relating to
liquidity management such as current ratio (CR), Quick ratio (QR), Current assets to total assets
ratio(CATA), inventory turnover ratio( ITR), and debtors turnover ratio(DTR). ii) To analyze the liquidity of the companies under study more precisely by using Motaal’s comprehensive
test. iii) To measure the closeness of association between liquidity and profitability of the companies by
computing Spearman’s rank correlation coefficients and to test the significance of such coefficients.
iv) To make necessary suggestions for improving the efficiency in the liquidity management of the
companies under study.
© 2020 JETIR July 2020, Volume 7, Issue 7 www.jetir.org (ISSN-2349-5162)
JETIR2007401 Journal of Emerging Technologies and Innovative Research (JETIR) www.jetir.org 815
Methodology of the study:
The data of the four companies selected for this study in the Indian cement industry for the period 2008 to
2017 have been collected from secondary sources i.e. published financial statements of the company. For the
purpose of analyzing the performance of the liquidity management of the companies in the present study the
technique of ratio analysis, Motaal’s comprehensive rank test, simple statistical technique like measure of central
tendency, spearman’s rank correlation analysis etc. have been used. To test the significance of the rank correlation
coefficients “t” test has been applied.
Finding and conclusions of the study
In order to assess the liquidity position of the companies during the study period the following five important ratios
relating to liquidity management have been computed:
A. Current ratio (C.R): It is a basic financial ratio that measures whether or not the firm has enough resources to
pay of its current obligation over the next 12 months. It compares a firm’s current assets to its current liabilities.
The higher the CR, the larger is the amount available per rupee of short term obligations and accordingly, the
greater is the feeling of security. Keeping in view the possibility of 50% shrinkage in the value of current assets,
the rule of thumb about the CR has been set at 2:1. However acceptable CR vary from industry to industry. But if a
company’s CR is in this ratio, then it generally indicates good short-term financial strength. If current liabilities
exceed current assets (the CR is below 1) then the company may have problems meeting its short- term obligations
(current liabilities). Each firm has to develop its own standard or ideal ratio from past experience and this only can
be taken as a norm.
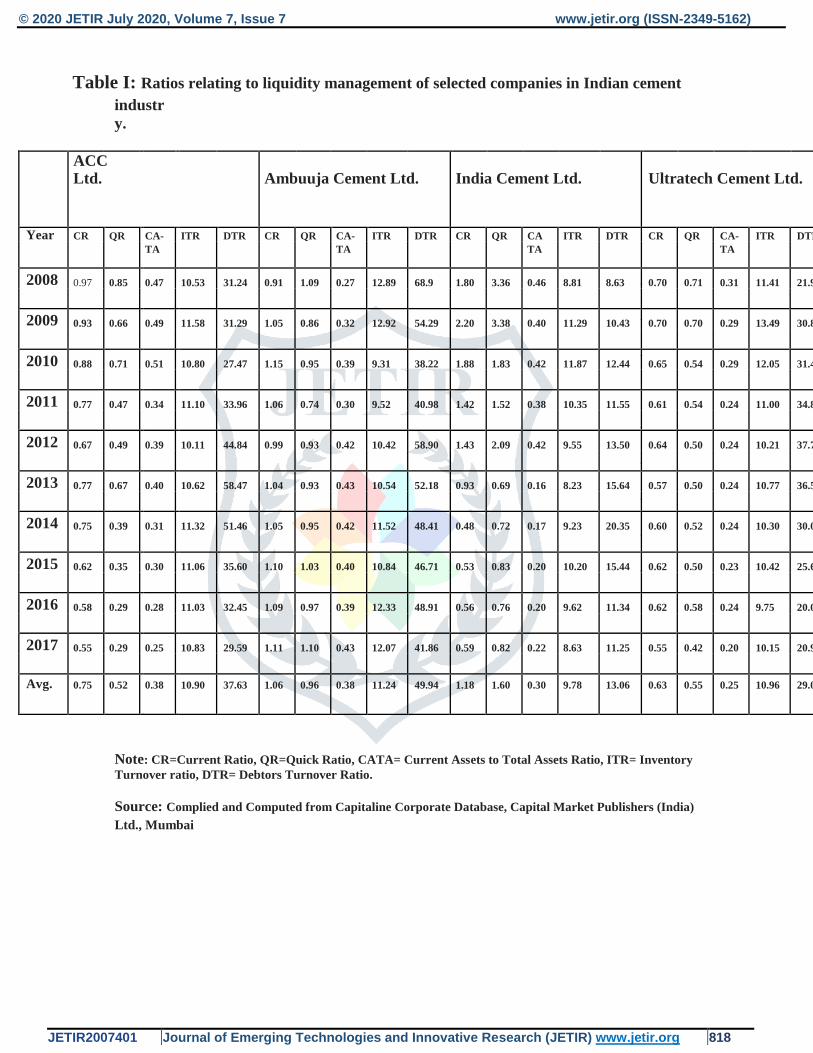
Table I disclose that the CR in ACC Ltd. registered a decreasing trend during the period under study. It ranged
between 0.97 in the year 2008 and 0.55 in the year 2017. On an average, the CR in ACC Ltd. was 0.75 during the
study period. The CR in Ambuja cement Ltd. recorded as a fluctuating during the study period. It fluctuated
between 1.15 in the year 2010 and 0.91 in the year 2008. The mean value of this ratio in Ambuja cement Ltd. was
1.06. The CR in India cement Ltd. also registered a fluctuating trend during the period under study. It ranged
between 2.20 in the year 2009 and 0.48 in the year 2014. On an average, the ratio in India cement Ltd. was 1.18
during the study period. The CR of Ultratech Ltd. recorded as a also witnessed a fluctuating trend during the period
under study. It was 0.70 in the year 2008 which came down to 0.55 in the year 2014. The mean value of this ratio
in Ultratech cements Ltd. was 0.63 during the study period. The CR of all companies under study was inadequate
the conventional standard of 2:1 throughout the study period. It indicates that the liquidity position of all the
companies was not satisfactory.
However, no definite conclusion can be drawn about the liquidity on the basis of CR only because CR shows
quantity of short terms assets but fails to judge their quality. Moreover, In the majority of Indian manufacturing
public limited companies the mean CR varies between 1 and 1.50 and thus it can be said that on the basis of the
study that the average CR of Ambuja cement Ltd. and India cement Ltd. was satisfactory whereas the ratio of ACC
Ltd. and Ultratech Ltd. was alarming. b) Quick Ratio (QR): This ratio is a refinement of CR and it shows the extent of cash and other current assets that
are readily convertible into cash in comparison to the short term obligation of an organization. Quick ratio differs
from current ratio in that those current assets that are not readily convertible into cash are excluded from the
© 2020 JETIR July 2020, Volume 7, Issue 7 www.jetir.org (ISSN-2349-5162)
JETIR2007401 Journal of Emerging Technologies and Innovative Research (JETIR) www.jetir.org 816
calculation such as inventory and deferred tax credits since conversion of such assets into cash may take
considerable time. So it can measure more effectively the short term debt paying ability of the concern. Rule of the
thumb is 1:1 for the QR. It is evident from Table I that the QR of ACC Ltd. was less than the conventional standard
of 1:1 during the period under study. It ranged between 0.29 in the year 2016, 2017 and 0.85 in the year 2008. In
case of Ambuja cement Ltd. excepting the years 2008, 2015 and 2017 this ratio was below the conventional
standard of 1:1. It fluctuated between 0.74 in the year 2011 and 1.10 in the year 2017. The QR of India cement Ltd.
depicts that during the period 2008 to 2012 it is greater than the conventional standard of 1:1 and after that this
ratio is fluctuated and below the conventional standard during the study period. It ranged between 0.69 in the year
2013 and 3.38 in the year 2009. The QR of Ultratech cements Ltd. was far below the conventional standard
throughout the study period. This ratio in Ultratech cement varies between 0.42 in the year 2017 and 0.71 in the
year 2008. The mean value of QR of Acc Ltd., Ambuja Cement Ltd., India cement Ltd. and Ultratech Cement Ltd.
were 0.52, 0.96, 1.60, and 0.55 respectively. On the basis of findings it can be concluded that in most of the years
under study liquid assets of the companies were inadequate to meet very short term debt except India cement Ltd.
Thus judged from the traditional norm it reveals that the instant capacity of the companies to meet its quick
liabilities was not at all satisfactory.
C) Current Assets to Total Assets Ratio (CATA): This ratio indicates the extent of total fund invested for
working capital purpose. It should be worthwhile to observe that how much of that portion of total assets is
occupied by the current assets, as current assets are essentially involved in forming working capital and also take
an active part in increasing liquidity. Table I exhibits that the mean percentage of current assets in relation to total
assets in ACC Ltd. was 25. On the other hand Ambuja Cement Ltd., India Cement Ltd., and Ultratech Cement Ltd.
this average percentage were 38, 30 and 25 respectively. The CATA of ACC ltd. was minimum in the year 2017
which was 0.25 and it was maximum in the year 2010 which was 0.51. Similarly the ratio in Ambuja cement Ltd.
varies between 0.27 in the year 2008 and 0.43 in the year 2013 and 2017. In case of India Cement Ltd. this ratio
ranged between 0.16 in the year 2013 and 0.46 in the year 2008. This ratio in Ultratech Cement Ltd. varied from
0.20 in the year 2017 to 0.31 in the year 2008. So the variation of investment in current assets was maximum for ACC Ltd. and Minimum for Ultratech
Cement Ltd. during the period under study.
d) Inventory Turnover Ratio (ITR): This ratio indicates how many times a company’s inventory is sold and
replaced over a period. The higher the ratio the more efficiently the inventory is said to be managed and vice versa.
it is observed from table I that the ITR marked as fluctuating trend in all the four companies during the period
under study from 2008 to 2017. The average value of ITR during the study period was highest in case of Ambuja
Cement Ltd.,
Ultratech Cement Ltd., Acc Ltd. and India Cement Ltd. which was 11.24, 10.96, 10.90 and 9.78 respectively. The
ITR of ACC Ltd. ranged between 10.11 in the year 2012 and 11.58 in the year 2009. In case of Ambuja Cement
Ltd. the range was between 9.31 in the year 2010 and 12.92 in the year 2009.This ratio of India Cement Ltd.
fluctuated between 8.23 in the year 2013 and 11.87 in the year 2010. In case of Ultratech Cement Ltd. it varies
between 9.75 in the year 2016 and to 13.49 in the year 2009. So from the above elaboration and from the viewpoint
of efficiency in management of inventory of Ambuja Cement Ltd. may be given the first ranking as its mean ITR
during the study period was maximum, leaving the second position to Ultratech Cement Ltd. And the third position
to ACC Ltd. whereas the weakest performance was in India Cement Ltd. However, the ITR of companies was
higher in all the years under study as compared to “Indian manufacturing industry” average of 2.12. It shows that
good sales or buy in small amounts. It also indicates better liquidity and the efficiency of the inventory
management of all the four companies was quite encouraging during the period under study.
e) Debtors turnover ratio (DTR): It is also a tool to aid in an analysis of efficiency of liquidity management. A
high DTR can imply a variety of things about a company. It may suggest that a company operates on a cash basis.
© 2020 JETIR July 2020, Volume 7, Issue 7 www.jetir.org (ISSN-2349-5162)
JETIR2007401 Journal of Emerging Technologies and Innovative Research (JETIR) www.jetir.org 817
It may also indicate that company’s collection of accounts receivable is efficient, and that the company has a high
portion of quality customers that pay off their debts quickly. It can also suggest that the company has a
conservative policy regarding its extension of credit. As per study conducted by CMIE, average DTR of 11 is
considered to be satisfactory in an Indian manufacturing company. Table I shows that the DTR maintained by the
selected companies in cement industry ranged between 8.63 to 68.90 during the period under study. The DTR of
the companies was much higher as compared to standard set by the CMIE in almost all the years under study. It
depicts that collection of receivable and efficient debt management of the companies during the period under study.
Table I reveals that The DTR of all the four companies marked as a fluctuating trend during the period under study.
Among the selected companies, the mean DTR in Ambuja Cement Ltd. which was 49.94 was the highest, followed
by the ACC Ltd. and Ultratech Cement Ltd. While the average DTR in Indian Cement Ltd. which was 13.06 was
the least. However, the overall fluctuating trend of the selected four companies suggests company’s efficiency in
assets management.
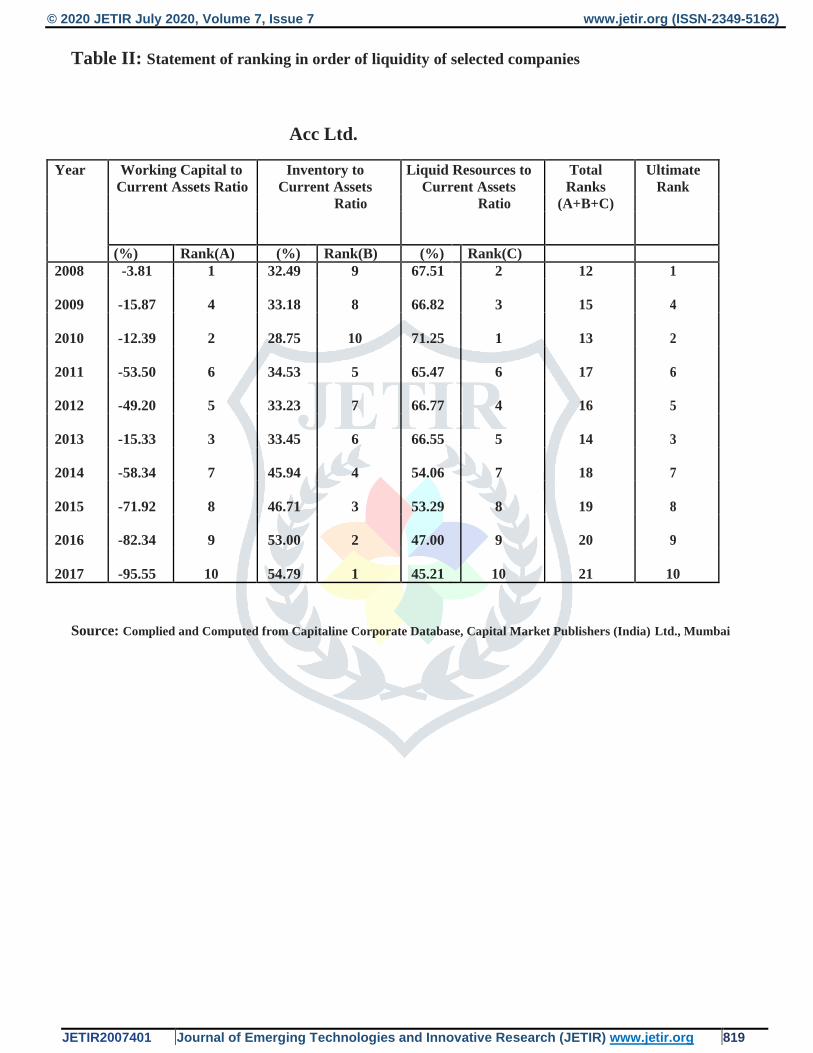
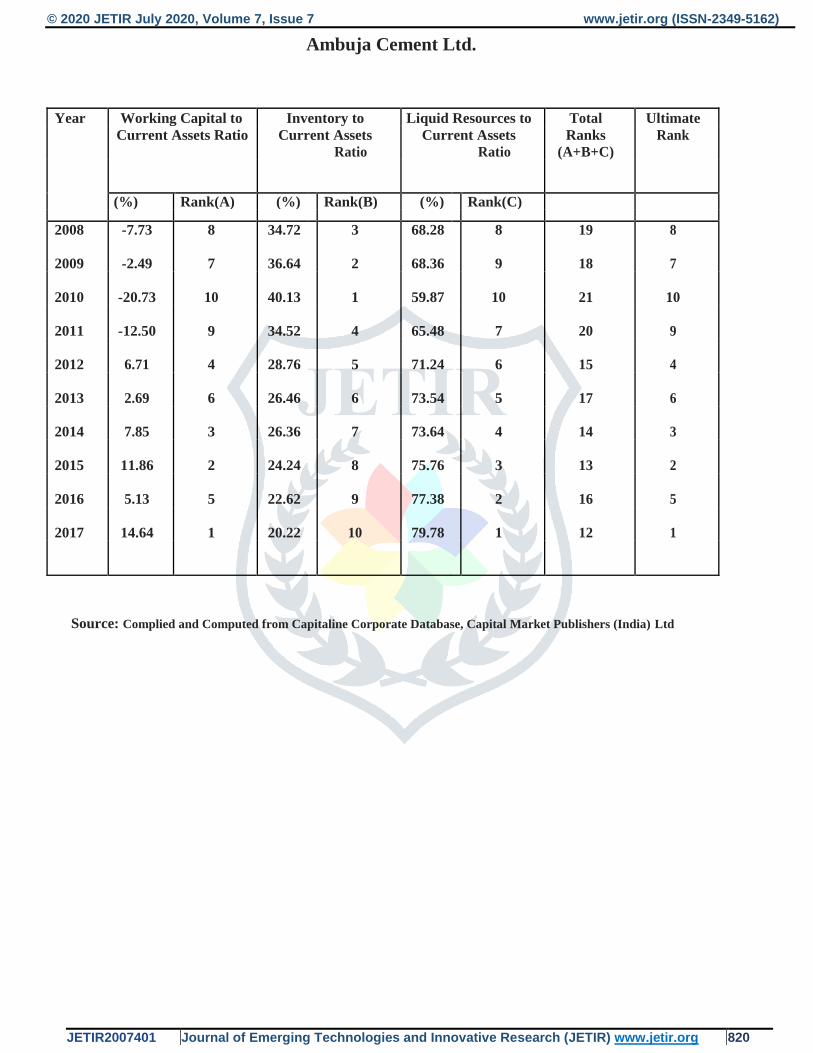
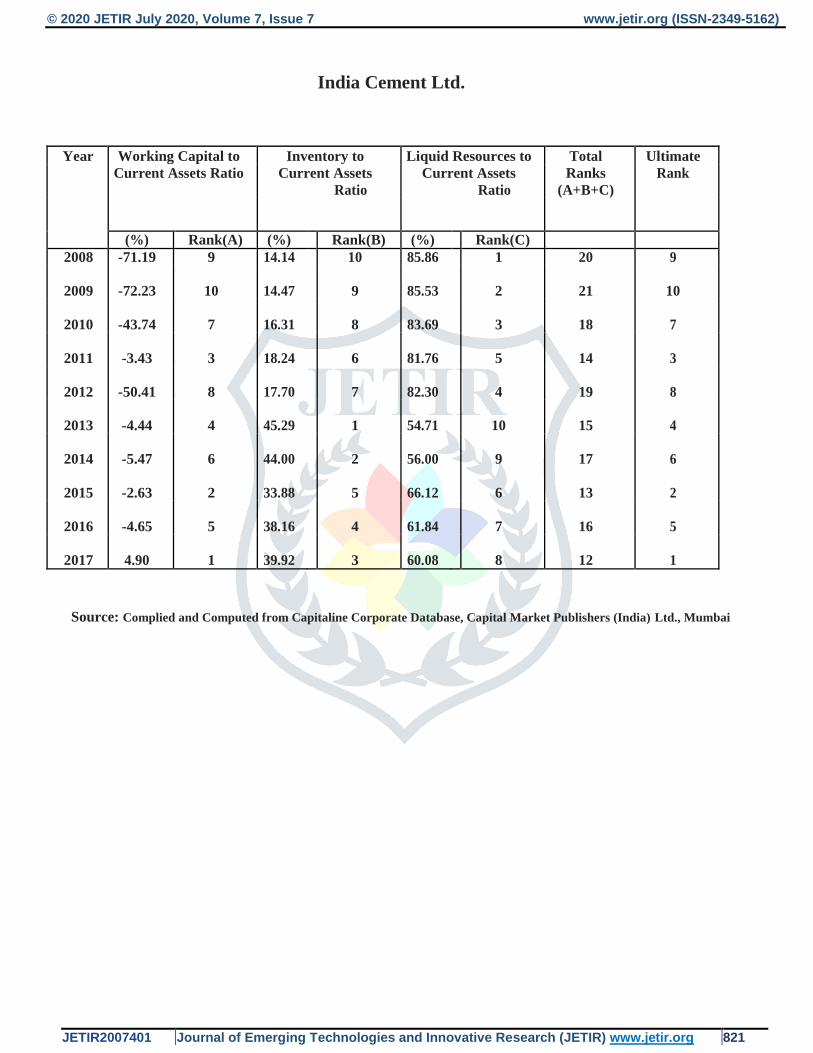
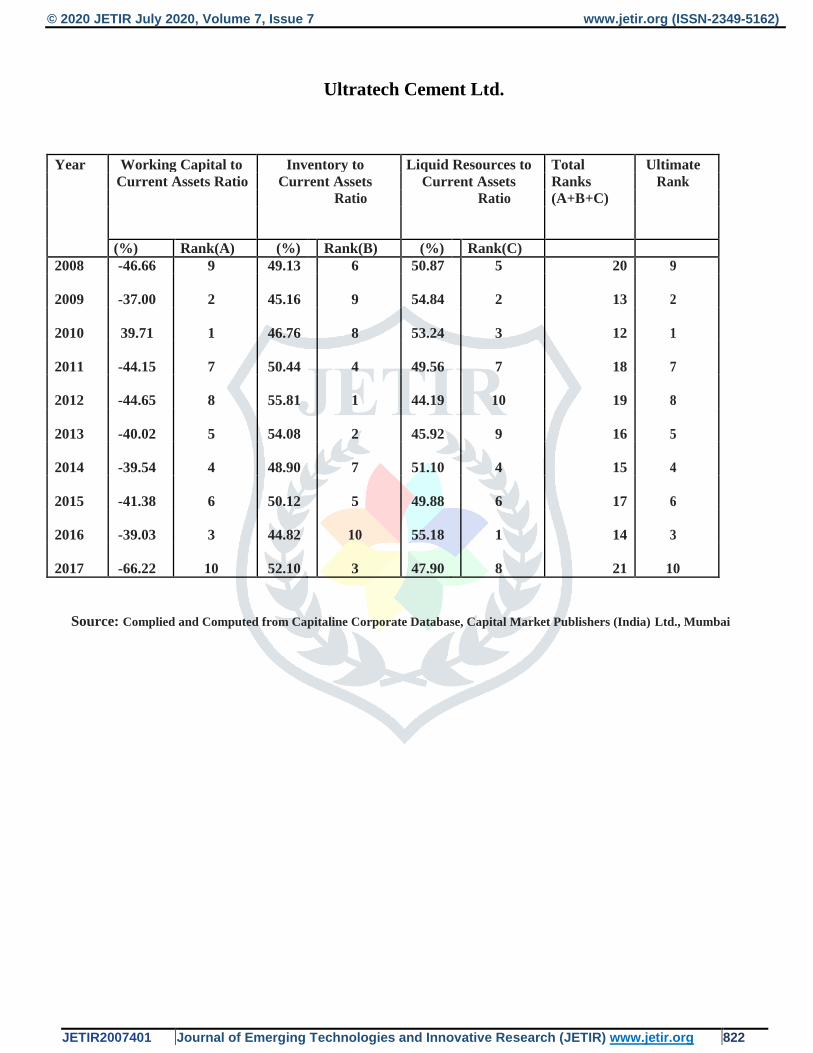
II. In Table II an effort has been made to examine the overall liquidity of the companies under
study more precisely by applying Mortaal’s comprehensive test. In this test a process of ranking has been used to
arrive at a more comprehensive measure of liquidity in which three ratios, namely, working capital to current assets
ratio, inventory to current assets ratio and liquid resource to current assets ratio have been combined in a point
score. A high value of working capital to current assets ratio indicates a good level of financial stability and ability
to actively operate even in the absence of access to the short-term loan capital and external sources of finance. And
vice versa, low rate values witness a significant financial dependence from creditors ‘fund and ranking has been
done in that order. A high value of liquid resource to current assets ratio indicates greater liquidity and thus ranking
has been done in that order. On the other hand, a low inventory to current assets ratio implies a more favourable liquidity position and ranking has
been done in that order. Ultimate ranking has been done on the principle that the lower the aggregate of individual
ranks the more favourable is the liquidity position and vice versa. Table II disclose that in case of ACC Ltd. the
year 2017 registered the most sound liquidity position and it was followed by the years 2016, 2015, 2014, 2011,
2012, 2009, 2013, 2010 and 2008 respectively in that order. On the other hand in case of Ambuja Cement Ltd.
2010 registered the top most position in terms of liquidity and it was followed by the years 2011, 2008, 2009, 2013,
2016, 2012, 2014, 2015 and 2017.respectively in that order. The liquidity position of India Cement Ltd. was the
best in the year 2009 during the period under study. After that the year 2008 occupied the second position and it
was followed by the years 2012, 2010, 2014, 2016, 2013, 2011, 2015 and 2017 respectively in that order. In case of
Ultratech Cement Ltd the year 2017 reached the highest position in terms of liquidity and it was followed by the
years 2008,2012, 2011, 2015, 2013, 2014, 2016, 2009 and 2010 respectively in that order.
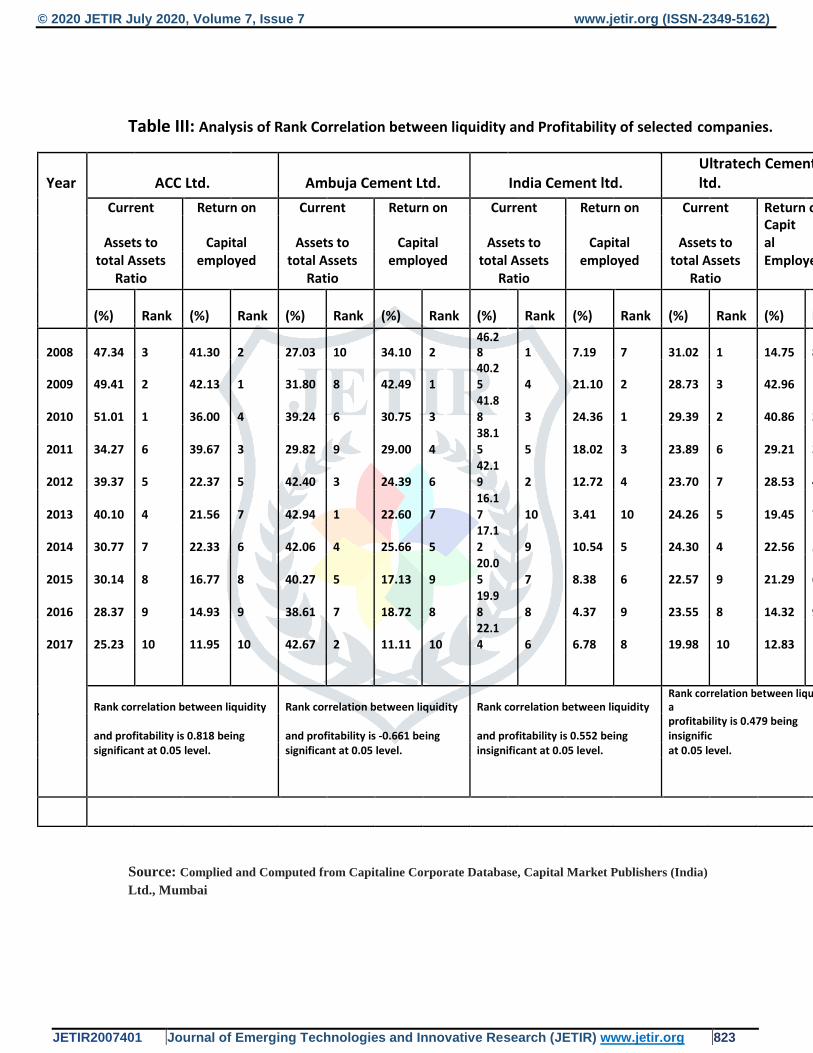
III. In Table III it has been attempted to measure the degree of association between liquidity and profitability of
the companies by computing spearman’s rank correlation coefficient. To examine whether the computed value of
such coefficient is significant or not “t” test has been applied. In this backdrop current assets to total assets ratio
(CATA) has been used as the liquidity indicator and return on capital employed (ROCE) has been taken as the
profitability measure. Table III depicts that the rank correlation coefficient between CATA and ROCE of ACC Ltd.
was 0.818, whereas the correlation coefficient of Ambuja Cement Ltd. was -0.616 and in the case of India Cement
Ltd. this was 0.552 which were statistically significant. So this positive association imply favourable impact of the
liquidity of ACC Ltd. Ambuja Cement Ltd. and India Cement Ltd .on their profitability. It was possible due to
continuous improvement in the efficiency of the overall liquidity management of these companies. But in case of
Ultratech Cement Ltd. the rank correlation coefficient between CATA and ROCE is 0.479 which were not
statistically significant. It indicates that in case of Ultratech Cement Ltd. the degree of association between
liquidity and profitability was positive, the degree of influence of liquidity of this company on its profitability was
very low and insignificant. It confirms inefficiency of its liquidity management as a whole.
© 2020 JETIR July 2020, Volume 7, Issue 7 www.jetir.org (ISSN-2349-5162)
JETIR2007401 Journal of Emerging Technologies and Innovative Research (JETIR) www.jetir.org 818
Table I: Ratios relating to liquidity management of selected companies in Indian cement
industr
y.
ACC Ltd. Ambuuja Cement Ltd. India Cement Ltd. Ultratech Cement Ltd.
Year CR QR CA- ITR DTR CR QR CA- ITR DTR CR QR CA ITR DTR CR QR CA- ITR DTR
TA TA TA TA
2008 0.97 0.85 0.47 10.53 31.24 0.91 1.09 0.27 12.89 68.9 1.80 3.36 0.46 8.81 8.63 0.70 0.71 0.31 11.41 21.98
2009 0.93 0.66 0.49 11.58 31.29 1.05 0.86 0.32 12.92 54.29 2.20 3.38 0.40 11.29 10.43 0.70 0.70 0.29 13.49 30.80
2010 0.88 0.71 0.51 10.80 27.47 1.15 0.95 0.39 9.31 38.22 1.88 1.83 0.42 11.87 12.44 0.65 0.54 0.29 12.05 31.42
2011 0.77 0.47 0.34 11.10 33.96 1.06 0.74 0.30 9.52 40.98 1.42 1.52 0.38 10.35 11.55 0.61 0.54 0.24 11.00 34.88
2012 0.67 0.49 0.39 10.11 44.84 0.99 0.93 0.42 10.42 58.90 1.43 2.09 0.42 9.55 13.50 0.64 0.50 0.24 10.21 37.72
2013 0.77 0.67 0.40 10.62 58.47 1.04 0.93 0.43 10.54 52.18 0.93 0.69 0.16 8.23 15.64 0.57 0.50 0.24 10.77 36.57
2014 0.75 0.39 0.31 11.32 51.46 1.05 0.95 0.42 11.52 48.41 0.48 0.72 0.17 9.23 20.35 0.60 0.52 0.24 10.30 30.08
2015 0.62 0.35 0.30 11.06 35.60 1.10 1.03 0.40 10.84 46.71 0.53 0.83 0.20 10.20 15.44 0.62 0.50 0.23 10.42 25.64
2016 0.58 0.29 0.28 11.03 32.45 1.09 0.97 0.39 12.33 48.91 0.56 0.76 0.20 9.62 11.34 0.62 0.58 0.24 9.75 20.02
2017 0.55 0.29 0.25 10.83 29.59 1.11 1.10 0.43 12.07 41.86 0.59 0.82 0.22 8.63 11.25 0.55 0.42 0.20 10.15 20.92
Avg. 0.75 0.52 0.38 10.90 37.63 1.06 0.96 0.38 11.24 49.94 1.18 1.60 0.30 9.78 13.06 0.63 0.55 0.25 10.96 29.00
Note: CR=Current Ratio, QR=Quick Ratio, CATA= Current Assets to Total Assets Ratio, ITR= Inventory Turnover ratio, DTR= Debtors Turnover Ratio.
Source: Complied and Computed from Capitaline Corporate Database, Capital Market Publishers (India) Ltd., Mumbai
© 2020 JETIR July 2020, Volume 7, Issue 7 www.jetir.org (ISSN-2349-5162)
JETIR2007401 Journal of Emerging Technologies and Innovative Research (JETIR) www.jetir.org 819
Table II: Statement of ranking in order of liquidity of selected companies
Acc Ltd.
Year Working Capital to Inventory to Liquid Resources to Total Ultimate
Current Assets Ratio Current Assets Current Assets Ranks Rank
Ratio Ratio (A+B+C)
(%) Rank(A) (%) Rank(B) (%) Rank(C)
2008 -3.81 1 32.49 9 67.51 2 12 1
2009 -15.87 4 33.18 8 66.82 3 15 4
2010 -12.39 2 28.75 10 71.25 1 13 2
2011 -53.50 6 34.53 5 65.47 6 17 6
2012 -49.20 5 33.23 7 66.77 4 16 5
2013 -15.33 3 33.45 6 66.55 5 14 3
2014 -58.34 7 45.94 4 54.06 7 18 7
2015 -71.92 8 46.71 3 53.29 8 19 8
2016 -82.34 9 53.00 2 47.00 9 20 9
2017 -95.55 10 54.79 1 45.21 10 21 10
Source: Complied and Computed from Capitaline Corporate Database, Capital Market Publishers (India) Ltd., Mumbai
© 2020 JETIR July 2020, Volume 7, Issue 7 www.jetir.org (ISSN-2349-5162)
JETIR2007401 Journal of Emerging Technologies and Innovative Research (JETIR) www.jetir.org 820
Ambuja Cement Ltd.
Year Working Capital to Inventory to Liquid Resources to Total Ultimate
Current Assets Ratio Current Assets Current Assets Ranks Rank
Ratio Ratio (A+B+C)
(%) Rank(A) (%) Rank(B) (%) Rank(C)
2008 -7.73 8 34.72 3 68.28 8 19 8
2009 -2.49 7 36.64 2 68.36 9 18 7
2010 -20.73 10 40.13 1 59.87 10 21 10
2011 -12.50 9 34.52 4 65.48 7 20 9
2012 6.71 4 28.76 5 71.24 6 15 4
2013 2.69 6 26.46 6 73.54 5 17 6
2014 7.85 3 26.36 7 73.64 4 14 3
2015 11.86 2 24.24 8 75.76 3 13 2
2016 5.13 5 22.62 9 77.38 2 16 5
2017 14.64 1 20.22 10 79.78 1 12 1
Source: Complied and Computed from Capitaline Corporate Database, Capital Market Publishers (India) Ltd
© 2020 JETIR July 2020, Volume 7, Issue 7 www.jetir.org (ISSN-2349-5162)
JETIR2007401 Journal of Emerging Technologies and Innovative Research (JETIR) www.jetir.org 821
India Cement Ltd.
Year Working Capital to Inventory to Liquid Resources to Total Ultimate
Current Assets Ratio Current Assets Current Assets Ranks Rank
Ratio Ratio (A+B+C)
(%) Rank(A) (%) Rank(B) (%) Rank(C)
2008 -71.19 9 14.14 10 85.86 1 20 9
2009 -72.23 10 14.47 9 85.53 2 21 10
2010 -43.74 7 16.31 8 83.69 3 18 7
2011 -3.43 3 18.24 6 81.76 5 14 3
2012 -50.41 8 17.70 7 82.30 4 19 8
2013 -4.44 4 45.29 1 54.71 10 15 4
2014 -5.47 6 44.00 2 56.00 9 17 6
2015 -2.63 2 33.88 5 66.12 6 13 2
2016 -4.65 5 38.16 4 61.84 7 16 5
2017 4.90 1 39.92 3 60.08 8 12 1
Source: Complied and Computed from Capitaline Corporate Database, Capital Market Publishers (India) Ltd., Mumbai
© 2020 JETIR July 2020, Volume 7, Issue 7 www.jetir.org (ISSN-2349-5162)
JETIR2007401 Journal of Emerging Technologies and Innovative Research (JETIR) www.jetir.org 822
Ultratech Cement Ltd.
Year Working Capital to Inventory to Liquid Resources to Total Ultimate
Current Assets Ratio Current Assets Current Assets Ranks Rank
Ratio Ratio (A+B+C)
(%) Rank(A) (%) Rank(B) (%) Rank(C)
2008 -46.66 9 49.13 6 50.87 5 20 9
2009 -37.00 2 45.16 9 54.84 2 13 2
2010 39.71 1 46.76 8 53.24 3 12 1
2011 -44.15 7 50.44 4 49.56 7 18 7
2012 -44.65 8 55.81 1 44.19 10 19 8
2013 -40.02 5 54.08 2 45.92 9 16 5
2014 -39.54 4 48.90 7 51.10 4 15 4
2015 -41.38 6 50.12 5 49.88 6 17 6
2016 -39.03 3 44.82 10 55.18 1 14 3
2017 -66.22 10 52.10 3 47.90 8 21 10
Source: Complied and Computed from Capitaline Corporate Database, Capital Market Publishers (India) Ltd., Mumbai
© 2020 JETIR July 2020, Volume 7, Issue 7 www.jetir.org (ISSN-2349-5162)
JETIR2007401 Journal of Emerging Technologies and Innovative Research (JETIR) www.jetir.org 823
Table III: Analysis of Rank Correlation between liquidity and Profitability of selected companies.
Year ACC Ltd. Ambuja Cement Ltd. India Cement ltd. Ultratech Cement ltd.
Current Return on Current Return on Current Return on Current Return on
Assets to Capital Assets to Capital Assets to Capital Assets to Capital
total Assets employed total Assets employed total Assets employed total Assets Employed Ratio Ratio Ratio Ratio
(%) Rank (%) Rank (%) Rank (%) Rank (%) Rank (%) Rank (%) Rank (%)
Rank
2008 47.34 3 41.30 2 27.03 10 34.10 2 46.28 1 7.19 7 31.02 1 14.75 8
2009 49.41 2 42.13 1 31.80 8 42.49 1 40.25 4 21.10 2 28.73 3 42.96 1
2010 51.01 1 36.00 4 39.24 6 30.75 3 41.88 3 24.36 1 29.39 2 40.86 2
2011 34.27 6 39.67 3 29.82 9 29.00 4 38.15 5 18.02 3 23.89 6 29.21 3
2012 39.37 5 22.37 5 42.40 3 24.39 6 42.19 2 12.72 4 23.70 7 28.53 4
2013 40.10 4 21.56 7 42.94 1 22.60 7 16.17 10 3.41 10 24.26 5 19.45 7
2014 30.77 7 22.33 6 42.06 4 25.66 5 17.12 9 10.54 5 24.30 4 22.56 5
2015 30.14 8 16.77 8 40.27 5 17.13 9 20.05 7 8.38 6 22.57 9 21.29 6
2016 28.37 9 14.93 9 38.61 7 18.72 8 19.98 8 4.37 9 23.55 8 14.32 9
2017 25.23 10 11.95 10 42.67 2 11.11 10 22.14 6 6.78 8 19.98 10 12.83 10
Rank correlation between liquidity Rank correlation between liquidity Rank correlation between liquidity Rank correlation between liquidity a
and profitability is 0.818 being and profitability is -0.661 being and profitability is 0.552 being profitability is 0.479 being insignific
significant at 0.05 level. significant at 0.05 level. insignificant at 0.05 level. at 0.05 level.
Source: Complied and Computed from Capitaline Corporate Database, Capital Market Publishers (India) Ltd., Mumbai
© 2020 JETIR July 2020, Volume 7, Issue 7 www.jetir.org (ISSN-2349-5162)
JETIR2007401 Journal of Emerging Technologies and Innovative Research (JETIR) www.jetir.org 824
Suggestions:
1. In order to eliminate working capital deficit ACC Ltd., India Cement Ltd. and Ultratech Cement Ltd. should always maintain an adequate amount of short term funds.
2. Investment in current assets, particularly in Ultratech Cement Ltd. should be increases for working
capital management.
3. The inventory of slow moving item should be reduced to a minimum possible extent and also appropriate
proforma showing the position of various components of inventory at periodical intervals should be introduced so as to exercise an effective control on the overall inventory.
4. The overall liquidity, specifically in case of Ultratech cement Ltd. should be managed in such a way that
not only it should not hamper profitability but also its contribution towards increase in profitability should
be positive.
References:
◊ sandhar, S. K. and janglani, S. (2013): “A Study on Liquidity and Profitability of selected Indian Cement Companies: A Regression Modeling Approach”, International journal of Economics, Commerce and Management, Vol. 1 No. 1, pp. 1-24. ◊ Basu, S.N. (1992): “Workinh Capital Management – Tyre companies” The Management Accountant , Vol 27 No 5, Calcutta, p 332. ◊ Bhunia, A. (2010): “A study of Liquidity Trends in Private Sector Steel Companies in India”, Asian Journal of Management Research, pp. 618-628. ◊ Sur, D. (1997): “Working Capital Management in Colgate Palmolive (India) Ltd.: A Case Study”, The Management Accountant, Vol. 32 No. 11, pp. 828-833. ◊ Sur, D. (1999): Liquidity Management : A case study of Tata Tea Ltd.” accepted for publication in Dr. P Mohan Rao’s edited book on various aspects of Financial Management. ◊ Bhunia, A. (2010): “A study of Liquidity Trends in Private Sector Steel Companies in India”, Asian Journal of Management Research, pp. 618-628. ◊ Drucker, P.F ( 1980): “ Managing in Turbulent Times” , new York , p 13. ◊ Bagchi, B., Chakrabarti, J. and Basu Roy, P. (2012): “Influence of Working Capital Management on Profitability: A Study on Indian FMCG Companies”, International Journal of Business and Management, Vol. 7 No. 22, pp. 1-10.