Embed Size (px)
Citation preview
i
Liquid Milk and Feed Value Chain Analysis in Wolmera District, Ethiopia
Holeta Agricultural ResearchCenter
June 1, 2012
Getu Kitaw, Liyusew Ayalew, Fekede Feyisa and Gezahegn Kebede
Table of Contents1. Introduction............................................................................................................................................1
1.1. Study objectives.............................................................................................................................2
1.2. Methodology..................................................................................................................................2
1.2.1. The study areas......................................................................................................................2
1.2.2. Method of data collection and source of data........................................................................2
1.2.3. Method of data analysis.........................................................................................................3
1.2.4. Conceptual framework...........................................................................................................3
2. Results of value chain analysis for liquid milk and feed.......................................................................5
2.1. Mapping core functions and actors of value chain for fluid milk..................................................5
2.1.1. Dairy inputs/ services supplies...............................................................................................6
2.1.2. Production..............................................................................................................................6
2.1.3. Marketing...............................................................................................................................7
2.2.1. Feed Input Supply................................................................................................................10
2.2.2. Feed Production...................................................................................................................11
2.2.3. Feed Processing...................................................................................................................11
2.2.4. Feed Marketing....................................................................................................................12
2.3. Marketing channels for liquid milk and dairy feed......................................................................14
2.3.1. Marketing channels for fluid milk.......................................................................................15
2.3.2. Marketing channels for feed................................................................................................17
3. Constraints, opportunities and intervention strategies along the liquid milk and feed value chains...18
3.1. Constraints along the liquid milk value chain..............................................................................18
3.1.1. Constraints in input supply system......................................................................................18
3.1.2. Constraints at production stage............................................................................................19
3.1.3. Constraints at processing stage............................................................................................19
3.1.4. Constraints in marketing......................................................................................................19
3.1.5. Constraints at consumption stage.........................................................................................19
3.2. Major opportunities in the liquid milk value chain......................................................................20
3.3. Proposed intervention strategies for liquid milk value chain analysis.........................................20
3.4. Constraints in the feed value chain..............................................................................................21
3.4.1. Constraints in input supply system......................................................................................21
3.4.2. Constraints at production stage............................................................................................21
3.4.3. Constraints at processing stage............................................................................................21
ii
Holeta Agricultural ResearchCenter
June 1, 2012
Getu Kitaw, Liyusew Ayalew, Fekede Feyisa and Gezahegn Kebede
3.4.4. Constraints in marketing......................................................................................................21
3.4.5. Constraints at consumption stage.........................................................................................22
3.5. Major opportunities in the feed value chain................................................................................22
3.6. Proposed intervention strategies for feed value chain.................................................................22
4. Lessons learned and comments on the VCA tools...............................................................................23
4.1. Lessons learned............................................................................................................................23
4.2. Areas of improvement for VCA tool...........................................................................................23
5. Conclusions and Recommendations....................................................................................................24
6. References............................................................................................................................................24
List of Figures
Figure 1: Value chain Functions....................................................................................................................4Figure 2: Value chain actors and support framework....................................................................................4Fig. 3 Core functions and associated activities for liquid milk value chain..................................................5Fig. 4 Monthly milk price variations among major actors for the district.....................................................7Figure 5: Marketing outlet for liquid milk....................................................................................................9Figure 6: Core functions and associated activities for feed value chain in the district..............................10Figure 7: Annual mixed animal feed supply................................................................................................12Figure 8: Monthly price variations for major feeds available in the district...............................................13Figure 9: Marketing channel for liquid milk value chain............................................................................17Figure 10: Marketing channels for feed value chain.................................................................................18
iii

1. IntroductionEthiopia has a huge untapped potential for market-oriented development of smallholder dairy production. The population of milking cows in the country is estimated at 9.9 million heads (CSA, 2008) although the majority of these fulfill multiple functions besides dairy production. The agro-ecology, particularly of the Ethiopian highland mixed crop–livestock systems, is considered conducive and relatively disease-free to support crossbred dairy cattle (Ahmed et al. 2004). Livestock currently support and sustain livelihoods for 80% of all rural poor. Female cattle constitute about 55.48% of the national herd. Of the total female cattle population, dairy
and milking cows total 16,941,361, 14.24% dairy cows (cow of any breed kept primarily for
milking purposes) and 20.12% milking cows (cow of any breed which has been milked but not necessarly been kept for milking purposes (CSA, 2008). Eighty-three percent of all milk produced in Ethiopia comes from cattle with the remainder coming from goats and camels (MoARD, 2007). Ethiopia produces approximately 3.2 billion liters per year from 10 million milking cows. The farm-level value of the milk is an estimated 16 billion Ethiopian Birr per year.
On the other hand, the dairy sub-sector is currently facing a number of problems that have persisted for decades. Productivity of the dairy herd is low (1.3 l – 1.54 l per cow per day) with an average lactation period of 180 – 210 days (CSA, 2008). The population of exotic and crossbred dairy cows accounted for less than 1% of the total dairy cattle. High mortality rates occur due to poor nutrition which makes cattle vulnerable to disease. Producers in the rural areas lack access to markets and extension services which reduces the ability of smallholder producers to be competitive. Feed production and distribution is not coordinated. Only 0.15% of rural livestock holders are involved in an on-farm production of improved forages like alfalfa and Napier grass (Tefera, 2010); the use of industrial by-products like oil cake, bran, and brewery residue is negligible (0.8%) (Tefera, 2010). Moreover, market-orientation of the production systems and the possibility of exporting Ethiopian dairy products are limited by high transaction costs despite low costs of production (Ahmed et al. 2004). Development of a vertically integrated and coordinated milk value chain is thus an important option to reduce operational and transaction costs to meet consumers’ demand and to encourage partnerships along the chain (Costales et al. 2006). There is a serious concern, however, that smallholder agricultural producers are often excluded from participation in value chain since they usually lack access to credit, make limited investment in their human capital (including skills and entrepreneurship training), and are isolated by physical distance from the market (Mendoza and Thelen, 2008). At least two sets of factors underlie the need for understanding the Ethiopian dairy and feed value chain study and its role in improving productivity and market orientation of smallholder dairy production. First, empirical evidence shows that Ethiopian dairy subsector has not been able to take-off despite decades of research and development efforts (Ahmed et al. 2004; Staal et al. 2008). Secondly, the national agenda and aspirations for agriculture and rural development, resource-base (land, water and feed), market demand (reliability of supply, quality and safety) and the number and diversity of actors (public, private and civil societies) involved in the dairy subsector are changing. In this regard, Wolmera woreda* is a case in point in that although local cattle are the pre-dominant breeds reared, market-oriented dairy production based on crossbred dairy cows (ranging from 5 to 10% coverage) is also flourishing in the rural, peri-urban and urban parts of the district. Wolmera is among the highland areas categorized under the
1

*A woreda is equivalent to a district, managed by a local government.
Addis Ababa dairy milk shed due to its comparative potential for improved dairy cattle production and its proximity to the large consumer base in Addis Ababa. Currently the role of government and its share in milk marketing has reduced following establishment of dairy cooperatives and private dairy enterprises. Dairy development endeavors are in general very fragmented and lack a focus on market orientation and a value chain perspective. Information on what opportunities and constraints are available for research and development endeavors in the dairy and feed value chain are critically missing in the district.
1.1. Study objectives
This paper reports an analysis of the fluid milk and feed value chains conducted in Wolmerawera. The specific objectives of the study were:
(a) To understand the core functions and major actors involved in each value chain;(b) To identify major constraints and opportunities in each value chain;(c) To test and further refine the VCA tool for wider scale use in the future.
1.2. Methodology
1.2.1. The study areasThis study was conducted in Wolmera woreda located in Special Zone* of Oromia Regional State in the central highlands of Ethiopia. It is found some 30 km west of the capital on the main road to Ambo. The area receives an average annual rainfall of around 1100 mm, more than 85% of which falls in the main rainy season (June to September). The altitude of the area ranges from 2200 – 2600 m above sea level (a.s.l), and the average annual temperature ranges from 6 - 21C. The major crops grown include teff (Eragrostis tef), wheat, barley and faba bean. The woreda is characterized by a crop-livestock mixed farming system in which livestock in general and dairy production in particular contribute significantly to livelihoods.
1.2.2. Method of data collection and source of dataBoth primary and secondary data were used in this study. A combination of different techniques was applied to collect the data required to analyze the dairy and feed value chains in Wolmera woreda. Participatory rural appraisal (PRA) tools, focused group discussion (FGD), key informant interview (KII) and visual observation were used to collect primary data. Secondary data were collected from different woreda offices, Central Statistical Authority (CSA) and Holeta Research Center. Relevant literature and documents were also reviewed to provide theoretical background. Each of the tools used for data collection are described below:
2
*This is a registered zone under Oromia Regional State. It includes all woreda’s with in close proximity around the capital Addis.
3

1.2.2.1. Focused Group discussion (FGD)
For the PRA study, two villages (Robe Gebeya and Wolmera choke) with potential for dairy production were purposively selected from Wolmera district in collaboration with livestock experts and development agents from the district and the local Bureau of Agriculture. A focused group discussion was carried out with a group of 13 smallholder dairy farmers (8 males, 5 females) in each village. These farmers own crossbred dairy cattle and were supplying milk to the market.
1.1.2.2. Key Informant InterviewsThe key informants identified for this study were livestock extension experts from the Cooperative Promotion Office, leaders of primary cooperatives and unions, milk collectors, milk processing plants, livestock researchers, transporters, veterinarians and staff of NGOs. The key informant interviews (KII) were carried out with 4 milk collectors, 4 retailers, 2 processors and 10 consumers, 13 cooperatives (488 males and 210 female members) and a union, 1 extension agent and 1 expert in the study areas. Rapid market appraisal was conducted to map core functions and actors involved in the fluid milk and feed value chain. A desk review of relevant literature was also carried out.
1.1.3. Method of data analysisThe data collected from the field through FGD, KII and personal observations were analyzed using a thematic analysis approach. Quantitative data were analyzed using the descriptive statistical analysis techniques to calculate the distribution of costs and margins along fluid milk and feed value chains.
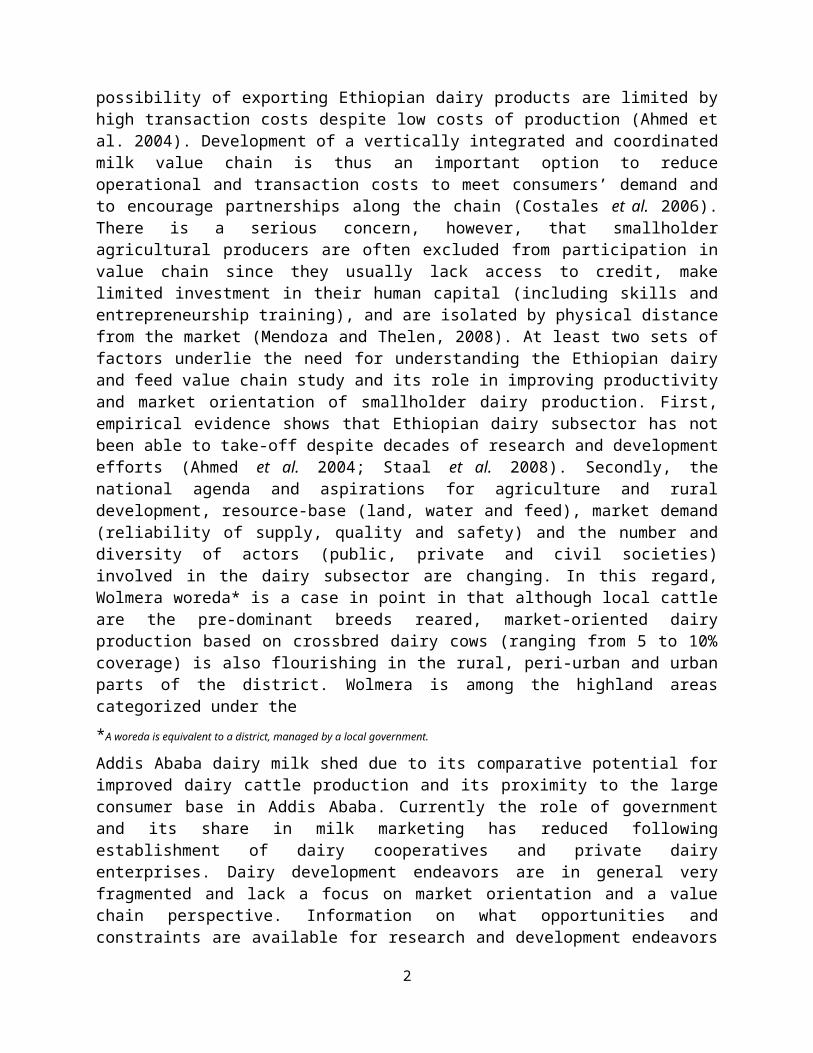
1.1.4. Conceptual frameworkValue chain encompasses the full range of activities and services required to bring a product or service from its conception to sale in its final markets—whether local, national, regional or global (Campbell, 2008). Value chains include input suppliers, producers, processors and buyers. Value chains include process actors like input suppliers, producers, processors, traders and consumers. At one end are the producers – the farmers who grow the crops and raise the animals. At the other end are consumers who eat, drink and wear the final products. In the middle are many individuals and firms, each performing one small step in the chain: transporting, processing, storing, selling, buying, packaging, checking, monitoring, making decisions, etc. The value chain also includes a range of services needed maintain its function including technical support (extension), business enabling and financial services, innovation and communication and information brokering. The value chain actors and service providers interact in different ways starting from local to national and international levels.
The multitudes of functions that are performed to produce goods and make them available for the consumers are also expressed in the concept of market chain. The market chain refers to the system that consists of actors and organizations, relations, functions, and product, cash and value flows that make possible the transfer of goods or services from the producer to the final consumer. Figure 1 shows the value chain of functions.
4

Global Retailers
Exporters
Processors
Producers
Input suppliers
National Retailers
Wholesalers
Supporting Market
Cross cutting providers
Sector specific providers
Financial providers
Figure 1: Value chain Functions (Bezabih Emana, 2010)
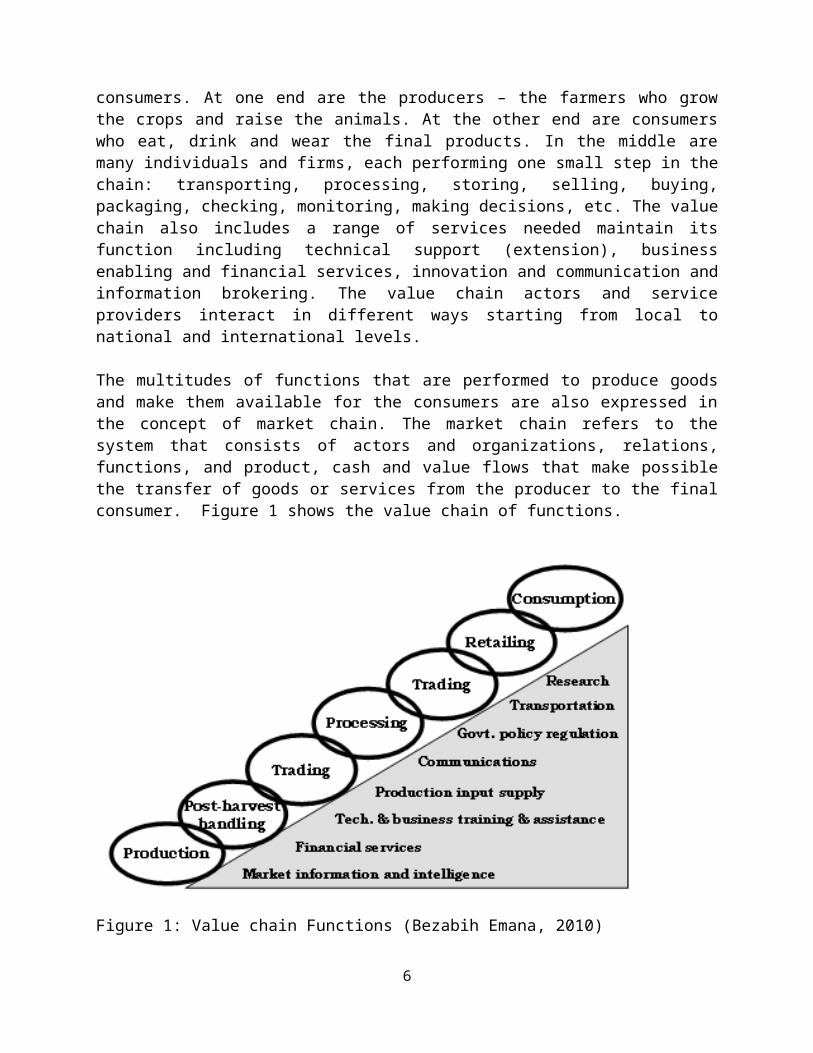
Thus the value chain includes direct actors who are commercially involved in the chain (producers, traders, retailers, consumers) and indirect actors who provide services or support for the functioning of value chain. Figure 2 illustrates the general framework for value chain actors and support system.
Figure 2: Value chain actors and support framework
5

The chains can be simple when producers directly sell to the consumers but long and complex when other actors play roles in buying, processing, transporting and selling to the end user, the consumer. The complex chain, however, offers a multitude of choice to farmers. They may choose to supply a specific market segment, and produce the crop or animal product that is tailored to that segment. They may also try to process their produce to add value to it: they may dry chilies rather than selling them fresh, or they may make cheese rather than selling the unprocessed milk or cook rather than selling raw grain. Farmers need to understand the players in the chain and the requirements of the different branches so that they can supply the product which that branch requires. That will increase their bargaining power in the chain, and improve the price they get for their product. This in turn increases farmers’ comparative advantage by increasing the volume of supply, quality of the product and consistency of supply, which is often possible when farmers act as a group.
2. Results of value chain analysis for liquid milk and feedIn the study area the main actors in the dairy industry are the milk/dairy producers, collectors (cooperatives, unions, private traders and factory collection units) and dairy processors. Most of the milk comes from urban and peri-urban dairy farmers channeled through cooperatives, unions and collectors. Some of the processors are directly collecting from farmers. Currently all dairy farms and processors are privately owned. The main distribution channels to end users are supermarkets, shops, kiosks, restaurants and other outlets. The major product in the sector is liquid milk, and majority of the milk is channeled through the informal market (unpasteurized). When it comes to the feed value chain there is no well-structured and organized marketing channel similar to that for milk. The main actors are limited in number and include producers, collectors (cooperatives, unions, private traders) and feed processors. Most of the roughage feeds come from farmers’ grazing plots and enclosures from government institutions while concentrate feeds are accessed from either local processing units or small retailers (unions, small kiosks, shops etc.).
6
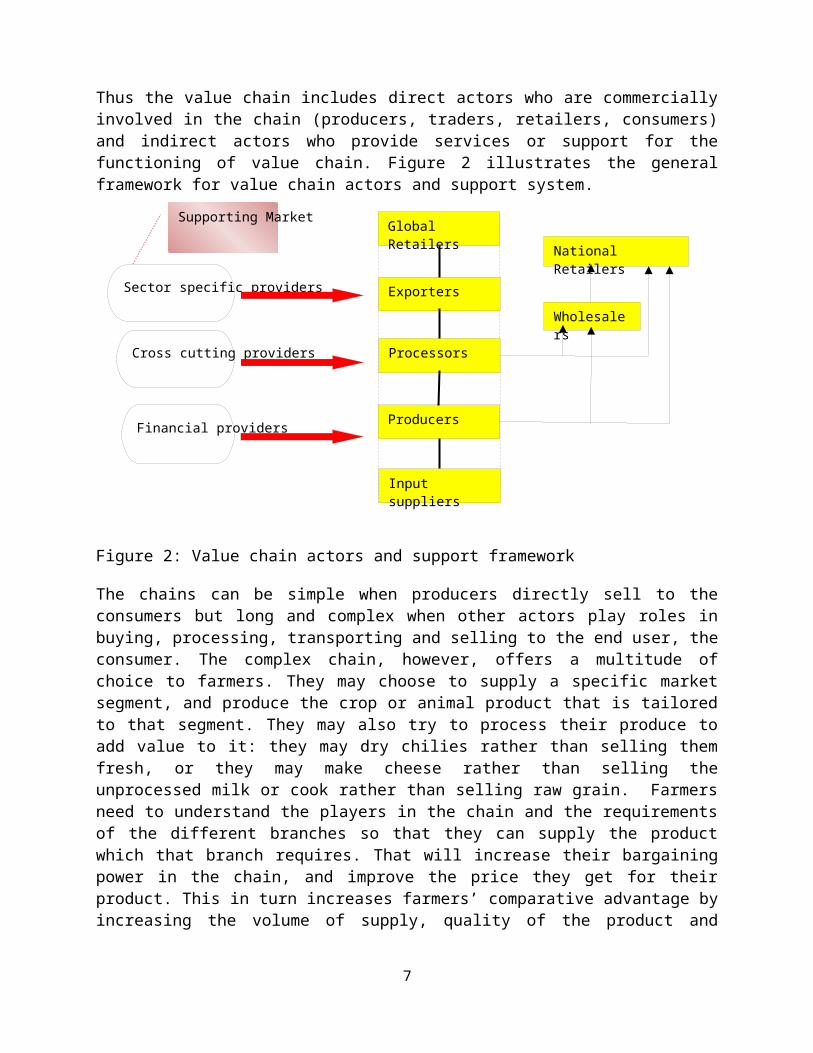
Mapping core functions and actors of value chain for fluid milk
Supply of:- Semen- Bulls- Feed
ingredients- Land- Labor- Seed andVet drugs
-cow rearing-feeding-Milking
- Collection- Refrigeration-transportation
-Delivery to processors
- Milk chilling- Pasteurization- Packaging- Products
making- Quality
assessment
- Selling- Transporting- Quality
assessment
- Quality assessment
Fig. 3 Core functions and associated activities for liquid milk value chain in the study area
2.1.2. Dairy inputs/ services supplies
2.1.2.2. AI ServicesWhile AI service is delivered by the government National Artificial Insemination Center (NAIC), natural service is provided by bulls owned by individual farmers in the district who charge little or nothing. The proportion of farmers currently getting AI and bull services in Robe Gebeya and Wolmera Choke vary from one village to the other the range being 7% - 25% (Robe Gebeya) and 1% - 10% (Wolmera Choke).
2.1.2.3. Feed supplyCurrently there are four feed suppliers in the district: Lame/Sholla Dairy, the union and two individual traders. As a source of basal feed resources 90% of the smallholder producers in the district use hay. In addition 71% of these producers conserve crop residues to use it as dry season supplementary basal diet. Grazing is, however, practiced only by 34.1% of the producers. 83% of the producers supplement dairy cows. Feed prices have increased considerably in recent years (hay 25-45birr/bale; balanced concentrates 300-480birr/quintal; Noug seed cake 380-650birr/quintal; wheat bran 260-350birr/quintal; molasses 0.28-2.00birr/kg) and this was referred to as a major factor destabilizing milk prices.
2.1.2.4. Veterinary ServicesVeterinary services in most cases are supplied by the government extension service. Private veterinary services are available to peri-urban and urban commercial dairy farms. Veterinary service is the least commercialized among inputs of dairying with provisions limited to drug vending. Government veterinary services were rated inadequate and with limited resources (human and logistics). On the other hand, service from private veterinarians is expensive and with limited outreach.
7
Input Supply Production Raw milk marketing
Processing Retailing Consumption
2.1.2.5. Credit Credit is an important input for livestock production but is completely absent in some villages of the district while still in others government and non-government micro finance institutions are operating to a limited extent and capacity in the district. Government micro-finance institutions such as Oromia Credit and Saving Share company and special savings and credit associations provide credit to some 35% of the producers in the area. A non-governmental micro-finance institution called Africa Village is in its infancy and hence has not started its service.
2.1.3. ProductionAverage dairy herd size at household level lies in the range of 5-8 animals per household. The district herd is increasing since the number of households with new families starting dairying is increasing. The trend at household level is, however, decreasing for a number of reasons. These include introduction of improved breeds, dwindling grazing lands, rapidly increasing prices for both roughages and concentrates, lack of adequate veterinary services. The volume of milk produced by a crossbred cow is between 3 - 20 litre/day (avg. 11.9 liter) of which 68% to 70% is meant for market while around 15% is processed into butter and cheese. The rest of the milk that is close to 15% of the daily produce will be used for household consumption. The amount of milk consumed by the calf was not included since the majority of our respondents were using natural suckling rather than bucket feeding. For local cows the average daily milk production ranges between 1-7litre/day (average 2.65litres). There is, however, seasonal variation in milk production, the lowest being between February and May and the highest between October and December. On the other hand, average lactation length for local cows was 6 months while for crosses it was recorded to be 9 months. At times when the milk is not used for processing, it can alternatively be used for household consumption. Around 15% of milk is used for bucket feeding of the calves until the age of weaning (3-4 months). A small proportion of the producers, however, process the milk from local cows to butter and cheese (0.5 kg butter/week per household) for sale to local markets. As far as breed composition is concerned, the majority of the producers use both breed types: local breeds account for 95% of the herd, while the share of crossbreds in the mix was estimated at 5% on average. Milk producers in most instances use their own and purchased feed in addition to improved forages although the latter are used to a very limited extent.
2.1.4. MarketingThis involves the whole marketing process including major actors beginning with collection of milk from producers to retailing by traders, primary coops, unions, processors and consumers. Milk buying and selling price per liter varies among the different actors, across season of the year and in line with the prevailing feed cost. In general it ranges between 6.6-9.0 birr per litre for buying, the maximum price being offered by individual traders. Selling price is also determined by the type of actor buying the milk. It, however, ranges between 10 – 15 birr per litre in the terminal market. Both buying and selling can be done either on a credit or cash basis on a pre-agreed informal or formal contract. All actors engaged in milk collection and processing conduct at least one or more types of milk quality analysis (adulteration test, microbial contamination test and milk compositional test) during the buying and selling process. While traders and unions do not have cooling refrigerators on their collection trucks, processors most often do.
8

January
February
March
AprilMay June
JulyAuges
t
Septem
ber
October
November
December
0
5
10
15
20
25
Monthly milk price variations among major actors (Birr/litre)
Union price/lt
Individual collectors price/lt
Retailers price/lt
Processors price/lt
Month
Price/lt
Fig. 4 Monthly milk purchase price variations among major actors for Wolmera district
The liquid milk value chain in the district involves the following major actors.
2.1.4.2. CollectorsMajor milk value chain actors in the district are retailers (small and large retailers), unions and small and large processors operating in and around Addis Ababa. The volume of milk collected daily is >2000 litre by processors (Sholla and Mama), ~2000 litre by cooperatives and union (Biftu Berga production and marketing union) and ~500 litre by individual collectors. Collection is done twice a day after quality tests using lactometer and alcohol tests. Milk production reaches a peak during the main rainy season which extends from mid-June to early-October. There are 13 active cooperatives under Bifitu Berga Dairy union (488 male and 210 female members) at Holetta.
As far as milk price setting is concerned there is some negotiation and legal agreement in most cases but this does not include producers. Quality-based payment is only practiced by one processor (Mama additionally paying 1-2 birr/liter depending on quality) leading to unhealthy competition among collectors where one accepts what the other rejects for inferior quality. Payment is made either every 2 weeks or sometimes on monthly basis. Milk collection and distribution prices increase on average by 10% each year. Producers sell milk at 6.60 birr/liter to the union, 6.75 birr/liter to Mama and 7-9 birr/liter to other individual collectors at Holetta.
2.1.4.3. ProcessorsTwo small-scale (union and one individual collector) and two large-scale dairy processors are currently operating in the district and in and around Addis. The range of products sold ranges from two (butter and yogurt) in small-scale processors to 32 in large-scale processors like Mama. Most of the processors operate under-capacity (40% gap between installed and attained capacities) because of shortage of the required quality raw milk. Processing is limited to production of non-concentrated and short shelf-life products.
9
2.1.4.4. Retailers In Wolmera district there are a few small capacity emerging supermarkets (not more than five), cafés and restaurants where a limited range of dairy products (powdered milk and hard cheeses) are sold. Fluid raw milk and yogurt are accessed from small tea houses and some hotels. Traditional butter is found in almost all general shops and is usually highly adulterated with cheaply purchased non-animal butter sources, palm oil and banana extracts. . Fluid milk is not widely consumed by the general population on a regular basis. Most people use the majority of milk in tea/coffee and for feeding infants, the elderly and/or the infirm. The most widely consumed dairy products are butter, cheese and fermented milk. Close to 70% of the milk produced is sold in the market. The margins on fluid milk are 10-15% and on cheese and yoghurt the range is 25-35%. The retail price for a litre of fluid milk ranges from ETB 9.80 to ETB 11.00. Milk powder has apparently lost market share, as some retailers no longer stock it as they did in previous years. The perception is that milk powder is for infants.
Consumers still voice quality concerns at the retail level and continue to boil fluid milk prior to consumption. Fasting periods of the Ethiopian Orthodox Church have a significant impact on the demand for milk. However, there is evidence that the impact is not as large as perceived before. Processors of milk report that the decline in consumer demand is seen most predominantly during the 15 day fasting period in August, accounting for a 25-27% decrease, followed by the 55 day Great Lent period in March/April with a 25% decrease. The fasting period preceding Christmas in December accounts for less than a 15% decrease. Processors report that during fasting periods they are more likely to produce cheese and butter which can be stored until the end of the fasting period.
2.1.4.5. ConsumersA group discussion was held among 10 randomly selected urban consumers found in the district. In almost all urban households, respondents indicated that they buy raw unpasteurized milk on a daily basis from collectors or urban smallholders, mainly for their kids. It is common to substitute human breast milk with cow milk when the breast dries up and mothers are back to work. Because of price, sustainable supply and the perception that pasteurized milk has certain fats extracted, most household buyers are inclined to unpasteurized raw milk. There are a large number of cafes, kiosks and restaurants in all towns. Hot milk and macchiato (mix of coffee and milk) are the popular drinks which trigger demand for milk by cafes and restaurants. Kiosks and retailing shops are selling packed milks to household buyers. Butter, cheese and yoghurts are solely sold at supermarkets. Cheese is often sold at shops on the eve of holidays. Because raw milk cannot easily been accessed, some cafes and restaurants use powdered milk for hot milk and macchiato although these are less preferred by consumers. More market promotion work has to be done since public awareness about the use of powdered milk is still in its infancy in the district in particular and in the country in general. Market outlets for fresh milk include; producers’ farm gate (32%), home delivery by producers (28%), and milk shops (12%). These channels are preferred by consumers because of their trustworthiness for supplying better quality and safe milk their proximity to consumer residences and nature of payment for milk. Payment for milk is mostly in cash for single purchases and on a credit basis when a formal contract has been arranged. Pasteurized milk is currently sold for 15.60 – 20.34 birr/liter; supermarkets sell at higher prices. Even though there exists high disparity among actors in terms of selling prices consumers are currently buying the raw milk at 9.80-11 birr/liter.
10
Figure 5: Percentage of liquid milk being sold through different marketing outlets in and around Addis Ababa milk shed. (Source: Firew Kassa et al., Personal communication)
Mapping core functions and actors of the feed value chain
Retailing
Supply of:- Seed and
fertilizers- Supply of
wheat, linseed, noug, cotton seed
- Supply of land and labor
- land preparation
-planting
- weeding
harvesting
- Baling
- Stacking
- Storage
- Grinding/crushing
- Mixing
- Branding
- Packaging
- Transportation
- Storage
- Retailing
- Distribution
- Quality assessment
- Feed Formulation
- Treatment
- Supplementation
- Feeding
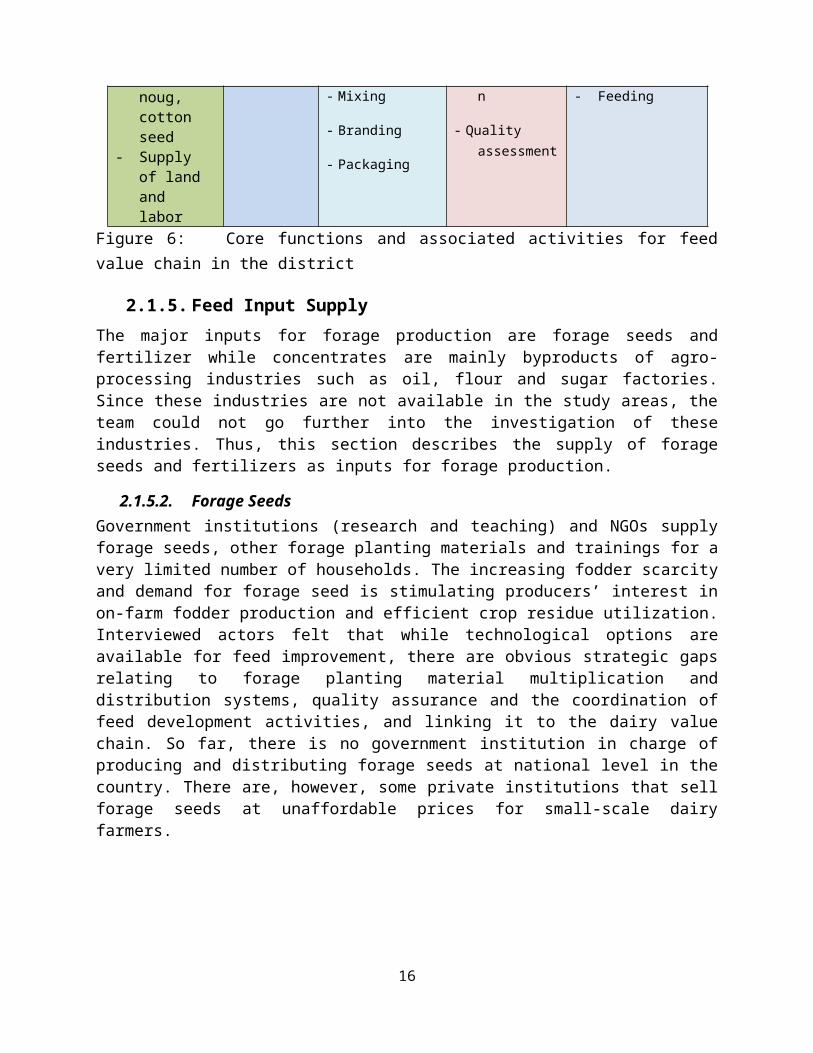
Figure 6: Core functions and associated activities for feed value chain in the district
2.1.5. Feed Input SupplyThe major inputs for forage production are forage seeds and fertilizer while concentrates are mainly byproducts of agro-processing industries such as oil, flour and sugar factories. Since these industries are not available in the study areas, the team could not go further into the investigation of these industries. Thus, this section describes the supply of forage seeds and fertilizers as inputs for forage production.
11
Input Supply Production Marketing Processing Consumption

2.1.5.2. Forage SeedsGovernment institutions (research and teaching) and NGOs supply forage seeds, other forage planting materials and trainings for a very limited number of households. The increasing fodder scarcity and demand for forage seed is stimulating producers’ interest in on-farm fodder production and efficient crop residue utilization. Interviewed actors felt that while technological options are available for feed improvement, there are obvious strategic gaps relating to forage planting material multiplication and distribution systems, quality assurance and the coordination of feed development activities, and linking it to the dairy value chain. So far, there is no government institution in charge of producing and distributing forage seeds at national level in the country. There are, however, some private institutions that sell forage seeds at unaffordable prices for small-scale dairy farmers.
2.1.5.3. FertilizerIn places/villages where cooperatives have been successfully established, the inputs they are delivering thus far are limited to feed (very rarely) and fertilizers. Fertilizer application to a natural pasture and/or a forage crop is not common practice at farm level. Two reasons for this are the cost of fertilizer and the perception of farmers. Farmers perceive that cultivated forage crops like oat and vetch do not require commercial fertilizers. Moreover, since most of the farmers use rented pasture land, they do not want to apply fertilizer for their temporary utilization of the land. A few of the interviewed farmers, however, indicated that they occasionally utilize composted manure on their pasture land although the rate and amount of application is unknown.
2.1.6. Feed ProductionAllocation of land for improved forage production is not a common practice, with land shortage being the main reason. Those farmers who are producing oat-vetch mixture and backyard forages (Napier grass, alfalfa, fodder beet, tree lucerne) on average allocate 0.25 ha for this purpose. The forages are mostly produced for feeding to their own livestock and are not meant for sale, an exception being the sale of seed for feed oats. Forage trees are also effective forages; however, only tagasaste is adapted and found in the district. Less than 1% of the producers reported on-farm production of improved forages such as Napier grass and alfalfa. The problem with production of improved forages is more intense among the smallholders with limited land holdings. The smallholders for their basal feed requirement use private, communal/ government grazing and agricultural lands for aftermath grazing. Additionally, green fodders are used through the cut-and-carry system during the rainy season followed by crop residue and hay. Natural pasture hay is the basal feed for dairy in the study area. Quality depends upon early harvest, proper drying and storing. Improper and under-managed forage-producing lands limit smallholders’ production potential, even in commercial systems. Almost all producers use crop residues but more goes to the feeding of oxen and local cattle. Common crop residues available to dairy farmers are straw from teff, wheat, barley, oat, grass pea and field beans. Farmers prefer barley straw although teff straw is desired because of its high palatability and digestibility. Oilseed cakes are purchased from suppliers in 25 kg or 50 kg sacks. In general, the current volume of produce for major agro-industrial by-products such as wheat bran and oilseed cake are not on par with the demand for the products.
12
2.1.7. Feed ProcessingThere are no feed processing plants around Wolmera district implying that most of the concentrates sold by retailers in small shops are purchased from feed processing plants located in and around Addis. The current volumes of wheat bran and oilseed cake available do not meet demand. There are 15 commercial livestock feed manufacturers in Ethiopia. However, 10 of these manufacturers produce feed primarily for their own use such as in feedlots and they only sell to farmers when there is excess production. The five commercial manufacturers supply feed directly to livestock and poultry farmers or groups of farmers including cooperatives. They all report a shortage of ingredients for feed formulation. Common ingredients are corn, wheat screenings, wheat bran, linseed cake, noug seed cake, limestone, salt and premixes.
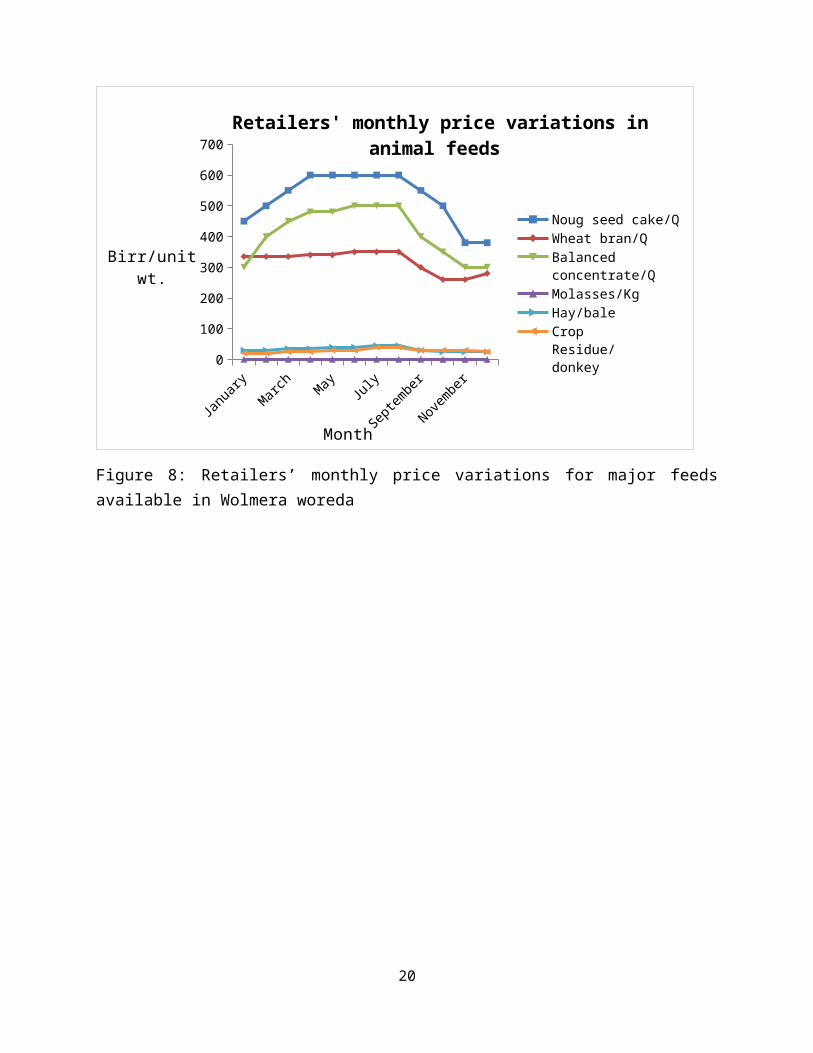
2.1.8. Feed MarketingIn most cases, improved forages except the seeds are meant to be produced for consumption by farmers’ own animals. Oat grains and surplus hay as a standing crop or as baled hay (for those which can afford to pay the rent for the baler) may sometimes be sold to seed agency (in the case of oat grain), among themselves in villages and traders in nearby market places. The trend of sale prices of baled hay shows high seasonal variability in a year. Prices are low after harvest, i.e. 17-20 birr/bale (November to December), and then rise to 20-30birr/bale (February to April) finally reaching 40-45 birr/bale between May and August. On the contrary, conserved hay, be it in heaps or bales is sold to traders and among themselves when marketed surplus is completely exhausted during the months of June, July and August.
Donkey loads, horse and oxen carts are usually used to transport forages to local markets at very little cost amounting 3 birr/bale (weighing 20-25kg) and/or 5birr/donkey. In most instances, however, it involves no cost since the forages are sold on-farm. Only 5% of the farmers in the district, with the majority of them being non-livestock owners, sell crop residues in villages or local markets. Since tef straw fetches a premium price when sold for construction purposes, only 20% of the farm yield is used for livestock feeding. The remaining tef straw is channeled to the market for sale to traders and individual users for construction and feed (to a limited extent) in June, July and August when the supply of crop residues is very scarce and the cost of purchase is very expensive. The selling price of crop residue follows same variability as for hay across the different seasons of the year. In general, price per donkey load is much lower after crop harvest i.e., December to February (20 birr/donkey load) and remains moderate between March to May (25 birr/donkey) and increases to 30-40 birr/donkey in June-August when most of the residue meant for feed is marketed. Straws other than tef are collected after harvest and usually conserved in stacks in an open air and/or under shade for dry season feeding. As far as purchasing is concerned it is a minor practice and peaks after crop harvest (December through January). Feed that would serve as an emergency diet will be purchased at any time of year to maintain animals until peak harvest.
Individual ingredients of a concentrate mix (wheat bran, noug seed cake/linseed cake, salt, etc.) or a formulated concentrate mix are purchased almost throughout the year from traders, unions and directly from the processors. High seasonal fluctuations determine the purchasing and buying prices of concentrates (except for molasses). Consequently, prices are lower during periods of crop harvesting and green forage availability (July to January) and costly during the dry season that extends from February to May. Information generated from discussion with
13
traders indicated that purchasing price per quintal of a balanced ration, noug seed cake, wheat bran and molasses varies between 300 to 500 birr, 380 to 650 birr, 260 to 340 birr and 28 to 70 birr respectively.
January
February
March
AprilMay June
JulyAuges
t
Septem
ber
October
November
December
0
100
200
300
400
500
600
700
Retailers' monthly price variations in animal feeds
Noug seed cake/Q
Wheat bran/Q
Balanced concentrate/Q
Molasses/Kg
Hay/bale
Crop Residue/donkey
Month
Birr/unit wt.
Figure 8: Retailers’ monthly price variations for major feeds available in Wolmera woreda
14
The feed value chain involves the following major actors.
2.1.8.2. Producers
Feed producers include smallholder farmers, government and religious institutions and small- and large-scale feed processing plants. The latter are engaged in concentrate feed production while the former are major roughage producers. The amount and quality of feed produced is lagging far behind the current market demand for both types of feeds. Land shortage, poor forage seed supply, poor knowledge/skill to produce, harvest and store improved forages and/or pasture, poor supply of raw materials for processing into concentrates (mismatch between grain production and population growth, whole grain/seed export) are some of the constraints affecting successful production of feeds in the district.
2.1.8.3. Cooperative/unionsThe role of coops/unions in the feed value chain is limited to collection and distribution of feeds purchased at a relatively lower price to member farmers in the district when feed shortages are encountered. One good example is Bifitu Berga Dairy union at Holetta. The union distributes hay, molasses and concentrate feeds at a very fair price (with addition of 10% commission on the original purchasing price) only in emergency cases to its member coops. This happens during the times of the year when extreme feed shortage is encountered by members in the unions. The union lacks the capital to buy and store sufficient feed and does not have land for feed production. There is, however, a plan to build a feed processing plant in the near future provided that adequate credit is secured for this purpose.
2.1.8.4. Wholesalers and retailersThese include individual traders, small-and large-scale retailers and wholesalers in the feed value chain. Most feed transactions are carried out by them since they have direct links to major feed processors and roughage producers. Some have facilities to store the feeds and sell when prices increase in the market. It is very difficult to know the exact number of small-scale retailers who own general shops and with no proper licensing in the district. They do not have properly ventilated feed stores and vehicles for transportation. They usually serve their customers with small amounts and types of feeds (wheat bran, noug seed cake and molasses) that are said to be highly adulterated. Wholesale feed suppliers are found in large cities around Addis Ababa and there are no traders in the district. Feed processing factories act as wholesalers and sell whatever amount of feed can be purchased on request at the factory gate price. Processors, as is the case for wholesalers and producers, complain about the short supply of raw materials and heavy taxation that has forced them to work below their designated capacity. Individual traders involve farmers in the urban and peri-urban areas that buy roughage feeds (hay and crop residues) and concentrate at peak harvest and sell at times when extreme feed shortages are encountered.
2.1.8.5. ConsumersConsumers are in general smallholder farmers, small- and large-scale commercial dairy and fattening farms and higher learning and research institutions. Most actors including the majority of commercial producers buy and store limited amounts of feed that do not even support the
15

year-round maintenance requirements of their animals. Moreover, the art of feeding, skilled labor and formulating rations are bottlenecks to producers in the district. Consumers complain that the feed market is not well governed through regulation and that price fluctuations beyond main crop and/or hay harvest seasons are, in practice, not well understood. The absence of a quality control system and feed grading, the lack of specialized and licensed feed retailing shops and high transportation costs together reduce the profit margin of producers is such that these days a significant number of dairy and fattening farmers are quitting the business in the district.
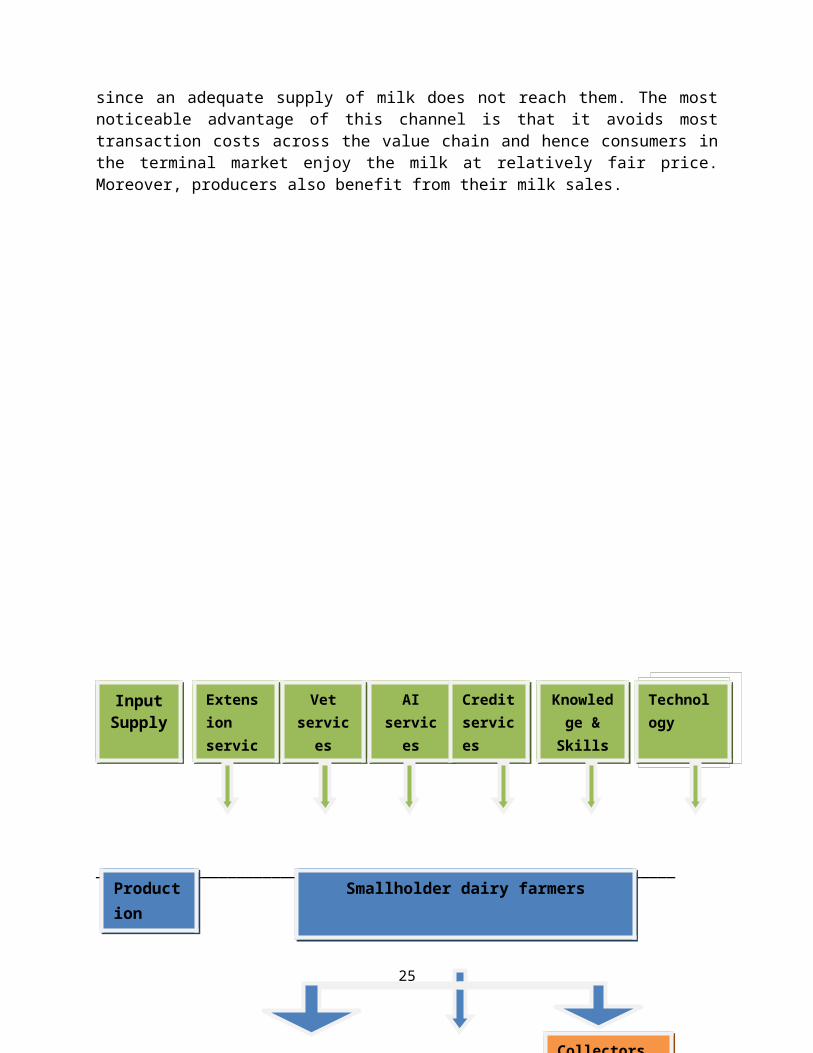
2.2. Marketing channels for liquid milk and dairy feedThe analysis of the fluid milk and feed marketing channels is assumed to provide a systematic knowledge of the flow of the products from their production areas to their final end-users. Marketing of milk and feed in the study areas starts with the collection of the products from production areas moving on to the terminal markets (Fig. 2 & 3). In such marketing chains the fluid milk and feed pass successively through a number of market actors, implying the link in the value chain before it reaches to the end-users. As mentioned earlier, the main actors in the fluid milk and feed value chain include a network of collectors, traders, retailers, processors and consumers.
2.2.2. Marketing channels for fluid milk
2.2.2.2. Channel 1: Milk reaching the consumers through formal marketingThe formal marketing channel involves actors that are market oriented and well recognized/certified by the government. It is also well structured in that it involves several actors with one adding value on the other’s product and formal and/or informal contractual agreement between two actors in the chain. Despite some variations in the quantity associated to the seasonal nature of milk production, there is more or less regular supply in the daily amount of milk supplied to the terminal market. In the study area around 68% of the milk produced daily is assumed to reach market destinations for sale with the rest being consumed at home. Of the marketed milk approximately 32% of the milk is traded formally and channeled to direct consumers using two different marketing sub-routes. In the first sub-route the milk collected by unions/coops and certified individual traders/collectors is supplied to the consumers via commercial retailers (supermarkets, kiosks, milk shops, hotels and restaurants). The second formal route is the case in which the milk in its packed form is destined to the final consumers after it is being collected by certified individual traders, coops/unions and processors. In this typical route before it is channeled to the end market users, milk is further processed by small- and large-scale processors and retailed by small- and large-scale traders (hotels, restaurants, cafes, kiosks, supermarkets etc.). While this channel is the most preferred marketing channel by the producers for its sustainability and provision of some inputs (feed, refrigeration, transportation etc.), particularly by the cooperatives/union and processors, it is also disliked for the low prices paid for milk except in the case when the milk is collected by individual traders. In addition to supply problems, from the consumers’ side, again there are also problems linked to quality and hygiene (even though milk testing is practiced to a limited extent) and high transactions costs across the different value chain actors.
16
2.2.2.3. Channel 2: Milk reaching the consumers through informal market Out of the total milk meant for marketing, approximately 68% of the milk passes to the terminal market through the informal route. This does not include commercial actors that are well recognized/certified by government agencies. It is not well structured in that it avoids some major actors in the value chain. Moreover, there are irregularities in the milk supply system since milk is usually in short supply. The system in most cases lacks formal contractual agreements between parties. Normally there are three operational marketing routs. One way is the route in which the milk is directly supplied to the consumer in the terminal market by the producers themselves (smallholder producer). Secondly, part of the milk collected by uncertified rural collectors will be sold direct to the consumer. In the third route the producers and/or individual traders directly supply the milk to the uncertified small scale processors and retailers before the milk reaches the end users (consumers) in the terminal markets. In this marketing channel some of the milk informally reaches modern processors subjected to processing and retailing before it is destined to the final users. Despite their premium price offer, individual collectors/traders are not very much preferred by producers. This is mainly because of lack of formal agreements with individual traders, lack of traceability of these actors since they do not have permanent address and above all because they are not licensed. As usual, the greatest challenge in this route is maintaining clean and hygienic milk for delivery to the processors and consumers. Adulteration with water is quite often reported as the most chronic problem in the channel. It also presents a serious problem to large processors since an adequate supply of milk does not reach them. The most noticeable advantage of this channel is that it avoids most transaction costs across the value chain and hence consumers in the terminal market enjoy the milk at relatively fair price. Moreover, producers also benefit from their milk sales.
17
__________________________________________________________________
________________________________________________________________________
18
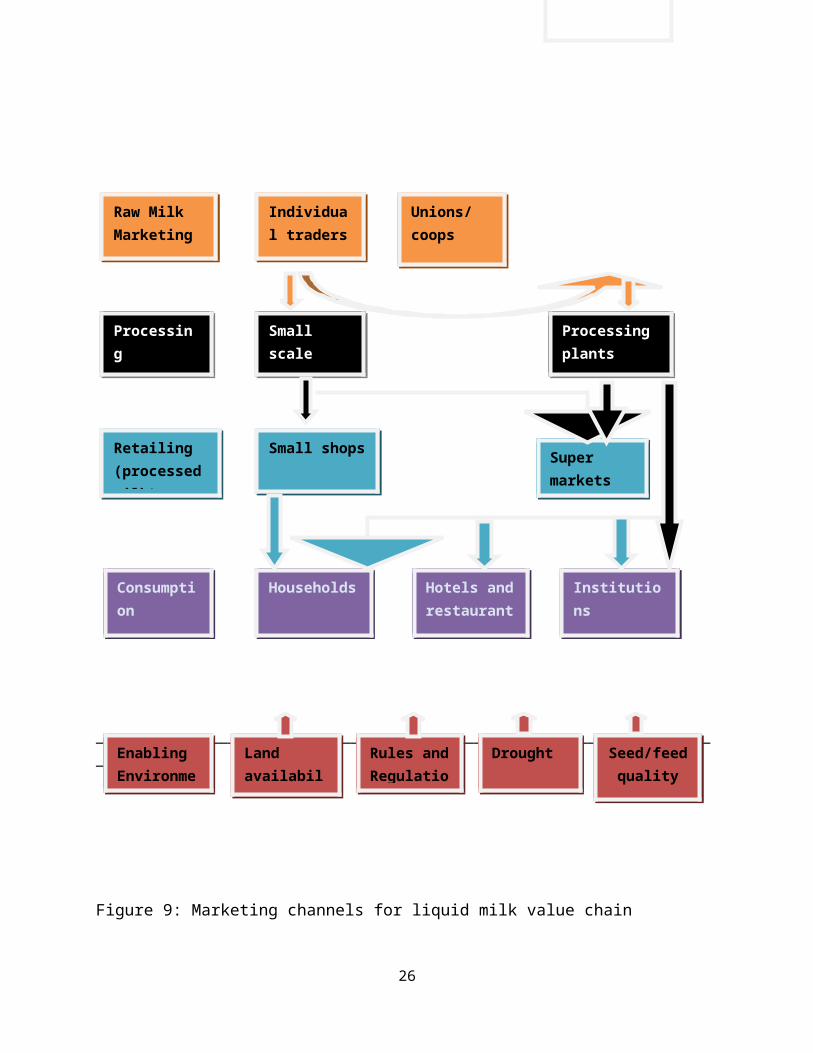
Input Supply
Extension services
Vet services
AI services
Credit services
Knowledge & Skills
Technology
Production
Technology
Smallholder dairy farmers
Technology
Raw Milk Marketing
Individual traders
Unions/coops
Collectors of milk processing plants
Processing Small scale processors
Processing plants
Retailing (processed milk)
Small shops Super markets
Consumption
Households Hotels and restaurants
Institutions
Enabling Environment
Land availability
Rules and Regulations
Drought Seed/feed quality control
Figure 9: Marketing channels for liquid milk value chain
2.2.3. Marketing channels for feedA very few actors tend to monopolize the market in the feed value chain. There are, in general, high price fluctuations and price hikes related to both buying and selling in seasons other than crop and natural pasture hay harvesting seasons (October-January). Weakness of coops/unions in supplying feeds directly to the producers, lack of standard quality control systems and supply shortages were among the most chronic problems that need to be addressed. The efforts made by Biftu Berga dairy production and marketing union to collect, conserve and sell feed at a relatively fair price to member coops at times when prices are rapidly increasing deserves special appreciation.
2.2.3.2. Channel 1: Feed reaching the producers through tradersIn this channel both roughage feed producers and feed processing plants sell all their produce to traders and the feeds finally reach the producers at terminal markets (smallholders, institutes/organizations and urban and peri-urban dairy farmers) through retail outlets. Whatever surplus roughage is produced, it is conserved for sale at peak shortage seasons (dry season, February-May). Roughages are usually traded after being baled, in heaps or in donkey loads. In addition to roughages, seeds of improved forages are also marketed. All problems listed above also apply as marketing problems under this channel. The absence of feed grading and standard quality control system and heavy taxes including VAT imposed by the government on concentrate feeds, are additionally exacerbating the feed marketing problems for smallholder dairy producers.
2.2.3.3. Channel 2: Feed reaching terminal markets with/without coops/unionsThis marketing channel applies mostly to concentrate feeds produced by feed processing plants. The feed from major processing plants either directly reaches producers (smallholders, organizations and urban and peri-urban dairy farmers) or through unions via member coops and non-member smallholder rural farmers. This is the most preferred market channel by end users as it reduces transaction costs normally prevailing in the feed value chains. Feed taxations, transportation costs and supply of raw materials to feed processing plants have led to the majority of feed processors operating under their designated capacities. These problems coupled with those mentioned earlier are currently contributing to the prevailing feed price hikes and fluctuations.
19

__________________________________________________________________________________
__________________________________________________________________________________
Figure 10: Marketing channels for feed value chain
20
Enabling Environment
Land availability
Rules and Regulations
Drought Seed/feed quality control
Consumption
Smallholder rural farmers
Institution/colleges, research centers etc
Urban & Peri-urban farmers
Marketing Traders Unions/coops
Production Smallholder Agro-processing industries
Input Supply
Extension services
Provision of Planting materials & fertilizer
Credit services
Technology
3. Constraints, opportunities and intervention strategies along the liquid milk and feed value chains
3.1. Constraints along the liquid milk value chain
3.1.1. Constraints in input supply systemConstraints associated with input supply for liquid milk production include qualitative and quantitative shortage of feeds, poor knowledge of feed formulation, poor supply and/or availability of improved genetic (cattle) stock and shortage of quality (cattle) semen. The most pressing problems with delivery of veterinary services according to the respondents were shortages and/or inconsistencies in drug supply; lack of quality drugs; presence of contraband in markets and lack of veterinarians with dairy technical focus. The extension service is reported to be weak and current services are limited to AI and veterinary services with all the complications stated above. Credit service is, in general, available in the district with limited capacity (the amount secured is often reported to be inadequate for dairy investment) and the requirement for group collateral which farmers do not want in order not to pay for defaulters in the group. High interest rates were also criticized by the different actors in the value chain as a barrier to credit secured from the small micro-finance institutions operating in the district.
3.1.2. Constraints at production stageHigh investment cost to start dairy farms and the limited number of commercial farms, very high and ever increasing feed prices, low productivity of the local dairy cattle and the problem of accessing AI or improved bull services and poor dairy management skill of smallholder dairy farmers, were found to be the most important constraints hindering the development in dairy production in the study areas. Moreover, farmers indicated that they need training on dairy production and management to improve their skills.
3.1.3. Constraints at processing stageShortage of raw milk supply and milk quality problems coupled with shortage of technical skills to process value added products such as cheese and butter, low level of market linkage among the value chain actors, low marketing skills that lead to poor labeling, distribution and high cost of packaging have been reported by major processors such as Shola and Mama. Local small-scale processors complained about poor demand for their processed products and the bureaucratic ups and downs when trying to secure credit for establishment of processing plants.
3.1.4. Constraints in marketingLong distances and poor road infrastructure to reach markets, high cost of transportation and lack of chilling facilities (for most of individual traders) were found to be important constraints in marketing liquid milk in the study areas. Improper milk packing and handling and shortage of
21

processed milk for distribution in the area were also identified as important marketing constraints.
3.1.5. Constraints at consumption stageLong fasting days of the Orthodox Christian followers, the prevailing assumption that milk is meant only for kids, the high milk price that prohibits the low income group of the society from consuming milk, the lack of consumers’ knowledge on milk quality and the lack of law enforcement for milk quality standards are some of the constraints identified at the consumption stage.
3.2. Major opportunities in the liquid milk value chainThese related to: the existence of suitable agro-ecology for dairy production; high domestic and export market demand for milk; emerging dairy processing industries working under extremely low designated capacity; relatively cheap labor force; strong support from federal, regional research institutions and universities for the development of the sector and the ever increasing urbanization coupled with growing incomes of the consumers are some among many opportunities that would need to be enumerated in this regard .
3.3. Proposed intervention strategies from liquid milk value chain analysis
To improve the input delivery system among the various actors in the milk value chain sustained contractual agreement must be signed between groups of dairy farmers and feed manufacturers for delivery of feed rations; between groups of dairy farmers and an AI inseminator for rapid dissemination of improved dairy genotypes and between groups of farmers and a veterinarian and the community animal health workers for preventive care and treatment of dairy cows. In this regard, facilitating contracts between Primary dairy coops, unions and processors and promoting quality‐based payment strategy would be expected to significantly improve input delivery system among farmers in the district. Alternatively, it is also pretty good to strengthen the capacity of primary dairy coops and dairy unions to collect milk for sales and processing, and provide input services to its members. As it has repeatedly been said, credit service is at its infancy compared to the huge demand that prevails among farmers in the district Thus it seems wise to consider grant or guaranteed loans for start ‐up processing facilities and continual availability of micro-credit service to support small holder dairy farmers.
During the survey work the majority of the respondents indicated as the luck of regular training among the various stages of the milk value chain negatively affecting the business. Therefore, it seems quite mandatory to provide sustained trainings to business service providers for efficient retailing price. Cooperative members shall also be trained on special business and appropriate educational skill for good governance. Moreover, members would to be provided with appropriate scale of training so long as testing of milk quality is concerned. Similarly, collectors should be equipped with the necessary milk handling and testing knowledge. In addition, they should be structurally well organized to implement a pricing scheme based on quality. Processors, on the other hand, must be offered short term technical assistance to improve their business and marketing skill; Quality improvement and Support service for new product
22
development. From the consumer side it is also good to have consumer‐targeted awareness campaigns. In this line, the use of recognizable public figures to speak on importance of milk consumption and the involvement of retailers in the demonstrations of milk and milk products could further help ruin the wrong perceptions about the conception of liquid milk by adults that could have prevailed in the society for long.
Improved linkages between MoA, Researchers and farmers plays a pivotal role in improving the supply of technological package and the necessary tool to disseminate the information generated so far to the various actors along the value chain. Supporting the strengthening of a public sector adaptive research program targeted to specific high potential agro-ecological areas in the district for improved smallholder dairy production systems and linking the results of the research to lead farmers, as well as, to farmer training schools. These must include: a. Forage varietal trials b. Dairy rations using local agricultural by-products c. Pasture management and zero grazing systems d. Nutrient recycling of organic materials for pasture and crop development e. Production of feed grains for animal production f. Optimizing cross-bred animal management systems for different agro-ecological zones available in the Woreda. It is also recommended that agricultural input dealers and MOA researchers must have field days on regular bases in order to acquaint farmers with working technologies
3.4. Constraints in the feed value chain
3.4.1. Constraints in input supply systemLand shortage for fodder production, supply shortage for seed and other forage planting materials, shortage of raw materials for agro-industries and feed processing plants were the main constraints mentioned by the farmers and processors. The extension service that lacks regular training on feed production and processing was also criticized by many actors in the feed value chain. The government seed agency is not involved in forage seed production and distribution and it focuses only on food grains.
3.4.2. Constraints at production stageLow productivity of pasture mainly associated with lack of forage production skill and inefficient feed harvesting, collection and storage practices are the major constraints hindering improvements in feed production in the area. Moreover, production of concentrates and major agro-industrial byproducts are constrained by inadequate supply and high cost of raw materials (grains & seeds).
3.4.3. Constraints at processing stageThere are only a few agro-industrial feed processing plants operating in the country and these are mainly found around the capital Addis Ababa. They are reported to be working under capacity because of high cost of raw materials and supply shortage caused by export of food grains/oil seeds to different countries. Surprisingly, VAT is exempted for manufactured food items while it is still applied to the by-product feeds which, according to the processors, are negatively
23
affecting the marketing situations for processed feeds. The processors, as well as the consumers in the terminal market, emphasized the need to have a standard working feed quality control system in the country. Initial capital investment is high for establishing the plants, therefore, availing adequate and easily accessible credit service to farmers coops/unions eases the existing concentrate shortage on the market provided that the problem with raw material supply is improved.
3.4.4. Constraints in marketingA few actors in the value chain are monopolizing the concentrate market. On the other hand, improved forage & seed production are not usually marketed. Seasonal fluctuations in availability and price of most feeds; high transportation costs and poor knowledge of major actors in the value chain about required quality parameters while purchasing feeds were mentioned as the most pressing problems in the district.
3.4.5. Constraints at consumption stageHigh feed price induced by feed supply shortage and high cost of transportation; high adulteration particularly for oilseed cakes and bran; poor knowledge on quality parameters while purchasing feeds and lack of knowledge on proper formulation and feeding of dairy cattle are apparently pushing the producers away from the business.
3.5. Major opportunities in the feed value chainSuitable and diverse agro-ecology for feed production; high domestic and export demand for feed; emerging feed-processing industries working under extremely low designated capacity, strong support from regional, federal research and teaching institutions in availing feed technological packages; high market demand for improved forage seeds and emerging and rapidly expanding urban and peri-urban dairy farms in the district, are some among the many opportunities identified for the development of the feed industry in the district.
3.6. Proposed intervention strategies for feed value chain
Institutionalizing contracts between feed manufacturers and cereal grains and oilseed producers for delivery to the factory at negotiated prices and quantities. More market institution must organized to join the dairy feed sector
The capacity of coops/unions and individuals farmers seeking to produce dairy feeds must be strengthened by availing credit services and required skill through regular trainings. This must also include: Improved crop residue and natural pasture conservation and treatment options using available and recommended technologies for supplementary dry season feeding; introduction of back yard forages, improved high quality high biomass herbaceous and tree fodders in to the existing farming systems using available planting materials/seeds and research entry points such as Intercropping, alley cropping etc. The extension system must be strong enough to guide
24
farmers to organize and become involved in the multiplication of forage seed at a micro-level. The system must always remain active in facilitating marketing demand and proper linkages with the research system and among actors in the feed value chain.
As part of Government’s policy issue, the Ethiopian Seed Agency must start and take part to produce quality forage seeds. Government should also start thinking of exporting value added finished agricultural products. In this regard investors must be encouraged to fully involve in the area of agro-industrial processing so that the byproducts would remain in the country for sale for animal feeds. It is also recommended that feed processors must be exempted for some types of taxes like VAT. The last but not the least policy tool expected from the government side is that the feed sector has to be regulated by offering guaranteed analysis of mixed commercial feeds.
4. Lessons learned and comments on the VCA tools
4.1. Lessons learned
Amalgamation of the checklist for dairy, beef and sheep value chains was perceived to create confusion, and was found to be less user friendly both in terms of time and pace of the discussion. Moreover, merging feed as a component of the other commodities (milk, beef, sheep) was found to prolong discussion time due to the length of the checklist.
The VCA tool was found to be highly demanding in terms of both expertise and time due to the first exposure of the team to the exercise and the diversity of actors, and sensitivity of some issues like the case of assessing trends of prices over time. Almost all the actors interviewed tended to overestimate their expense side and were not bold enough to reveal or highly underestimated their benefit side. This was found to be a major limitation for collecting reliable data.
Lack of record keeping and standard measurement units by the different actors/interviewees posed difficulties in obtaining some information, e.g. seasonal price trends.
Farmer expectations: they sought incentives for participation and they anticipated the support of government or other source rather than opting to solve problems on their own using locally available capacity and opportunities.
4.2. Areas of improvement for VCA tool Specific checklists should be used corresponding to each commodity (dairy, beef, sheep,
feed) to avoid some ambiguities and to save discussion time. Feed should be separately treated as a commodity for VCA rather than being merged into the dairy, sheep and beef value chains. Developing specific checklists for each commodity will help to reduce both the size of the questionnaire and the discussion time.
Given the large number of actors involved in both the fluid milk and the feed value chain, it recommended that the VCA tool shall be handled separately by a different team or alternatively more relaxed time need to be given if all the tools have to be managed by the same team.
25
Since standard measurement units and record-keeping are problems with most of the actors and the smallholder farmers in particular, it is better to use triangulation methods or generate data using alternative methods like secondary data. This includes data for sale prices and/or the amount daily or annually produced of feed, milk, grains, animals etc. The use of heart girth measurements may help to roughly estimate the live weight of animals even though this, as a rule of thumb, only helps to get data for crossbred animals.
Before it is recommended over large domains the results from using this new VCA tool should be validated against the existing and conventionally used VCA methodologies.
5. Conclusions and RecommendationsThe Wolmera district within the Addis Ababa milk shed is dominated by small-scale dairy production, informal milk marketing, a limited range of dairy products and seasonal gaps between demand and supply. Access to market related to distances from market points for producers is a major factor affecting marketing. Establishing cooperative collection centers and strengthening the capacities of existing ones may help producers in the distant areas to access inputs and services and fair prices for their saleable products. Currently, the growing population and improving living standards are increasing the demand not only for quantity but also for quality and diversity of milk products. Moreover, as a young sector, a number of opportunities exist for private and public ventures, which stretch from input supply to the retail marketing of milk and feeds.
It is strongly recommended that a value chain approach should be adopted during the planning and execution of development activities related to liquid milk and feed production. The informal market chain for liquid milk remains an important element of the dairy sector and needs to be geared in the directions that benefit producers and consumers. On the other hand, ever increasing cost of inputs, especially the cost of feed, is one of the factors affecting milk production and marketing. In this regard, proper interventions should be considered to safeguard smallholder producers and consumers.
6. References Ahmed, M., Ehui, S. and Yemesrach, A. 2004. Dairy development in Ethiopia. EPTD Discussion
Paper No. 123. IFPRI (International Food Policy Research Institute), Washington, DC, USA.
Costales, A., Gerber, P. and Steinfeld, H. 2006. Underneath the livestock revolution. FAO (Food and Agriculture Organization of the United Nations), Rome, Italy.
CSA (Central Statistical Agency). 2008. Agricultural sample survey 2007/08. Volume II. Report on livestock and livestock characteristics (private peasant holdings). CSA, Addis Ababa, Ethiopia.
EAFIA, Over view of Ethiopian Animal feed Industry Association and Feed Production and constraint in Ethiopia .Ethiopian Animal feed Industry Association, April 2010
26
Firew Kassa, Binyam Kassa, Deresse Teshome, Friew Kelemu, Getahun Kebede and Addisu Aberra, 2011. Marketing and pricing conditions for liquid milk and value added dairy products in and around Addis Ababa, Ethiopia. (Unpublished)
Mendoza, R. and Thelen, N. 2008. Innovations to make markets more inclusive for the poor. Development Policy Review 26(4):427–458.
MoARD Livestock Master Plan Study Phase I Report Volume T – Sociological Aspects, 2007.
Staal, S.J., Pratt, A.N. and Jabbar, M. 2008. Dairy development for the resource poor. Part II: Kenya and Ethiopia dairy development case studies. PPLPI (Pro-poor Livestock Policy Initiative) Working Paper No. 44–2. ILRI (International Livestock Research Institute), Nairobi, Kenya.
Tefera, T.L. 2010. “Commercializing dairy and forage systems in Ethiopia: An Innovation Systems Perspective.” ILRI – IPMS. Working Paper No. 17.
Bezabih Emana, 2010. Market assessment and value chain analysis in Benishangul Regional State, Addis Abeba, Ethiopia.
27