Embed Size (px)
Citation preview
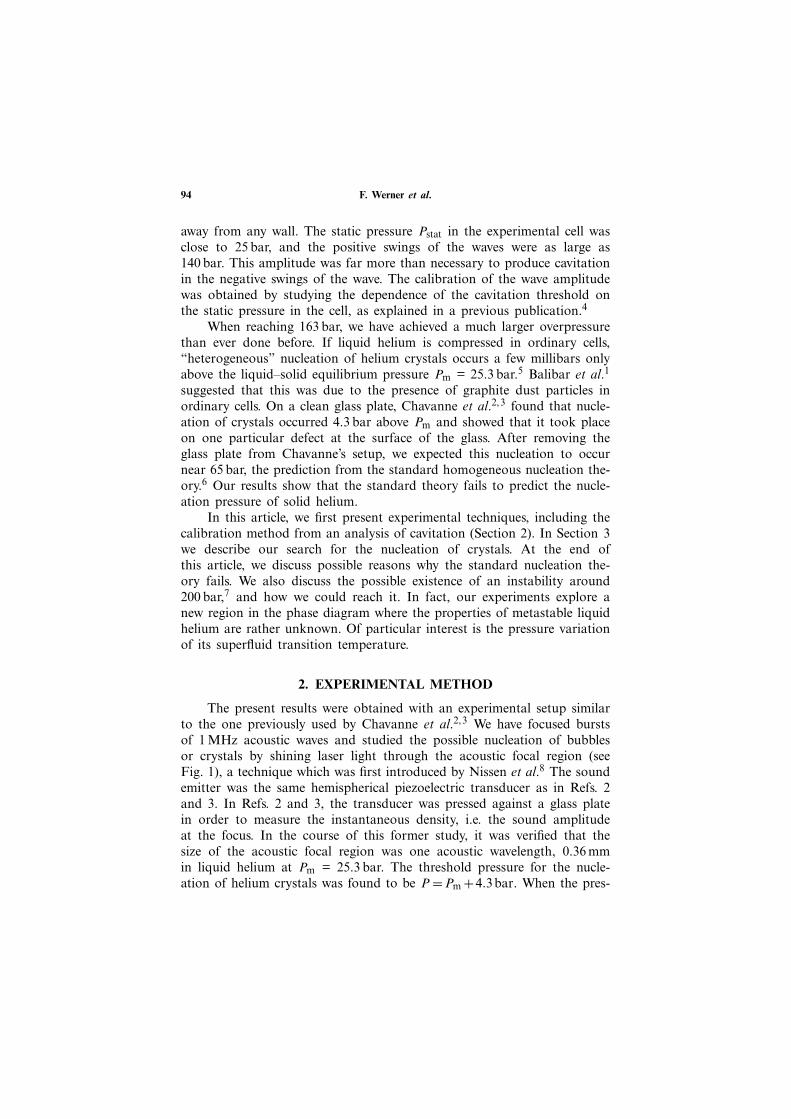
Journal of Low Temperature Physics, Vol. 136, Nos. 1/2, July 2004 (© 2004)
Liquid Helium up to 160 bar
F. Werner, G. Beaume, A. Hobeika, S. Nascimbene,C. Herrmann, F. Caupin, and S. Balibar*
Laboratoire de Physique Statistique de l’Ecole Normale Superieure, associe aux UniversitesParis 6 et 7 et au CNRS, 24 Rue Lhomond, 75231 Paris Cedex 05, France
∗ E-mail: [email protected]
(Received December 19, 2003; revised April 10, 2004)
We have used an acoustic technique to pressurize liquid helium 4 up to 163± 20 bar. This is far above the liquid–solid equilibrium pressure Pm, whichis 25.3 bar in the low, temperature domain, where the experiment was per-formed (0.05 K < T < 1 K). This is also far above 65 bar, the prediction ofthe standard theory for homogeneous nucleation of solid helium. However,no solidification was observed. We discuss our experimental method and themetastability of liquid helium at such very large overpressures. We also pro-pose improvements of our experiment, in order to reach a possible instabilitylimit of liquid helium 4 around 200 bar.
KEY WORDS: Nucleation; liquid helium; solid helium; crystallization;cavitation; spinodal limit; acoustic waves.
1. INTRODUCTION
How far can one pressurize a liquid before it crystallizes? Superfluidhelium offers a unique opportunity to consider this question. As shown byour previous studies,1–3 solid helium nucleates easily from liquid heliumif pressurized in the presence of walls. However, if the influence of wallsis removed, the nucleation of helium crystals has to be “homogeneous”,i.e. an intrinsic property of helium, and it requires a large overpressure.In this article, we show that homogeneous nucleation of solid helium doesnot occur up to 163 ± 20 bar, at least on a time scale of order 100 ns, thetypical experimental time in our experiment; our results mean that heliumcan stay in a metastable liquid state in a much larger pressure range thanpreviously thought.
In order to pressurize liquid helium far above its equilibrium pressure,we have focused high-intensity ultrasound bursts in bulk liquid helium,
93
0022-2291/04/0700-0093/0 © 2004 Plenum Publishing Corporation
94 F. Werner et al.
away from any wall. The static pressure Pstat in the experimental cell wasclose to 25 bar, and the positive swings of the waves were as large as140 bar. This amplitude was far more than necessary to produce cavitationin the negative swings of the wave. The calibration of the wave amplitudewas obtained by studying the dependence of the cavitation threshold onthe static pressure in the cell, as explained in a previous publication.4
When reaching 163 bar, we have achieved a much larger overpressurethan ever done before. If liquid helium is compressed in ordinary cells,“heterogeneous” nucleation of helium crystals occurs a few millibars onlyabove the liquid–solid equilibrium pressure Pm = 25.3 bar.5 Balibar et al.1
suggested that this was due to the presence of graphite dust particles inordinary cells. On a clean glass plate, Chavanne et al.2,3 found that nucle-ation of crystals occurred 4.3 bar above Pm and showed that it took placeon one particular defect at the surface of the glass. After removing theglass plate from Chavanne’s setup, we expected this nucleation to occurnear 65 bar, the prediction from the standard homogeneous nucleation the-ory.6 Our results show that the standard theory fails to predict the nucle-ation pressure of solid helium.
In this article, we first present experimental techniques, including thecalibration method from an analysis of cavitation (Section 2). In Section 3we describe our search for the nucleation of crystals. At the end ofthis article, we discuss possible reasons why the standard nucleation the-ory fails. We also discuss the possible existence of an instability around200 bar,7 and how we could reach it. In fact, our experiments explore anew region in the phase diagram where the properties of metastable liquidhelium are rather unknown. Of particular interest is the pressure variationof its superfluid transition temperature.
2. EXPERIMENTAL METHOD
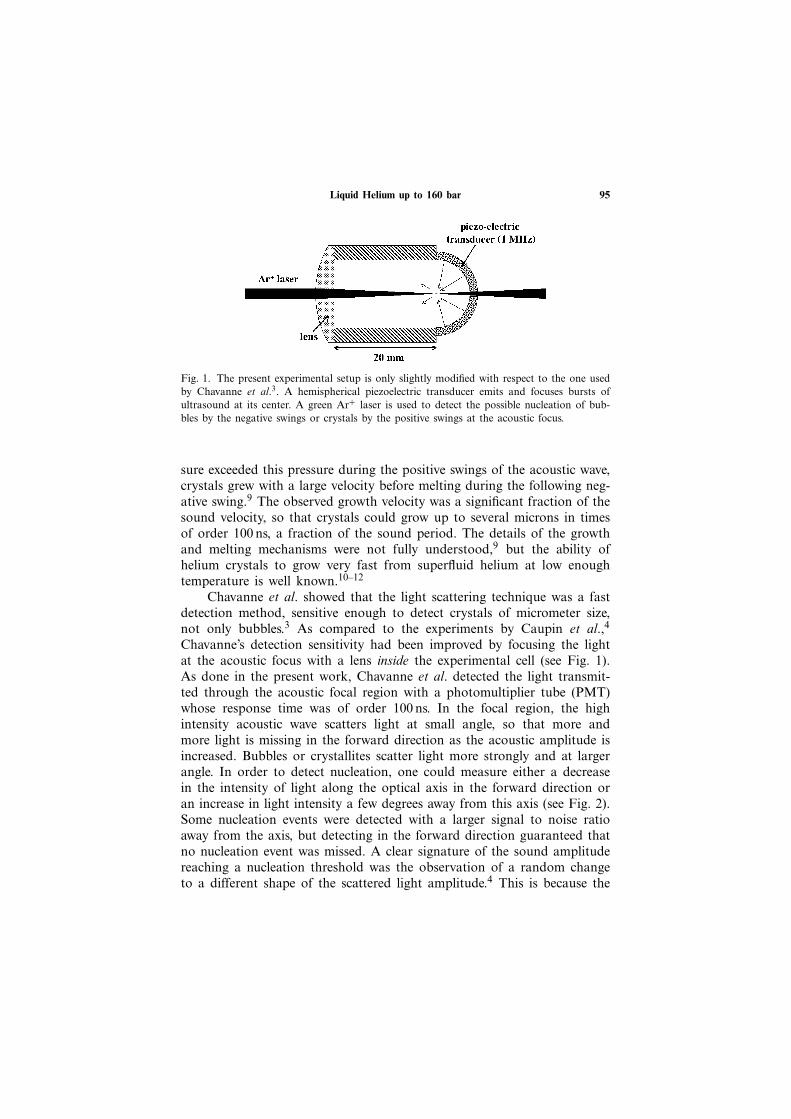
The present results were obtained with an experimental setup similarto the one previously used by Chavanne et al.2,3 We have focused burstsof 1 MHz acoustic waves and studied the possible nucleation of bubblesor crystals by shining laser light through the acoustic focal region (seeFig. 1), a technique which was first introduced by Nissen et al.8 The soundemitter was the same hemispherical piezoelectric transducer as in Refs. 2and 3. In Refs. 2 and 3, the transducer was pressed against a glass platein order to measure the instantaneous density, i.e. the sound amplitudeat the focus. In the course of this former study, it was verified that thesize of the acoustic focal region was one acoustic wavelength, 0.36 mmin liquid helium at Pm = 25.3 bar. The threshold pressure for the nucle-ation of helium crystals was found to be P =Pm +4.3 bar. When the pres-
Liquid Helium up to 160 bar 95
Fig. 1. The present experimental setup is only slightly modified with respect to the one usedby Chavanne et al.3. A hemispherical piezoelectric transducer emits and focuses bursts ofultrasound at its center. A green Ar+ laser is used to detect the possible nucleation of bub-bles by the negative swings or crystals by the positive swings at the acoustic focus.
sure exceeded this pressure during the positive swings of the acoustic wave,crystals grew with a large velocity before melting during the following neg-ative swing.9 The observed growth velocity was a significant fraction of thesound velocity, so that crystals could grow up to several microns in timesof order 100 ns, a fraction of the sound period. The details of the growthand melting mechanisms were not fully understood,9 but the ability ofhelium crystals to grow very fast from superfluid helium at low enoughtemperature is well known.10–12
Chavanne et al. showed that the light scattering technique was a fastdetection method, sensitive enough to detect crystals of micrometer size,not only bubbles.3 As compared to the experiments by Caupin et al.,4
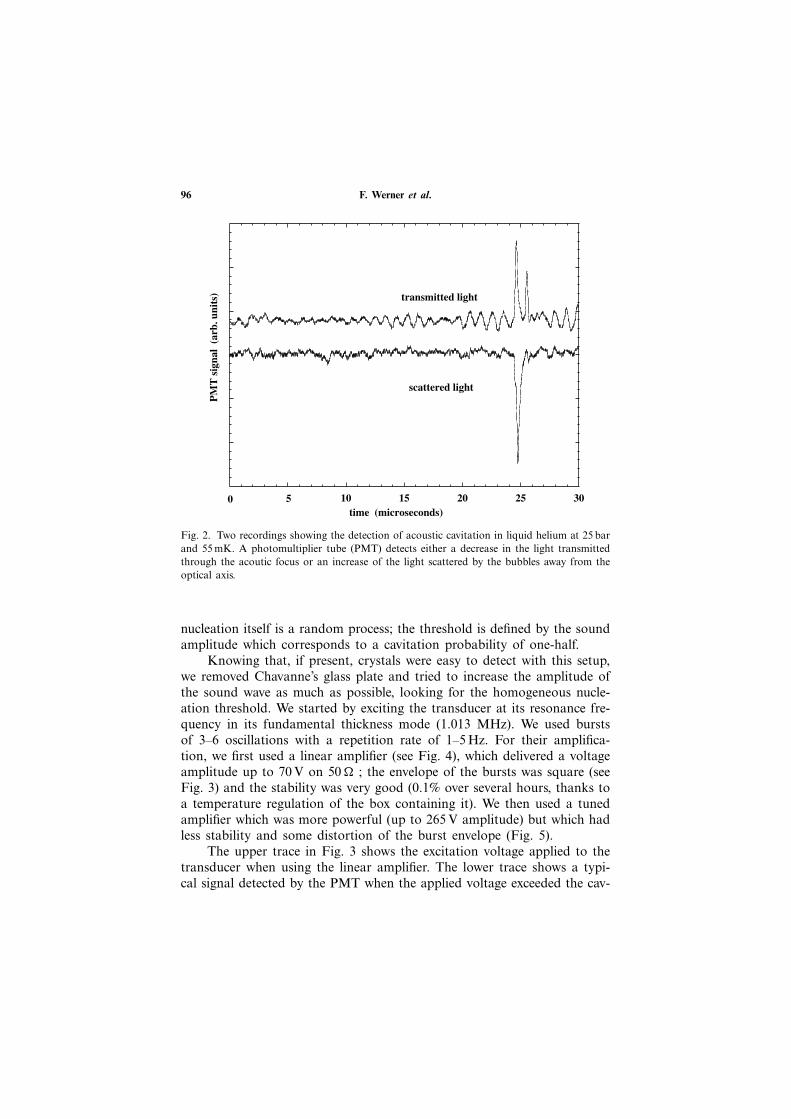
Chavanne’s detection sensitivity had been improved by focusing the lightat the acoustic focus with a lens inside the experimental cell (see Fig. 1).As done in the present work, Chavanne et al. detected the light transmit-ted through the acoustic focal region with a photomultiplier tube (PMT)whose response time was of order 100 ns. In the focal region, the highintensity acoustic wave scatters light at small angle, so that more andmore light is missing in the forward direction as the acoustic amplitude isincreased. Bubbles or crystallites scatter light more strongly and at largerangle. In order to detect nucleation, one could measure either a decreasein the intensity of light along the optical axis in the forward direction oran increase in light intensity a few degrees away from this axis (see Fig. 2).Some nucleation events were detected with a larger signal to noise ratioaway from the axis, but detecting in the forward direction guaranteed thatno nucleation event was missed. A clear signature of the sound amplitudereaching a nucleation threshold was the observation of a random changeto a different shape of the scattered light amplitude.4 This is because the
96 F. Werner et al.
10 15 20 25 30
PM
T s
igna
l (a
rb. u
nits
)
time (microseconds)
transmitted light
scattered light
0 5
Fig. 2. Two recordings showing the detection of acoustic cavitation in liquid helium at 25 barand 55 mK. A photomultiplier tube (PMT) detects either a decrease in the light transmittedthrough the acoutic focus or an increase of the light scattered by the bubbles away from theoptical axis.
nucleation itself is a random process; the threshold is defined by the soundamplitude which corresponds to a cavitation probability of one-half.
Knowing that, if present, crystals were easy to detect with this setup,we removed Chavanne’s glass plate and tried to increase the amplitude ofthe sound wave as much as possible, looking for the homogeneous nucle-ation threshold. We started by exciting the transducer at its resonance fre-quency in its fundamental thickness mode (1.013 MHz). We used burstsof 3–6 oscillations with a repetition rate of 1–5 Hz. For their amplifica-tion, we first used a linear amplifier (see Fig. 4), which delivered a voltageamplitude up to 70 V on 50 � ; the envelope of the bursts was square (seeFig. 3) and the stability was very good (0.1% over several hours, thanks toa temperature regulation of the box containing it). We then used a tunedamplifier which was more powerful (up to 265 V amplitude) but which hadless stability and some distortion of the burst envelope (Fig. 5).
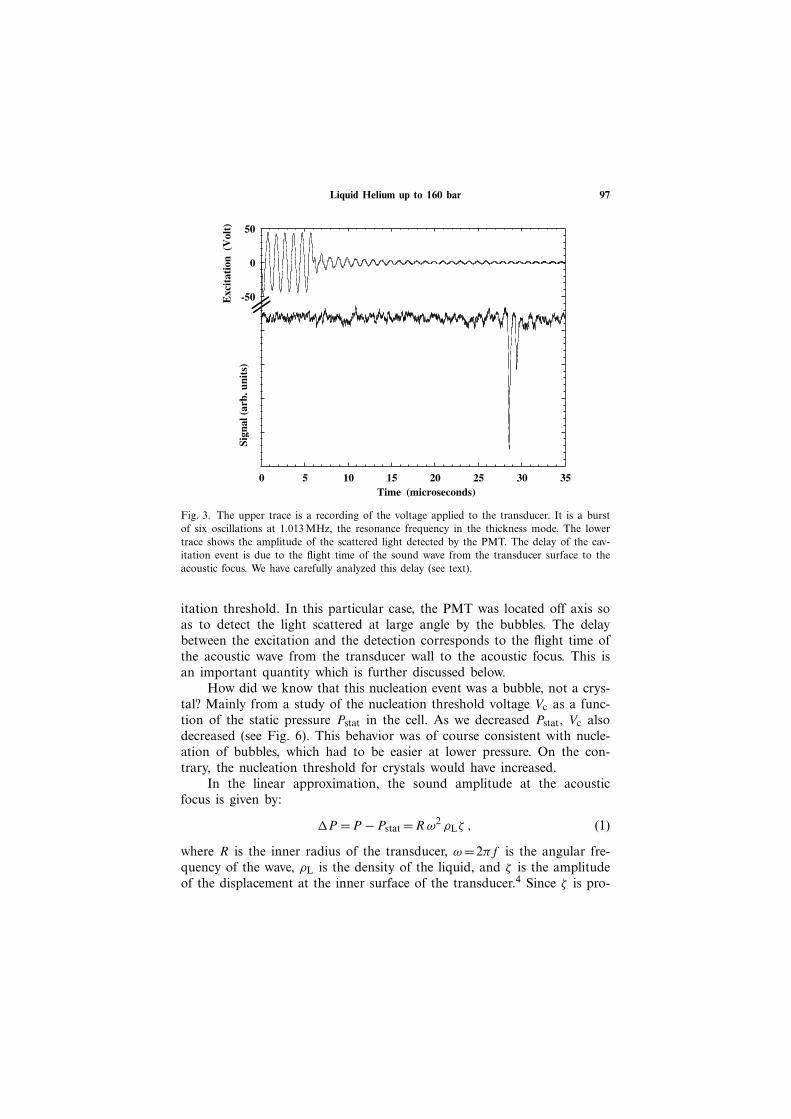
The upper trace in Fig. 3 shows the excitation voltage applied to thetransducer when using the linear amplifier. The lower trace shows a typi-cal signal detected by the PMT when the applied voltage exceeded the cav-
Liquid Helium up to 160 bar 97
-50
0
50
0 5 10 15 20 25 30 35
Exc
itat
ion
(V
olt)
Time (microseconds)
Sign
al (
arb.
uni
ts)
Fig. 3. The upper trace is a recording of the voltage applied to the transducer. It is a burstof six oscillations at 1.013 MHz, the resonance frequency in the thickness mode. The lowertrace shows the amplitude of the scattered light detected by the PMT. The delay of the cav-itation event is due to the flight time of the sound wave from the transducer surface to theacoustic focus. We have carefully analyzed this delay (see text).
itation threshold. In this particular case, the PMT was located off axis soas to detect the light scattered at large angle by the bubbles. The delaybetween the excitation and the detection corresponds to the flight time ofthe acoustic wave from the transducer wall to the acoustic focus. This isan important quantity which is further discussed below.
How did we know that this nucleation event was a bubble, not a crys-tal? Mainly from a study of the nucleation threshold voltage Vc as a func-tion of the static pressure Pstat in the cell. As we decreased Pstat, Vc alsodecreased (see Fig. 6). This behavior was of course consistent with nucle-ation of bubbles, which had to be easier at lower pressure. On the con-trary, the nucleation threshold for crystals would have increased.
In the linear approximation, the sound amplitude at the acousticfocus is given by:
�P =P −Pstat =R ω2 ρLζ , (1)
where R is the inner radius of the transducer, ω=2πf is the angular fre-quency of the wave, ρL is the density of the liquid, and ζ is the amplitudeof the displacement at the inner surface of the transducer.4 Since ζ is pro-
98 F. Werner et al.
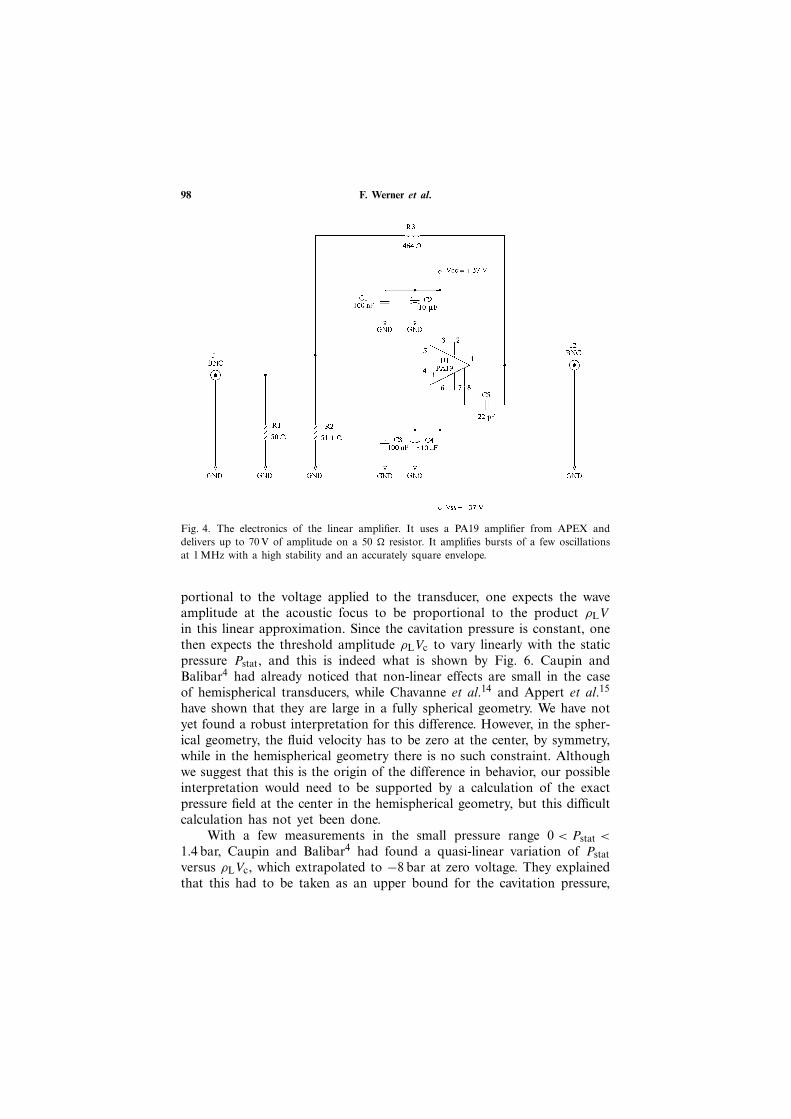
Fig. 4. The electronics of the linear amplifier. It uses a PA19 amplifier from APEX anddelivers up to 70 V of amplitude on a 50 � resistor. It amplifies bursts of a few oscillationsat 1 MHz with a high stability and an accurately square envelope.
portional to the voltage applied to the transducer, one expects the waveamplitude at the acoustic focus to be proportional to the product ρLV
in this linear approximation. Since the cavitation pressure is constant, onethen expects the threshold amplitude ρLVc to vary linearly with the staticpressure Pstat, and this is indeed what is shown by Fig. 6. Caupin andBalibar4 had already noticed that non-linear effects are small in the caseof hemispherical transducers, while Chavanne et al.14 and Appert et al.15
have shown that they are large in a fully spherical geometry. We have notyet found a robust interpretation for this difference. However, in the spher-ical geometry, the fluid velocity has to be zero at the center, by symmetry,while in the hemispherical geometry there is no such constraint. Althoughwe suggest that this is the origin of the difference in behavior, our possibleinterpretation would need to be supported by a calculation of the exactpressure field at the center in the hemispherical geometry, but this difficultcalculation has not yet been done.
With a few measurements in the small pressure range 0 < Pstat <
1.4 bar, Caupin and Balibar4 had found a quasi-linear variation of Pstatversus ρLVc, which extrapolated to −8 bar at zero voltage. They explainedthat this had to be taken as an upper bound for the cavitation pressure,
Liquid Helium up to 160 bar 99
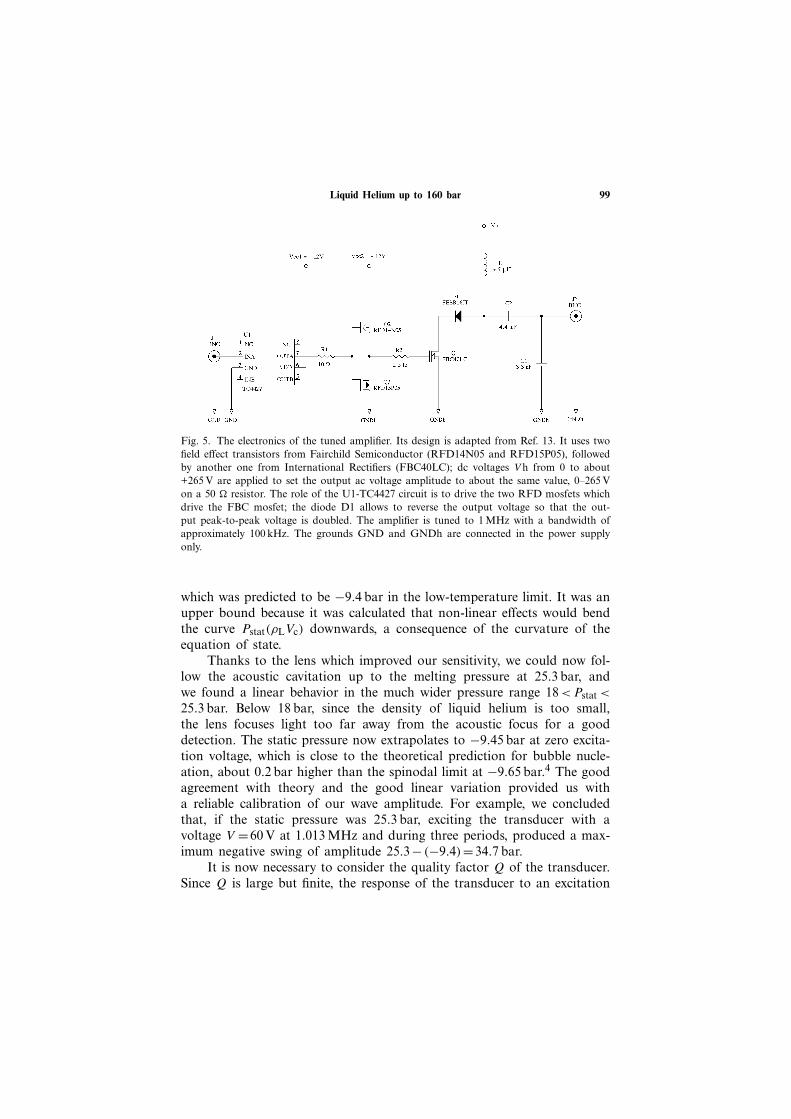
Fig. 5. The electronics of the tuned amplifier. Its design is adapted from Ref. 13. It uses twofield effect transistors from Fairchild Semiconductor (RFD14N05 and RFD15P05), followedby another one from International Rectifiers (FBC40LC); dc voltages V h from 0 to about+265 V are applied to set the output ac voltage amplitude to about the same value, 0–265 Von a 50 � resistor. The role of the U1-TC4427 circuit is to drive the two RFD mosfets whichdrive the FBC mosfet; the diode D1 allows to reverse the output voltage so that the out-put peak-to-peak voltage is doubled. The amplifier is tuned to 1 MHz with a bandwidth ofapproximately 100 kHz. The grounds GND and GNDh are connected in the power supplyonly.
which was predicted to be −9.4 bar in the low-temperature limit. It was anupper bound because it was calculated that non-linear effects would bendthe curve Pstat(ρLVc) downwards, a consequence of the curvature of theequation of state.
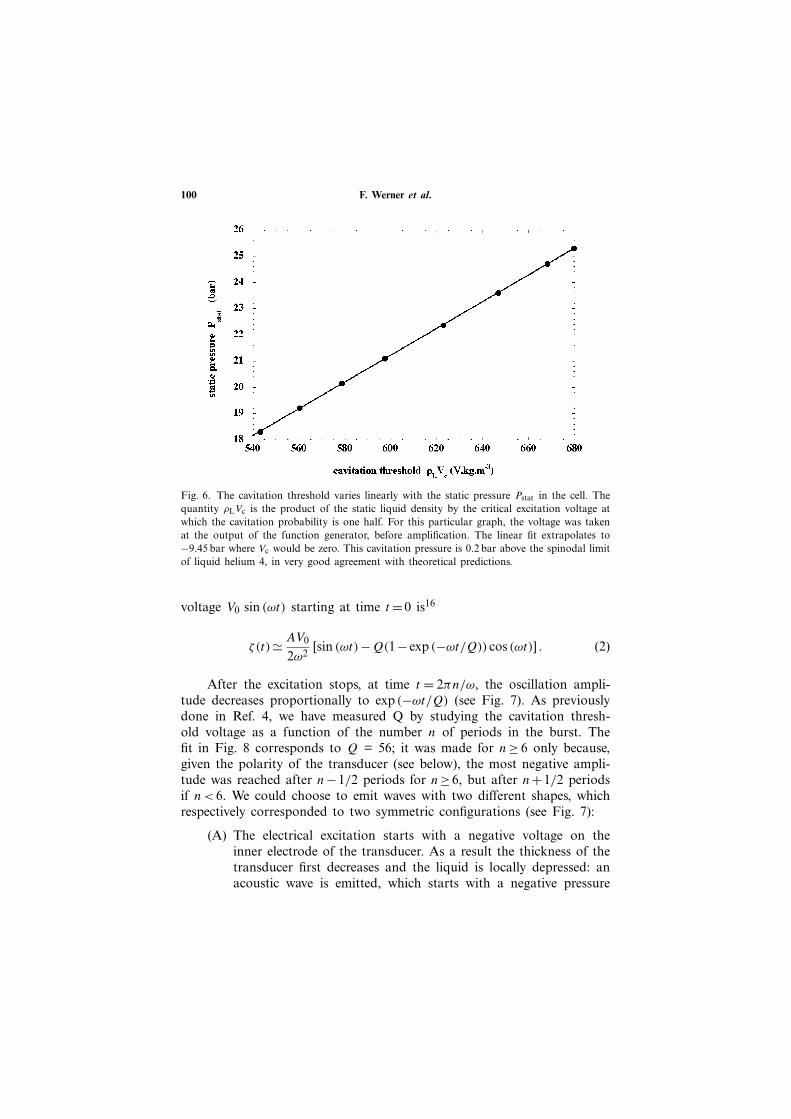
Thanks to the lens which improved our sensitivity, we could now fol-low the acoustic cavitation up to the melting pressure at 25.3 bar, andwe found a linear behavior in the much wider pressure range 18 <Pstat <
25.3 bar. Below 18 bar, since the density of liquid helium is too small,the lens focuses light too far away from the acoustic focus for a gooddetection. The static pressure now extrapolates to −9.45 bar at zero excita-tion voltage, which is close to the theoretical prediction for bubble nucle-ation, about 0.2 bar higher than the spinodal limit at −9.65 bar.4 The goodagreement with theory and the good linear variation provided us witha reliable calibration of our wave amplitude. For example, we concludedthat, if the static pressure was 25.3 bar, exciting the transducer with avoltage V =60 V at 1.013 MHz and during three periods, produced a max-imum negative swing of amplitude 25.3− (−9.4)=34.7 bar.
It is now necessary to consider the quality factor Q of the transducer.Since Q is large but finite, the response of the transducer to an excitation
100 F. Werner et al.
Fig. 6. The cavitation threshold varies linearly with the static pressure Pstat in the cell. Thequantity ρLVc is the product of the static liquid density by the critical excitation voltage atwhich the cavitation probability is one half. For this particular graph, the voltage was takenat the output of the function generator, before amplification. The linear fit extrapolates to−9.45 bar where Vc would be zero. This cavitation pressure is 0.2 bar above the spinodal limitof liquid helium 4, in very good agreement with theoretical predictions.
voltage V0 sin (ωt) starting at time t =0 is16
ζ(t)� AV0
2ω2[sin (ωt)−Q(1− exp (−ωt/Q)) cos (ωt)] . (2)
After the excitation stops, at time t = 2πn/ω, the oscillation ampli-tude decreases proportionally to exp (−ωt/Q) (see Fig. 7). As previouslydone in Ref. 4, we have measured Q by studying the cavitation thresh-old voltage as a function of the number n of periods in the burst. Thefit in Fig. 8 corresponds to Q = 56; it was made for n≥ 6 only because,given the polarity of the transducer (see below), the most negative ampli-tude was reached after n−1/2 periods for n≥6, but after n+1/2 periodsif n< 6. We could choose to emit waves with two different shapes, whichrespectively corresponded to two symmetric configurations (see Fig. 7):
(A) The electrical excitation starts with a negative voltage on theinner electrode of the transducer. As a result the thickness of thetransducer first decreases and the liquid is locally depressed: anacoustic wave is emitted, which starts with a negative pressure
Liquid Helium up to 160 bar 101
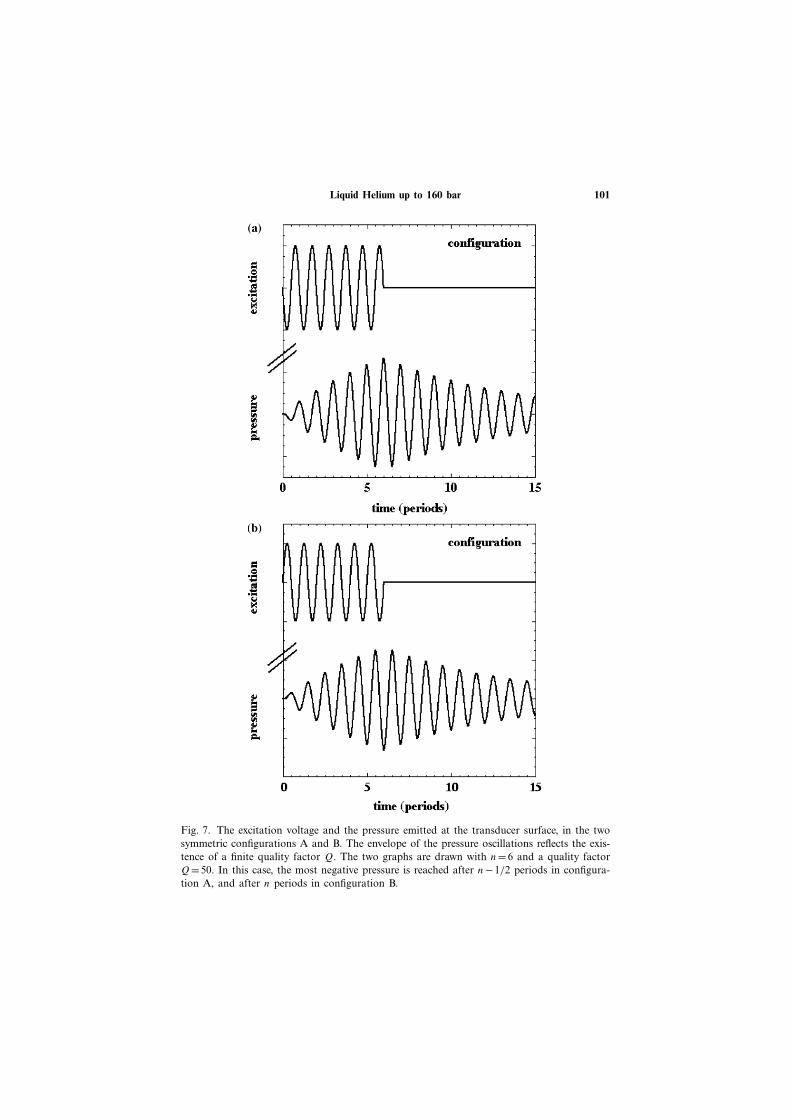
Fig. 7. The excitation voltage and the pressure emitted at the transducer surface, in the twosymmetric configurations A and B. The envelope of the pressure oscillations reflects the exis-tence of a finite quality factor Q. The two graphs are drawn with n=6 and a quality factorQ=50. In this case, the most negative pressure is reached after n−1/2 periods in configura-tion A, and after n periods in configuration B.
102 F. Werner et al.
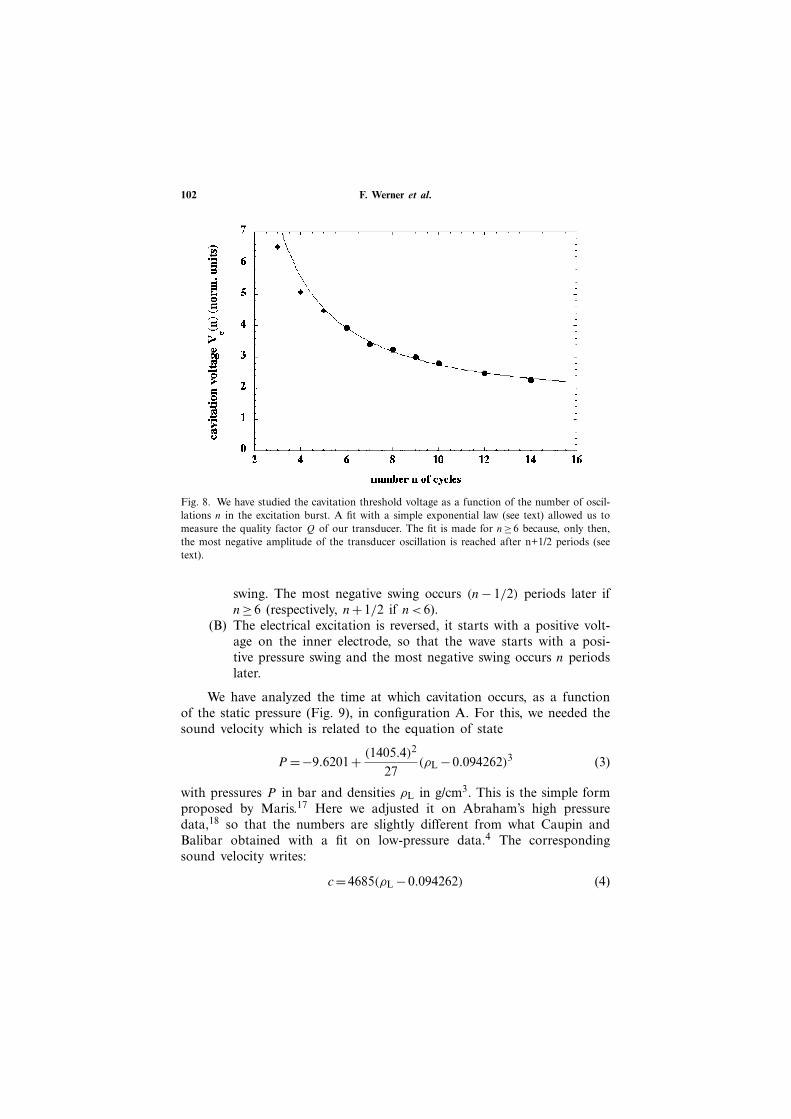
Fig. 8. We have studied the cavitation threshold voltage as a function of the number of oscil-lations n in the excitation burst. A fit with a simple exponential law (see text) allowed us tomeasure the quality factor Q of our transducer. The fit is made for n≥6 because, only then,the most negative amplitude of the transducer oscillation is reached after n+1/2 periods (seetext).
swing. The most negative swing occurs (n− 1/2) periods later ifn≥6 (respectively, n+1/2 if n<6).
(B) The electrical excitation is reversed, it starts with a positive volt-age on the inner electrode, so that the wave starts with a posi-tive pressure swing and the most negative swing occurs n periodslater.
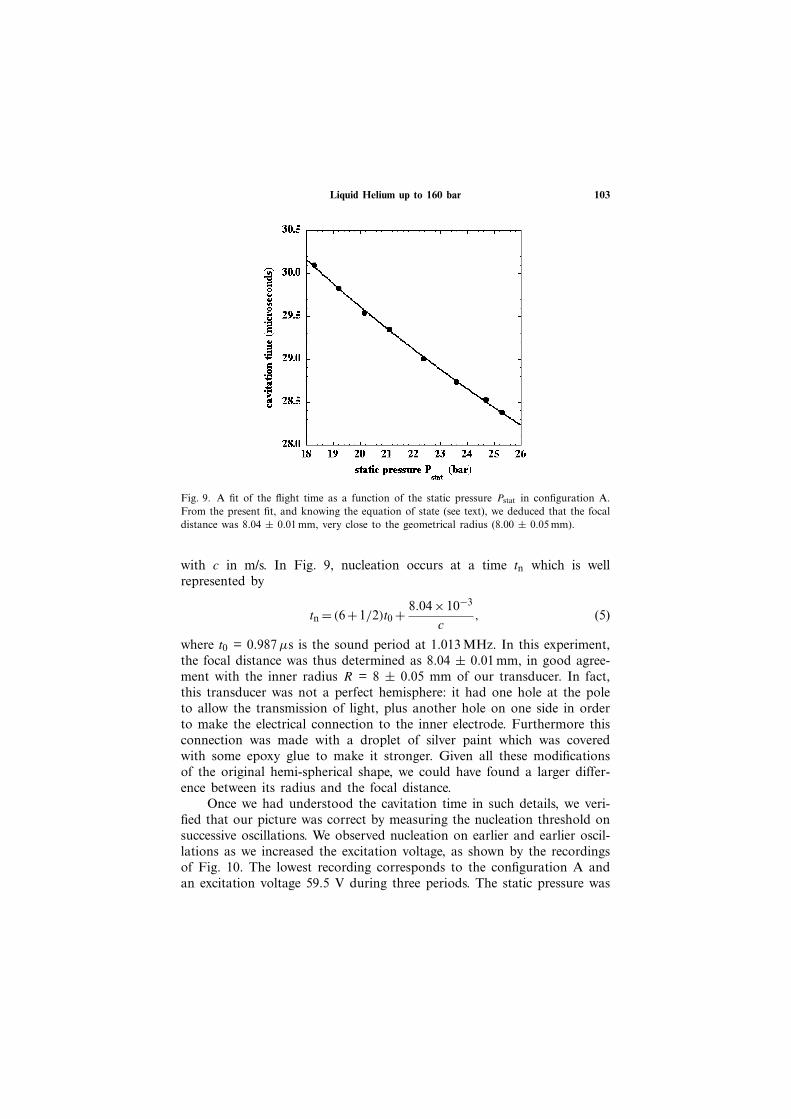
We have analyzed the time at which cavitation occurs, as a functionof the static pressure (Fig. 9), in configuration A. For this, we needed thesound velocity which is related to the equation of state
P =−9.6201+ (1405.4)2
27(ρL −0.094262)3 (3)
with pressures P in bar and densities ρL in g/cm3. This is the simple formproposed by Maris.17 Here we adjusted it on Abraham’s high pressuredata,18 so that the numbers are slightly different from what Caupin andBalibar obtained with a fit on low-pressure data.4 The correspondingsound velocity writes:
c=4685(ρL −0.094262) (4)
Liquid Helium up to 160 bar 103
Fig. 9. A fit of the flight time as a function of the static pressure Pstat in configuration A.From the present fit, and knowing the equation of state (see text), we deduced that the focaldistance was 8.04 ± 0.01 mm, very close to the geometrical radius (8.00 ± 0.05 mm).
with c in m/s. In Fig. 9, nucleation occurs at a time tn which is wellrepresented by
tn = (6+1/2)t0 + 8.04×10⁻³
c, (5)
where t0 = 0.987 µs is the sound period at 1.013 MHz. In this experiment,the focal distance was thus determined as 8.04 ± 0.01 mm, in good agree-ment with the inner radius R = 8 ± 0.05 mm of our transducer. In fact,this transducer was not a perfect hemisphere: it had one hole at the poleto allow the transmission of light, plus another hole on one side in orderto make the electrical connection to the inner electrode. Furthermore thisconnection was made with a droplet of silver paint which was coveredwith some epoxy glue to make it stronger. Given all these modificationsof the original hemi-spherical shape, we could have found a larger differ-ence between its radius and the focal distance.
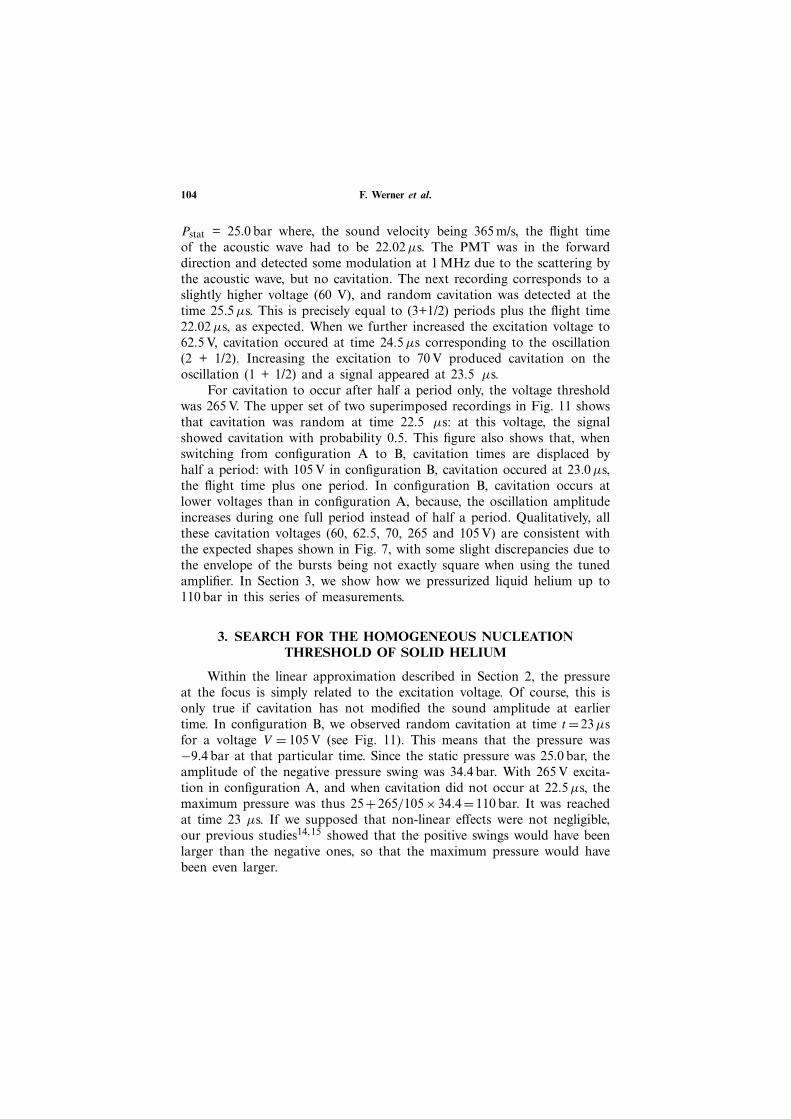
Once we had understood the cavitation time in such details, we veri-fied that our picture was correct by measuring the nucleation threshold onsuccessive oscillations. We observed nucleation on earlier and earlier oscil-lations as we increased the excitation voltage, as shown by the recordingsof Fig. 10. The lowest recording corresponds to the configuration A andan excitation voltage 59.5 V during three periods. The static pressure was
104 F. Werner et al.
Pstat = 25.0 bar where, the sound velocity being 365 m/s, the flight timeof the acoustic wave had to be 22.02 µs. The PMT was in the forwarddirection and detected some modulation at 1 MHz due to the scattering bythe acoustic wave, but no cavitation. The next recording corresponds to aslightly higher voltage (60 V), and random cavitation was detected at thetime 25.5 µs. This is precisely equal to (3+1/2) periods plus the flight time22.02 µs, as expected. When we further increased the excitation voltage to62.5 V, cavitation occured at time 24.5 µs corresponding to the oscillation(2 + 1/2). Increasing the excitation to 70 V produced cavitation on theoscillation (1 + 1/2) and a signal appeared at 23.5 µs.
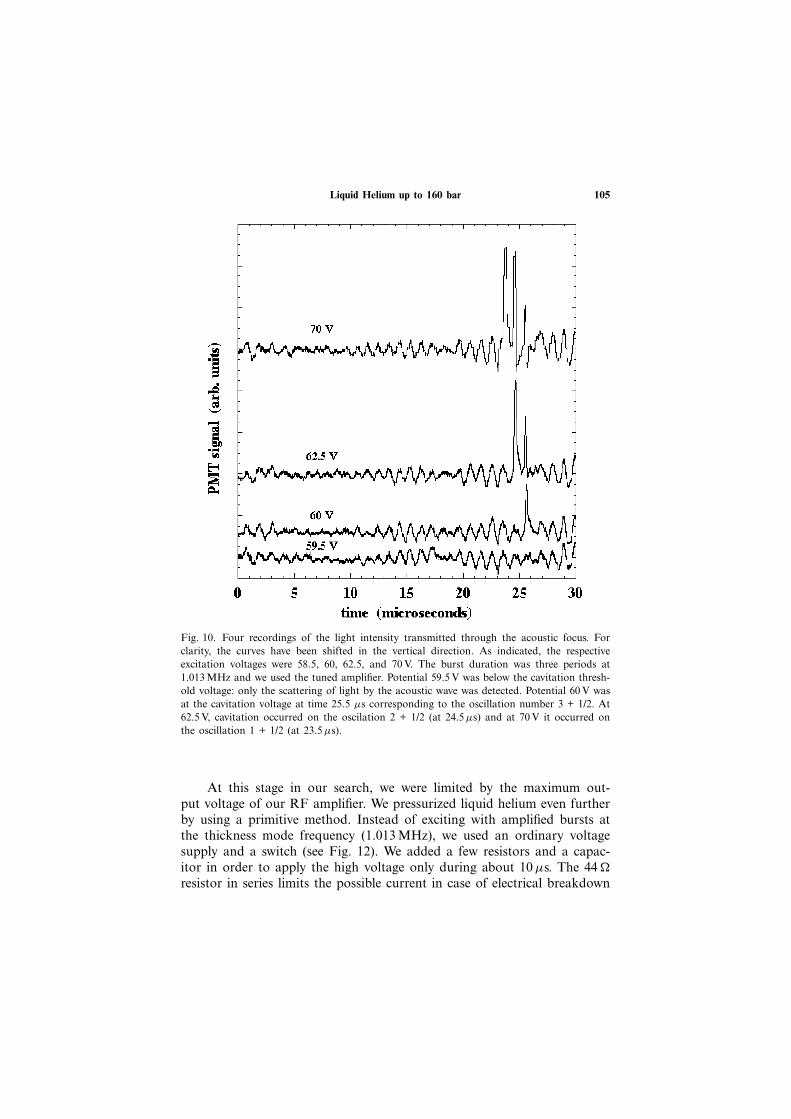
For cavitation to occur after half a period only, the voltage thresholdwas 265 V. The upper set of two superimposed recordings in Fig. 11 showsthat cavitation was random at time 22.5 µs: at this voltage, the signalshowed cavitation with probability 0.5. This figure also shows that, whenswitching from configuration A to B, cavitation times are displaced byhalf a period: with 105 V in configuration B, cavitation occured at 23.0 µs,the flight time plus one period. In configuration B, cavitation occurs atlower voltages than in configuration A, because, the oscillation amplitudeincreases during one full period instead of half a period. Qualitatively, allthese cavitation voltages (60, 62.5, 70, 265 and 105 V) are consistent withthe expected shapes shown in Fig. 7, with some slight discrepancies due tothe envelope of the bursts being not exactly square when using the tunedamplifier. In Section 3, we show how we pressurized liquid helium up to110 bar in this series of measurements.
3. SEARCH FOR THE HOMOGENEOUS NUCLEATIONTHRESHOLD OF SOLID HELIUM
Within the linear approximation described in Section 2, the pressureat the focus is simply related to the excitation voltage. Of course, this isonly true if cavitation has not modified the sound amplitude at earliertime. In configuration B, we observed random cavitation at time t =23µsfor a voltage V = 105 V (see Fig. 11). This means that the pressure was−9.4 bar at that particular time. Since the static pressure was 25.0 bar, theamplitude of the negative pressure swing was 34.4 bar. With 265 V excita-tion in configuration A, and when cavitation did not occur at 22.5 µs, themaximum pressure was thus 25+265/105×34.4 =110 bar. It was reachedat time 23 µs. If we supposed that non-linear effects were not negligible,our previous studies14,15 showed that the positive swings would have beenlarger than the negative ones, so that the maximum pressure would havebeen even larger.
Liquid Helium up to 160 bar 105
Fig. 10. Four recordings of the light intensity transmitted through the acoustic focus. Forclarity, the curves have been shifted in the vertical direction. As indicated, the respectiveexcitation voltages were 58.5, 60, 62.5, and 70 V. The burst duration was three periods at1.013 MHz and we used the tuned amplifier. Potential 59.5 V was below the cavitation thresh-old voltage: only the scattering of light by the acoustic wave was detected. Potential 60 V wasat the cavitation voltage at time 25.5 µs corresponding to the oscillation number 3 + 1/2. At62.5 V, cavitation occurred on the oscilation 2 + 1/2 (at 24.5 µs) and at 70 V it occurred onthe oscillation 1 + 1/2 (at 23.5 µs).
At this stage in our search, we were limited by the maximum out-put voltage of our RF amplifier. We pressurized liquid helium even furtherby using a primitive method. Instead of exciting with amplified bursts atthe thickness mode frequency (1.013 MHz), we used an ordinary voltagesupply and a switch (see Fig. 12). We added a few resistors and a capac-itor in order to apply the high voltage only during about 10 µs. The 44 �
resistor in series limits the possible current in case of electrical breakdown
106 F. Werner et al.
Fig. 11. These two sets of two superimposed recordings show that cavitation occurs half asound period later in configuration B than in configuration A. This is simply because thephase of the sound wave is reversed. In each case, the voltage is adjusted at the cavitationthreshold so that the detected signal shows cavitation with a probability 0.5.
Fig. 12. It appeared possible to study cavitation and overpressurized liquid helium with thissimple setup. A high voltage supply is connected to the piezoelectric transducer via a switch(a high voltage relay Meder Electronics ME12-1A69-150). Thanks to the 100 nF capacitorand the few resistors, the high voltage is applied during a time of order 10 µs only.
somewhere along the leads to the transducer. The 100 � resistor allows thecapacitor to discharge quickly after the switch is closed, while the 4 M�
resistor forces the charge of the capacitor to be slow compared to themicrosecond time scale of the experiment. Fig. 13 shows the resulting volt-age applied to the transducer when the voltage supply was set to 340 V.
Liquid Helium up to 160 bar 107
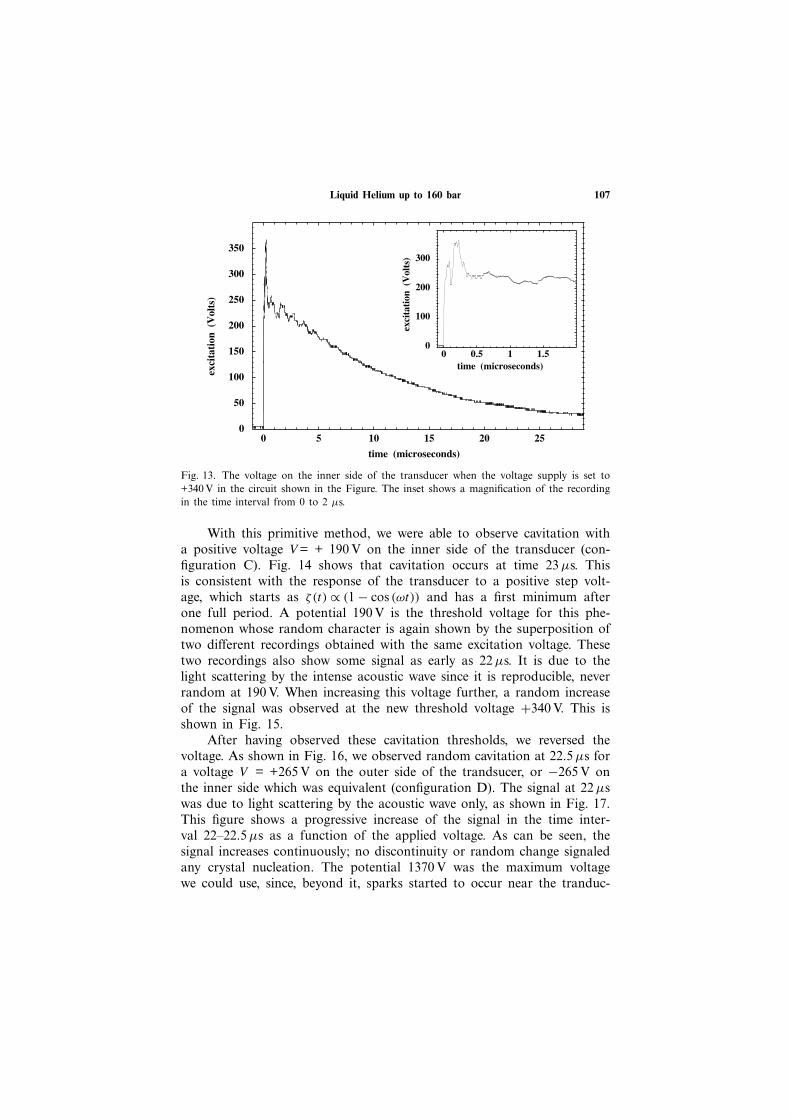
Fig. 13. The voltage on the inner side of the transducer when the voltage supply is set to+340 V in the circuit shown in the Figure. The inset shows a magnification of the recordingin the time interval from 0 to 2 µs.
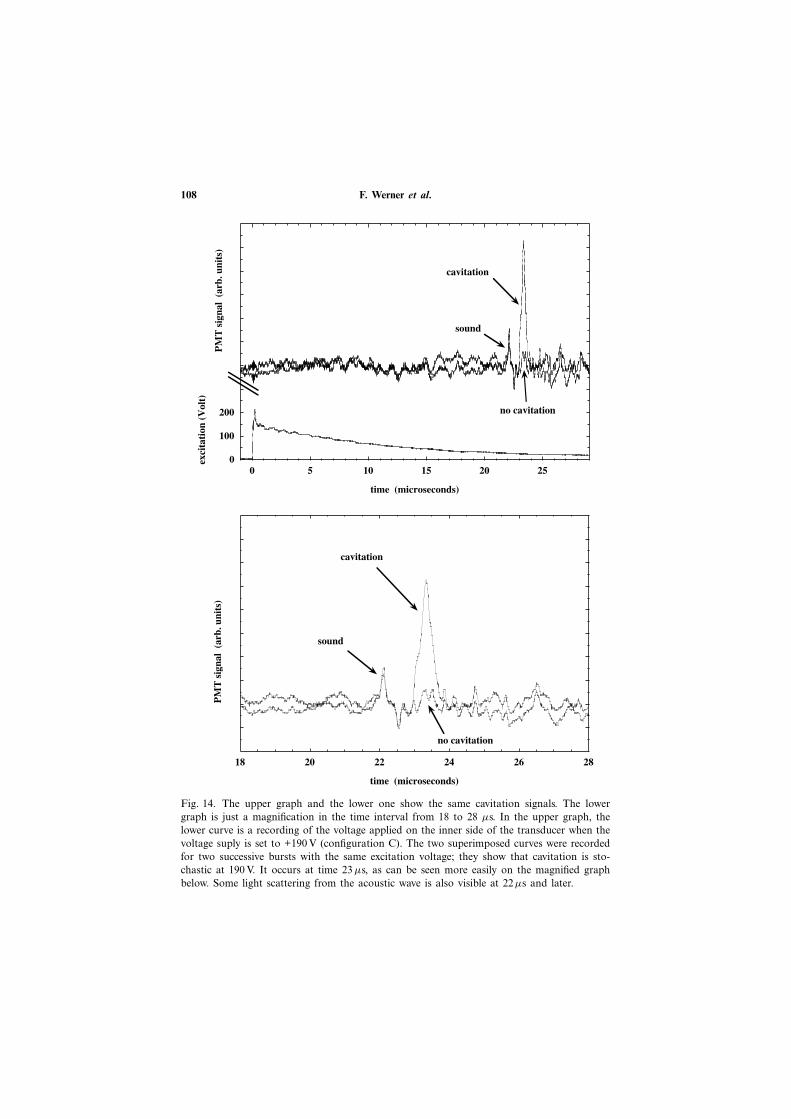
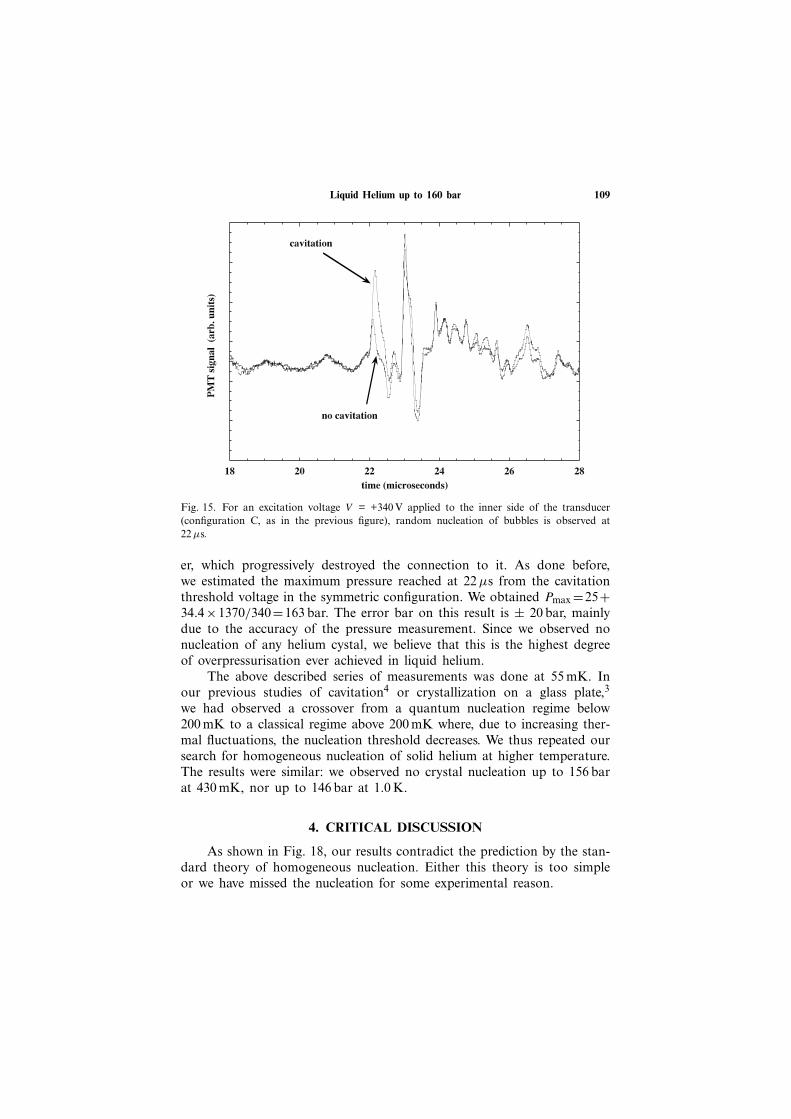
With this primitive method, we were able to observe cavitation witha positive voltage V = + 190 V on the inner side of the transducer (con-figuration C). Fig. 14 shows that cavitation occurs at time 23 µs. Thisis consistent with the response of the transducer to a positive step volt-age, which starts as ζ(t) ∝ (1 − cos (ωt)) and has a first minimum afterone full period. A potential 190 V is the threshold voltage for this phe-nomenon whose random character is again shown by the superposition oftwo different recordings obtained with the same excitation voltage. Thesetwo recordings also show some signal as early as 22 µs. It is due to thelight scattering by the intense acoustic wave since it is reproducible, neverrandom at 190 V. When increasing this voltage further, a random increaseof the signal was observed at the new threshold voltage +340 V. This isshown in Fig. 15.
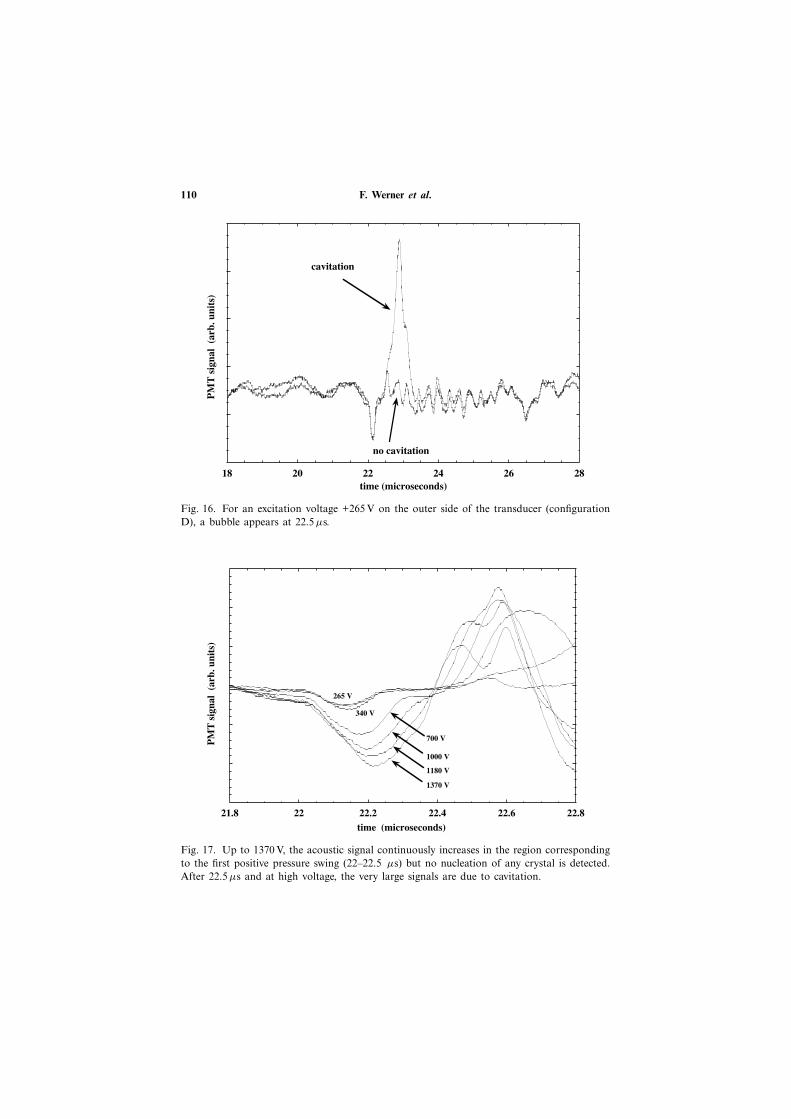
After having observed these cavitation thresholds, we reversed thevoltage. As shown in Fig. 16, we observed random cavitation at 22.5 µs fora voltage V = +265 V on the outer side of the trandsucer, or −265 V onthe inner side which was equivalent (configuration D). The signal at 22 µswas due to light scattering by the acoustic wave only, as shown in Fig. 17.This figure shows a progressive increase of the signal in the time inter-val 22–22.5 µs as a function of the applied voltage. As can be seen, thesignal increases continuously; no discontinuity or random change signaledany crystal nucleation. The potential 1370 V was the maximum voltagewe could use, since, beyond it, sparks started to occur near the tranduc-
108 F. Werner et al.
Fig. 14. The upper graph and the lower one show the same cavitation signals. The lowergraph is just a magnification in the time interval from 18 to 28 µs. In the upper graph, thelower curve is a recording of the voltage applied on the inner side of the transducer when thevoltage suply is set to +190 V (configuration C). The two superimposed curves were recordedfor two successive bursts with the same excitation voltage; they show that cavitation is sto-chastic at 190 V. It occurs at time 23 µs, as can be seen more easily on the magnified graphbelow. Some light scattering from the acoustic wave is also visible at 22µs and later.
Liquid Helium up to 160 bar 109
Fig. 15. For an excitation voltage V = +340 V applied to the inner side of the transducer(configuration C, as in the previous figure), random nucleation of bubbles is observed at22 µs.
er, which progressively destroyed the connection to it. As done before,we estimated the maximum pressure reached at 22 µs from the cavitationthreshold voltage in the symmetric configuration. We obtained Pmax =25+34.4×1370/340=163 bar. The error bar on this result is ± 20 bar, mainlydue to the accuracy of the pressure measurement. Since we observed nonucleation of any helium cystal, we believe that this is the highest degreeof overpressurisation ever achieved in liquid helium.
The above described series of measurements was done at 55 mK. Inour previous studies of cavitation4 or crystallization on a glass plate,3
we had observed a crossover from a quantum nucleation regime below200 mK to a classical regime above 200 mK where, due to increasing ther-mal fluctuations, the nucleation threshold decreases. We thus repeated oursearch for homogeneous nucleation of solid helium at higher temperature.The results were similar: we observed no crystal nucleation up to 156 barat 430 mK, nor up to 146 bar at 1.0 K.
4. CRITICAL DISCUSSION
As shown in Fig. 18, our results contradict the prediction by the stan-dard theory of homogeneous nucleation. Either this theory is too simpleor we have missed the nucleation for some experimental reason.
110 F. Werner et al.
Fig. 16. For an excitation voltage +265 V on the outer side of the transducer (configurationD), a bubble appears at 22.5 µs.
Fig. 17. Up to 1370 V, the acoustic signal continuously increases in the region correspondingto the first positive pressure swing (22–22.5 µs) but no nucleation of any crystal is detected.After 22.5 µs and at high voltage, the very large signals are due to cavitation.
Liquid Helium up to 160 bar 111
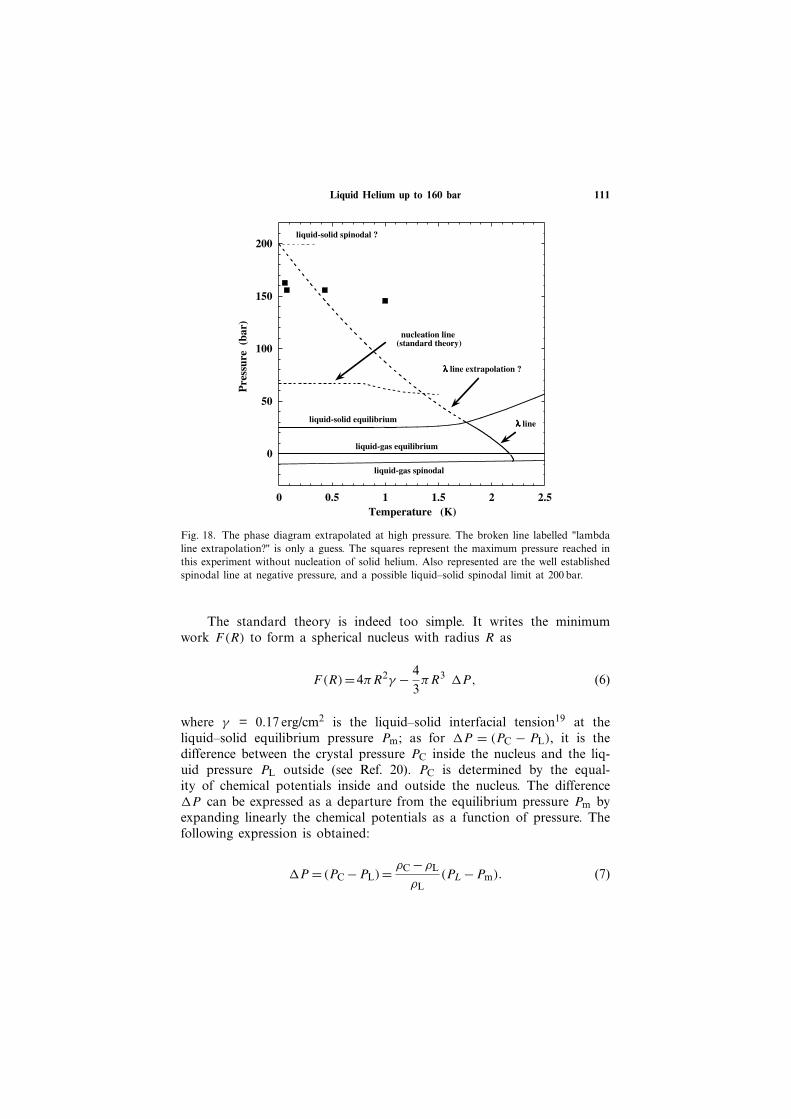
Fig. 18. The phase diagram extrapolated at high pressure. The broken line labelled "lambdaline extrapolation?" is only a guess. The squares represent the maximum pressure reached inthis experiment without nucleation of solid helium. Also represented are the well establishedspinodal line at negative pressure, and a possible liquid–solid spinodal limit at 200 bar.
The standard theory is indeed too simple. It writes the minimumwork F(R) to form a spherical nucleus with radius R as
F(R)=4πR2γ − 43πR3 �P, (6)
where γ = 0.17 erg/cm2 is the liquid–solid interfacial tension19 at theliquid–solid equilibrium pressure Pm; as for �P = (PC − PL), it is thedifference between the crystal pressure PC inside the nucleus and the liq-uid pressure PL outside (see Ref. 20). PC is determined by the equal-ity of chemical potentials inside and outside the nucleus. The difference�P can be expressed as a departure from the equilibrium pressure Pm byexpanding linearly the chemical potentials as a function of pressure. Thefollowing expression is obtained:
�P = (PC −PL)= ρC −ρL
ρL(PL −Pm). (7)
112 F. Werner et al.
Within these simple approximations, one finds a critical radius Rc =2γ /�P and an energy barrier
F(Rc)= 16πγ 3
3(�P )2. (8)
The nucleation rate is proportional to exp−[F(Rc)/kBT ].This theory is too simple for three different reasons at least. First, a
linear expansion of chemical potentials as a function of pressure is used,in other words compressibility is neglected, and this cannot be valid faraway from the equilibrium pressure Pm. Second, when describing the costin energy of a microscopic solid–liquid interface with a macroscopic quan-tity, the equilibrium interfacial tension γ , another questionnable approxi-mation is made. Furthermore, γ is taken as a pressure independant quan-tity, and this assumption has been particularly criticized by Maris andCaupin.21 On the basis of their model, which accounts for a possibleincrease of γ as a function of pressure, and also for the compressibilityof both phases, Maris and Caupin have found that the nucleation bar-rier should never be smaller than 200 K. If true, this would imply thatthe nucleation probability is negligible at any pressure on reasonable timescales, and that nucleation should never occur, except if there is an insta-bility.
Such an instability was proposed by Schneider and Enz in 1971.7
They noticed that the roton gap energy decreases with pressure, and theypostulated that it might vanish at some critical pressure Pc. On approach-ing Pc, the rotons could become a soft mode with non-zero wavelength, sothat liquid helium might spontaneously organize in a periodic state lead-ing to crystalline order. We consider this possible instability as a liquid–solid spinodal limit where the response function of the liquid divergesat the roton wavelength, typically an interatomic distance. This liquid–solid instability is reminiscent of the dimple instability which occurs for acharged liquid surface when, as a result of increasing surface charge, a softripplon mode appears at a finite wavevector.22 More recently, H.J. Marisused the density functional by Dalfovo et al.23 to calculate Pc. He foundabout 200 bar,24 a pressure at which the density is 0.237 g/cm3, accordingto Eq. (3). As explained below, we should be able to improve our experi-mental method and to reach 200 bar or more, in order to see if this insta-bility occurs.
Is it possible that nucleation occured in our experiment but that wedid not detect the nucleated crystals? We have assumed that, since thenucleated crystals were easy to detect in Chavanne’s experiment,2,3 theyshould also be easy to detect in the present one. When calculating theenergy barrier, one usually neglects dissipation (chemical potentials are
Liquid Helium up to 160 bar 113
equal on both sides of the liquid–solid interface). However, after nucle-ation, when a macroscopic crystal grows in the overpressurized liquid, thegrowth velocity has to be limited by some dissipation mechanism. This hasbeen extensively studied25 for small departures form equilibrium: the sim-ple relation
v =k �µ (9)
links the growth velocity v to the driving force
�µ=µL −µC = ρC −ρL
ρCρL(P −Pm) , (10)
where µ is per unit mass, ρL is the liquid density and ρC the crystal den-sity. The growth resistance k−1 is known to be very small in the low-temperature limit (k−1 ≈ 3 ×T 4 cm/s with T in Kelvin25). Chavanne et al.observed a growth velocity v of order 100 m/s for an overpressure P −Pm = 4.3 bar. This was very fast, although not as fast as what one wouldextrapolate from Eq. (9). Of course, one does not expect crystals to growfaster than the speed of sound (366 m/s at the melting pressure), but still,when we applied 140 bar in this experiment, instead of 4.3 bar as in Chav-anne’s experiement, the crystals should grow even faster and be easier todetect. This is our main reason to believe that we have not detected crys-tals because they did not nucleate.
However, the fast growth rate of helium crystals is associated with theliquid being a superfluid. In particular, it seems necessary that the growthresistance has no contribution from viscous effects in the liquid which pro-vides the necessary mass flow. We thus come to an interesting question:is liquid helium superfluid at 163 bar? The lambda line in stable liquidhelium is known to have a negative slope dTλ/dP . This is understood as aconsequence of the density increase which makes the long-range quantumcoherence due to particle exchange more and more difficult as the den-sity increases.26 It can also be calculated from the decrease of the rotongap as a function of pressure. In the metastable state at high pressure, theproperties of liquid helium are nearly unknown but one can try to predictthem. Caupin and Balibar27 explained that the lambda line should meetthe T =0 axis in the phase diagram at the instability pressure Pc where theroton gap vanishes. To calculate the pressure variation of the lambda linerequires the use of a roton liquid theory whose parameters are unknownat high pressure, so that it has not yet been done, and one must rely onextrapolations with no rigorous justifications.
We have done the simplest possible extrapolation of the lambda lineby using a second-order polynomial form, from the stable region to the(T = 0, P = 200 bar) point. According to this, one expects a superfluid to
114 F. Werner et al.
normal transition to occur around 190 bar at 50 mK (see Fig. 18). Evenif we accounted for some adiabatic warming in the acoustic wave duringcompression, the temperature would keep below 100 mK at 163 bar and asuperfluid to normal transition should not occur.28 However, the lambdaline in Fig. 18 is rather speculative, and we cannot exclude the possibilitythat superfluidity is destroyed during the largest positive pressure swingsin our experiments, especially for our 1 K measurement. Normal liquidhelium might even become very viscous, perhaps glassy. In such a case,the growth of crystals could become very slow and the nucleation of crys-tals impossible to observe because, in a fraction of a microsecond, thesecrystals would never grow to the micrometer size which is necessary fortheir detection. Now, if one reaches an instability at 200 bar, then a den-sity change should be detectable with our technique even if the liquid ishighly viscous. Once more, improvements of our experimental techniquesare required in order to obtain some answers to these new questions.
5. CONCLUSION AND PERSPECTIVES
In this article, we have presented experimental results which lead tonew theoretical questions. We have reached degrees of overpressurizationin liquid helium which had never been achieved before by pressurizing liq-uid helium with ultrasound bursts during a fraction of a microsecond. Wehave found that, in such conditions, nucleation of solid helium does notoccur in liquid helium up to 163 bar, far beyond the nucleation thresh-old predicted by the standard theory of homogeneous nucleation. We haveexplained why this standard theory is too simple for any accurate predic-tion so that much more elaborate theories are needed. Our results leadto new questions which concern the pressure dependence of the liquid-solid interfacial tension, the possible existence of a liquid-solid instabilityat 200 bar and the shape of the superfluid transition line in the metastableregion of the phase diagram, at high pressure.
In the future, we plan to change our hemispherical transducer for aspherical one. This can easily be done by gluing two hemispheres facingeach other. The previous experiments by Chavanne et al. in a quasi-spher-ical geometry2,3 have shown that spherical waves are highly non-linearso that their positive swings are very large compared to their negativeones. These effects would allow us to reach larger overpressures withouttriggering cavitation during the previous negative swing of the wave. Theoutput power of our present amplifiers seems largely sufficient to detectthe homogeneous nucleation of helium crystals if it occurs near an insta-bility line around 200 bar. For this future series of experiments, we antic-ipate problems of calibration of the wave amplitude and the nucleation
Liquid Helium up to 160 bar 115
threshold pressure. We hope to do this by improving the numerical simula-tion of the focusing of large amplitude sound waves which we have startedin collaboration with C. Appert et al.15
ACKNOWLEDGMENTS
We are grateful to H.J. Maris and D.M. Ceperley for many fruitfuldiscussions.
REFERENCES
1. S. Balibar, T. Mizusaki, and Y. Sasaki, J. Low Temp. Phys. 120, 293 (2000).2. X. Chavanne, S. Balibar, and F. Caupin, Phys. Rev. Lett. 86, 5506 (2001).3. X. Chavanne, S. Balibar, and F. Caupin, J. Low Temp. Phys. 125, 155 (2001).4. F. Caupin and S. Balibar, Phys. Rev. B 64, 064507 (2001).5. S. Balibar, B. Castaing and C. Laroche, J. Phys. (Paris) Lett. 41, 283 (1980); V.L. Tsym-
balenko, J. Low Temp. Phys. 88, 55 (19); J.P. Ruutu, P.J. Hakonen, J.S. Penttila, A. V.Babkin, J. P. Saramaki and E. B. Sonin, Phys. Rev. Lett. 77, 2514 (1996); Y. Sasaki andT. Mizusaki, J. Low Temp. Phys. 110, 491 (1998); T. A. Johnson and C. Elbaum, Phys.Rev. E 62, 975 (2000).
6. F. Caupin, S. Balibar, and H. J. Maris, Physica B 329–333, 356 (2003).7. T. Schneider and C. P. Enz, Phys. Rev. Lett. 27, 1186 (1971).8. J. Nissen, E. Bodegom, L. C. Brodie, and J. S. Semura, Phys. Rev. B 40, 6617 (1989).9. S. Balibar, X. Chavanne and F. Caupin, Physica B 329–333, 380 (2003).
10. K. O. Keshishev, A. Ya. Parshin and A. V. Babkin, Zh. Eksp. Teor. Fiz. 80, 716 (1981)[Sov. Phys. JETP 53, 362 (1981)].
11. J. Bodensohn, K. Nicolai, and P. Leiderer, Z. Phys. B 64, 55 (1986).12. S. Balibar, H. Alles and A. Ya. Parshin, submitted to Rev. Modern Phys. (2004).13. L. Darrasse, Rev. Sci. Instrum. 53, 1561 (1982).14. X. Chavanne, S. Balibar, F. Caupin, C. Appert, and D. d’Humires , J. Low Temp. Phys.
126, 643 (2002).15. C. Appert, C. Tenaud, X. Chavanne, S. Balibar, F. Caupin, and D. d’Humieres, Eur.
Phys. J. B 35, 531 (2003).16. In Ref. 4, the inertia of the transducer was neglected so that no phase shift was predicted
between the excitation voltage and the transducer response. Here, we find a (π/2) phaseshift. We are grateful to H. J. Maris who first mentioned this former mistake to us.
17. H. J. Maris, Phys. Rev. Lett. 66, 45 (1991).18. B. Abraham, Y. Eckstein, J. B. Ketterson, M. Kuchnir, and P. R. Roach, Phys. Rev. A 1,
250 (1970).19. D. O. Edwards, M. S. Pettersen, and H. Baddar, in Excitations in 2D and 3D Quantum
Fluids, eds. A. F. G. Wyatt and H. J. Lauter (Plenum Press, New York, 1991), p.361.20. L. D. Landau and E. M. Lifshitz, Course of Theoretical Physics, Vol. 5, Statistical Phys-
ics (Pergamon press, Oxford, 1980), p. 533.21. H. J. Maris and F. Caupin, J. Low Temp. Phys. 131, 145 (2003).22. P. Leiderer, J. Low Temp. Phys. 87, 247 (1992).23. F. Dalfovo, A. Lastri, L. Pricaupenko, S. Stringari, and J. Treiner, Phys. Rev. B 52, 1193
(1995).24. H. J. Maris, private communication, unpublished.25. K. O. Keshishev, A. Ya. Parshin, and A. V. Babkin, Pis’ma Zh. Eksp. Teor. Fiz 30, 63
(1979) [Sov. Phys. JETP Lett. 30, 56 (1979)]; R. M. Bowley and D. O. Edwards, J. Phy-sique (France) 44, 723 (1983); E. Rolley, C. Guthmann, E. Chevalier, and S. Balibar,J. Low Temp. Phys. 99, 851 (1995).
116 F. Werner et al.
26. G. H. Bauer, D. M. Ceperley, and N. Goldenfeld, Phys. Rev. B 61, 9055 (2000).27. F. Caupin and S. Balibar, in Liquids Under Negative Pressure, eds., A. R. Imre et al.
(Kluwer Academic Publishers, 2002), p. 201.28. We have looked for some evidence of the liquid undergoing a superfluid to normal tran-
sition at high pressure and low temperature. A change in compressibility at such a tran-sition could show up as some distortion in the shape of the acoustic wave, consequentlyin the signal from the light scattering by the sound pulse. We have not found convincingevidence that such a distortion occurs at any well defined amplitude of the wave.
29. H. J. Maris, private communication (2004).