Embed Size (px)
Citation preview
<Author> Eleftheria Karagiorgou
<Author> Sevasti Tsiliki
Liquid Data
<Keywords> physical computing, acidity, water, liquid, temperature, pH, data logging
<Disciplines> chemistry
<Age level of the students> 16
<Hardware> Arduino starter kit[1], data logging shield, temperature sensor, pH sensor, SD card
<Language> Arduino IDE – Wiring C[2]
<Programming level> medium
<Duration of the project> 7 teaching hours
<Summary>This teaching unit is an interdisciplinary approach using physical computing and chemistry. The students take on the role of researchers and conduct an experiment to determine whether there is a relationship between the acidity and the temperature of water. This will require the use of Arduino and chemistry.
<Conceptual introduction>This educational activity was created to demonstrate to the students how physical computing can be integrated into STEM education, and more specifically, into chemistry by using innovative teaching methods. It was carried out as an extra-curricular activity during our school's Robotics and STEM club, which meets for two hours every Sunday afternoon.
The students took on the role of researchers and were tasked with proving the significant role that temperature plays in pH measurements. As the temperature rises, molecular vibra-tions increase, which allows water to ionise and form more hy-drogen ions. This causes the pH level to drop as a result.
<Teaching method>Inquiry-based science education: we wanted to involve our students in an active learning project, based on questions which then generate further questions as the students pro-gress through the research project. In this way, the students become researchers and learn by doing a practical activity.
<Prerequisites—background knowledge>According to the Greek curriculum:
↪basic knowledge of programming that was acquired during the 3rd year of junior high school and during the 1st year of senior high school ↪basic knowledge of acidity and pH theory that was acquired during the 3rd year of junior high school
<Teaching materials/space used>The Educational Robotics and STEM lab of the school contains the following:
↪Arduino[1] starter kit (includes an Arduino board, cables, LCD screen, etc.) ↪Adafruit Data Logger Shield for Arduino (e1) ↪Analog pH meter Pro Kit for Arduino (e2) ↪Waterproof temperature sensor (e3) ↪SD card ↪A computer with an SD port, such as a laptop, is necessary for the coding and the data logging parts of this teaching unit ↪Demineralised water (purified water that has had most or all of its mineral and salt ions removed) ↪ Ice packs and a cooler to preserve the ice cubes
<Info>
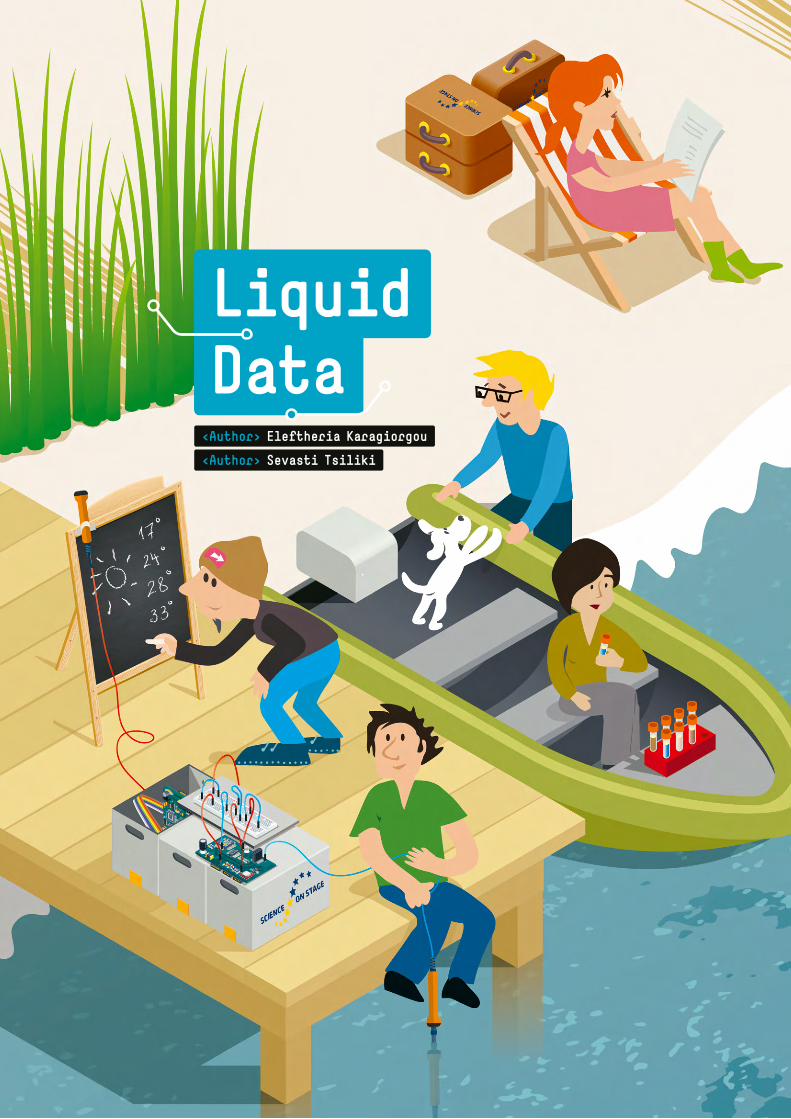
e 1: An Adafruit Data Logger Shield for Arduino[3]
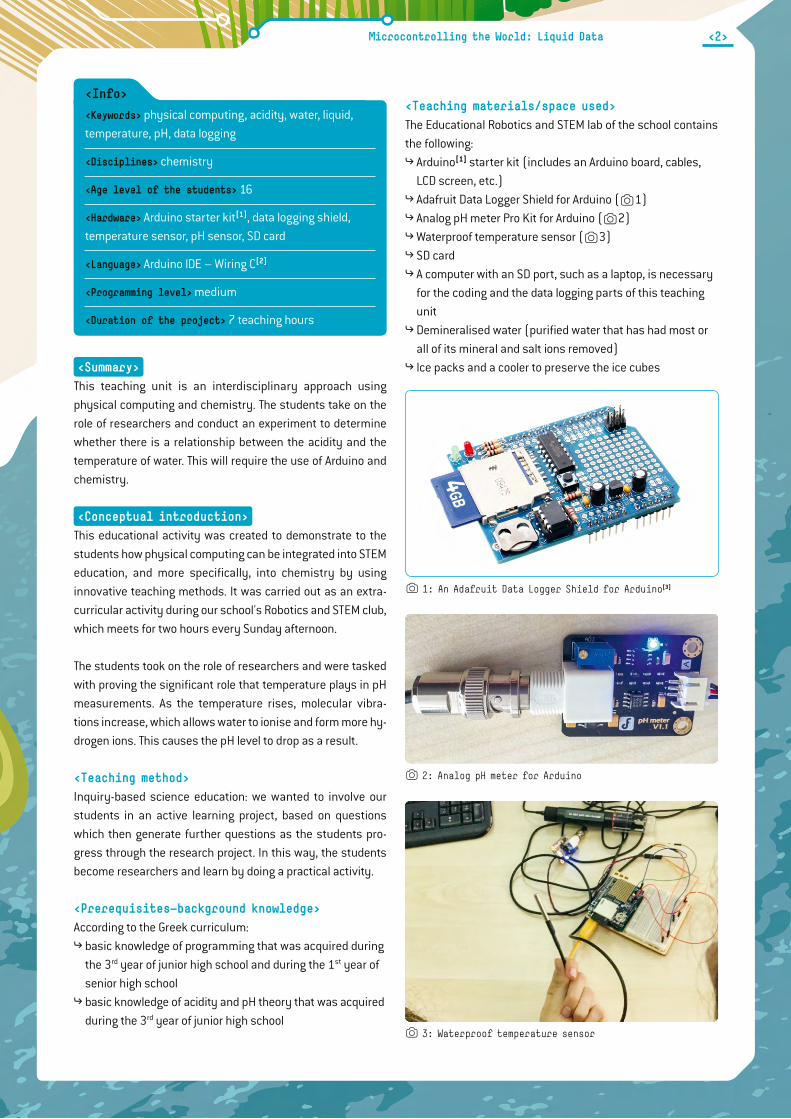
e 2: Analog pH meter for Arduino
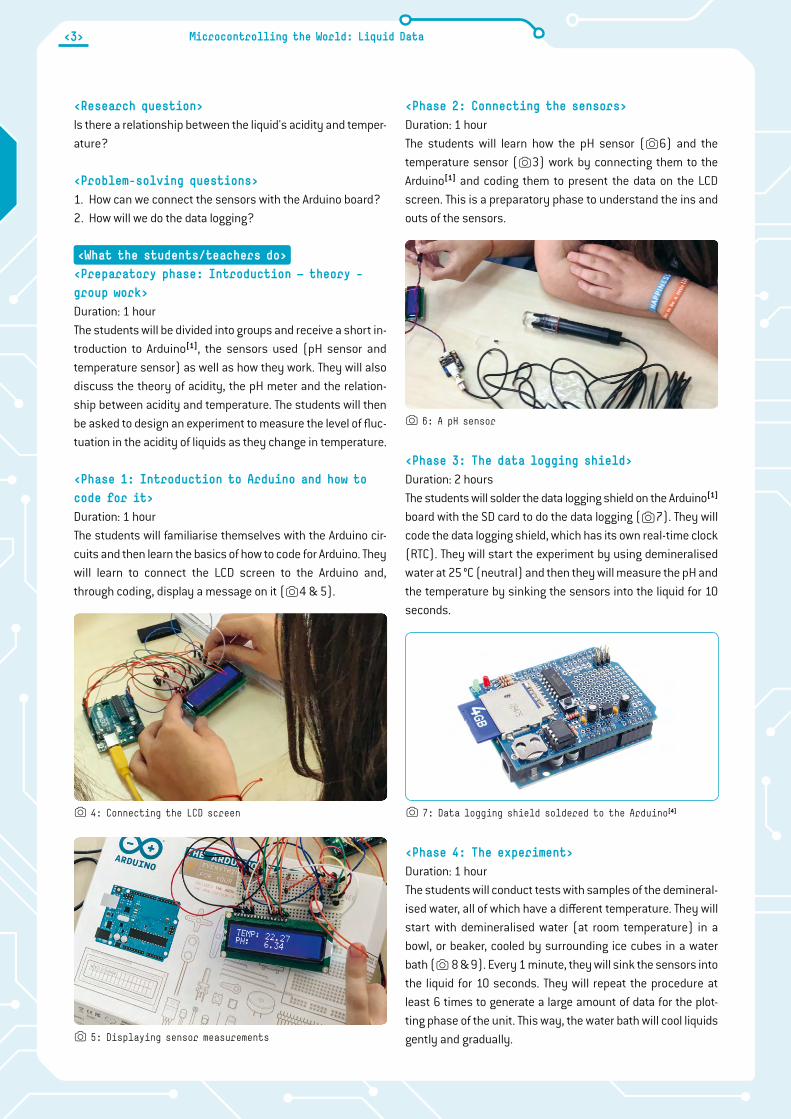
e 3: Waterproof temperature sensor
<2>Microcontrolling the World: Liquid Data
<Research question>Is there a relationship between the liquid's acidity and temper-ature?
<Problem-solving questions>1. How can we connect the sensors with the Arduino board?2. How will we do the data logging?
<What the students/teachers do><Preparatory phase: Introduction — theory – group work>Duration: 1 hourThe students will be divided into groups and receive a short in-troduction to Arduino[1], the sensors used (pH sensor and temperature sensor) as well as how they work. They will also discuss the theory of acidity, the pH meter and the relation-ship between acidity and temperature. The students will then be asked to design an experiment to measure the level of fluc-tuation in the acidity of liquids as they change in temperature.
<Phase 1: Introduction to Arduino and how to code for it>Duration: 1 hourThe students will familiarise themselves with the Arduino cir-cuits and then learn the basics of how to code for Arduino. They will learn to connect the LCD screen to the Arduino and, through coding, display a message on it (e4 & 5).
<Phase 2: Connecting the sensors>Duration: 1 hourThe students will learn how the pH sensor (e6) and the temperature sensor (e3) work by connecting them to the Arduino[1] and coding them to present the data on the LCD screen. This is a preparatory phase to understand the ins and outs of the sensors.
<Phase 3: The data logging shield>Duration: 2 hoursThe students will solder the data logging shield on the Arduino[1] board with the SD card to do the data logging (e7). They will code the data logging shield, which has its own real-time clock (RTC). They will start the experiment by using demineralised water at 25 °C (neutral) and then they will measure the pH and the temperature by sinking the sensors into the liquid for 10 seconds.
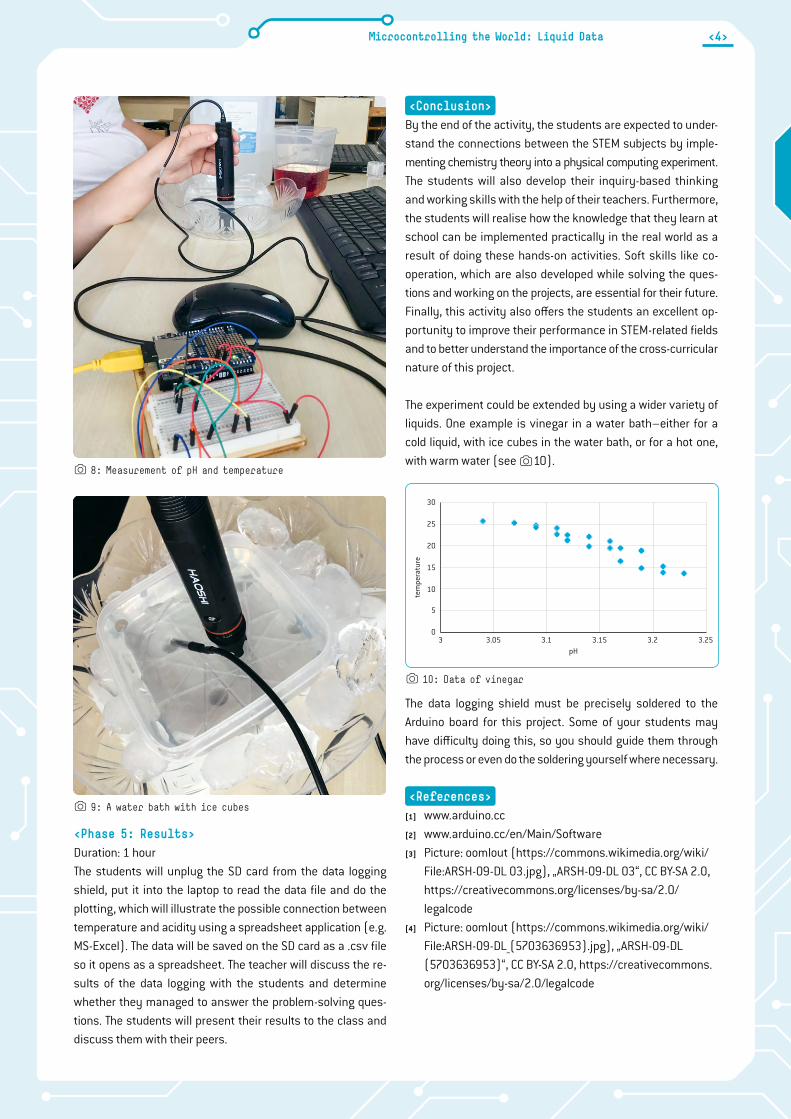
<Phase 4: The experiment>Duration: 1 hourThe students will conduct tests with samples of the demineral-ised water, all of which have a different temperature. They will start with demineralised water (at room temperature) in a bowl, or beaker, cooled by surrounding ice cubes in a water bath (e 8 & 9). Every 1 minute, they will sink the sensors into the liquid for 10 seconds. They will repeat the procedure at least 6 times to generate a large amount of data for the plot-ting phase of the unit. This way, the water bath will cool liquids gently and gradually.
e 4: Connecting the LCD screen
e 5: Displaying sensor measurements
e 6: A pH sensor
e 7: Data logging shield soldered to the Arduino[4]
<3> Microcontrolling the World: Liquid Data
<Phase 5: Results>Duration: 1 hourThe students will unplug the SD card from the data logging shield, put it into the laptop to read the data file and do the plotting, which will illustrate the possible connection between temperature and acidity using a spreadsheet application (e.g. MS-Excel). The data will be saved on the SD card as a .csv file so it opens as a spreadsheet. The teacher will discuss the re-sults of the data logging with the students and determine whether they managed to answer the problem- solving ques-tions. The students will present their results to the class and discuss them with their peers.
<Conclusion>By the end of the activity, the students are expected to under-stand the connections between the STEM subjects by imple-menting chemistry theory into a physical computing experiment. The students will also develop their inquiry-based thinking and working skills with the help of their teachers. Furthermore, the students will realise how the knowledge that they learn at school can be implemented practically in the real world as a result of doing these hands-on activities. Soft skills like co-operation, which are also developed while solving the ques-tions and working on the projects, are essential for their future. Finally, this activity also offers the students an excellent op-portunity to improve their performance in STEM-related fields and to better understand the importance of the cross-curricular nature of this project.
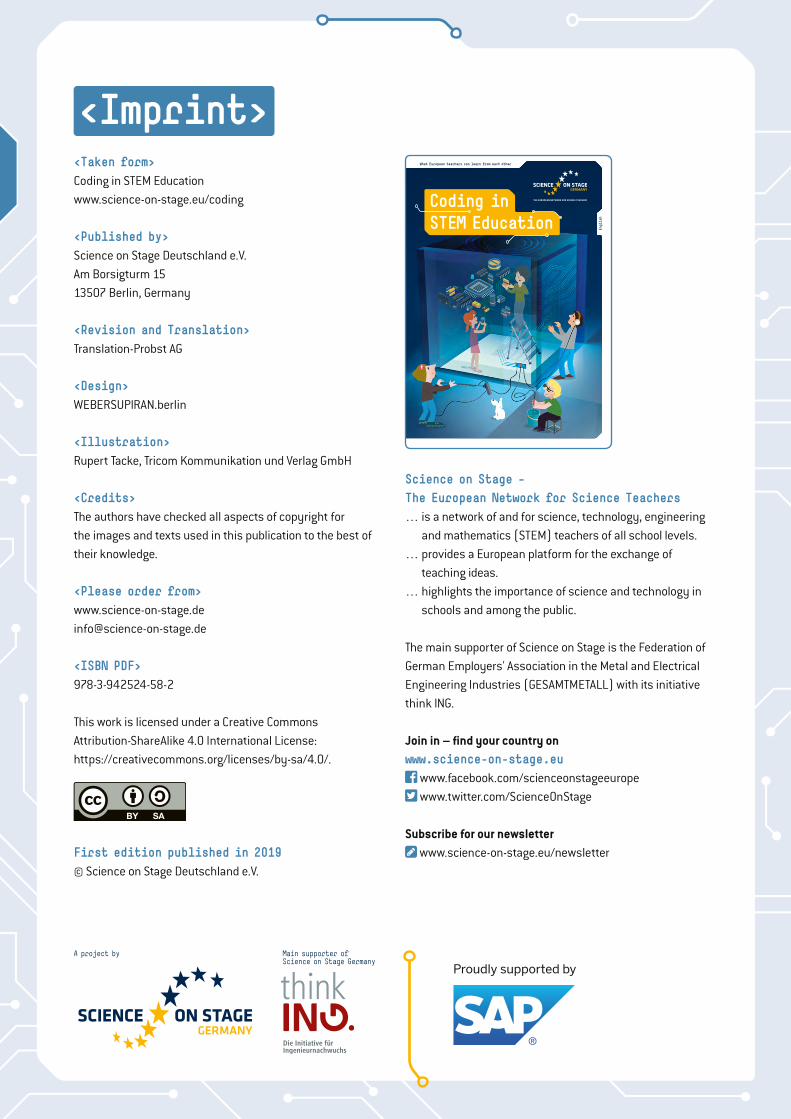
The experiment could be extended by using a wider variety of liquids. One example is vinegar in a water bath–either for a cold liquid, with ice cubes in the water bath, or for a hot one, with warm water (see e10).
The data logging shield must be precisely soldered to the Arduino board for this project. Some of your students may have difficulty doing this, so you should guide them through the process or even do the soldering yourself where necessary.
<References>[1] www.arduino.cc[2] www.arduino.cc/en/Main/Software[3] Picture: oomlout (https://commons.wikimedia.org/wiki/
File:ARSH-09-DL 03.jpg), „ARSH-09-DL 03“, CC BY-SA 2.0, https://creativecommons.org/licenses/by-sa/2.0/legalcode
[4] Picture: oomlout (https://commons.wikimedia.org/wiki/File:ARSH-09-DL_(5703636953).jpg), „ARSH-09-DL (5703636953)“, CC BY-SA 2.0, https://creativecommons.org/licenses/by-sa/2.0/legalcode
e 8: Measurement of pH and temperature
e 9: A water bath with ice cubes
0
5
10
15
20
25
30
pH3 3.05 3.1 3.15 3.2 3.25
tem
pera
ture
e 10: Data of vinegar
<4>Microcontrolling the World: Liquid Data
Main supporter ofScience on Stage Germany
A project by
Science on Stage – The European Network for Science Teachers… is a network of and for science, technology, engineering
and mathematics (STEM) teachers of all school levels.… provides a European platform for the exchange of
teaching ideas.… highlights the importance of science and technology in
schools and among the public.
The main supporter of Science on Stage is the Federation of German Employers' Association in the Metal and Electrical Engineering Industries (GESAMTMETALL) with its initiative think ING.
Join in – find your country onwww.science-on-stage.euFacebook-square www.facebook.com/scienceonstageeuropeTwitter-square www.twitter.com/ScienceOnStage
Subscribe for our newsletter www.science-on-stage.eu/newsletter
Coding inSTEM Education
What European teachers can learn from each other
English
Main supporter ofScience on Stage Germany
A project by
www.science-on-stage.de
English
Coding in STEM Education
ws18038_SonSDE_Coding in STEM EN Umschlag PROD.indd 76-78 01.02.19 14:10
<Imprint><Taken form>Coding in STEM Educationwww.science-on-stage.eu/coding
<Published by>Science on Stage Deutschland e.V.Am Borsigturm 1513507 Berlin, Germany
<Revision and Translation>Translation-Probst AG
<Design>WEBERSUPIRAN.berlin
<Illustration>Rupert Tacke, Tricom Kommunikation und Verlag GmbH
<Credits>The authors have checked all aspects of copyright for the images and texts used in this publication to the best of their knowledge.
<Please order from>[email protected]
<ISBN PDF>978-3-942524-58-2
This work is licensed under a Creative Commons Attribution-ShareAlike 4.0 International License: https://creativecommons.org/licenses/by-sa/4.0/.
First edition published in 2019© Science on Stage Deutschland e.V.