Embed Size (px)
Citation preview
Liquid crystal tunable filters and polarization controllers for biomedical optical imaging
Ofir Aharon, Avner Safrani, Riki Moses, I. Abdulhalim*
Department of Electro-optic Engineering, Ben-Gurion University of the Negev, P.O.Box 653, Beer Sheva 84105, Israel
(Invited Paper)
ABSTRACT
Liquid crystal (LC) devices exhibit fast and strong tuning and switching capabilities using small voltages and can be miniaturized thus have a great potential to be used with miniature optical imaging systems for biomedical applications. LC devices designed specifically for integration into biomedical optical imaging systems are presented. Using a combination of one or two LC retarders we obtained polarimetric imaging of the skin. LC tunable filters with high dynamic range and large throughput are designed for hyperspectral imaging and for spectral domain optical coherence tomography. The designs are based on several concepts both using the classical stack of retarders and using more modern designs based on single layer in a waveguide or in a Fabry-Perot cavity. Keywords: Tunable LCs filter, Tunable retarders, biomedical optics, modulators, skin imaging.
1. INTRODUCTION
Liquid crystal devices can perform control of the wavelength, polarization and phase so they can be used to improve the performance of optical imaging systems for biomedical applications. Optical imaging methods and systems are used now for variety of biomedical applications such as skin cancer diagnosis, optical coherence tomography (OCT) based colon cancer endoscopic imager, retinal eye imager for glaucoma and hypoxia diagnosis in combination with a number of novel liquid crystal devices. The new methods allow early detection of cancer and other diseases such as diabetes through retinal imaging. These methods also help investigate the early processes of disease formation because they allow higher resolution and contrast through the combined hyperspectral, polarimetric and adaptive techniques that can be achieved with liquid crystal devices. LC devices have been largely developed for displays and in the last decade for optical telecommunications, however their application in the field of optical imaging just started to emerge. Using their large optical anisotropy, large electrooptic effect, fast tunability and ease of fabrication, make them excellent candidates for tunable filtering, polarization control and phase or intensity modulators for adaptive optics, OCT, polarimetric and hyperspectral imaging (HSI). Three basic categories among widely used optical filters are sub-wavelength gratings1 (with artificial ordinary and extraordinary indices), cavity based filter2 and birefringent filter3. Birefringence filters include mainly birefringent plates and liquid crystals (LC) cells which can be controlled and tuned. Tunable filters are most commonly used for optical telecommunication4 but lately also for biomedical spectral imaging such as Raman chemical imaging5,6 and fluorescence microscopy applications. The design of an optical filter is against two major parameters, the bandwidth defined the full width at half maximum (FWHM) of its main output peak and the free spectral range (FSR) or the dynamic range, these two parameters are very desirable for wavelength filtering and tuning. In cases when a very narrow bandwidth is needed for highly selective filters, the throughput power is usually degraded due to a multiple usage of birefringence plates of LC retarders with polarizers. For the majority of biomedical applications the bandwidth requirement is moderate, for example for fluorescence and HIS, 20nm FWHM is adequate while for frequency domain OCT, 1nm FWHM is required.
The LC tunable filter (LCTF) is a birefringent filter, which uses the retardation in phase between the ordinary and extraordinary light rays passing through the LC creating constructive and destructive interference, to pass a single wavelength of light. By combining several electronically tunable LC retarders in series, high spectral resolution can be achieved. LCTF have the advantages of not just miniaturization of the designed system but also tuning the centre wavelength with no physical movements and the capability of rapid wavelength selection with microsecond to millisecond tuning speeds. The dynamic spectral range obtained by using these filters can be as large as few hundreds of nm thus covering the whole visible range. For biomedical imaging the interest is usually in the therapeutic window (750-1300nm) which can also be covered with LC devices. Our objective is to explore the potential of a number of novel liquid crystal devices in enhancing the functionality of optical imaging systems.
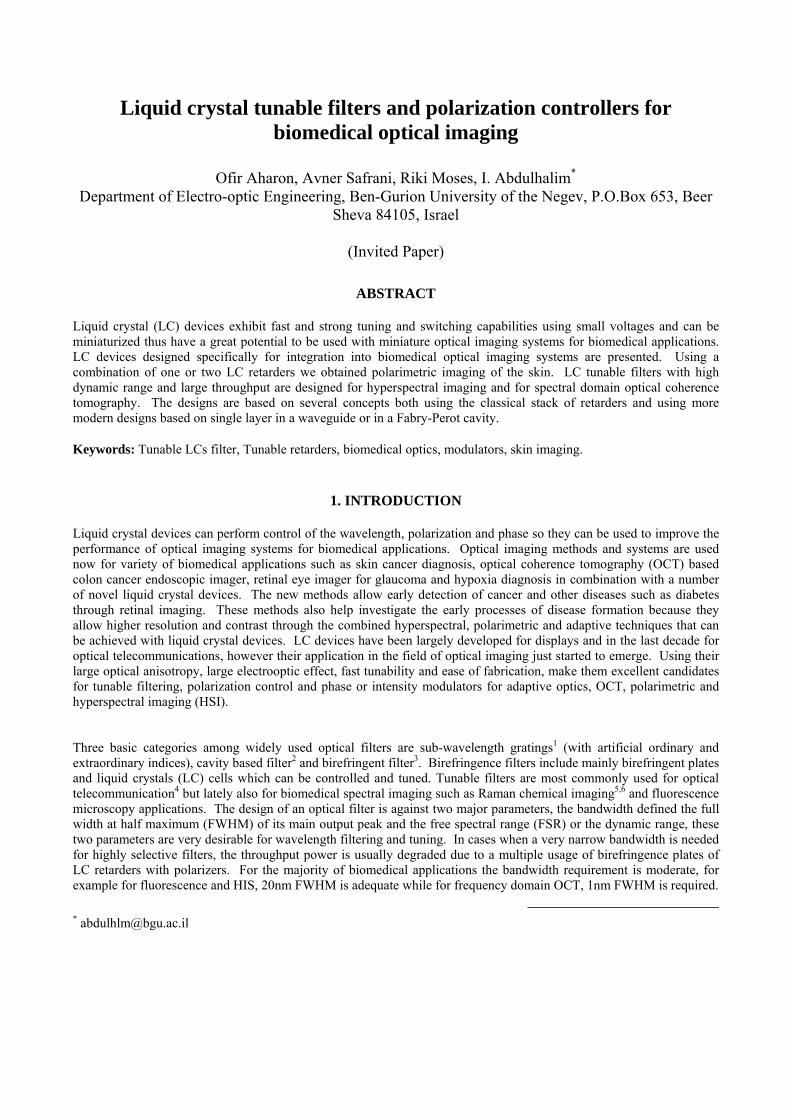
1.1 Polarization interference filters: A birefringent filter can essentially be thought of as a beam interferometer. Consisting of birefringent optical elements between any number of polarizers, the filter acts to induce a phase shift between the various field components. A final analyzing polarizer is used to produce interference between these components so as to pass certain components while blocking others. By appropriate orientation of the birefringent elements and the polarizers, a filter can be designed to have passband as narrow as few nanometers or less. These filters play an important role in many optical systems where filters of very narrow bandwidth with wide angular fields or tuning capability are required. In solar physics, for example, the distribution of hydrogen may be measured by photographing the solar corona (at the vicinity line of λ=656.3nm) facing a large amount of light at the neighboring wavelength, a filter of extremely narrow bandwidth is required if reasonable discrimination is to be attained. The same is true for Raman imaging. Such filters consist of active, passive or combinations of crystal plates as well as LC retarders controlled by electric or magnetic field in some cases, all based on birefringence characteristics. The two basic variations of these birefringent filters are Lyot7-Öhman8 filters and succeeded by the Šolc filters9 which improved upon the Lyot filter’s low light throughput, see figure 1 and
figure 2. Šolc’s designs were studied by Evans10, who succeeded in generalizing their transmission characteristics into a compact formula by using the Jones-matrix method. Other improvement done to the optical throughput performance of the Lyot filter by designing the Evans split-element filter11 which reduced the number of polarizers in the system.
1.2 Optical methods for the design of LC devices: Light propagation in liquid crystals requires the solution of Maxwell’s equations in anisotropic nonuniform medium. This is particularly true with twisted structures and homogeneous LC devices with finite anchoring under a voltage. The fact that the molecules at the surface are anchored causes the formation of nonuniform splayed structure when an electric field is applied normal to the plates. Since usually thin films are adjacent to the LC layer (anti-reflection coating, alignment layer, electrode layer, etc.), multiple reflections need to be taken into account and therefore the use of the classical Jones calculus is not adequate. Nevertheless several approaches were developed during the years to solve this problem: 1.2.1 Generalized Geometrical Optics Approxmation (GGOA): This is an approximate approach for solving the problem of light propagation in mounted LC cell between two polarizers (polarizer and analyzer). Its simplicity stems from the fact that it doesn't take into account the angular impinging of the incoming light, and it was applied to the case of having fixed pretilt of the LC molecules12. 1.2.2 Extended Jones Matrix Method: Extended Jones Matrix Method13 and its variations is one of the common methods. Lien has extended the Jones Matrix method for calculating the optical transmission of a general twisted nematic cell at oblique incidence. The implementation of Extended Jones matrix method to the perpendicular incidence case reduces the equation to the simple Jones matrix. The computation is performed by dividing the retarder (or LC cell) to many slices and finding the solution in every layer. It is again an approximate approach. 1.2.3 The 4X4 Matrix Method: This is the most accurate approach. It takes into account the oblique incidence and considers the four tangential fields (Ex, Ey, Hx, Hy , when either xz or yz plane is the incidence plane). The mathematical expression depicts the connection of these fields in the input and the output of the system. It was proposed initially by Teitler and Henvis14 and was implemented for LCs by Berreman15, where the propagation matrix was calculated using polynomial expansion of the matrix exponent and neglecting high order terms. In 1985 analytic simplification of the method was proposed by Abdulhalim16 using the Lagrange-Sylvester interpolation polynomial, then in 1988 the use of Cayley-Hamilton theorem was proposed by Wöhler17. In 1999, Abdulhalim proposed several analytic forms of the propagator even for the general case of arbitrary biaxial media18.
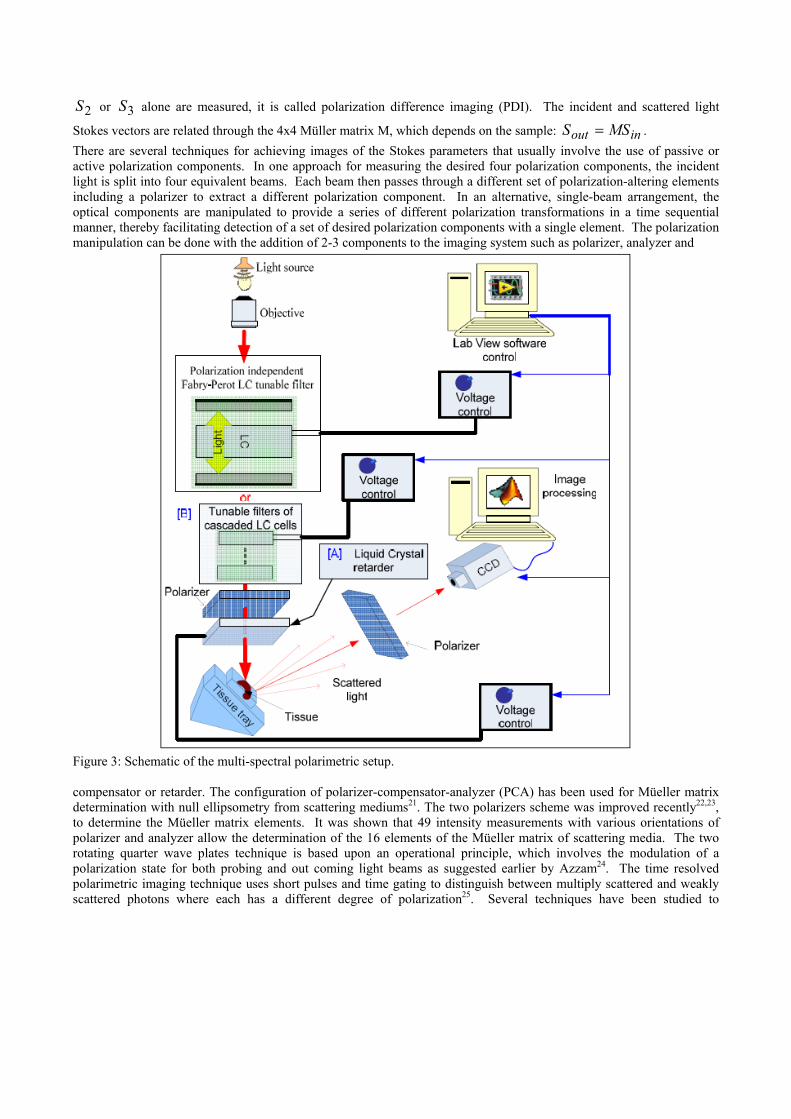
2. LIQUID CRYSTALS POLARIZATION CONTROLLERS IN BIOMEDICAL IMAGING Polarimetric imaging19 involves grabbing images at different polarization states to enhance contrast of images especially when the imaged medium is a scattering medium such as tissue that partially depolarizes the incident light beam. Ideally for complete description of the polarization state four images are required corresponding to the four Stokes parameters20,
),,,(),,,( 45459009003210 LRT IIIIIIIISSSSS −−−+== −+ ,
where LR IIIIIIS +=+=+= −+ 45459000 , represents the total intensity, and PI with
)45,45,90,0( °°°° −=P represents the intensity transmitted by a linear polarizer set at an azimuth angle P in the
plane perpendicular to the propagation direction; RI and LI are the intensities transmitted by the right or a left circular
polarizer. In polarimetric imaging one image or more of the Stokes parameters 321 ,, SSS are grabbed. When 1S ,
2S or 3S alone are measured, it is called polarization difference imaging (PDI). The incident and scattered light
Stokes vectors are related through the 4x4 Müller matrix M, which depends on the sample: inout MSS = . There are several techniques for achieving images of the Stokes parameters that usually involve the use of passive or active polarization components. In one approach for measuring the desired four polarization components, the incident light is split into four equivalent beams. Each beam then passes through a different set of polarization-altering elements including a polarizer to extract a different polarization component. In an alternative, single-beam arrangement, the optical components are manipulated to provide a series of different polarization transformations in a time sequential manner, thereby facilitating detection of a set of desired polarization components with a single element. The polarization manipulation can be done with the addition of 2-3 components to the imaging system such as polarizer, analyzer and
Figure 3: Schematic of the multi-spectral polarimetric setup. compensator or retarder. The configuration of polarizer-compensator-analyzer (PCA) has been used for Müeller matrix determination with null ellipsometry from scattering mediums21. The two polarizers scheme was improved recently22,23, to determine the Müeller matrix elements. It was shown that 49 intensity measurements with various orientations of polarizer and analyzer allow the determination of the 16 elements of the Müeller matrix of scattering media. The two rotating quarter wave plates technique is based upon an operational principle, which involves the modulation of a polarization state for both probing and out coming light beams as suggested earlier by Azzam24. The time resolved polarimetric imaging technique uses short pulses and time gating to distinguish between multiply scattered and weakly scattered photons where each has a different degree of polarization25. Several techniques have been studied to
differentiate between weakly scattered and multiply scattered photons. Because multiply scattered photons usually have greater path lengths, they can be rejected with time gating26,27,28,29. Light scattered from a biological tissues is an old subject. Anderson30 observed polarized light images from damaged tissues. Jacques and Lee31 described polarized light imaging of the superficial layers of skin using the same method. Additional improvements of the method using a compact design and two cameras were reported by Ramella-Roman et.al32. Linearly polarized light through a biological tissue causes the polarization states of photons to change due to tissue birefringence and tissue scattering. Imaging with polarized light can select light that backscatters from the superficial tissues, in contrast to light that reflects from the air/tissue surface or light that propagates deep into the tissue before eventual escape as diffuse reflectance and whose polarization status has been fully randomized. Hence, images can characterize the superficial region of a tissue which is often the region where cancer develops. The method involves the acquisition of two images through an analyzing linear polarizer in front of the camera, one image (Ipar) acquired with the analyzer oriented parallel to the polarization of illumination and one image (Iper) acquired with the analyzer oriented perpendicular to the illumination. An image based on the normalized Stokes pramater: S1=(Ipar-Iper)/(Ipar+Iper), is created. We develop a system that integrates LC retarders to control the two polarization states of the scattered light. First LC retarder is added as a polarization controller ([A] in figure 3) and second LC set of retarders corrugated with polarizers to form an optical tunable filter ([B] in figure 3). Tuned light in the optical range emerging from the light source passes our designed LC tunable filter [B], and incident the tissue at an angle with a linear polarization. Scattered light is collected by the CCD camera after passing the retarder [A] and the analyzer. The system is controlled by computer using National Instrument PCI-card. In this way we were able to perform a set of investigations by controlling the wavelengths as well as different stages of polarizations due to LC tilt control by external electric field. To understand the process of polarization control that results in different images, we shall review the scattering phenomena in biological tissues and the voltage control of the LC cell. Then we should be able to explain the whole system integrating all the elements. Some results and examples will be presented at the end of this section.
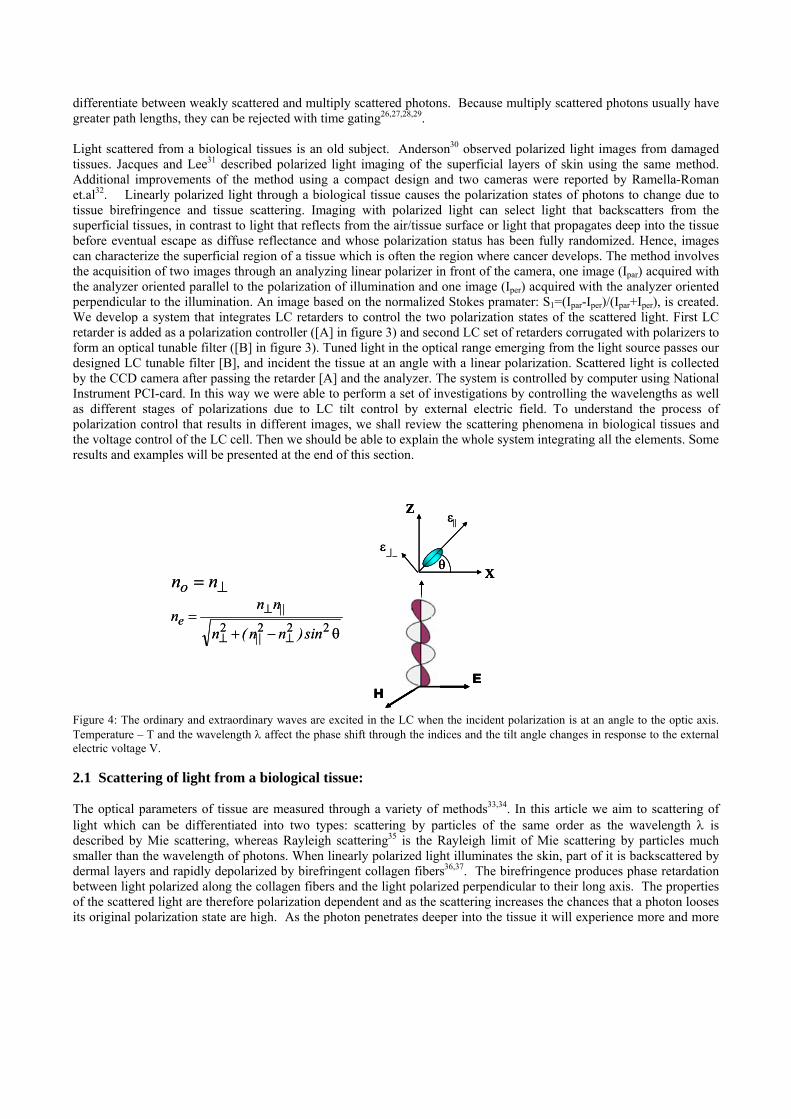
Figure 4: The ordinary and extraordinary waves are excited in the LC when the incident polarization is at an angle to the optic axis. Temperature – T and the wavelength λ affect the phase shift through the indices and the tilt angle changes in response to the external electric voltage V. 2.1 Scattering of light from a biological tissue: The optical parameters of tissue are measured through a variety of methods33,34. In this article we aim to scattering of light which can be differentiated into two types: scattering by particles of the same order as the wavelength λ is described by Mie scattering, whereas Rayleigh scattering35 is the Rayleigh limit of Mie scattering by particles much smaller than the wavelength of photons. When linearly polarized light illuminates the skin, part of it is backscattered by dermal layers and rapidly depolarized by birefringent collagen fibers36,37. The birefringence produces phase retardation between light polarized along the collagen fibers and the light polarized perpendicular to their long axis. The properties of the scattered light are therefore polarization dependent and as the scattering increases the chances that a photon looses its original polarization state are high. As the photon penetrates deeper into the tissue it will experience more and more
X
ε_|_
ε||
θ
Z
EH
θ−+=
⊥⊥
⊥2222 sin)nn(n
nnn
||
||e
⊥= nnoX
ε_|_
ε||
θ
Z
EH
X
ε_|_
ε||
θ
Z
EH
EH
θ−+=
⊥⊥
⊥2222 sin)nn(n
nnn
||
||e
⊥= nno
scattering events, hence the depolarization depends on the penetration depth. The penetration depth and amount of depolarization depends on the wavelength of the incident light. Hence, we have strong polarization and wavelength dependence of light polarized from the skin. It is possible to distinguish such backscattered light from the total diffusely reflected light that is dominated by light penetrating deeply into the dermis. The method may be described following the setup shown in figure 3. It involves acquisition of two or more images through an analyzing linear polarizer in front of the camera and then performing image processing operations. Scattered light is usually partially polarized which is characterized by the four Stokes parameters: )S,S,S,S(S 3210= . Mechanisms of polarized light scattering from different tissues and tissue phantoms are well established now based on in vitro studies. Parameters such as depolarization depth (DD), retardance, and birefringence were studied both theoretically and experimentally. Polarized light traveling through different tissues (skin, muscle, and liver) depolarizes after a few hundred microns. Highly birefringent materials such as skin (DD = 300 μm at 696 nm) and muscle (DD = 370 μm at 696 nm) depolarizes light faster than less birefringent materials such as liver (DD = 700 μm at 696 nm). This is the essence of using polarized multi-spectral imaging. 2.2 Design and fabrication of LC retarders: 2.2.1 Design There are many different types of electrooptic effects in LCs distinguished by the way in which the molecules are aligned and how they respond to the field. We shall focus on the nematic, in the homogeneous geometry where the molecules align more or less parallel to the surface, even though their positions are fairly random. By inserting the LC into a narrow gap between two glasses coated with thin ITO and polyimide layer for alignment of the LC molecules, it is possible to fabricate an LC cell which can be controlled by electric voltage. The effect of the external field is to cause the oval shape molecules to rotate and by that to change the extraordinary index of refraction to be tuned between the parallel and perpendicular index of refraction, |||| ε=n and ⊥⊥ = εn . It is easy to show that changing the
extraordinary index of refraction en changes the phase retardation due to the change in the birefringence term as shown in the expression in figure 4. In practice the molecules reorientation in the LC cell is not uniform since it has an anchoring to the polyimide surface. The LC molecular tilt angle spatial-temporal distribution is governed by the nonlinear equation obtained by balancing the visco-elastic torques to the electric torque caused by the applied voltage38:
θθ+⎟⎟⎠
⎞⎜⎜⎝
⎛ θ
π
θθκ+
θ
π
θκ+=
∂θ∂ cossinV
dzdcossin
dzd)sin(
t rrrr
22
22
2
2
21 (1)
Where here phase retardation will be a result of an integral over the gap of the LC cell:
0
2 [ ( , ) ]d
e on V z n dzπδλ
= −∫ (2)
dzzr = - the coordinate normalized to the cell thickness.
thfr VVV = - Voltage normalized to the threshold for the case of fixed boundaries.
⎟⎟⎠
⎞⎜⎜⎝
⎛−= 1
11
33
KK
κ where 3311 KandK are the splay and bend elastic constants.
εεπ
Δ=
0
11KVthf - Frederick’s threshold voltage for the case of fixed boundaries.
εΔ - Static dielectric anisotropy. τttr = - Time normalized to the viscous-elastic time constant of the LC.
112
2
Kd
πητ = - Viscous-elastic time constant where η is the rotational viscosity.
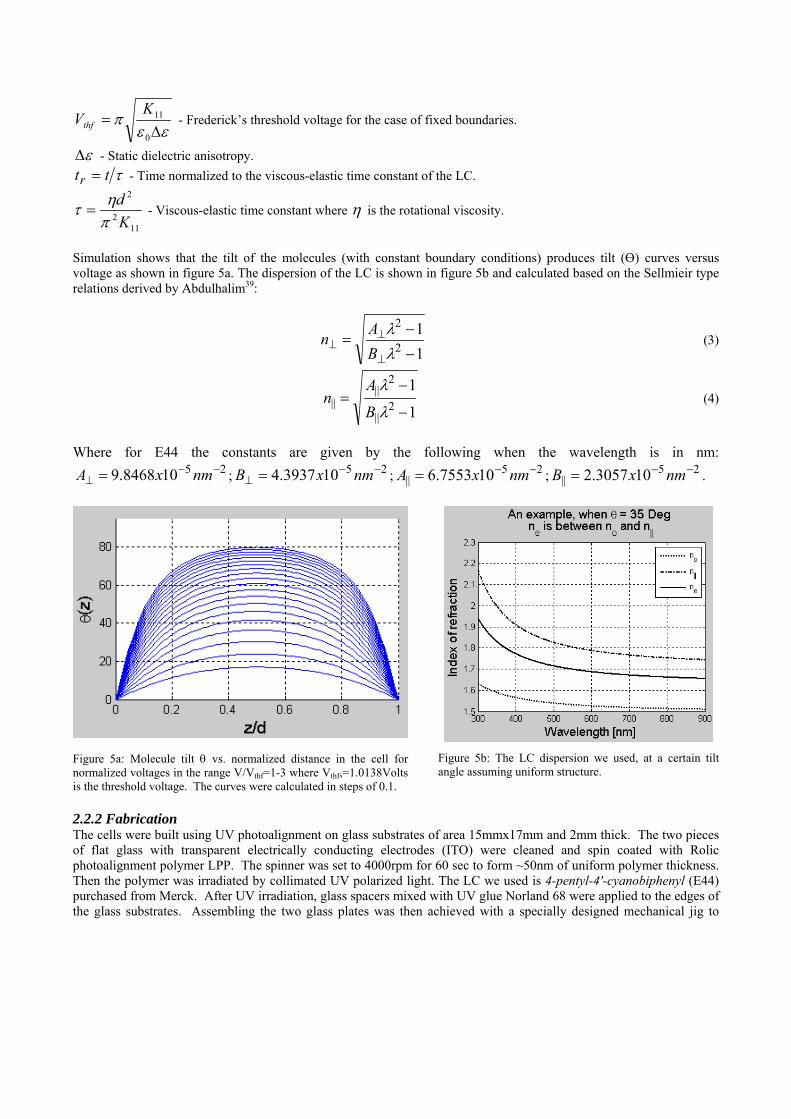
Simulation shows that the tilt of the molecules (with constant boundary conditions) produces tilt (Ө) curves versus voltage as shown in figure 5a. The dispersion of the LC is shown in figure 5b and calculated based on the Sellmieir type relations derived by Abdulhalim39:
11
2
2
−
−=
⊥
⊥⊥
λλ
BAn (3)
1
12
||
2||
||−
−=
λ
λ
B
An (4)
Where for E44 the constants are given by the following when the wavelength is in nm:
25108468.9 −−⊥ = nmxA ; 25103937.4 −−
⊥ = nmxB ; 25|| 107553.6 −−= nmxA ; 25
|| 103057.2 −−= nmxB .
Figure 5a: Molecule tilt θ vs. normalized distance in the cell for normalized voltages in the range V/Vthf=1-3 where Vthf,=1.0138Volts is the threshold voltage. The curves were calculated in steps of 0.1.
Figure 5b: The LC dispersion we used, at a certain tilt angle assuming uniform structure.
2.2.2 Fabrication The cells were built using UV photoalignment on glass substrates of area 15mmx17mm and 2mm thick. The two pieces of flat glass with transparent electrically conducting electrodes (ITO) were cleaned and spin coated with Rolic photoalignment polymer LPP. The spinner was set to 4000rpm for 60 sec to form ~50nm of uniform polymer thickness. Then the polymer was irradiated by collimated UV polarized light. The LC we used is 4-pentyl-4′-cyanobiphenyl (E44) purchased from Merck. After UV irradiation, glass spacers mixed with UV glue Norland 68 were applied to the edges of the glass substrates. Assembling the two glass plates was then achieved with a specially designed mechanical jig to
obtain uniform gap by observing the interference colors reflected from the empty cell. The cell was then filled in vacuum at temperature above the clearing temperature (101oC in our case) and then cooled slowly to room temperature. The cell was then sealed with the UV glue Norland 68 and electrical wires connected to the electrodes using sliver paste and epoxy glue.
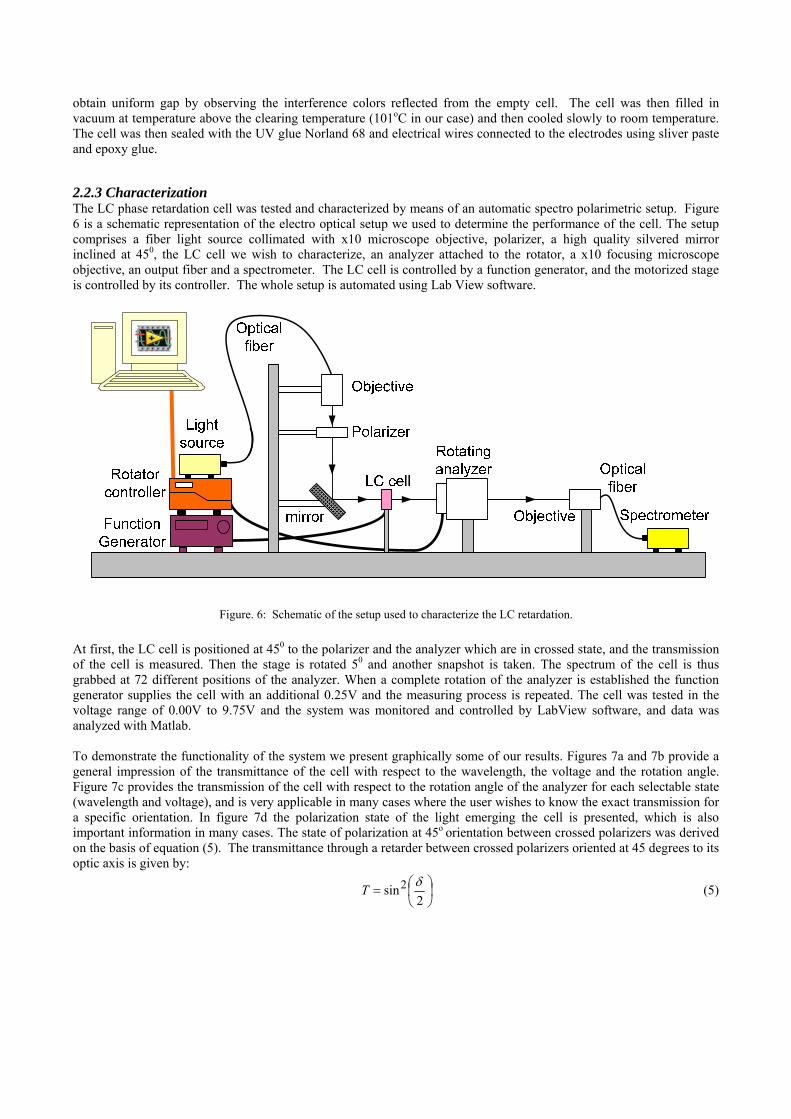
2.2.3 Characterization The LC phase retardation cell was tested and characterized by means of an automatic spectro polarimetric setup. Figure 6 is a schematic representation of the electro optical setup we used to determine the performance of the cell. The setup comprises a fiber light source collimated with x10 microscope objective, polarizer, a high quality silvered mirror inclined at 450, the LC cell we wish to characterize, an analyzer attached to the rotator, a x10 focusing microscope objective, an output fiber and a spectrometer. The LC cell is controlled by a function generator, and the motorized stage is controlled by its controller. The whole setup is automated using Lab View software.
Figure. 6: Schematic of the setup used to characterize the LC retardation.
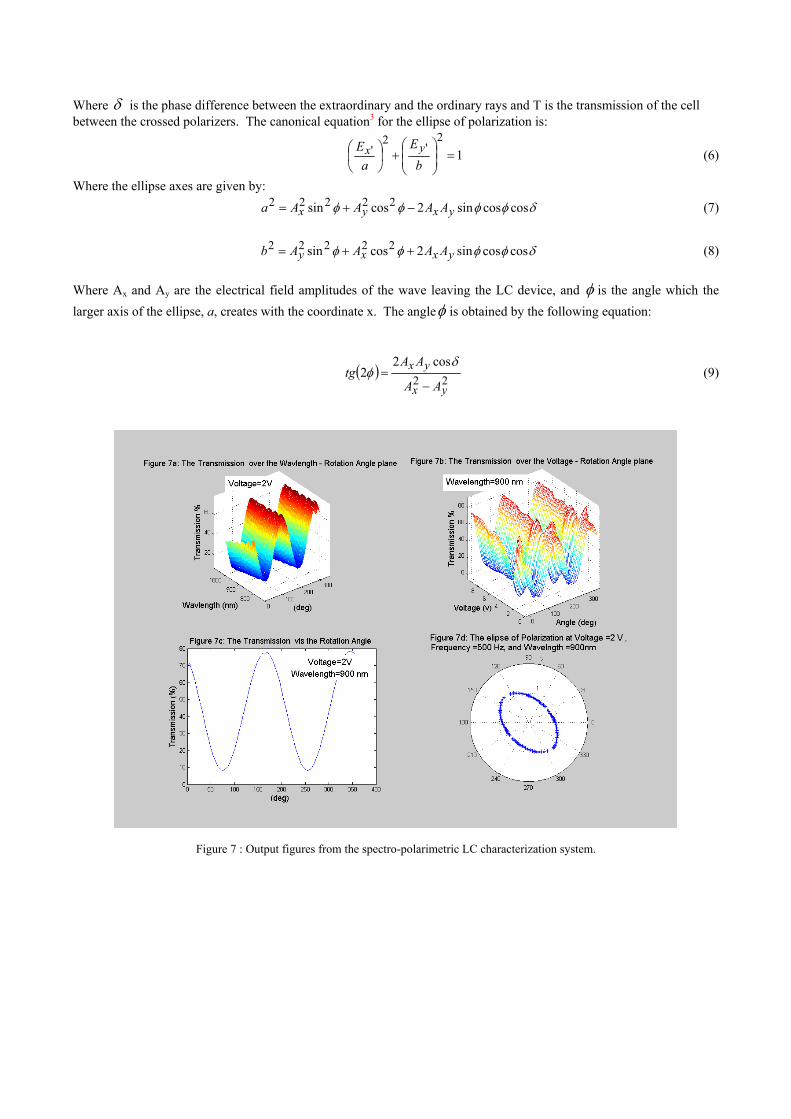
At first, the LC cell is positioned at 450 to the polarizer and the analyzer which are in crossed state, and the transmission of the cell is measured. Then the stage is rotated 50 and another snapshot is taken. The spectrum of the cell is thus grabbed at 72 different positions of the analyzer. When a complete rotation of the analyzer is established the function generator supplies the cell with an additional 0.25V and the measuring process is repeated. The cell was tested in the voltage range of 0.00V to 9.75V and the system was monitored and controlled by LabView software, and data was analyzed with Matlab. To demonstrate the functionality of the system we present graphically some of our results. Figures 7a and 7b provide a general impression of the transmittance of the cell with respect to the wavelength, the voltage and the rotation angle. Figure 7c provides the transmission of the cell with respect to the rotation angle of the analyzer for each selectable state (wavelength and voltage), and is very applicable in many cases where the user wishes to know the exact transmission for a specific orientation. In figure 7d the polarization state of the light emerging the cell is presented, which is also important information in many cases. The state of polarization at 45o orientation between crossed polarizers was derived on the basis of equation (5). The transmittance through a retarder between crossed polarizers oriented at 45 degrees to its optic axis is given by:
⎟⎠⎞
⎜⎝⎛=
2sin2 δT (5)
Where δ is the phase difference between the extraordinary and the ordinary rays and T is the transmission of the cell between the crossed polarizers. The canonical equation3 for the ellipse of polarization is:
12
'2
' =⎟⎟⎠
⎞⎜⎜⎝
⎛+⎟
⎠
⎞⎜⎝
⎛b
Ea
E yx (6)
Where the ellipse axes are given by: δφφφφ coscossin2cossin 22222
yxyx AAAAa −+= (7)
δφφφφ coscossin2cossin 22222yxxy AAAAb ++= (8)
Where Ax and Ay are the electrical field amplitudes of the wave leaving the LC device, and φ is the angle which the larger axis of the ellipse, a, creates with the coordinate x. The angleφ is obtained by the following equation:
( ) 22cos2
2yx
yx
AA
AAtg
−=
δφ (9)
Figure 7 : Output figures from the spectro-polarimetric LC characterization system.
Now, since the LC cell is oriented at 450 to the first polarizer, we can determine that yx AA = , obviously in this case
eq.7 "explodes" to infinity (unless πδ ⎟⎠⎞
⎜⎝⎛ +
=2
1n, n=0, 1, 2…in which the ellipse turns to a circle), and that means that
φ is either 450 or 1350 (depending on the sign of δcos ). We measured the transmission and foundδ , and then we easily computed the normalized values of a2 and b2 which in turn helped us to plot the state of the polarization emerging the LC device.
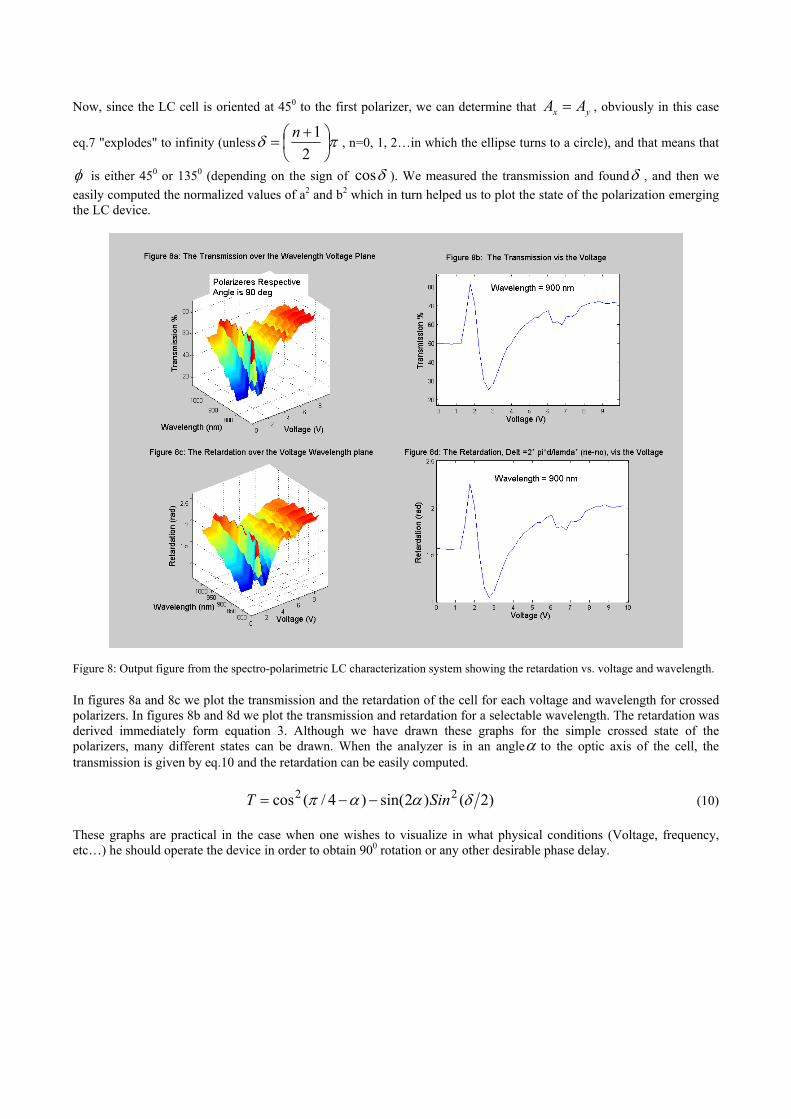
Figure 8: Output figure from the spectro-polarimetric LC characterization system showing the retardation vs. voltage and wavelength.
In figures 8a and 8c we plot the transmission and the retardation of the cell for each voltage and wavelength for crossed polarizers. In figures 8b and 8d we plot the transmission and retardation for a selectable wavelength. The retardation was derived immediately form equation 3. Although we have drawn these graphs for the simple crossed state of the polarizers, many different states can be drawn. When the analyzer is in an angleα to the optic axis of the cell, the transmission is given by eq.10 and the retardation can be easily computed.
)2()2sin()4/(cos 22 δααπ SinT −−= (10) These graphs are practical in the case when one wishes to visualize in what physical conditions (Voltage, frequency, etc…) he should operate the device in order to obtain 900 rotation or any other desirable phase delay.
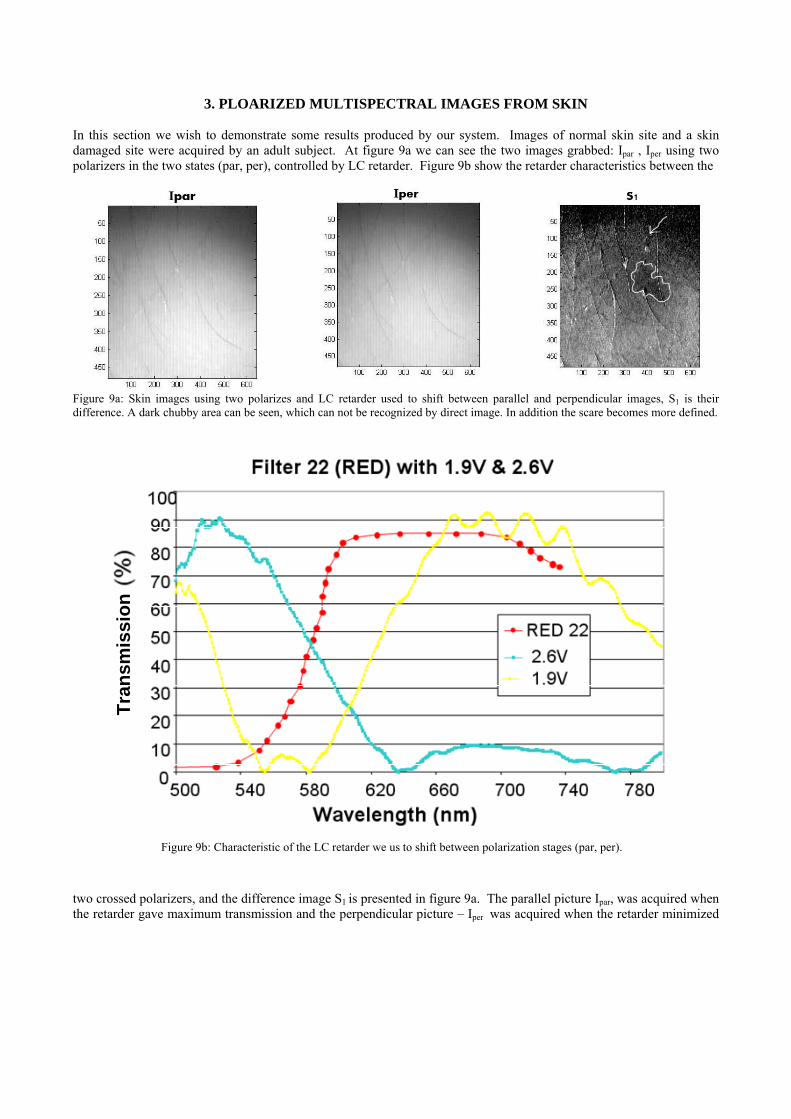
3. PLOARIZED MULTISPECTRAL IMAGES FROM SKIN In this section we wish to demonstrate some results produced by our system. Images of normal skin site and a skin damaged site were acquired by an adult subject. At figure 9a we can see the two images grabbed: Ipar , Iper using two polarizers in the two states (par, per), controlled by LC retarder. Figure 9b show the retarder characteristics between the
Figure 9a: Skin images using two polarizes and LC retarder used to shift between parallel and perpendicular images, S1 is their difference. A dark chubby area can be seen, which can not be recognized by direct image. In addition the scare becomes more defined.
Figure 9b: Characteristic of the LC retarder we us to shift between polarization stages (par, per).
two crossed polarizers, and the difference image S1 is presented in figure 9a. The parallel picture Ipar, was acquired when the retarder gave maximum transmission and the perpendicular picture – Iper was acquired when the retarder minimized
Tran
smis
sion
Tran
smis
sion
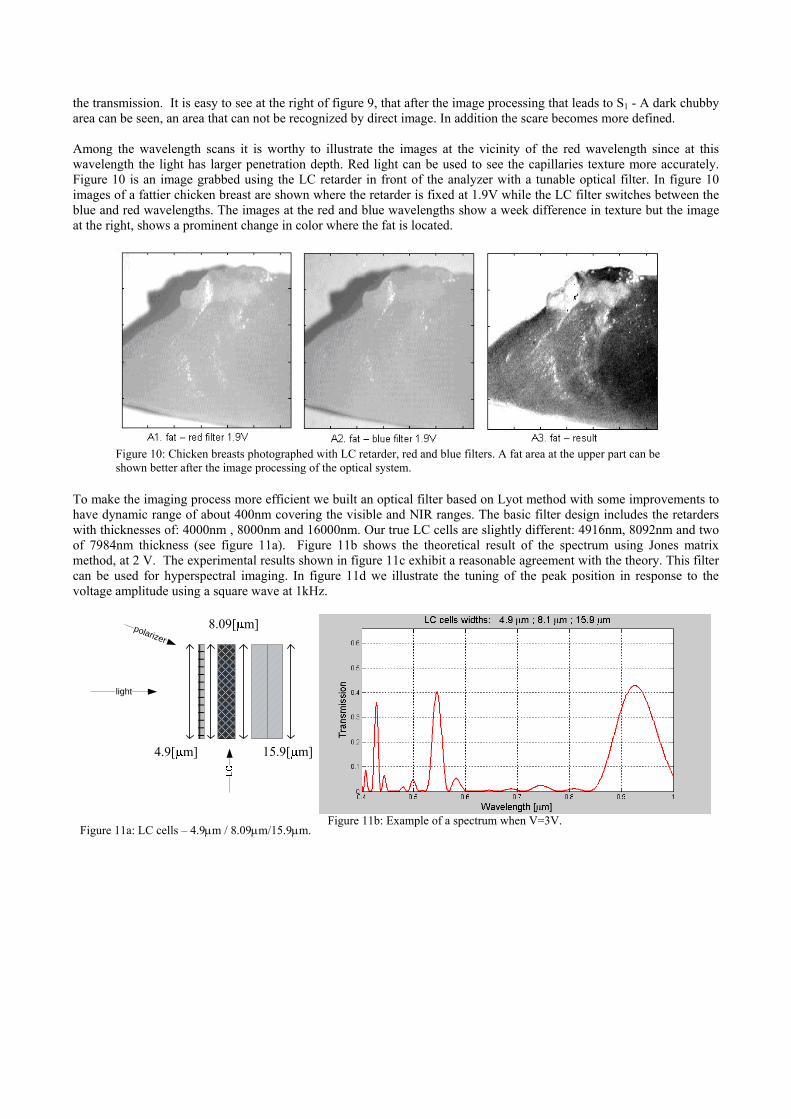
the transmission. It is easy to see at the right of figure 9, that after the image processing that leads to S1 - A dark chubby area can be seen, an area that can not be recognized by direct image. In addition the scare becomes more defined. Among the wavelength scans it is worthy to illustrate the images at the vicinity of the red wavelength since at this wavelength the light has larger penetration depth. Red light can be used to see the capillaries texture more accurately. Figure 10 is an image grabbed using the LC retarder in front of the analyzer with a tunable optical filter. In figure 10 images of a fattier chicken breast are shown where the retarder is fixed at 1.9V while the LC filter switches between the blue and red wavelengths. The images at the red and blue wavelengths show a week difference in texture but the image at the right, shows a prominent change in color where the fat is located.
Figure 10: Chicken breasts photographed with LC retarder, red and blue filters. A fat area at the upper part can be shown better after the image processing of the optical system.
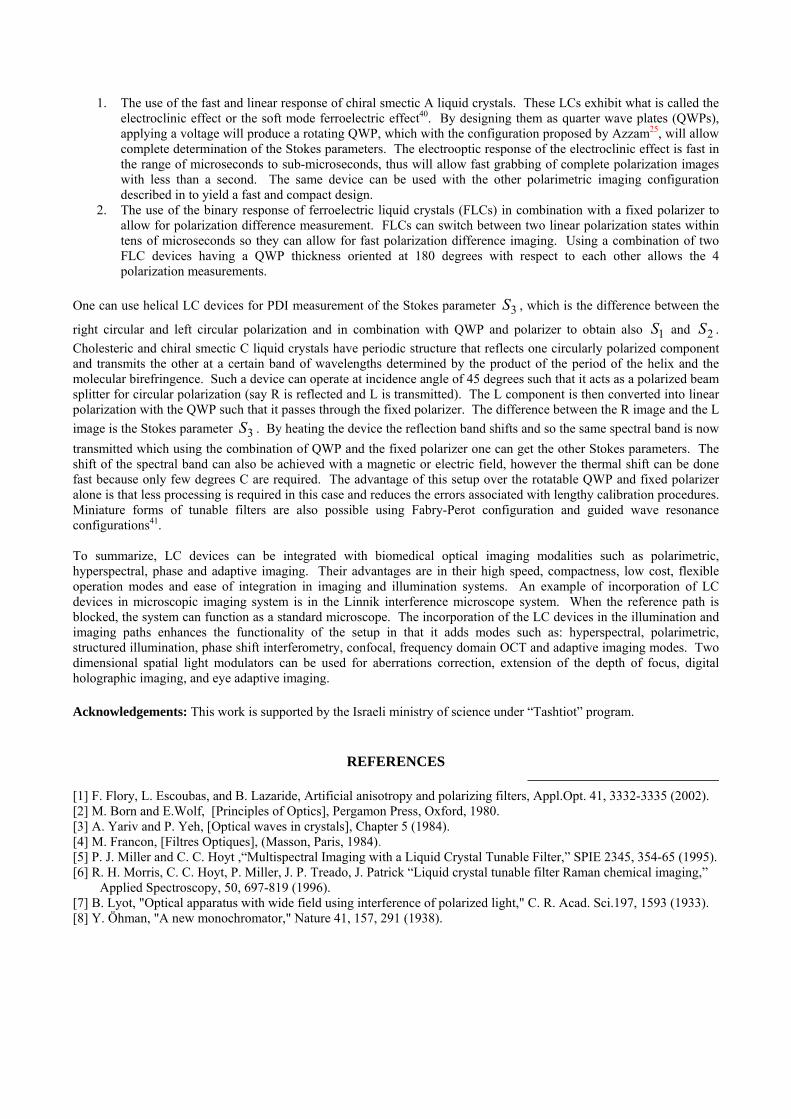
To make the imaging process more efficient we built an optical filter based on Lyot method with some improvements to have dynamic range of about 400nm covering the visible and NIR ranges. The basic filter design includes the retarders with thicknesses of: 4000nm , 8000nm and 16000nm. Our true LC cells are slightly different: 4916nm, 8092nm and two of 7984nm thickness (see figure 11a). Figure 11b shows the theoretical result of the spectrum using Jones matrix method, at 2 V. The experimental results shown in figure 11c exhibit a reasonable agreement with the theory. This filter can be used for hyperspectral imaging. In figure 11d we illustrate the tuning of the peak position in response to the voltage amplitude using a square wave at 1kHz.
light
4.9[ m]
8.09[ m]
15.9[ m]
polarizer
Figure 11a: LC cells – 4.9μm / 8.09μm/15.9μm.
Figure 11b: Example of a spectrum when V=3V.
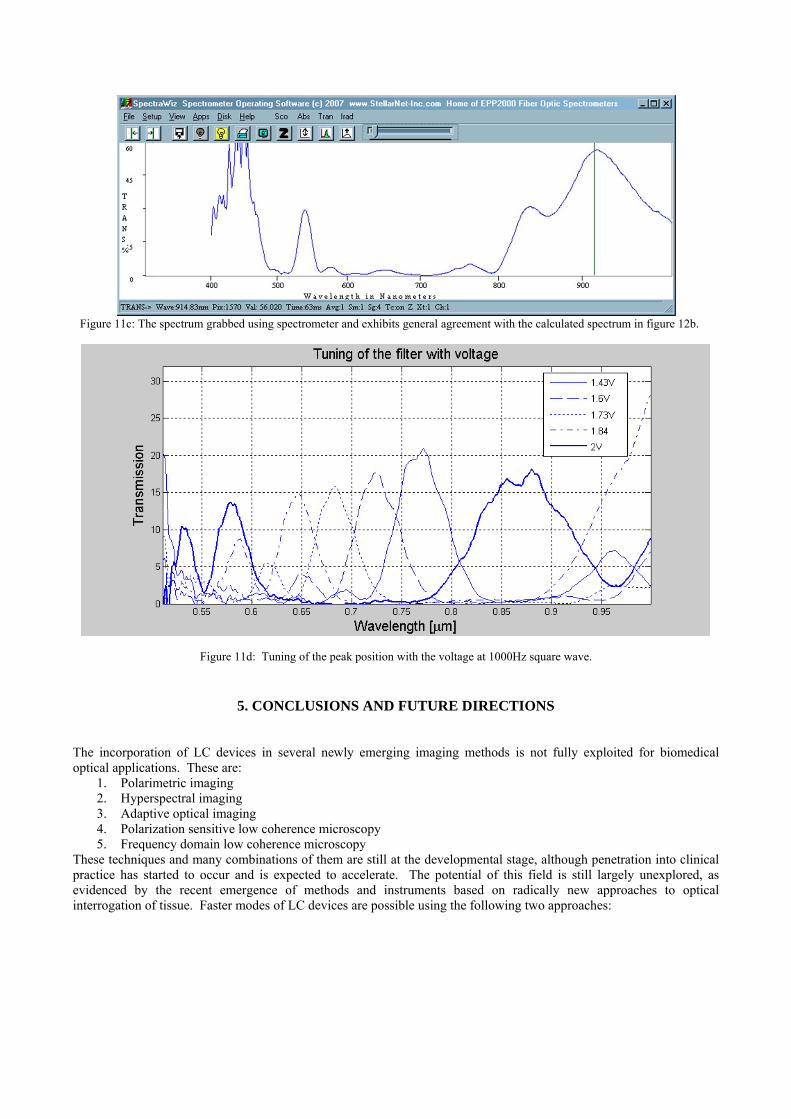
Figure 11c: The spectrum grabbed using spectrometer and exhibits general agreement with the calculated spectrum in figure 12b.
Figure 11d: Tuning of the peak position with the voltage at 1000Hz square wave.
5. CONCLUSIONS AND FUTURE DIRECTIONS The incorporation of LC devices in several newly emerging imaging methods is not fully exploited for biomedical optical applications. These are:
1. Polarimetric imaging 2. Hyperspectral imaging 3. Adaptive optical imaging 4. Polarization sensitive low coherence microscopy 5. Frequency domain low coherence microscopy
These techniques and many combinations of them are still at the developmental stage, although penetration into clinical practice has started to occur and is expected to accelerate. The potential of this field is still largely unexplored, as evidenced by the recent emergence of methods and instruments based on radically new approaches to optical interrogation of tissue. Faster modes of LC devices are possible using the following two approaches:
1. The use of the fast and linear response of chiral smectic A liquid crystals. These LCs exhibit what is called the electroclinic effect or the soft mode ferroelectric effect40. By designing them as quarter wave plates (QWPs), applying a voltage will produce a rotating QWP, which with the configuration proposed by Azzam25, will allow complete determination of the Stokes parameters. The electrooptic response of the electroclinic effect is fast in the range of microseconds to sub-microseconds, thus will allow fast grabbing of complete polarization images with less than a second. The same device can be used with the other polarimetric imaging configuration described in to yield a fast and compact design.
2. The use of the binary response of ferroelectric liquid crystals (FLCs) in combination with a fixed polarizer to allow for polarization difference measurement. FLCs can switch between two linear polarization states within tens of microseconds so they can allow for fast polarization difference imaging. Using a combination of two FLC devices having a QWP thickness oriented at 180 degrees with respect to each other allows the 4 polarization measurements.
One can use helical LC devices for PDI measurement of the Stokes parameter 3S , which is the difference between the
right circular and left circular polarization and in combination with QWP and polarizer to obtain also 1S and 2S . Cholesteric and chiral smectic C liquid crystals have periodic structure that reflects one circularly polarized component and transmits the other at a certain band of wavelengths determined by the product of the period of the helix and the molecular birefringence. Such a device can operate at incidence angle of 45 degrees such that it acts as a polarized beam splitter for circular polarization (say R is reflected and L is transmitted). The L component is then converted into linear polarization with the QWP such that it passes through the fixed polarizer. The difference between the R image and the L image is the Stokes parameter 3S . By heating the device the reflection band shifts and so the same spectral band is now transmitted which using the combination of QWP and the fixed polarizer one can get the other Stokes parameters. The shift of the spectral band can also be achieved with a magnetic or electric field, however the thermal shift can be done fast because only few degrees C are required. The advantage of this setup over the rotatable QWP and fixed polarizer alone is that less processing is required in this case and reduces the errors associated with lengthy calibration procedures. Miniature forms of tunable filters are also possible using Fabry-Perot configuration and guided wave resonance configurations41. To summarize, LC devices can be integrated with biomedical optical imaging modalities such as polarimetric, hyperspectral, phase and adaptive imaging. Their advantages are in their high speed, compactness, low cost, flexible operation modes and ease of integration in imaging and illumination systems. An example of incorporation of LC devices in microscopic imaging system is in the Linnik interference microscope system. When the reference path is blocked, the system can function as a standard microscope. The incorporation of the LC devices in the illumination and imaging paths enhances the functionality of the setup in that it adds modes such as: hyperspectral, polarimetric, structured illumination, phase shift interferometry, confocal, frequency domain OCT and adaptive imaging modes. Two dimensional spatial light modulators can be used for aberrations correction, extension of the depth of focus, digital holographic imaging, and eye adaptive imaging. Acknowledgements: This work is supported by the Israeli ministry of science under “Tashtiot” program.
REFERENCES
[1] F. Flory, L. Escoubas, and B. Lazaride, Artificial anisotropy and polarizing filters, Appl.Opt. 41, 3332-3335 (2002). [2] M. Born and E.Wolf, [Principles of Optics], Pergamon Press, Oxford, 1980. [3] A. Yariv and P. Yeh, [Optical waves in crystals], Chapter 5 (1984). [4] M. Francon, [Filtres Optiques], (Masson, Paris, 1984). [5] P. J. Miller and C. C. Hoyt ,“Multispectral Imaging with a Liquid Crystal Tunable Filter,” SPIE 2345, 354-65 (1995). [6] R. H. Morris, C. C. Hoyt, P. Miller, J. P. Treado, J. Patrick “Liquid crystal tunable filter Raman chemical imaging,”
Applied Spectroscopy, 50, 697-819 (1996). [7] B. Lyot, "Optical apparatus with wide field using interference of polarized light," C. R. Acad. Sci.197, 1593 (1933). [8] Y. Öhman, "A new monochromator," Nature 41, 157, 291 (1938).
[9] I. Šolc, "Birefringent chain filters," J. Opt. Soc. Am. 55, 621 (1965). [10] J. W. Evans, ‘‘Solc birefringent filter,’’ J. Opt. Soc. Am. 48, 142–145 (1958). [11] J. W. Evans, ‘‘The birefringent filter,’’ J. Opt. Soc. Am. 39, 229–242 (1949). [12] H. L. Ong, "Origin and characteristics of the optical properties of general twisted nematic liquid crystals displays",
J.Appl. Phys. 64, 614 (1988). [13] A. Lien, “Extended Jones matrix representation for the twisted nematic liquid crystal display at oblique incident,”
Appl. Phys. Lett. 57, 2767-2769 (1990). [14] S. Teitler and B. Henvis, “Refraction in stratified anisotropic media,” J. Opt. Soc. Am. 60, 830-834 (1970). [15] D. W. Berreman, “Optics in Stratified and Anisotropic Media: 4x4-Matrix Formulation,” J.Opt.Soc.Am. 62, 502-
510 (1972). [16] I. Abdulhalim, L. Benguigui, and R. Weil, “Selective reflection by helicoidal liquid crystal. Results of an exact
calculation using the 4_4 characteristic matrix method,” J. Phys. (France) 46, 815–825 (1985). [17] H. Wholer, G. Haas, M. Fritsch, and D. A. Mlynski, J. Opt. Soc. Am. A 5, 1554-1557 (1988). [18] I. Abdulhalim, “Analytic propagation matrix method for linear optics of arbitrary biaxial layered media,” J. Opt. A,
Pure Appl. Opt. 1, 646–653 (1999). [19] R. A. Chipman, Polarimetry, [Handbook of Optics], Vol: 2, (McGraw-Hill, New York, 1995). Ch.22. [20] R. M. A. Azzam and N. M. Bashara, [Ellipsometry and Polarized Light], (North-Holland, Amstr., 1977). [21] Soe-Mie F. Nee, “Depolarization and principal Mueller matrix measured by null ellipsometry,” Appl.Opt., 40,
4933-4939 (2001). [22] W.S. Bickel, W.M. Bailey, “Stokes vectors, Müeller matrices, and polarized light scattering,” Am.J.Phys. 53, 468-
478 (1985). [23] A. H. Hielscher, A. A. Eick, J. R. Mourant, D. Shen, J. P. Freyer, and I. J. Bigio, “Diffuse backscattering Müeller
matrices of highly scattering media,” Optics Express 1, 441-453 (1997). [24] R. M. A. Azzam, “Photopolarimetric measurement of the Mueller matrix by Fourier analysis of a single detected
signal,” Opt.Lett., 2, 148-150 (1978). [25] Gang Yao and Lihong V. Wang, “Propagation of polarized light in turbid media: simulated animation sequences,”
Opt.Express 7(5) 198-203 (2000). [26] B. Das, K. Yoo, and R. R. Alfano, "Ultrafast time gated imaging," Opt. Lett. 18, 1092-1094(1993). [27] S. Marengo, C. Pepin, T. Goulet, and D. Houde, “Time-gated transillumination of objects in highly scattering media
using a subpicosecond optical amplifier,” IEEE J. Sel. Top. Quant. 5, 895–901(1999). [28] J. M. Schmitt, A. H. Gandjbakhche, and R. F. Bonner, "Use of polarized light to discriminate short-path photons in
a multiply scattering medium," Appl. Opt. 31, 6535–6546 (1992). [29] X. Liang, L. Wang, P. P. Ho, and R. R. Alfano, “Time-resolved polarization shadowgrams in turbid media,” Appl.
Opt. 36, 2984–2989(1997). [30] R. R. Anderson, “Polarized light examination and photography of the skin,” Arch. Dermato. 127, 1000–5 (1991). [31] S. L. Jacques and K. Lee, “Polarized video imaging of skin,” Proc. SPIE 3245, 356–362 (1998). [32] Jessica C. Ramella-Roman, Ken Lee, Scott A. Prahl and Steven L. Jacques, “Design, testing, and clinical studies of
a handheld polarized light camera,” Journal of Biomedical Optics 9, 1305–1310 (2004). [33] W. F. Cheong, S. Prahl, and A. J.Welch, ‘‘A review of the optical properties of biological tissues,’’ IEEE J.
Quantum Electron. 26, 2166–2185 (1990). [34] B. C. Wilson, M. S. Patterson, and S. T. Flock, “Indirect versus direct techniques for the measurement of the optical
properties of tissues,” Photochem. Photobiol. 46, 601–608 (1987). [35] C.F. Bohren and D. Huffman, [Absorption and scattering of light by small particles], (John Wiley, New York 1983). [36] N. Aspres, I. B. Egerton, A. C. Lim, S. P. Shumack, “Imaging the skin,” Austral. J.Dermatol, 44, 19-27 (2003). [37] N. Kollias, G. N. Stamatas, “Optical non-invasive approaches to diagnosis of skin diseases,”
J.Investig.Dermatol.Symp Proc., 7, 64-75 (2002). [38] I. C. Khoo, S. T. Wu, [Optics and Nonlinear Optics of Liquid Crystals], (World Scientific, Singapore 1993). [39] I. Abdulhalim, “Dispersion relations for liquid crystals using the anisotropic Lorentz model with geometrical
effects,” Liq.Cryst. 33 (9) 1027-41 (2006). [40] I. Abdulhalim, G. Moddel, “Switching behavior and electro-optic response due to the soft mode ferroelectric effect
in chiral smectic A liquid crystals,” Liq. Crys., 9 (4) 493-518 (1991). [41] I. Abdulhalim, Anisotropic layers in waveguides for mode tuning and tunable filtering, SPIE 6135, 179-88 (2006).