Embed Size (px)
Citation preview
Introduction
The Centers for Disease Control and Prevention report that nearly three out of four prescription drug overdoses involve prescription pain killers1 and
that death rates involving opioid analgesic abuses have more than tripled in the U.S since 19992.
We present a study for screening of opioids along with the quantitation of the drugs in urine using a time-of-flight (TOF) mass spectrometer (MS) for use in forensic laboratories.
Testing of opioids is most commonly done using the Enzyme Multiple Immunoassay Test (EMIT). Immunoassays suffer from non-specificity as they can only identify a class of drugs and cannot identify the specific compound within the class. As an example, an immunoassay for the SAMHSA panel screens for opiates such as codeine and morphine but would not detect opioids such as oxycodone, which is a semi- synthetic compound. This non-specificity can lead to false positive or false negative results, needing confirmation by techniques such as GC/MS.
Testing and Quantification of Opioids in Urine by UHPLC-TOF
A P P L I C A T I O N N O T E
Liquid Chromatography/Mass Spectrometry
Author:
Sharanya Reddy
PerkinElmer, Inc. Shelton, CT
2
Mobile phase B: 50/50 acetonitrile/methanol (0.1% formic acid)Gradient conditions: 5% B to 50% B in 4 min. (linear gradient),
from 50% B to 90%B for next 1.0 min., maintained for an additional 1 min.
Injection volume: 7 μL in partial loop mode Column: PerkinElmer Brownlee™ SPP C-18,
2.1x100 mm, 2.7 μm (part number N9308404), 25 °C
MS conditions:Mass spectrometer: PerkinElmer AxION® 2 TOF MS Ionization source: PerkinElmer Ultraspray™ 2 (Dual ESI source) Ionization mode: Positive
Internal calibration was performed using m/z 195.0876 and 622.02896 as lock mass ions.
Results
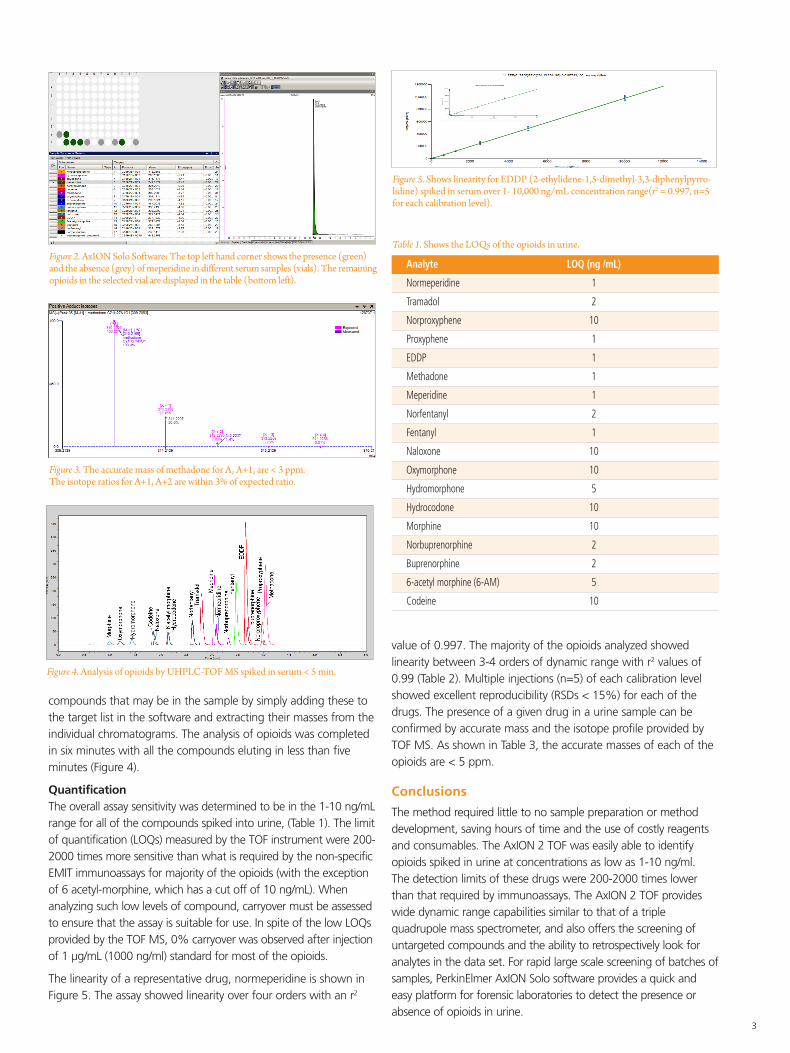
Testing/Confirmation The full spectral information provided by the TOF allows for the testing of hundreds of compounds that may be present in the sample without pre-defining them prior to analysis. Powerful software tools such as AxION Solo™ software is utilized to rapidly identify the presence or absence of compounds in large batches of samples (Figure 2). The software identifies the presence of a compound based on accurate mass and isotope profile ratio as shown in Figure 3. In addition to searching against spectral information, the software can also search for target analytes based on user defined retention time windows, which further improves the specificity of detection. Even after acquisition of data, the samples can be re-examined for presence of other
GCMS assays offer their own challenges, since they require derivatization of the analytes to make them volatile for GC analysis. Derivatization chemistry is not always quantitative and can be time-consuming and limit high throughput analysis. Unlike GC/MS, LC/MS based techniques do not require time consuming derivatization of samples. Among the LC techniques, LC/MS/MS (using tandem quadrupole instrumentation) is often used to quantitate compounds in biological fluids due to its sensitivity and selectivity. However, LC/MS/MS assays are only suitable for targeted analysis, which can be an issue for forensic toxicologists who are frequently faced with the challenge of looking for unknown compounds in samples. TOF mass spectrometers, unlike tandem quadrupole instruments, collect full spectrum information without the loss of sensitivity observed with scanning instruments, which allows for simultaneous targeted and non-targeted analyses, making them ideal to use in forensic laboratories.
Experimental
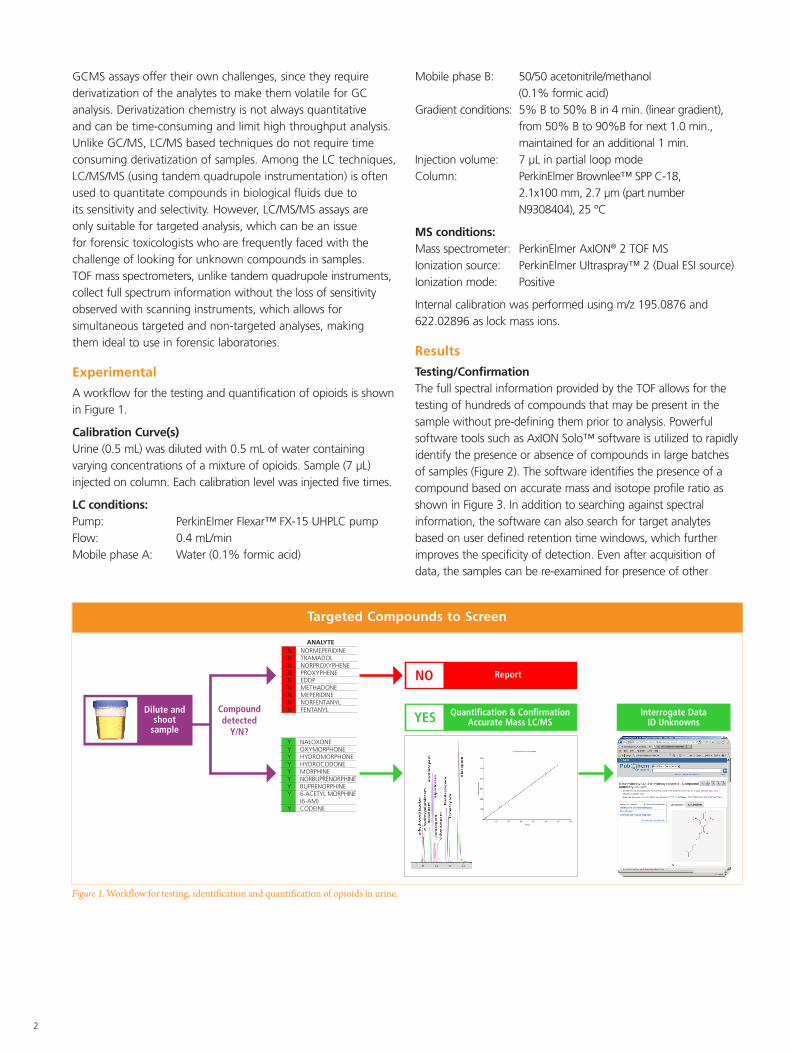
A workflow for the testing and quantification of opioids is shown in Figure 1.
Calibration Curve(s) Urine (0.5 mL) was diluted with 0.5 mL of water containing varying concentrations of a mixture of opioids. Sample (7 μL) injected on column. Each calibration level was injected five times.
LC conditions:Pump: PerkinElmer Flexar™ FX-15 UHPLC pump Flow: 0.4 mL/min Mobile phase A: Water (0.1% formic acid)
Figure 1. Workflow for testing, identification and quantification of opioids in urine.
Compounddetected
Y/N?Y NALOXONE Y OXYMORPHONEY HYDROMORPHONE Y HYDROCODONE Y MORPHINE Y NORBUPRENORPHINE Y BUPRENORPHINE Y 6-ACETYL MORPHINE (6-AM) Y CODEINE
ReportNO
Interrogate Data ID UnknownsYES Quantification & Confirmation
Accurate Mass LC/MSDilute and
shoot sample
N NORMEPERIDINE N TRAMADOL N NORPROXYPHENE N PROXYPHENE N EDDP N METHADONE N MEPERIDINE N NORFENTANYL N FENTANYL
ANALYTE
Targeted Compounds to Screen
3
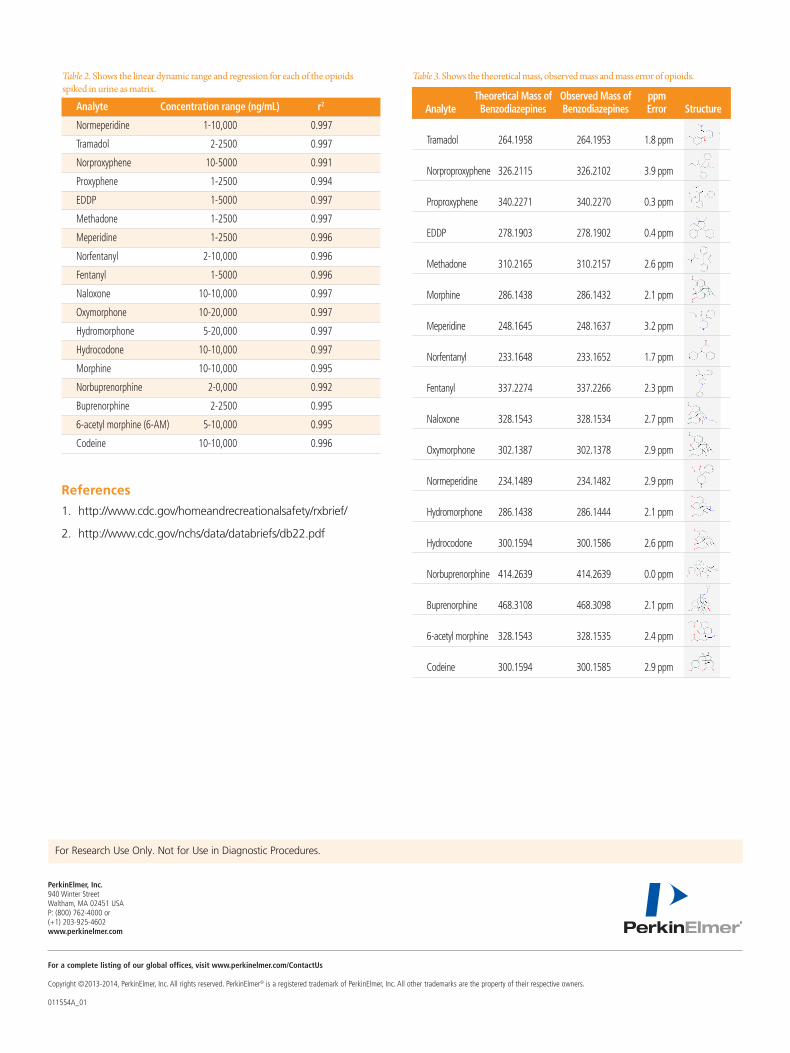
compounds that may be in the sample by simply adding these to the target list in the software and extracting their masses from the individual chromatograms. The analysis of opioids was completed in six minutes with all the compounds eluting in less than five minutes (Figure 4).
Quantification The overall assay sensitivity was determined to be in the 1-10 ng/mL range for all of the compounds spiked into urine, (Table 1). The limit of quantification (LOQs) measured by the TOF instrument were 200-2000 times more sensitive than what is required by the non-specific EMIT immunoassays for majority of the opioids (with the exception of 6 acetyl-morphine, which has a cut off of 10 ng/mL). When analyzing such low levels of compound, carryover must be assessed to ensure that the assay is suitable for use. In spite of the low LOQs provided by the TOF MS, 0% carryover was observed after injection of 1 µg/mL (1000 ng/ml) standard for most of the opioids.
The linearity of a representative drug, normeperidine is shown in Figure 5. The assay showed linearity over four orders with an r2
Figure 2. AxION Solo Software: The top left hand corner shows the presence (green) and the absence (grey) of meperidine in different serum samples (vials). The remaining opioids in the selected vial are displayed in the table (bottom left).
Figure 3. The accurate mass of methadone for A, A+1, are < 3 ppm. The isotope ratios for A+1, A+2 are within 3% of expected ratio.
Figure 4. Analysis of opioids by UHPLC-TOF MS spiked in serum < 5 min.
Figure 5. Shows linearity for EDDP (2-ethylidene-1,5-dimethyl-3,3-diphenylpyrro-lidine) spiked in serum over 1- 10,000 ng/mL concentration range(r2 = 0.997, n=5 for each calibration level).
Analyte LOQ (ng /mL)
Normeperidine 1
Tramadol 2
Norproxyphene 10
Proxyphene 1
EDDP 1
Methadone 1
Meperidine 1
Norfentanyl 2
Fentanyl 1
Naloxone 10
Oxymorphone 10
Hydromorphone 5
Hydrocodone 10
Morphine 10
Norbuprenorphine 2
Buprenorphine 2
6-acetyl morphine (6-AM) 5
Codeine 10
Table 1. Shows the LOQs of the opioids in urine.
value of 0.997. The majority of the opioids analyzed showed linearity between 3-4 orders of dynamic range with r2 values of 0.99 (Table 2). Multiple injections (n=5) of each calibration level showed excellent reproducibility (RSDs < 15%) for each of the drugs. The presence of a given drug in a urine sample can be confirmed by accurate mass and the isotope profile provided by TOF MS. As shown in Table 3, the accurate masses of each of the opioids are < 5 ppm.
Conclusions
The method required little to no sample preparation or method development, saving hours of time and the use of costly reagents and consumables. The AxION 2 TOF was easily able to identify opioids spiked in urine at concentrations as low as 1-10 ng/ml. The detection limits of these drugs were 200-2000 times lower than that required by immunoassays. The AxION 2 TOF provides wide dynamic range capabilities similar to that of a triple quadrupole mass spectrometer, and also offers the screening of untargeted compounds and the ability to retrospectively look for analytes in the data set. For rapid large scale screening of batches of samples, PerkinElmer AxION Solo software provides a quick and easy platform for forensic laboratories to detect the presence or absence of opioids in urine.
For a complete listing of our global offices, visit www.perkinelmer.com/ContactUs
Copyright ©2013-2014, PerkinElmer, Inc. All rights reserved. PerkinElmer® is a registered trademark of PerkinElmer, Inc. All other trademarks are the property of their respective owners. 011554A_01
PerkinElmer, Inc. 940 Winter Street Waltham, MA 02451 USA P: (800) 762-4000 or (+1) 203-925-4602www.perkinelmer.com
Analyte Concentration range (ng/mL) r2
Normeperidine 1-10,000 0.997
Tramadol 2-2500 0.997
Norproxyphene 10-5000 0.991
Proxyphene 1-2500 0.994
EDDP 1-5000 0.997
Methadone 1-2500 0.997
Meperidine 1-2500 0.996
Norfentanyl 2-10,000 0.996
Fentanyl 1-5000 0.996
Naloxone 10-10,000 0.997
Oxymorphone 10-20,000 0.997
Hydromorphone 5-20,000 0.997
Hydrocodone 10-10,000 0.997
Morphine 10-10,000 0.995
Norbuprenorphine 2-0,000 0.992
Buprenorphine 2-2500 0.995
6-acetyl morphine (6-AM) 5-10,000 0.995
Codeine 10-10,000 0.996
Table 2. Shows the linear dynamic range and regression for each of the opioids spiked in urine as matrix.
Table 3. Shows the theoretical mass, observed mass and mass error of opioids.
Theoretical Mass of Observed Mass of ppm Analyte Benzodiazepines Benzodiazepines Error Structure
Tramadol 264.1958 264.1953 1.8 ppm
Norproproxyphene 326.2115 326.2102 3.9 ppm
Proproxyphene 340.2271 340.2270 0.3 ppm
EDDP 278.1903 278.1902 0.4 ppm
Methadone 310.2165 310.2157 2.6 ppm
Morphine 286.1438 286.1432 2.1 ppm
Meperidine 248.1645 248.1637 3.2 ppm
Norfentanyl 233.1648 233.1652 1.7 ppm
Fentanyl 337.2274 337.2266 2.3 ppm
Naloxone 328.1543 328.1534 2.7 ppm
O xymorphone 302.1387 302.1378 2.9 ppm
Normeperidine 234.1489 234.1482 2.9 ppm
Hydromorphone 286.1438 286.1444 2.1 ppm
Hydrocodone 300.1594 300.1586 2.6 ppm
Norbuprenorphine 414.2639 414.2639 0.0 ppm
Buprenorphine 468.3108 468.3098 2.1 ppm
6-acetyl morphine 328.1543 328.1535 2.4 ppm
Codeine 300.1594 300.1585 2.9 ppm
References
1. http://www.cdc.gov/homeandrecreationalsafety/rxbrief/
2. http://www.cdc.gov/nchs/data/databriefs/db22.pdf
For Research Use Only. Not for Use in Diagnostic Procedures.