Embed Size (px)
Citation preview
Butler UniversityDigital Commons @ Butler University
Undergraduate Honors Thesis Collection Undergraduate Scholarship
Spring 4-23-2009
Liquid Carbon Dioxide Extraction of Various FoodFlavors: Evaluation and AnalysisDeven Lee ShinholtButler University
Follow this and additional works at: http://digitalcommons.butler.edu/ugtheses
Part of the Organic Chemistry Commons
This Thesis is brought to you for free and open access by the Undergraduate Scholarship at Digital Commons @ Butler University. It has been acceptedfor inclusion in Undergraduate Honors Thesis Collection by an authorized administrator of Digital Commons @ Butler University. For moreinformation, please contact [email protected].
Recommended CitationShinholt, Deven Lee, "Liquid Carbon Dioxide Extraction of Various Food Flavors: Evaluation and Analysis" (2009). UndergraduateHonors Thesis Collection. Paper 48.
BUTLER UNIVERSITY HONORS PROGRAM
Honors Thesis Certification
Applicant Deven Lee Shinholt
Thesis title Liquid Carbon Dioxide Extraction of Various Food Flavors,
!
Evaluation and Analysis.
Intended date of commencement Saturday, May 9th,2009
Read,approved,and
Thesis adviser(s) -~-=-----+---"'----:;>"t--------
Reader(s)
Certified by Director, Honors Program
Level of Honors conferred: University
Departmental
.-.
l_~ ____ ~ ______ ~_~_
3l~O Joq Date.
'iLlio't ( aate
Date
(01 2 )03 Date
'~t
~ "'
~'.
Liquid Carbon Dioxide Extraction of Various Food Flavors; Evaluation and Analysis
A Thesis
Presented to the Department of Chemistry
College of Liberal Arts and Sciences
and
The Honors Program
of
Butler University
In Partial Fulfillment
of the Requirements for Graduation Honors
Deven Lee Shinholt
April 23, 2009
.. ----.------------------~----------------------------------------------.---------------------------
2
. Table of Contents
Acknowledgements - - - - - - - - - - - - - - - - - - - - - - - - - - - - - - - - - - - - - - - - - 3
Abstract - - - - - - - - - - - - - - - - - - - - - - - - - - - - - - - - - - - - -~- - - - - - - - - - - - 4
Chapter I: Background - - - - - - - - - - - - - - - - - - - - - - - - - - - - - _. - - - - - - - - - 5
Chapter II: Qualitative Analysis - - - - - - - - - - - - - - - - - - - - - - - - - - - - - - - - 23
Chapter III: Quantitative Analysis - - - - - - - - - - - - - - - - - - - - - -- - - - - - - - - 45
Appendix A: GC Chromatograms of Volatile Extracts - - - - - - - - - - - - - - - - 55
Appendix B: MS Spectra of Major Detected Compounds - - - - - - - - - - - - - - - 61
Appendix C: Full Table of Detected Compounds - - - - - - - - - - - - - - - - - - - - 65
3
Acknowledgements
I would like to thank Dr. Anne-M. Wilson, who guided me throughout this study.
I am also thankful for Dr. Michael J. Samide and Dr. Olujide T. Akinbo for providing me
with the analytical skills necessary to carry out this project. Financial support from the
Holcomb Academic Grants and Holcomb Undergraduate Grants is greatly appreciated. I
thank the Butler Summer Institute committee for supplying adequate time and resources
for me to complete a large portion ofthis study during the summer of 2009. I would also
like to acknowledge the Butler University chemistry department for supplying the space
and resources necessary for this research to be conducted. None of this could have been
possible without these individuals.
4
Abstract
Sub- and supercritical carbon dioxide has been utilized as an extraction solvent
for a variety of natural compounds. This requires the use of specialized high-pressure
vessels. It was reported recently that common laboratory apparatus (centrifuge tubes)
could be utilized in liquid carbon dioxide extractions obviating the need for specialized
equipment. Various herbs and spices (including orange, lemon, lime, and grapefruit zest,
oregano, rosemary, sage, spearmint, nutmeg, black peppercorns, cloves, caraway seeds,
and vanilla beans) were used as substrates for liquid carbon dioxide extractions by this
straightforward technique. The extracted oils, containing terpenes and terpenoids, were
then analyzed through GC/MS. Liquid carbon dioxide extraction by this procedure was
evaluated utilizing an internal standard and GC analysis for orange zest and caraway
seeds. The terpenes and terpenoids of interest were limonene for orange zest, and
limonene and carvone for caraway seeds.
-- ------- --- - ----- ----------------~------ ---------------------------
5
Chapter I: Background
The Chemistry of Flavor
There are many "categories" of flavors that can be attributed to food. There are
the typical sweet, salty, sour, and bitter flavors, but these basic "tastes" are simply not
enough to describe more complicated flavor combinations. There are also savory, meaty,
fruity, spicy, smoky, and a host of many other flavor complexes (1). These individual-
flavors are analogous to musical instruments, each having a characteristic essence that
adds to the overall experience of a meaL
There is more to flavor than just taste. The aroma (or odor) and mouthfeel (or
trigeminal) of the food also contribute to the interpreted flavors (1,2). For instance, the
esters and aldehydes that characterize the flavors of non-citrus fruits are detected by their
aroma, rather than through taste. If aroma is eliminated from the flavor equation, then
distinguishing among these fruits becomes much more difficult. This can even create
difficulty distinguishing between an apple and an onion. The trigeminal component,
however, can contribute to pungent, astringent, or even cooling sensations of flavor. This
is easily noticeable when one eats chili peppers or peppermints. (1)
The essences of herbs and spices are contained within the combination of
compounds as well as the concentrations of these compounds. One compound may have
a particular flavor at a low concentration, but this flavor may alter significantly at higher
concentr~tions. Fisher demonstrates this when she says,
"Since odour quality may change with concentration, a chemical such as trans-non-2-enal has more than one recognition threshold: just above its detection threshold of 0.1 ppb, trans-non-2-enal possesses a woody character. Above 8 ppb, it smells fatty, becoming unpleasant at 30 ppb,
and, in an aqueous solution at 1000 ppb, it has a strong flavour of cucumber. This change in flavour with increasing concentration of an individual compound can perplex the flavour chemist ... Another problem that can occur is interaction when compounds are mixed together. When they interfere with flavour detection, this is called antagonism. When they enhance the ability to detect the flavour, it is called synergism... To demonstrate flavor synergism, one can look at ketones at concentrations where each, individual, has no aroma in water (butan-2-one, 5 ppm; pentan-2-one, 5 ppm; hexan-2-one, 1 ppm; heptan-2-one, 0.5 ppm; octan-2-one, 0.2 ppm), but a solution containing all of them together at these specific concentrations has a definite aroma." (3)
The sense oftaste is a highly-d~veloped sense within the human body. Fisher also states
"It has been estimated that as few as eight molecules are required to trigger one human
olfactory neuron and that as few as 40 molecules can produce can identifiable sensation.
6
Such levels are below the sensitivity limits of present-day analytical techniques; thus, the
human nose is a better detector than the best instruments of today!" (1,2). Several studies
have been conducted to determine olfactory detection limits and mechanisms (4).
Flavor Compounds
Flavor compounds are often categorized by volatility. This methodology is
generally used because volatility essentially determines the manner in which the flavor
compounds are detected by a person. Volatile compounds are typically sensed in the
nose, whereas less volatile compounds are detected by the taste buds. The analysis of
volatile flavor compounds (which usually have a molecular weight below 300 amu) is
often done using gas chromatography. The relative concentration of volatile compounds
is often not proportional to those compounds' flavor contributions. Fisher demonstrates
the importance of this correlation when she says,
"It is now well established that many of the larger peaks on gas chromatograms of foods do not correlate to flavour. For example,
limonene is the major component by weight of citrus oils, but it has a weak aroma. It is the oxygenated terpenes present in small amounts in these oils that have the major impact on the flavour. Although hydrocarbons like limonene my not have much aroma, they do act as a . . solvent for the powerful odorants." (5)
Generalizations of a chemical's odor, and thus its flavor, can be made based upon that
compound's functional group(s). Some major types of volatile compounds include
aldehydes, ketones, alcohols, carboxylic acids, esters, furans, phenols, terpenes, and
terpenoids. The volatile compounds of importance in this study are mainly terpenes and
terpenoids, which will be discussed in-depth later. (1)
Non-volatile flavor compounds do not have an aroma, but they can be broken
down into volatiles through heat from cooking, or even enzymes. Because oftheir non-
7
volatile nature, they are detected primarily by the taste buds in the mouth. They are often
characteristic ofthe five "tastes": sweet, sour, salty, bitter, and umami. Some major
types of non-volatile flavor compounds include: amino acids (such as L-tryptophan),
small peptides (such as aspartame), organic acids (such as citric acid or malic acid),
sugars (as in sucrose or glucose), salts (such as sodium chloride or the amino acid salt
monosodium glutamate, also known as MSG), alkaloids (such as caffeine in coffee and
tea or nicotine in tobacco), phenols (such as capsaicin in chili peppers or piperine in black
peppercorns), and isothiocyanates (such as allyl isothiocyanate in horseradish). (1)
Terpenes and Terpenoids
Terpenes are naturally occurring compounds which are composed of various
combinations of isoprene units. Isoprene, shown in Figure 1, (also known as 2-methyl-
1,3-butadiene) is a biologically important molecule.
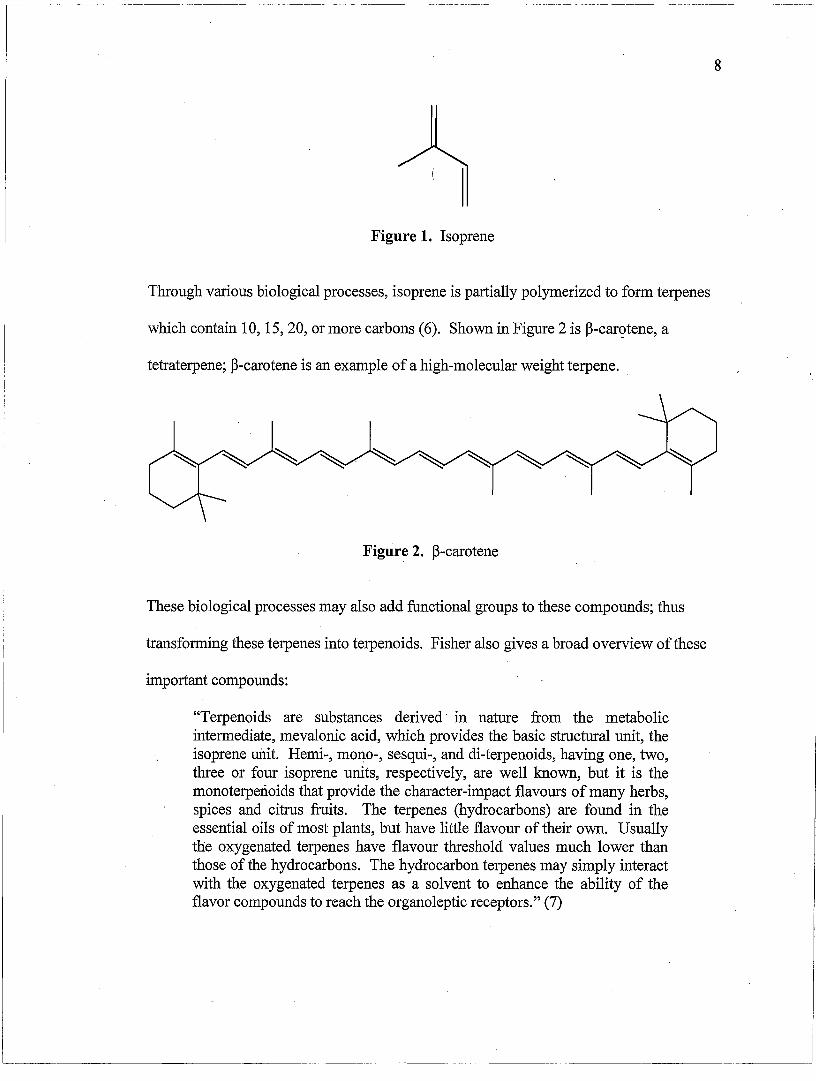
Figure 1. Isoprene
Through various biological processes, isoprene is partially polymerized to form terpenes
which contain 10, 15,20, or more carbons (6). Shown in Figure 2 is ~-car<?tene, a
tetraterpene; ~-carotene is an example of a high-molecular weight terpene.
Figure 2. ~-carotene
These biological processes may also add functional groups to these compounds; thus
transforming these terpenes into terpenoids. Fisher also gives a broad overview ofthese
important compounds:
"Terpenoids are substances derived· in nature from the metabolic intermediate, mevalonic acid, which provides the basic structural unit, the isoprene unit. Hemi-, mono-, sesqui-, and di-terpenoids, having one, two, three or four isoprene units, respectively, are well known, but it is the monoterperioids that provide the character-impact flavours of many herbs, spices and citrus fruits. The terpenes (hydrocarbons) are found in the essential oils of most plants, but have little flavour of their own. Usually the oxygenated terpenes have flavour threshold values much lower than those of the hydrocarbons. The hydrocarbon terpenes may simply interact with the oxygenated terpenes as a solvent to enhance the ability of the flavor compounds to reach the organoleptic receptors." (7)
8
- .--------.---~~---
9
Some terpenes and terpenoids contain chiral centers and are found in enantiomeric or
diastereomeric forms. An example of this is limonene, where (+)-limonene is a major
component of citrus fruits, while (-)-limonene is an important component in mint leaves.
These stereoisomers can also affect flavor. For instance, (+)-carvone gives caraway
seeds their distinctive aroma, while (-)-carvone characterizes spearmint's unique and
refreshing flavor. (8)
Terpenes and terpenoids are very important molecules in biological and
ecological processes. It has been shown that some flowers can produce terpenoids to
attract various pollinating insects. Also, terpenoids emitted from some plants have been
found to attract beneficial mites, which can feed on herbivorous insects that threaten that
plant. It has been estimated that the total terpene and terpenoid plant emissions per year
is around 500 tetragrams. As a result, the environmental effects of terpene and terpenoids
and their, degradation products is a topic of current study in environmental chemistry. (9)
Extraction Methods
Essential oils have extracted from herbs and spices for medicinal purposes since
ancient times. Many traditional Chinese medicines were made by soaking, then boiling
an herb, or a collection of herbs, in water. By doing this, the water would become
infused with the essence of the herb (10). Today, many different types of cooking oils
are made in a similar manner by soaking dried herbs and spices in cooking oil and then
heating the mixtUre to "infuse" the oil with the herbal flavor essences.
Many methods have been developed to isolate food flavors from natural sources.
Some of the more common methods include steam distillation, organic solvent extraction,
10
supercritical fluid extraction, sonication, and cold-press extraction (10-14). It seems that
no single method is always a better choice than another, because the extraction method is
heavily dependent on the substrate and preferred compounds as well as on materials,
time, and energy available. For instance, ethanol extraction (often in conjunction with
enzymes) is generally preferred when making natural vanilla extracts as it can easily
extract the aromatic compounds that are characteristic of vanilla (13). The decaffeination
of coffee beans is usually performed with supercritical carbon dioxide, as certain
conditions can be modified to alter the specificity of the compound to be extracted. In
this case, conditions can be adjusted to maximize the solubility of caffeine, but minimize
the solubility of the precious flavor compounds (15). Also, cold-press extraction and
steam distillation are both often used to extract citrus oils from citrus zests. Steam
distillation is often quicker and less expensive than cold-press extraction, but produces
lower quality oils due to the heat involved in the process (14).
Dr. Eng Shi Ong reviews and compares some common methods for herbal
extractions (12). Some of the ones he discusses include: Sonication, Soxhlet extraction,
Microwave Assisted Extraction (MAE), Supercritical Fluid Extraction (SFE), static
Accelerated Solvent Extracti~n (ASE), dynamic Pressurized Liquid Extraction (PLE),
Pressurized Hot Water Extraction (PHWE), and Surfactant assisted PHWE. MAE is an
excellent, recent method using microwaves to assist in extraction. Extraction times are
often short (less than an hour) and solvent consumption is generally small. PLE is similar
to SFE, only at sub-critical pressures and temperatures. PLE has also been shown to have
yields comparable to Soxhlet extraction. PHWE is similar to PLE, but using sub-critical
water at high temperature and pressure. This option may be preferred when organic
11
solvents are an issue, but not when thermal stability is a factor. Surfactant assisted
PHWE, as the name suggests, is PHWE with a surfactant added to increase the solubility
of the less-polar compounds. Organic modifiers (such as short-chained alcohols) may
also be added to increase the solubility of the less-polar compounds.
Soxhlet extraction generally has a high yield because ofthe continuous extraction
process. The major disadvantage, however, is the often high temperature, long extraction
time, and large amount of solvent use needed (10). Sonication is a method in which
ultrasound is used to speed the process of extraction within a system. This is a fairly
recent method that has proven itself useful in certain systems, as low frequency
sonication has been shown to degrade toxic alkaloids during the extractIon of certain
medicinal compounds. It has been suggested that sonication is superior to Soxhlet
extraction because less solvent is involved and the process is safer for compounds that are
easily thermally degradable (10).
Supercritical Fluid Extraction is a newer and greener process involving
supercritical solvents. By increasing the pressure and the temperature of a solvent, that
solvent can be forced into the supercritical phase where it has both liquid and gaseous
properties. Carbon dioxide is one of the more favored solvents, often being pressurized
to 300 bar and being held at ~ 31 DC. A small amount of cosolvent, such as ethanol or
isopropyl alcohol, is added to greatly increase the solubility of the desired polar
compounds (16). The solvent strength of a supercritical fluid is easily tunable by
modifying the pressure, which in turn changes the density of the fluid. This allows for a
dynamic specificity, of sorts. Carbon dioxide has an advantage over most other solvents
as it can reach its critical point at ~ 31 DC, allowing for the ease of extraction of thermally
degradable compounds. Also, the fact that carbon dioxide is a gas at room temperature
and pressure allows for the ease ofisolation of the-extract from the solvent (17). This
bec<;:>mes a key advantage in the method proposed in this study.
12
Steam distillation is an early discovered method for the extraction of essential oils
from herbs and spices. By steaming the leaves, seeds, or even the bark of a plant, volatile
compounds can be released and collected with the aqueous runoff. Most steam distillates
will need a liquid-liquid extraction to pull all the desired compounds from the aqueous
portion. In one study, dried thyme, basil, rosemary, chamomile, lavender, and cinnamon
were steam distilled at 55°C for 3 hours at a reduced pressure of 95 mmHg (11). The
resulting distillates were extracted with dichloromethane in a liquid-liquid continuous
extractor for 6 hours, dried over anhydrous sodium sulfate, and concentrated using a -
rotary flash evaporator. The resulting yields were 1.24 % (thyme), 1.05 % (basil),
0.087 % (rosemary), 0.45 % (chamomile), 1.06 % (lavender), and 1.08 % (cinnamon)
(w/w). Turkish bitter orange and lemon leaf oils were extracted in much the same way
(18). Steam distillation was carried out at atmospheric pressure for 2 hours on fresh
leaves. This extraction, therefore, was carried out at significantly higher pressure and
temperature, possibly resulting in more terpene/terpenoid rearrangements due to side
reactions. The oil was isolated, dried, and condensed to give 0.28 % yield for bitter
orange leaf and 0.49 % for lemon leaf (w/w).
The compar~son of liquid CO2 extraction, ethyl ether extraction, and steam
distillation was carried out using clove buds as the food substrate (19). The total yields
were 15.7 % (steam distillation), 18.0 % (liquid CO2 extraction), and 23.0 % (ethyl ether
extraction). In addition to being analysis by gas chromatography, the extracts were
13
evaluated by a panel of eight trained judges to detennine the quality of the extracts. On a
nonstructured scale with 1 = not typical and 9 == very typical, the extracts were rated 2.12
(steam distillation), 8.94 (liquid CO2 extraction), and 6.47 (ethyl ether extraction).
According to the literature, the liquid CO2 extract was a light yellow transparent liquid,
the steam distilled extract was colorless, and the ethyl ether extract was a dark green
viscous liquid, which still retained the scent of ethyl ether. It was reported that the steam
distillation did not produce artifacts, as all of the detected compounds in the GC
chromatogram were detected in the extracts of the other two extraction methods.
Steam distillation, hexane extraction, and supercritical CO2 extraction were
compared using lavandin and Indian ginger root. Interestingly, "Several cooked dishes
(soup, fish, poultry) were seasoned with ginger prepared by the same three methods,
Tasters commented favorably on the flavor balance and fresh characteristics of food
seasoned with SCC02 extracted ginger" (19). It was reported that the yields of the
lavandin extracts were 3.0 % (steam distillation), 1.2 % (hexane extraction), and 3.5 %
(supercritical CO2).
The cold-press process is a method which is often used to extract oils from the
zests of citrus fruits. This is often a superior process of extraction for these oils because
the extraction is done at a temperature that is lower than steam distillation or solvent
extraction. This is done to minimize the possibility of terpene realTangements and side
reactions that are typical of other extraction processes. These unfavored reactions can
produce byproduct flavors and an overall lower quality product. The Citrus Research and
Education Center of the Uiriversity of Florida explain in an article the theory behind the
cold-press process:
-----~-
"Citrus oil is present in small glands contained in the flavendo, which is the colored portion of the peel of the fruit. Cold-pressed citrus peel oil is obtained commercially by a process that starts with the rupture of these glands during juice extraction. For its recovery, the oil is washed away from the peei with water forming an oil-water emulsion. It is important to maintain an excess of water to prevent the oil from being reabsorbed by the peel once it is released. A two stage centrifugation process is used to recover orange oil from the oil-water emulsion." (20)
After the oil becomes isolated, it must be chilled to sub-freezing temperatures for
14
anywhere from a few days to a few weeks to solidify and remove the waxes present in the
oil. Then, the final oil product can be stored slightly below room temperature in an inert
gas atmosphere to prevent possible oxidation (14).
Hydrotropic solubilization is another method of extraction of flavor compounds.
This is a process where hydrotropes, a shorter-chained type of surfactant, are used to
selectively extract water soluble phytochemicals from natural products. The hydrotropes
are very water soluble, but tend to lack the strong surface acting forces that cause
surfactants to bubble and form micelles. Also, the shorter-chained hydrophobic portion
of the molecule can be modified to selectively solubilize particular non-polar compounds.
The size and properties of these hydrotropes allow for them to penetrate tough cell walls
and preferentially extract certain molecules in the substrate matrix. This is a process
similar to the surfactant assisted PHWE discussed earlier, only with more selective
"surfactants" and a much lower temperature and pressure (around standard temperature
and pressure versus 80-200 °C and 10-20 bar). In a recent report, this method was used
to study the extraction of piperine from black peppercorns. The proposed theory of
extraction is as follows: "The hydrotrope molecules probably adsorb on the cellulosic cell
wall, disorganize its structure, and then penetrate into the cell membrane, assisting in
- -------- -- ----------- --- ------------------------~-------------~---------------
15
disordering the amphiphilic lipid bilayer and permeabilizing it to enable the easy release
of piperine" (21).
Liquid CO2 Extraction
The extraction method under investigation in this study is liquid CO2 extraction.
Unlike most other extraction methods, this method is intended to be a small scale
operation. This method was initially conceived as a method for extraction in
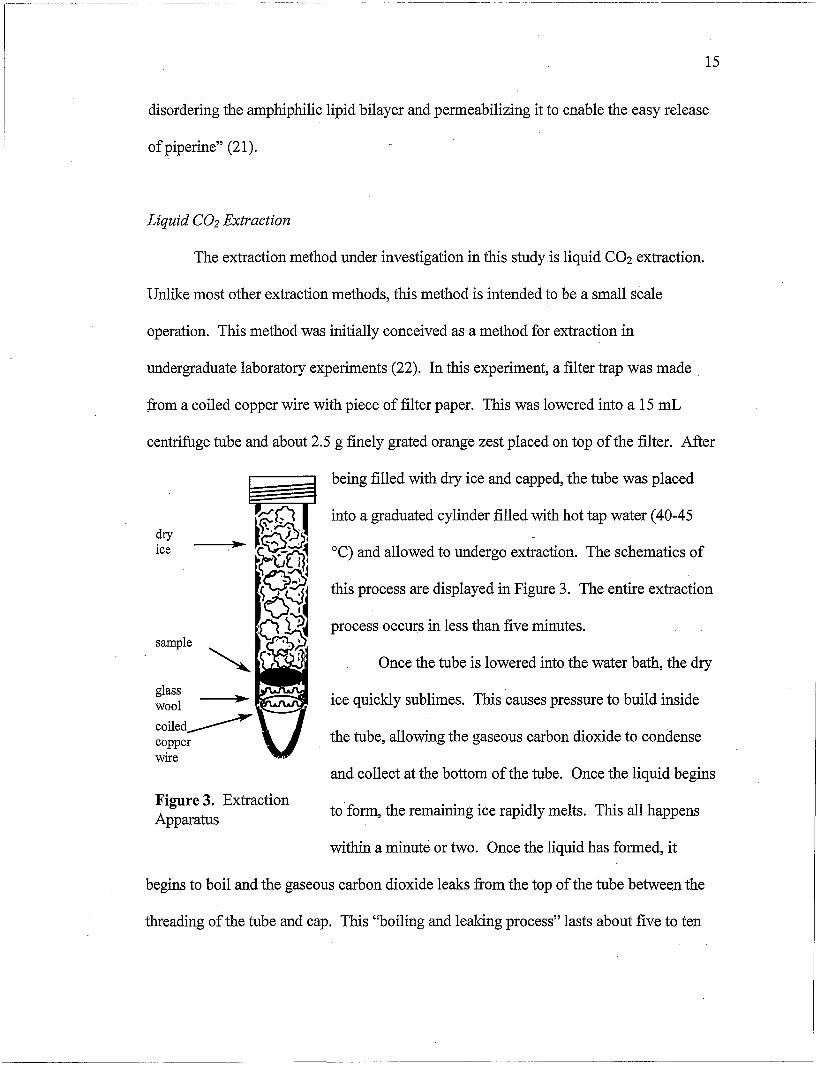
undergraduate laboratory experiments (22). In this experiment, a filter trap was made _
from a coiled copper wire with piece of filter paper. This was lowered into a 15 mL
centrifuge tube and about 2.5 g finely grated orange zest placed on top ofthe filter. After
dry ice
sample
glass wool
coiled~ copper wire
Figure 3. Extraction Apparatus
being filled with dry ice and capped, the tube was placed
into a graduated cylinder filled with hot tap water (40-45
°C) and allowed to undergo extraction. The schematics of
this process are displayed in Figure 3. The entire extraction
process occurs in less than five minutes.
Once the tube is lowered into the water bath, the dry
ice quickly sublimes. This causes pressure to build inside
the tube, allowing the gaseous carbon dioxide to condense
and collect at the bottom of the tube. Once the liquid begins
to-form, the remaining ice rapidly melts. This all happens
within a minute or two. Once the liquid has formed, it
begins to boil and the gaseous carbon dioxide leaks from the top of the tube between the
threading ofthe tube and cap. This "boiling and leaking process" lasts about five to ten
.~--.~-------------~~~---~.-.~.-----.--.--- --..
16
minutes on average and is accompanied with a hissing sound. Depending on the
"tightness" of the cap, the liquid may boil away in as little as three minutes, or as long as
twenty minutes. The filter trap holds back the food residue and allows the extracted
compounds to be isolated at the bottom of the tube. The filter trap and remaining
substrate can now be removed to reveal the isolate.
Liquid CO2 vs. Supercritical CO2
Carbon dioxide is a versatile extraction solvent as it can be used in either its liquid
or supercritical forms. Both solvent phases require different conditions, and thus provide
different extraction conditions which can be tailored to the specific needs of the system at
hand. A study performed on essential oil extraction methods with carbon dioxide makes
some distinctions on the uses of liquid and supercritical carbon dioxide:
"In food and pharmaceutical applications, carbon dioxide (C02) is by far the most used fluid since it meets most of the characteristics for an ideal processing fluid. Depending on the goal of the process, CO2 can be used as a supercritical fluid (SCC02 or SLC02) or a sub critical liquid (LC02). In applications where yield and operating cost are more important than solvent selectivity, as in the case of vegetable oil extraction, SCC02 has been used. On the other hand, in deodorization and extraction of essential oils and aromas, the selectivity of the solvent is often more important than its solubilization power, and LC02 has been the preferred solvent. The extraction andlor fractionation of essential oils and oleoresins by using CO2 has been investigated before, but most of the research activity in this area occurred in the last five years. At least one product (hops essence) is currently produced on a large scale by using SC fluid technology." (23)
It has also been shown that liquid and supercritical carbon dioxide can be used to
concentrate flavor compounds in essential oils, juices, and other foodstuffs (24,25).
Carbon dioxide is being more frequently used in the citrus industry now than ever. The
extraction of essential oils from lemon peel was performed with supercritical carbon
17
dioxide at a pressure of 30 MPa and a temperature of 40°C. This produced a yield of
0.9% that was qualitatively consistent with cold pressed lemon oil (26).
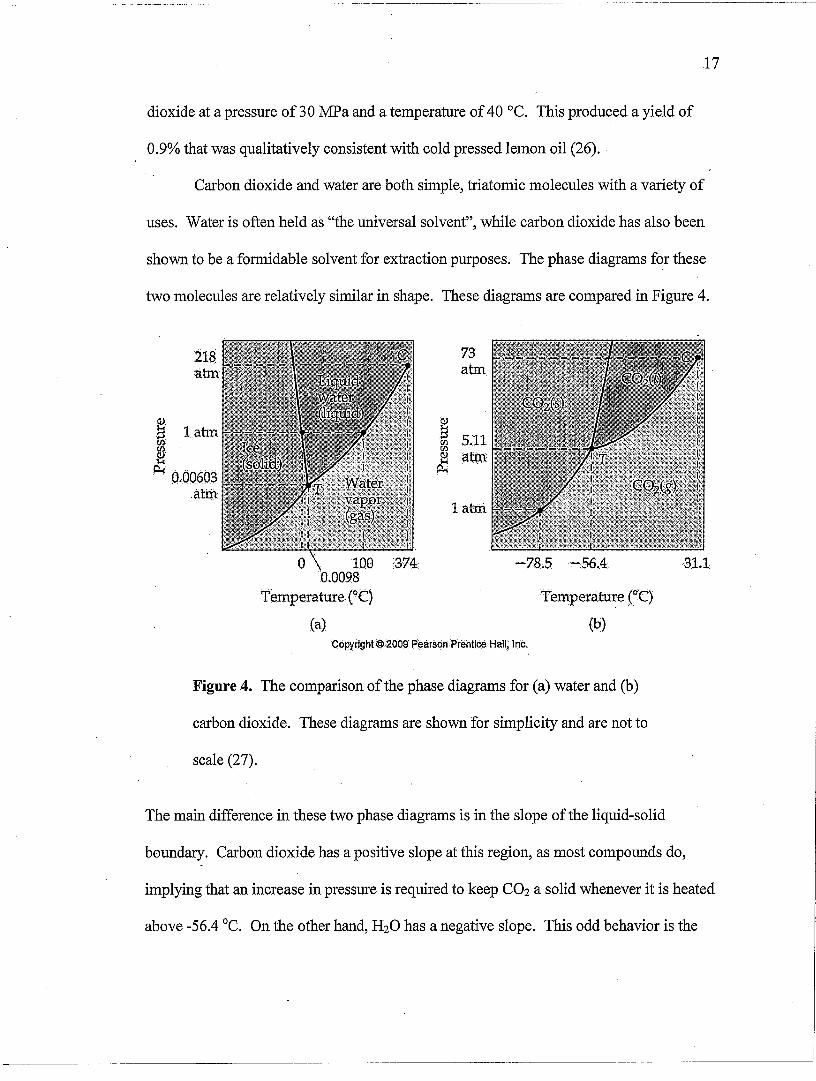
Carbon dioxide and water are both simple, triatomic molecules with a variety of
uses. Water is often held as "the universal solvent", while carbon dioxide has also been
shown to be a formidable solvent for extraction purposes. The phase diagrams for these
two molecules are relatively similar in shape. These diagrams are compared in Figure 4.
21~ atm
TemperatureeC)
(a)
73 atm
latni
-78.5,...,56.4
Temperature eC)
(b) [email protected]; Inc.
Figure 4. The comparison of the phase diagrams for (a) water and (b)
carbon dioxide. These diagrams are shown for simplicity and are not to
scale (27).
The main difference in these two phase diagrams is in the slope of the liquid-solid
3.1.1
boundary. Carbon dioxide has a positive slope at this region, as most compounds do,
implying that an increase in pressure is required to keep CO2 a solid whenever it is heated
above -56.4 °c. On the other hand, H20 has a negative slope. This odd behavior is the
-------~-~-- ---
18
result of the decrease in density when water freezes. When a block of ice is pressurized,
a strain is placed upon the hydrogen bonds holding the lattice together. This increase in
strain will cause the ice to melt at lower temperatures. It can be seen that water can exist
in all three phases at atmospheric pressure because its triple point falls well below
standard pressure, at a mere 0.00603 atm. This is simply not the case with CO2, as its
triple point lies at 5.11 atm. Also, supercritical CO2 is much more easily obtained than
supercritical H20, with critical points of31.1 °c / 73 atm and 374°C /218 atm,
respectively.
Although it is unknown exactly what pressures are produced during the proposed
liquid CO2 method, it must be at least 5.11 atm. Due to observations and tube
specifications, it is assumed that the temperature and pressure conditions of the liquid
CO2 extraction are near the triple point (-56.4 °c and 5.11 atm) (22). Pressures that are
too much greater than this can cause the extraction tube to crack and even explode. This
issue was not reported in the literature.
Significance of Project
The proposed extraction method has some distinct advantages over other
commonly used extraction methods. Firstly, the extraction process is a green process, as
it uses carbon dioxide as solvent, rather than potentially dangerous solvents, such as
dichloromethane, hexane, toluene, or methanol. Secondly, the separation of the solvent
from the extract is relatively simple, as the carbon dioxide spontaneously boils away,
leaving behind a pure extract. This eliminates any steps involving a rotary evaporator,
which may leave behind a trace amount ofthe solvent. Thirdly, the cost of an extraction
.------ .--- -~~-
19
is significantly less expensive than a traditional extraction, as all that is needed is the
plastic centrifuge tube, a wire, glass wool, and dry ice. A traditional extraction requires
the initial investment of organic glassware, such as separatory funnels or Soxhlet
extractors, as well as a continuous supply of fresh solvent. These extractions may require
hundreds of milliliters of solvent for only a gram or less of isolate. All of the materials
required for the proposed method of extraction are readily available and inexpensive
compared to the materials and machinery required for a typical liquid or supercritical
carbon dioxide extraction. Overall, this extraction process can demonstrate fundamental
extraction techniques in the undergraduate laboratory.
References
1. Fisher, C. Introduction-Problems in Flavour Research. Food Flavours: Biology and
Chemistry, 1st ed.; RCS Paperbacks; The Royal Society of Chemistry: Cambridge,
UK, 1997, pp 8-9.
2. Devries H.; Stuiver M. In Sensory Communication, ed. W. A. Rosenblith; Wiley:
New York, 1961, pp 159.
3. Fisher, C. Introduction-Problems in Flavour Research. Food Flavours: Biology and
Chemistry, 1st ed.; RCS Paperbacks; The Royal Society of Chemistry: Cambridge,
UK, 1997, pp 10-12.
4. Cometto-Muniz, J. Enrique; Cain, William S.; Abraham, Michael H. "Determinants for
Nasal Trigeminal Detection of Volatile Organic Compounds" Chern. Senses, 2005,
30, 627-642.
20
5. Fisher, C. Flavour Compounds. Food Flavours: Biology and Chemistry, 1st ed.; RCS
Paperbacks; The Royal Society of Chemistry: Cambridge, UK, 1997, pp 15-16.
6. Seidel, A. Ed., Kirk-Othmer Encyclopedia of Chemical Technology, 5th ed.; John
Wiley & Sons, Inc.: Hoboken, New Jersey, 2007; vol. 24, pp 468.
7. Fisher, C. Flavour Compounds. Food Flavours: Biology and Chemistry, 1st ed.; RCS
Paperbacks; The Royal Society of Chemistry: Cambridge, UK, 1997, pp 19.
8. Fisher, C. Flavour Compounds. Food Flavours: Biology and Chemistry, 1st ed.; ReS
Paperbacks; The Royal Society of Chemistry: Cambridge, UK, 1997, pp 15-55.
9. Zwenger, S.; Basu, C. "Plant terpenoids: applications and future potentials." Biotech.
Molec. Bio. Rev. 2008, 3, 1-7.
10. Wang, x.; Kapoor, V.; Smythe, G. A. Extraction and Chromatography-Mass
Spectrometric Analysis of the Active Principles from Selected Chinese Herbs and
Other Medicinal Plants. Am. J. Chin. Med. 2003, 31, 927-944.
11. Lee, K.-G.; Shibamoto T. "Determination of Antioxidant Potential of Volatile
Extracts Isolated from Various Herbs and Spices." J. Agric. Food Chem. 2002, 50,
4947-4952.
12. Ong, E. S. "Extraction methods and chemical standardization of botanicals and
herbal preparations." J. chromatogr. B. 2004, 812,23-33.
13. Shyamala, B. ~.; Naidu, M. M.; Sulochanamma, G.; Srinivas P. "Studies on the
Antioxidant Activities of Natural Vanilla Extract and Its Constituent Compounds
through in Vivo Models." J. Agric. Food Chem. 2007, 55, 7738-7743.
14. Temelli, F.; Braddock, R. J.; Chen, C. S.; Nagy, S. "Supercritical Carbon Dioxide
Extraction of Terpenes from Orange Essential Oil." In Supercritical Fluid Extraction
------------------- -- -----------------------------------------
21
and Chromatography: Techniques and Applications; Charpentier, B. A.; Sevenants,
M. R. Eds.; ACS Symposium Series; American Chemical Society: Washington, DC,
1988; 366, 107-126.
15. Seidel, A. Ed., Kirk-Othmer Encyclopedia of Chemical Technology, 5th ed.; John
Wiley & Sons, Inc.: Hoboken, New Jersey, 2007; vol. 7, pp 263.
16. Leal, P. F.; Braga, M. E. M.; Sato, D. N.; Carvalho, 1. E.; Marques, M. O. M.;
Meireles, M. A. A. "Functional Properties of Spice Extracts Obtained via
Supercritical Fluid Extraction." J. Agric. Food Chern. 2003,51,2520-2525.
17. Hawthorne, S. B.; Krieger, M. S.; Miller, D. J. "Analysis of Flavor and Fragrance
Compounds Using Supercritical Fluid Extraction Coupled with Gas
Chromatography." Anal. Chern. 1988,60,472-477.
18. Kirbaslar, G.; Kirbaslar S.1. "Composition of Turkish Bitter Orange and Lemon Leaf
Oils." J. Essent. Oil Res. 2004, 16, 105-108.
19. Meireles, M. A. A.; Nikolov, Z. 1. "Extraction and fractionation of essential oils
with liquid carbon dioxide." In Developments in Food Science: Spices, Herbs, and
Edible Fungi; Charalambous, G. Ed.; Elsevier Scientific: Amsterdam, New York,
1994; 34, 173.
20. Temelli, F.; Braddock, R. J.; Chen, C. S.; Nagy, S. "Supercritical Carbon Dioxide
Extraction of Terpenes from Orange Essential Oil." In Supercritical Fluid Extraction
and Chromatography: Techniques and Applications; Charpentier, B. A.; Sevenants,
M. R. Eds.; ACS Symposium Series; American Chemical Society: Washington, DC,
1988; 366, 109-110.
22
21. Raman, G.; Gaikar, V. G. "Extraction of Piperine from Piper nigrum (Black Pepper)
by Hydrotropic Solubilization." Ind. Eng. Chem. Res, 2002, 41, 2966-2976.
22. McKenzie, L.; Thompson, J.; Sullivan,R.; Hutchison, J. "Green chemical processing
in the teaching laboratory: a convenient liquid C02 extraction of natural products."
Green Chem. 2004, 6, 355-358.
23. Meireles, M. A. A.; Nikolov, Z. L. "Extraction and fractionation of essential oils
with liquid carbon dioxide." In Developments in Food Science: Spices, Herbs, and
Edible Fungi; Charalambous, G. Ed.; Elsevier Scientific: Amsterdam, New York,
1994; 34, 172.
24. Meire1es, M. A. A.; Nikolov, Z. L. "Extraction and fractionation of essential oils
with liquid carbon dioxide." In Developments in Food Science: Spices, Herbs, and
Edible Fungi; Charalambous, G. Ed.; Elsevier Scientific: Amsterdam, New York,
1994; 34, 171-199.
25. Shen, Z.; Mishra, V.; Imison, B.; Palmer, M.; Fairclough, R. "Use of Adsorbent and
Supercritical carbon Dioxide To Concentrate Flavor Compounds from Orange Oil." J.
Agric. Food Chem. 2002, 50, 154-160.
26. Meireles, M. A. A.; Nikolov, Z. L. "Extraction and fractionation of essential oils
with liquid carbon dioxide." In Developments in Food Science: Spices, Herbs, and
Edible Fungi; Charalambous, G. Ed.; Elsevier Scientific: Amsterdam, New York,
1994; 34, 179.
27. Brown, T. E.; LeMay, H. E.; Burnsten, B. E.; Murphey, C.; Woodward, P. Molecular
Forces, Liquids, and Solids. Chemistry-The Central Science, 11th ed.;
Pearson/Prentice Hall: Upper Saddle River, NJ; 2009, p. 458.
23
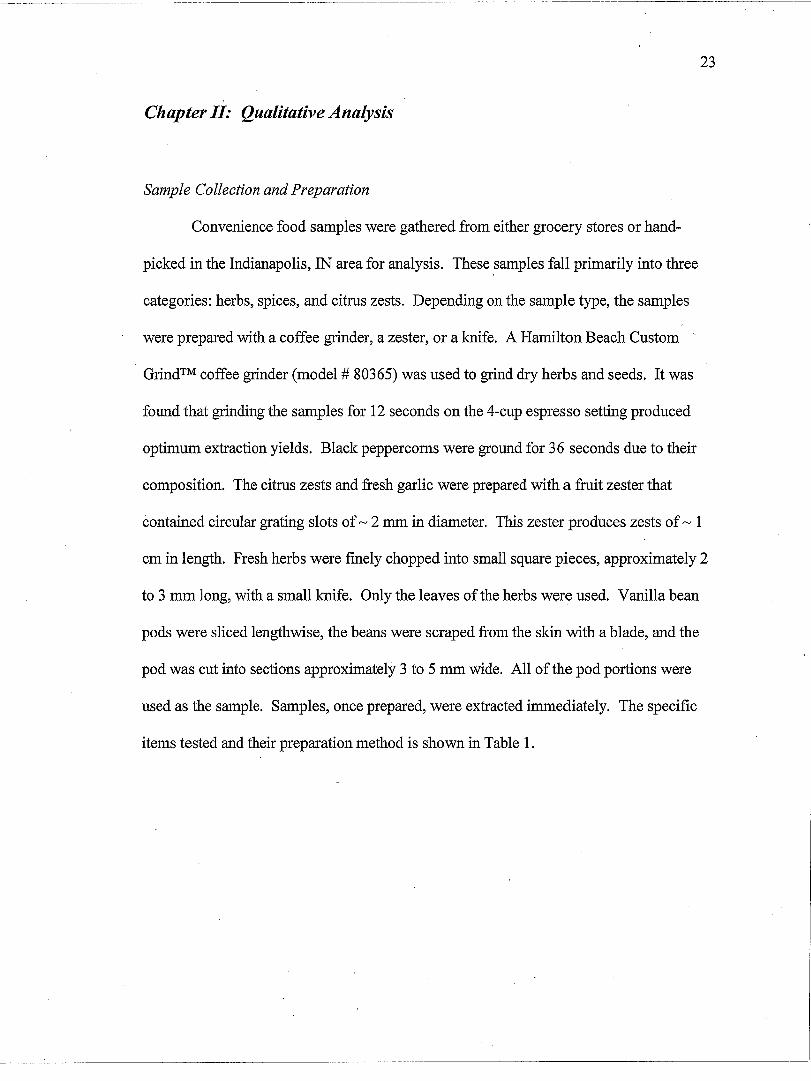
Chapter II: Qualitative Analysis
Sample Collection and Preparation
Convenience food samples were gathered from either grocery stores or hand
picked in the Indianapolis, IN area for analysis. These samples fall primarily into three
categories: herbs, spices, and citrus zests. Depending on the sample type, the samples
were prepared with a coffee grinder, a zester, or a knife. A Hamilton Beach Custom -
Grind™ coffee grinder (model # 80365) was used to grind dry herbs and seeds. It was
found that grinding the samples for 12 seconds on the 4-cup espresso setting produced
optimum extraction yields. Black peppercorns were ground for 36 seconds due to their
composition. The citrus zests and fresh garlic were prepared with a fruit zester that
contained circular grating slots of ~ 2 mm in diameter. This zester produces zests of ~ 1
cm in length. Fresh herbs were finely chopped into small square pieces, approximately 2
to 3 mm long, with a small knife. Only the leaves of the herbs were used. Vanilla bean
pods were sliced lengthwise, the beans were scraped from the skin with a blade, and the
pod was cut into sections approximately 3 to 5 mm wide. All of the pod portions were
used as the sample. Samples, once prepared, were extracted immediately. The specific
items tested and their preparation method is shown in Table 1.
------------------------- ------ --- --------------------------
24
Table 1. Summary of food substrates used and their prepared state.
Substrate Substrate State of Substrate Preparation Category Tested Method Herbs Oregano Fresh (minced) Knife
Dried/Fresh-frozen Grinder Rosemary Fresh Knife
DriedlFresh-frozen Grinder Sage Fresh Knife
Dried/Fresh-frozen Grinder Spearmint Fresh Knife
DriedlFresh-frozen Grinder Dill Weed Dried Grinder Thyme Dried Grinder Tea leaves Dried Grinder (black) Tobacco leaves Dried Grinder
Spices Black Whole/Crushed/Coarsely Grinder peppercorns ground Nutmeg Coarsely ground Grinder Cloves Coarsely ground Grinder Caraway seeds Whole/Crushed/Coarsely Grinder
ground Vanilla beans Chunked/Minced Knife Sesame seeds Coarsely ground Grinder Safflower Coarsely ground Grinder seeds Chili peppers Coarsely ground (dried) Grinder Garlic (Fresh) Zested Zester Garlic (Freeze- Coarsely ground Grinder dried) Cinnamon Coarsely ground Grinder (cassia bark)
Citrus Zests Orange zest Zested Zester Lemon zest Zested Zester Lime zest Zested Zester Grapefruit zest Zested Zester
Miscellaneous Coffee beans Coarsely ground Grinder Instant coffee Powdered N/A Milk chocolate Coarsely ground Knife Dark chocolate Coarsely ground Knife
------- ---------------
25
Coarsely ground samples refer to a sample size approximating the appearance of instant
coffee, while finely ground samples refer to sample grains the size of powdered sugar.
Whole samples (seeds or leaves) generally did not produce an extract. This is probably
due to the thick, rigid outer covering of the seeds and the thick membranes surrounding
the leaf cells. It has been suggested that glycoproteins may be the primary inhibitor of
solvent penetration in leaves (1). Glycoproteins are generally more abundant in leaf
membranes than in seeds or fruit zests. It is possible that these glycoproteins bind tightly
to the oils in the leaves, not allowing them to be easily removed through these extraction
conditions. Raman and Gaikar discuss the cellular structure of black peppercorns and
how this structure inhibits the extraction of piperine by hydrotropic solubilization (2).
The thick cellulose walls in the pericarp, which are glucose polymers held tightly
together by hydrogen bonding, may provide a thick barrier that shields the volatile
compounds from the solvent.
Coarsely grinding the sample provided much better extraction results than no
grinding at all. By grinding the sample, the outer membranes can be ruptured, readily
exposing the volatile compounds to the extraction solvent. Grinding also greatly
increases the surface area of the sample exposed to the solvent. Finely ground samples
did not work. Ifthe sample was ground into a powder, the fine particles tended to clog
the filter trap, which prevented the liquid carbon dioxide from reaching the bottom of the
tube. All dried herbs and spices (excluding vanilla beans) were coarsely ground for
analysis.
Some herbs were able to be obtained in their fresh form: oregano, rosemary, sage,
and spearmint. The fresh herbs were prepared by chopping them into small pieces. Fresh
herbs were also dried for three days to remove any interference that the residual water
might have on the extraction process. Fresh herbs were also placed into 2 zip-top bags
and frozen at a temperature of -18°C for approximately a week. These frozen herbs·
were then thawed and dried for three days. This process, producing "fresh-frozen"
samples, ruptured the cellular structure of the leaves before the removal of residual
moisture. The dried and fresh-frozen herbs were coarsely ground for 12 seconds in the
grinder prior to being placed into the extraction apparatus.
26
The citrus fruits were zested with a small zester to remove the outermost tissue of
the fruits. Prior to zesting, the skin of the fruit was wiped with hexane to remove any
wax coating on the surface. If left intact, this wax coating would contaminate the isolate
and interfere with the analysis. The vanilla beans were sliced lengthwise,and then
chopped into small pieces to allow proper solvent penetration. The chocolate was also
chopped into small pieces.
Dry ice was obtained from Pain, Inc. (Indianapolis, IN). After purchase, the dry
ice was stored in a -60°C freezer until use. Care must be taken when handling dry ice to
prevent water contamination of samples to the extent possible (removal of residual
surface moisture).
Analytical Standarp,s
Analytical standards were purchased from Sigma-Aldrich for qualitative and
quantitative analysis purposes: limonene; carvone; menthol; and vanillin. Information
concerning these standards is detailed in Table 2.

27
Table 2. Analytical standards purchased from Sigma-Aldrich.
Com~ound Manufacturer - Grade Catalog No. Lot No. R -( +)-Limonene Fluka > 99.0 % 62118 1360549
. (+ )-Carvone Fluka ~ 98.5 % 22070 1300739 L-Menthol SAFC 99+% W266523 o 1304EH Vanillin SAFC ~97% W310727 17005DH
(certified kosher)
Extraction Apparatus
The method developed by McKensie, et al. was slightly altered to better suit this
project (3). The main difference is the use of glass wool as a filter medium rather than
filter paper. In our hands, filter paper was not porous enough to allow the liquid carbon
dioxide to flow through. Many different filter options were tested, but did not provide·
sufficient solvent penetration: filter paper, kimwipe, tea bag filter, and cotton. A thin
layer of glass wool provided sufficient solvent penetration while also allowing fine
particulate matter, such as crushed herbs, to be studied. Extremely fme particulates, such
as fine powders, are not suitable for this method because they clog the space between the
strands of glass wool.
Glass wool was the only filter-like material that provided sufficient results for
these studies. Care must be taken to achieve the desired results. If the layer of glass
wool is too thick, then it loses its porosity and presents the same challenges as th~ other
attempted filter materials. If the layer is to thin, then the gaps between fibers become too
large and the substrate flows to the bottom of the tube. With practice, the proper amount
of glass wool needed for an extraction can be consistently achieved. Approximately a 50
mg tuft of glass wool, or ~ Imm layer, is optimal.
28
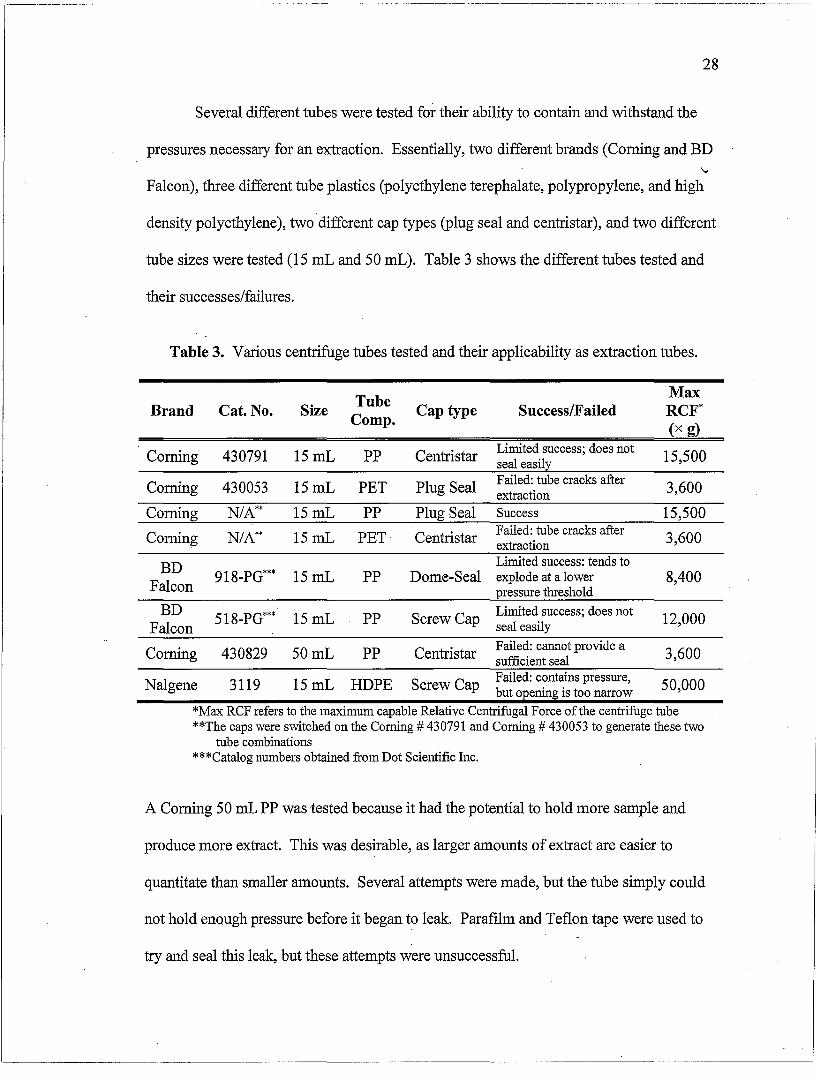
Several different tubes were tested for their ability to contain and withstand the
pressures necessary for an extraction. Essentially, two different brands (Corning and BD
Falcon), three different tube plastics (polyethylene terephalate, polypropylene, and high
density polyethylene), two different cap types (plug seal and centristar), and two different
tube sizes were tested (15 mL and 50 mL). Table 3 shows the different tubes tested and
their successes/failures.
Table 3. Various centrifuge tubes tested and their applicability as extraction tubes.
Tube Max
Brand Cat. No. Size Compo
Cap type SuccesslFailed RCF" (x g)
Corning 430791 15mL PP Centristar Limited success; does not
15,500 seal easily
Corning 430053 15mL PET Plug Seal Failed: tube cracks after 3,600 extraction
Corning N/A"" 15mL PP Plug Seal Success 15,500
Corning N/A"' 15mL PET Centristar Failed: tube cracks after 3,600 extraction
BD Limited success: tends to
Falcon 918-PO""" 15mL PP Dome-Seal explode at a lower 8,400
pressure threshold
BD 518-PO"'" 15mL PP Screw Cap Limited success; does not
12,000 Falcon seal easily
Corning 430829 50mL PP Centristar Failed: cannot provide a
3,600 sufficient seal
Nalgene 3119 15mL HDPE Screw Cap Failed: contains pressure,
50,000 but opening is too narrow
*Max RCF refers to the maximum capable Relative Centrifugal Force of the centrifuge tube **The caps were switched on the Corning # 430791 and Coming # 430053 to generate these two
tube combinations ***Catalog numbers obtained from Dot Scientific Inc.
A Corning 50 mL PP was tested because it had the potential to hold more sample and
produce more extract. This was desirable, as larger amounts of extract are easier to
quantitate than smaller amounts. Several attempts were made, but the tube simply could
not hold enough pressure before it began to leak. Parafilm and Teflon tape were used to
try and seal this leak, but these attempts were unsuccessful.
29
A Nalgene HDPE centrifuge tube was tested for its extraction potential, but its
opening was too small relative to the body of the tube. This smaller opening limited the
function of the filter trap because the trap had to be made small enough to fit into the
tube. The bottom of the tube was spherical and not conical, not leaving much space for
the extract to reside after the extraction. The HDPE composition of the tube did allow it
to maintain the proper pressure containment needed to produce liquid carbon dioxide.
Overall, the Corning 15 mL PP centrifuge tube with the plug-seal cap and the BD
Falcon 15 mL PP centrifuge tube with the plug-seal cap provided the optimal conditions
to produce liquid carbon dioxide. The BD Falcon tubes were selected for most of the
extractions because oftheir greatly reduced cost compared to their Corning alternative. It
was later discovered that the BD Falcon tubes had a lower tolerance for pressure than the
Corning tubes. Occasionally, a BD Falcon tube would explode under the pressure
produced by the rapidly subliming dry ice. The safety precautions taken are described
below.
If time and resources were permitted, a customized extraction device could be
built to optimize the conditions necessary for successful extractions of these substrates.
Perhaps a custom built filter, similar to the stainless steal filters used in a coffee espresso
maker, could be fashioned. This would eliminate many complications, but would also
detract from the low cost and ease of availability of the extraction device in the first
place.
30
Safety Precautions
Throughout this project, there have been several incidents where a centrifuge tube
would explode during the extraction process. This was experienced with only the BD
Falcon 15 mL PP centrifuge tubes with the plug-seal caps. Because these explosions did
not occur until sometime after the tube-selection process, it is unknown whether any
other centrifuge tubes might experience this same problem. It was initially assumed that
the explosions were the result of "bad" batches of dry ice, but other factors may be the
cause. It is possible that the BD Falcon tubes do not have the same pressure capabilities
as the Corning tubes.
A secondary container was used to contain anypossible explosions. A large, steel
desiccator was used for the secondary containment. A smaller metal desiccator was
placed inside and used as the water bath. In addition to this, the extractions were
performed in a fume hood with the safety doors closed.
Extraction Procedure
First; a new extraction tube was selected and weighed. Next, the filter trap was
prepared by taking a copper wire and coiling one end of it so that there are at least two
full coils. The wire is bent so that the coils can be easily lowered into and pulled out of
the tube. The wire gauge was thick enough to easily hold its shape, but thin enough to be
easily modified. A small tuft of glass wool (~50 mg) is placed between the two coils,
where it is held securely. This filter trap can now be placed into the extraction tube.
Next, the sample is prepared and immediately placed into the tube, on top of the
filter trap. The dry ice is crushed and placed on top ofthe sample, filling the rest of the
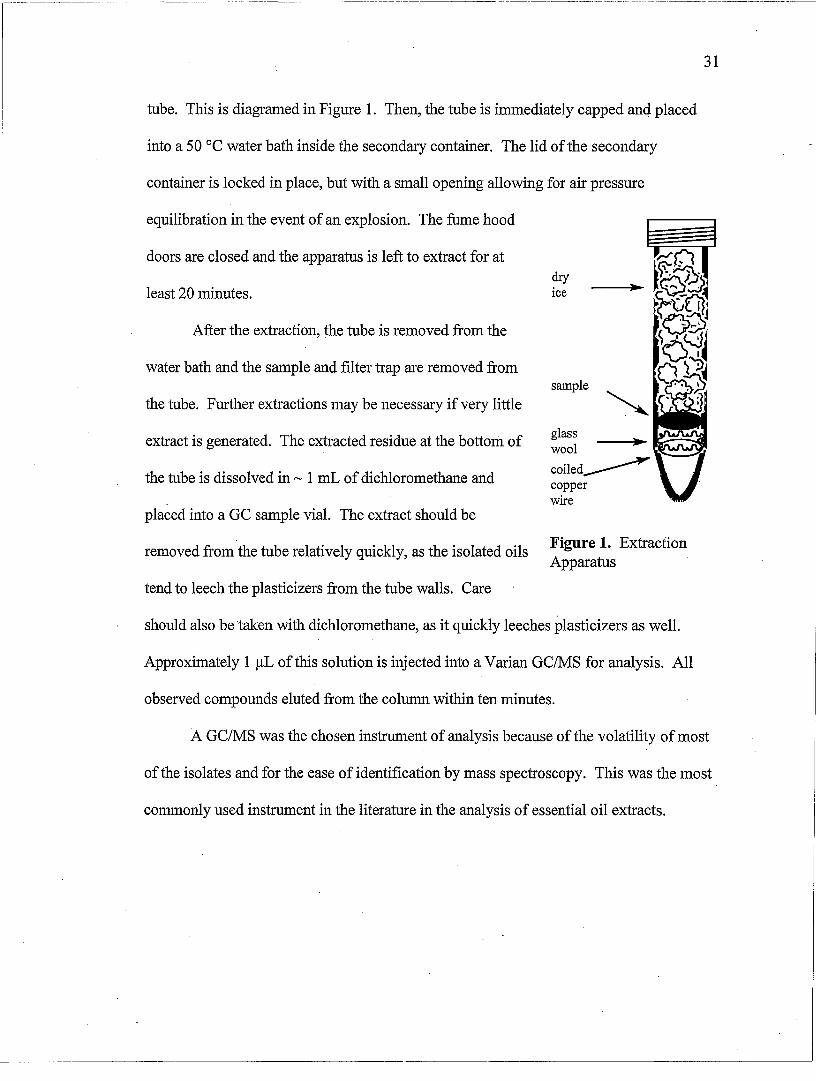
~~-~ -~-------~-------~~--~~ --- - - -- ---- ----------~-~~~-
tube. This is diagramed in Figure 1. Then, the tube is immediately capped an4 placed
into a 50°C water bath inside the secondary container. The lid ofthe secondary
container is locked in place, but with a small opening allowing for air pressure
equilibration in the event of an explosion. The fume hood
doors are closed and the apparatus is left to extract for at
least 20 minutes.
After the extraction, the tube is removed from the
water bath and the sample and filter trap are removed from
the tube. Further extractions may be necessary if very little
extract is generated. The extracted residue at the bottom of
the tube is dissolved in ~ 1 mL of dichloromethane and
placed into a GC sample vial. The extract should be
removed from the tube relatively quickly, as the isolated oils
tend to leech the plasticizers from the tube walls. Care
dry ice
sample
glass wool
coiled~ copper wire
Figure 1. Extraction Apparatus
should also be taken with dichloromethane, as it quickly leeches plasticizers as well.
Approximately 1 JlL of this solution is injected into a Varian GC/MS for analysis. All
observed compounds eluted from the column within ten minutes.
31
A GC/MS was the chosen instrument of analysis because of the volatility of most
of the isolates and for the ease of identification by mass spectroscopy. This was the most
commonly used instrument in the literature in the analysis of essential oil extracts.
---~- ~-------~--~~--.-~-- ---~~~--~------~.~-----------~-. -~--------~-- - --- ~
32
Instrument Specifications
The Varian CP-3800 GC was equipped with an AT-5ms capillary column (30 m x
0.32 mm x 1.00 /lm film thickness) with a stationary phase consisting of 5 % phenyl and
95 % dimethylpolysiloxane (Alltech Associates, Inc., USA). The oven temperature was
programmed with an initial temperature of 50°C held for 1 min, followed by an increase
of20 °C/min to 260°C, and then held for the remainder of the analysis. The injector
temperature was held constant at 260 °C. Helium was used as a carrier gas at a constant
column flow rate of 1.0 mLlmin. The GC was also equipped With a Saturn 2000 MSIMS
ion-trap mass spectrometer with a mass range of35-550 (mlz).
Results and Discussion
Samples Analyzed with GCIMS
The following samples produced isolates that were analyzable by GC/MS:
oregano; sage; rosemary; spearmint; black peppercorns; nutmeg; cloves; caraway seeds;
vanilla beans; orange zest; lemon zest; lime zest; and grapefruit zests. These samples
contained a significant amount of terpenes and terpenoids, which were the primary class
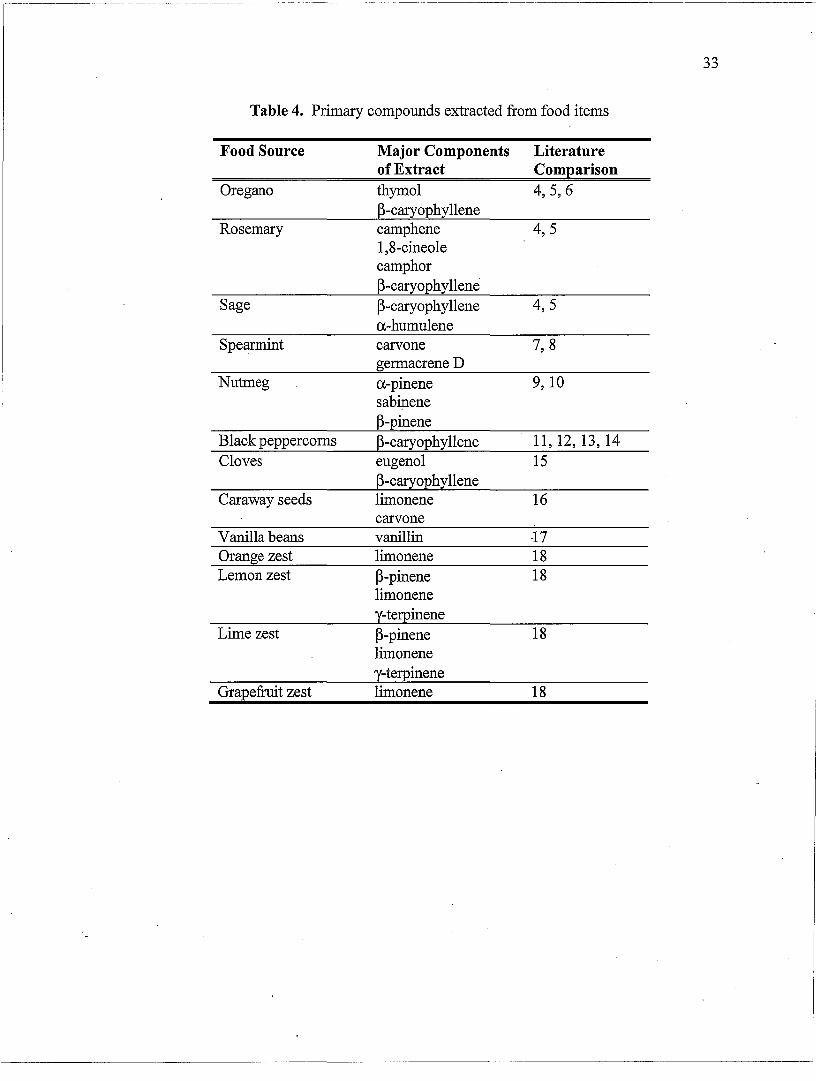
of compounds detected with this method. Table 4 summarizes the primary components
extracted from the~e food samples.
- - -------------~----~---~-~-------- ----~
33
Table 4. Primary compounds extracted from food items
Food Source Major Components Literature of Extract Com~arison
Oregano thymol 4,5,6 ~-caryophyllene
Rosemary camphene 4,5 1,8-cineole camphor ~-caryophyllene
Sage ~-caryophyllene 4,5 a-humulene
Spearmint carvone 7,8 germacrene D
Nutmeg a-pinene 9,10 sabinene ~-pinene
Black peppercorns ~-caryophyllene 11, 12, 13, 14 Cloves eugenol 15
~-caryoEhyllene Caraway seeds limonene 16
carvone Vanil1a beans vanillin -17 Orange zest limonene 18 Lemon zest ~-pinene 18
limonene y-terpinene
Lime zest ~-pinene 18 limonene 1-terpinene
Grapefruit zest limonene 18
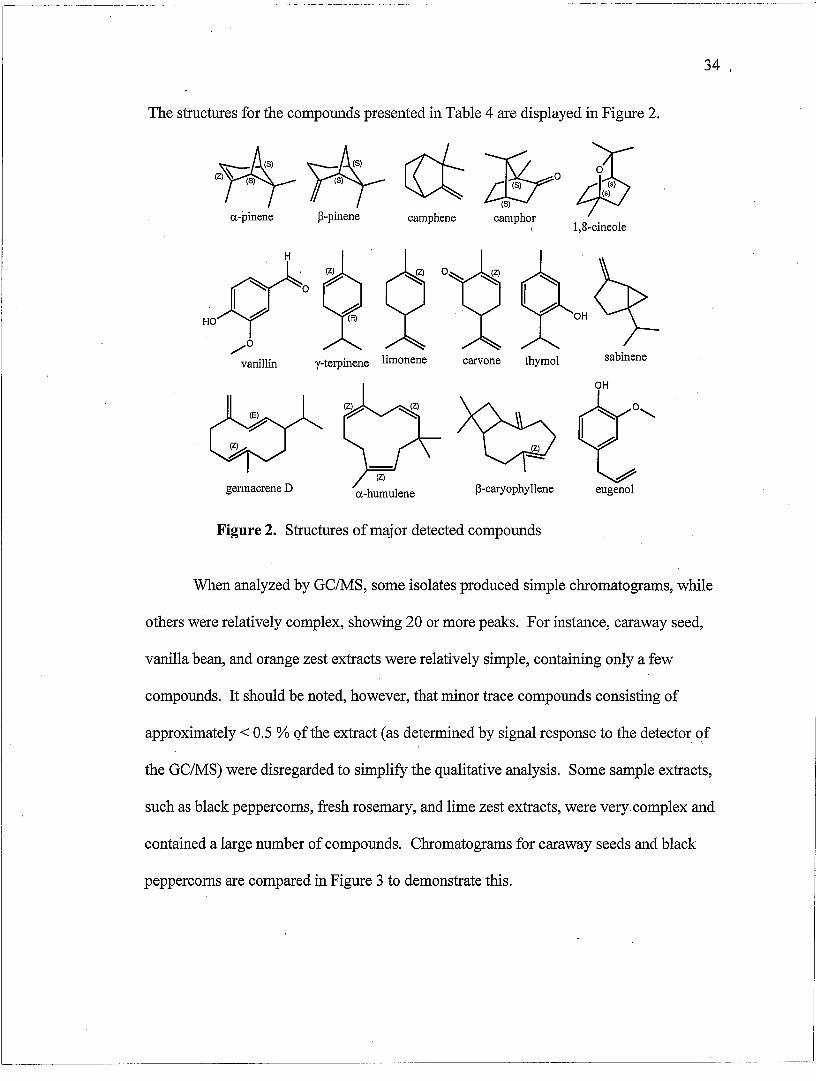
The structures for the compounds presented in Table 4 are displayed in Figure 2.
rkrS) yfyS) cd: ~ 4h ~~ 0 (S) (S) (S) (5\5)
(S)
a-pinene p-pinene camphene camphor
~o HO~
/0
vanillin y-terpinene limonene
germacrene D a-humulene
, 1,8-cineole
carvone thymol sabinene
OH
p-caryophy llene eugenol
Figure 2. Structures of major detected compounds
34 ,
When analyzed by GCIMS, some isolates produced simple chromatograms, while
others were relatively complex, showing 20 or more peaks. For instance, caraway seed,
vanilla bean, and orange zest extracts were relatively simple, containing only a few
compounds. It should be noted, however, that minor trace compounds consisting of
approximately < 0.5 % Qfthe extract (as determined by signal response to the detector qf
the GC/MS) were disregarded to simplify the qualitative analysis. Some sample extracts,
such as black peppercorns, fresh rosemary, and lime zest extracts, were very complex and
contained a large number of compounds. Chromatograms for caraway seeds and black
peppercorns are compared in Figure 3 to demonstrate this.
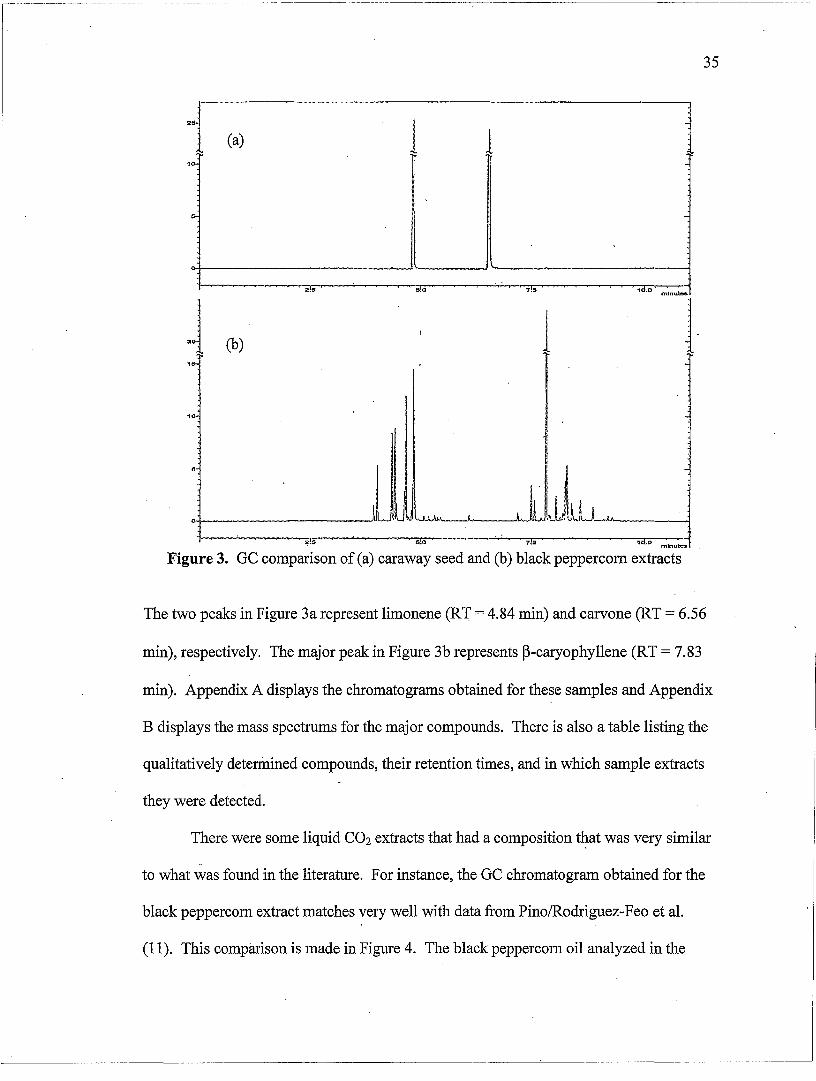
35
(a) 1 1
2!5 5!0 T!S 1d.D· minutes.
~ J
(b) 1 1
I.
~.$ 5.0 'Id.o mInutes
Figure 3. GC comparison of ( a) caraway seed and (b) black peppercorn extracts
The two peaks in Figure 3a represent limonene (RT = 4.84 min) and carvone (RT = 6.56
min), respectively. The major peak in Figure 3b represents B-caryophyllene (RT = 7.83
min). Appendix A displays the chromatograms obtained for these samples and Appendix
B displays the mass spectrums for the major compounds. There is also a table listing the
qualitatively determined compounds, their retention times, and in which sample extracts
they were detected.
There were some liquid CO2 extracts that had a composition t~at was very similar
.-
to what was found in the literature. For instance, the GC chromatogram obtained for the
black peppercorn extract matches very well with data from Pino/Rodriguez-Feo et al.
(11). This comparison is made in Figure 4. The black peppercorn oil analyzed in the
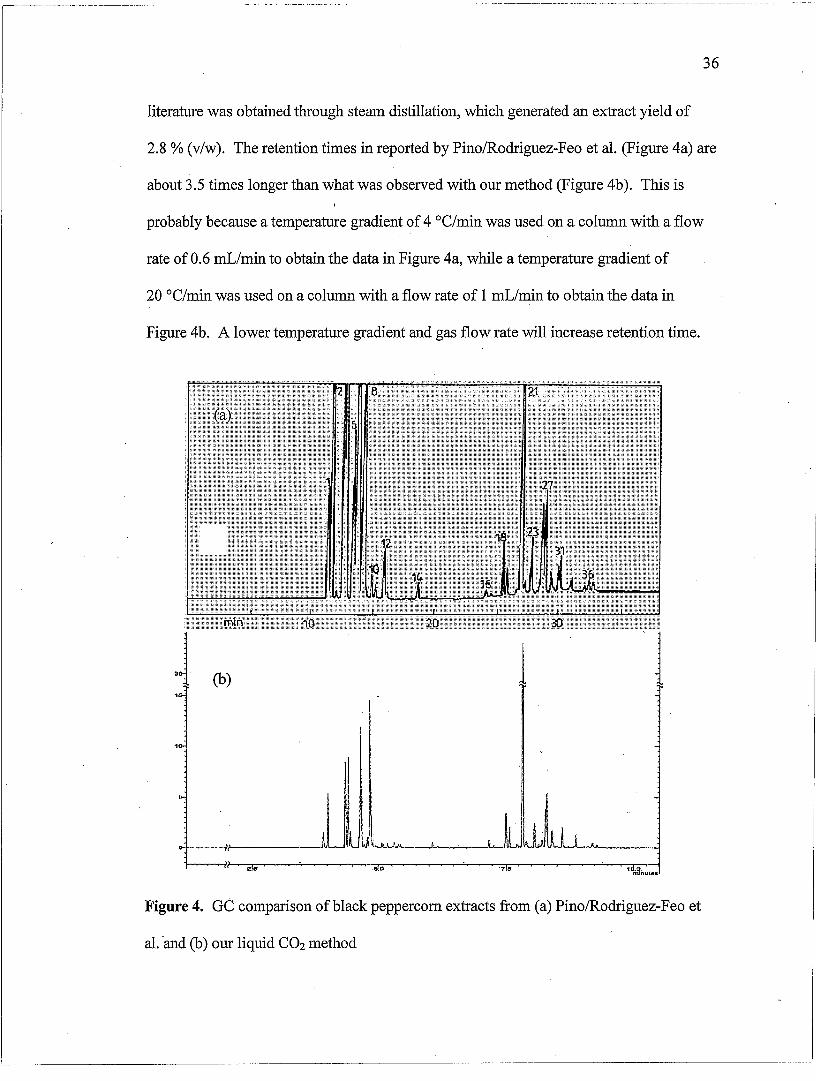
36
literature was obtained through steam distillation, which generated an extract yield of
2.8 % (v/w). The retention times in reported by Pino/Rodriguez-Feo et al. (Figure 4a) are
about 3.5 times longer than what was observed with our method (Figure 4b). This is
probably because a temperature gradient of 4 DC/min was used on a column with a flow
rate of 0.6 mLimin to obtain the data in Figure 4a, while a temperature gradient of
20 DC/min was used on a column with a flow rate of 1 mLimin to obtain the data in
Figure 4b. A lower temperature gradient and gas flow rate will increase retention time.
(b)
",S B,a '7.e
1 1
1.0, mtnut.a
Figure 4. GC comparison of black peppercorn extracts from (a) Pino/Rodriguez-Feo et
al. -and (b) our liquid CO2 method
-~---~--~---~------ ---~~--------
37
Poor Substrates for Our Study
The following food samples produced isolates that were unable to be analyzed by
GC/MS: sesame seeds; safflower seeds; dried chili peppers; fresh garlic; coffee beans;
and cinnamon sticks (cassia bark). It is assumed that the isolate primarily contained non
volatile oils, which never eluted from the GC column.
The sesame and safflower seeds contain fatty acids and their esters, such as
linoleic acid and various triglycerides. These compounds were probably part of the
extracted residue, but they are non-volatile and probably have molecular weights above
the mass spectrum range. Capsaicin may have been extracted from the chili peppers, but
it degrades before its vaporization point. Sulfur containing compounds, such as allicin
and diallyl sulfide, are present in garlic. Allicin also easily degrades before it boils.
Diallyl sulfide has a boiling point of 138 cC, but apparently was not isolated. It was
expected that caffeine and theobromine could be extracted from coffee beans, but tannins·
were probably the resulting isolates. The molecular weights ofthese minor peaks extend
near the 550 mlz upper limit. There was a large amount of noise present in the coffee
extract chromatogram. Cinnamon bark contains many volatile organic compounds, such
as cinnamaldehyde, cinnamyl alcohol, and cinnamate esters. Instead, various tannins
inside of the bark may have been the resulting extract. The volatile compounds were
probably not observed because of the bark matrix and may have been inhibited by
glycoproteins. The bark may have to be more finely ground to extract these volatile
compounds.
38
Samples Producing No Extracted Isolates
The following samples did not generate any isolate when subjected to liquid
carbon dioxide extraction: dried tobacco leaves; dried black tea leaves; crushed mint
leaves; dry dill weed; dry thyme; dried garlic; instant coffee; and chocolate (both milk
and dark). It is assumed that either there were simply very little terpenes and terpenoids
present in the samples, or that the sample matrix interfered with the extraction. The herbs
may have lost these volatile compounds during their drying and storage process. The
tobacco, tea leaves, coffee beans, and chocolate were chosen because ofthe alkaloids
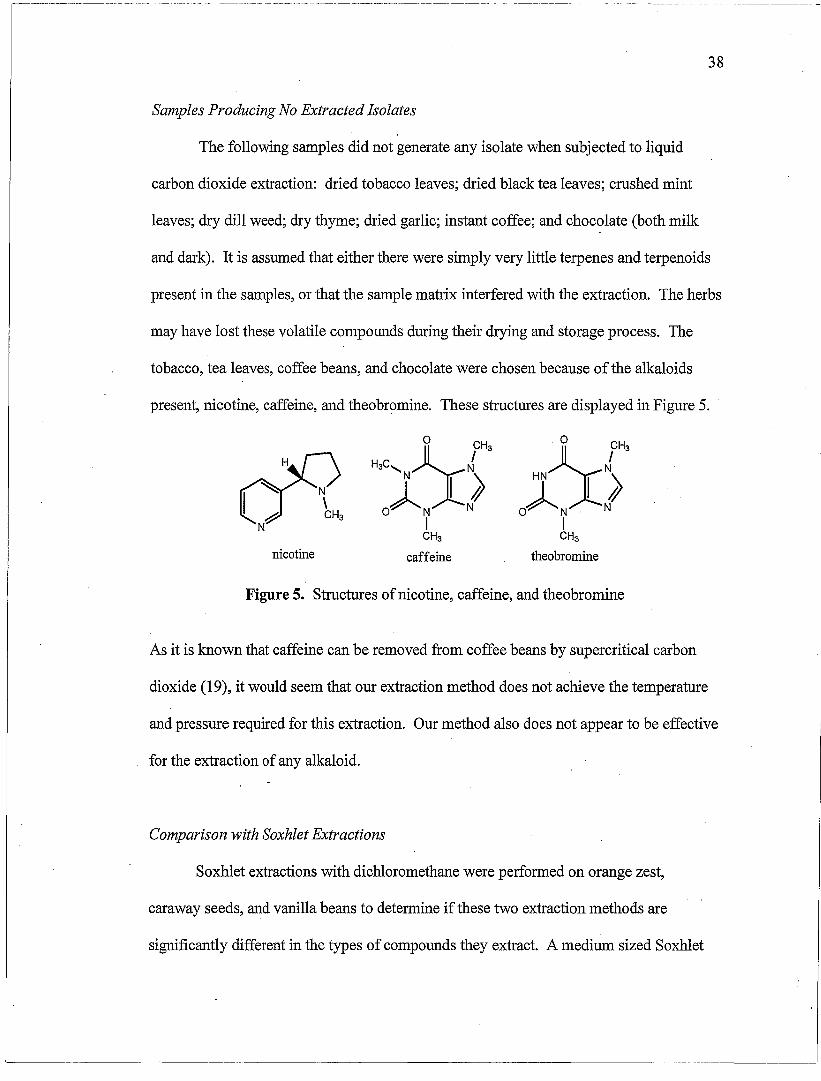
present, nicotine, caffeine, and theobromine. These structures are displayed in Figure 5.
nicotine
Figure 5. Structures of nicotine, caffeine, and theobromine
As it is known that caffeine can be removed from coffee beans by supercritical carbon
dioxide (19), it would seem that our extraction method does not achieve the temperature
and pressure required for this extraction. Our method also does not appear to be effective
for the extraction of any alkaloid.
Comparison with Soxhlet Extractions
Soxhlet extractions with dichloromethane were performed on orange zest,
caraway seeds, and vanilla beans to determine if these two extraction methods are
significantly different in the types of compounds they extract. A medium sized Soxhlet
39
extraction was performed with a 45/50 Soxhlet extractor. The samples were prepared as
described for a liquid CO2 extraction. The prepared samples were wrapped inside of a
kimwipe and tied into a pouch with cotton thread. All extractions were performed with
150 mL of dichloromethane and were allowed to run for 18-24 hours. After extraction,
the solution was gravity filtered and the majority of the dichloromethane was removed
with a rotary evaporator in a 40°C water bath. The major compounds in the extracts of
both extraction methods are: limonene and carvone in caraway seeds; limonene in orange
zest; and vanillin in vanilla beans. These compounds consisted of at least 98 % of the
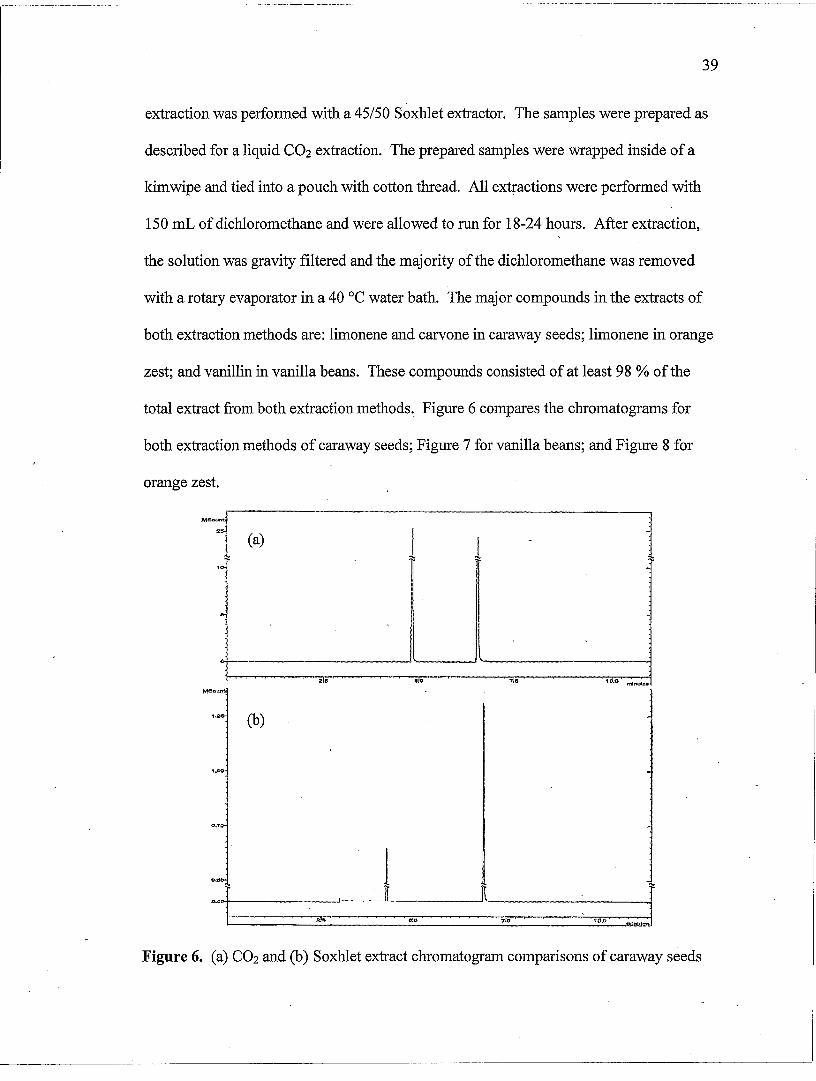
total extract from both extraction methods~ Figure 6 compares the chromatograms for
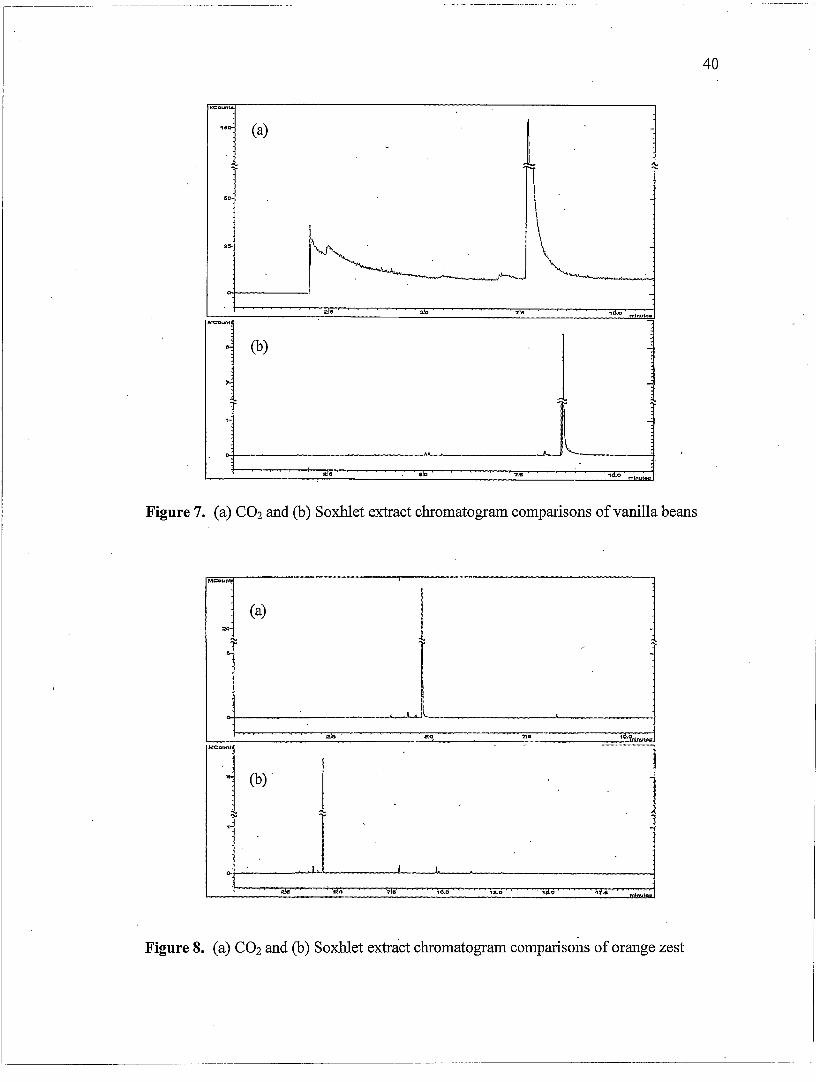
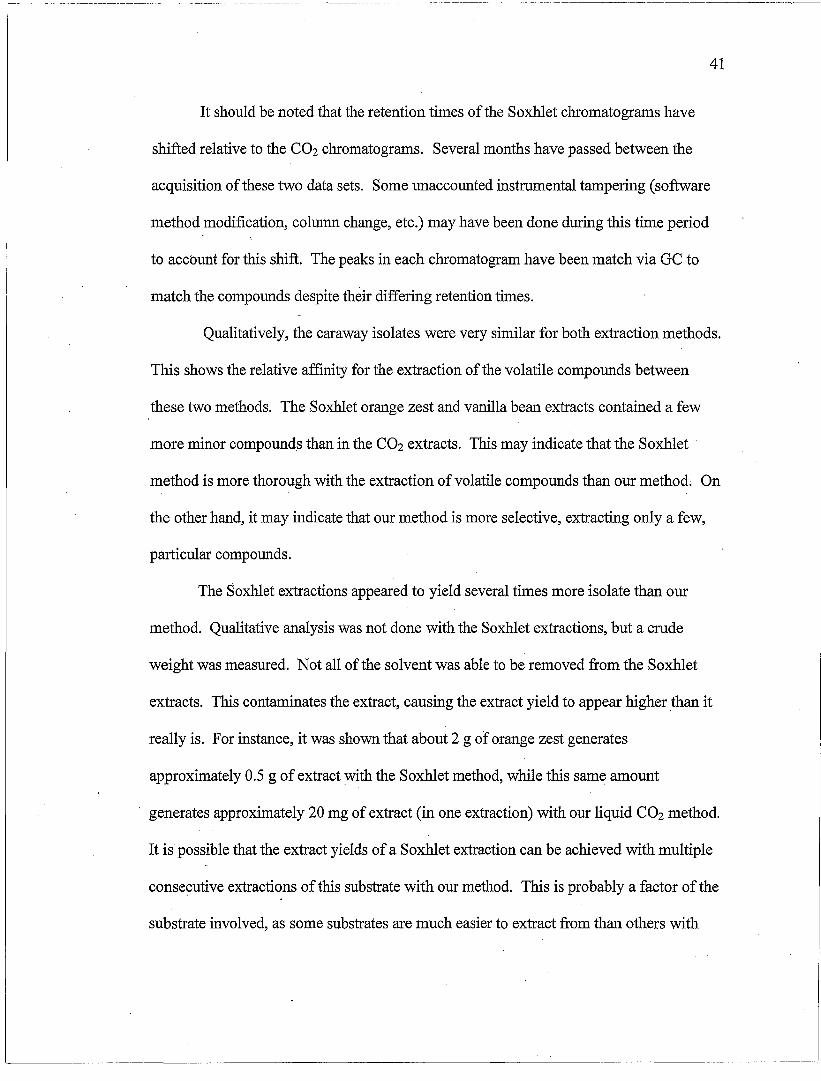
both extraction methods of caraway seeds; Figure 7 for vanilla beans; and Figure 8 for
orange zest.
.°1 Cal 1 ir
i t
:-,-.-~'-----''---------.--10-
10.0 mlnulCI.
1. (b)
1.00
1 0'""' ..:. l-----JR __ ~J
l·~~-~...--r-;ii!;r.-$~: ~. ~-,. oJ. :710""'"' ~~;;;;;\;;;d
....
Figure 6. (a) CO2 and (b) Soxhlet extract chromatogram comparisons of caraway seeds
1(00c:u.lnt
,.0- (a) 1 -
. .,.
2,," ~. . J ~-----r-- ~
I 2.' ... 7.l!li 10.0
l 1
(b)
1 ~ T L I
h U ..... 6 d -
:tle ala - ?!s .,a.o
Figure 7. (a) CO2 and (b) Soxhlet extract chromatogram comparisons of vanilla beans
I=M"'.U::=-~_-(-a) ---·----,--1---------1
I>-<>+-----.-~-.---"----, . __
Figure 8. (a) CO2 and (b) Soxhlet extract chromatogram comparisons of orange zest
40
----.-.----~~------~~-.--------~--.-------------------~----.-----
41
It should be noted that the retention times of the Soxhlet chromatograms have
shifted relative to the CO2 chromatograms. Several months have passed between the
acquisition of these two data sets. Some unaccounted instrumental tampering (software
method modification, column change, etc.) may have been done during this time period
to accbunt for this shift. The peaks in each chromatogram have been match via GC to
match the compounds despite their differing retention times.
Qualitatively, the caraway isolates were very similar for both extraction methods.
This shows the relative affinity for the extraction of the volatile compounds between
these two methods. The Soxhlet orange zest and vanilla bean extracts contained a few
more minor compounds than in the CO2 extracts. This may indicate that the Soxhlet
method is more thorough with the extraction of volatile compounds than our method; On
the other hand, it may indicate that our method is more selective, extracting only a few,
particular compounds.
The 80xhlet extractions appeared to yield several times more isolate than our
method. Qualitative analysis was not done with the Soxhlet extractions, but a crude
weight was measured. Not all of the solvent was able to be removed from the Soxhlet
extracts. This contaminates the extract, causing the extract yield to appear higher .than it
really is. For instance, it was shown that about 2 g of orange zest generates
approximately 0.5 g of extract :with the Soxhlet method, while this same amount
generates approximately 20 mg of extract (in one extraction) with our liquid CO2 method.
It is possible that the extract yields of a Soxhlet extraction can be achieved with multiple
consecutive extractions of this substrate with our method. This is probably a factor of the
substrate involved, as some substrates are much easier to extract from than others with
our method. It appears that our method may be more selective, but Soxhlet extraction
may be more complete.
42
It should also be noted that one extraction with our method takes approximately
20 minutes, while the Soxhlet extraction requires about 18-24 hours. Our method is able
to cut the extraction time significantly without the interference of potentially harmful
solvents.
Future Qualitative Work
In the future, LC/MS instrumentation would like to be used as a means to
determine the composition of the non-volatile extracts. Also, this instrument would be
useful in detecting any non-volatily compounds present in the extracts that contained
many volatile compounds. It is possible that terpene rearrangements may occur due to
the high temperature ofthe gas phase of the GC during analysis. Using the LC could
help to eliminate this problem. This may not be a major issue, as the compounds were
identified through mass spectrometry. It appears that any rearrangements that may have
occurred would have most likely been internal rearrangements, which would do little to
affect analysis.
Freeze-drying may be another option of sample preparation for fresh herbs. This
would be another effective way to remove residual moisture from the samples without
losing volatile compounds. This may prove to be better method of drying samples prior
to grinding and extraction. Some fresh herbs, such as oregano, rosemary, sage, and
spearmint, should be freeze-dried prior to analysis to test the viability of this sample
preparation method.
References
1. Villani, Philip; Associate Professor at Butler University, personal communication.
2. Raman, G.; Gaikar, V. G. "Extraction of Piperine from Piper nigrum (Black Pepper)
by Hydrotropic Solubilization." Ind. Eng. Chern. Res, 2002,41, 2966-2976.
43
3. McKenzie, 1.; Thompson, J.; Sullivan, R.; Hutchison, J. "Green chemical processing
in the teaching laboratory: a convenient liquid CO2 extraction of natural products."
Green Chem. 2004, 6, 355-358.
4. Viuda-Martos, M.; Ruiz-Navajas, Y.; Fernandez-L6pez, J.; Perez-Alvarez, J. A.
"Chemical Composition ofthe Essential Oils Obtained From Some Spices Widely
Used in Mediterranean Region." Acta Chem. Scand. 2007,54, 921-926.
5. Baratta, M. T.; Dorman, H. l D.; Deans, S. G. "Chemical Composition, Antimicrobial
and Antioxidative activity of Laurel, Sage, Rosemary, Oregano and Coriander
Essential Oils." J. Essent. Oil Res. 1998,10,618-627.
6. Schulz, H.; Quilizsch, R.; KrUger, H. "Rapid evaluation and quantitative analysis of
thyme, origano and chamomile essential oils by ATR-IR and NIR spectroscopy." J.
Mol. Struct. 2003,661-662, 299-306.
7. Jirovetz, 1.; Buchbauer, G.; Shahabi, M. "Comparative Investigations of the Essential
Oil and volatiles of Spearmint." Perfum. Flavor. 2002,27, 16-22.
8. Ciola, R.; Kurmeier, K. H. D. "Quantitative Analysis of Mint Oil." Int. Cong. Essent.
Oils, 1979, 7, 319-323.
9. Machmudah, S.; Sulaswatty, A.; Sasaki, M.; Goto, M.; Hirose, T. "Supercritical C02
extraction of nutmeg oil: Experiments and modeling." J. Supercrit. Fluids. 2006,39,
30-39.
44
10. Mallavarapu, G. R.; Ramesh, S. "Composition of essential oils of nutmeg and mace."
J Med Arm. Plant Sci. 1998,20,746-748.
11. Pino, J.; Rodriguez-Feo, G.; Borges, P.; Rosado, A "Chemical and sensory
properties of black pepper oil." Die Nahrung. 1990,34, 555-560.
12. Muller, C. J.; Jennings, W. G. "Constituents of Black Pepper. Some Sesquiterpene
Hydrocarbons." J Agr. Food Chem. 1967,15, 762-766.
13. Russell, G. F.; Jennings, W. G. "Constituents of Black Pepper. Some Oxygenated
Compounds." J Agr. Food Chem. 1969,17, 1107-1112.
14. Jennings, W. G.; Wrolstad, R. E. "Volatile Constituents of Black Pepper." J Food
Sci. 1961, 26, 499-509.
15. Vernin, G.; Vernin, E.; Metzger, J.; Pojo1, L.; Parkanyi, C. "GeIMS analysis of clove
essential oils." Devel. Food Sci. 1994,34, 483-500.
16. Toxopeus, H.; Bouwmeester, H. J. "Improvement of caraway essential oil and
carvone production in The Netherlands." Indst. Crops and Prod 1993,1, 295-301.
17. Perez-Silva, A.; Odoux, E.; Brat, P.; Ribeyre, F.; Rodriguez-Jimenes, G.; Robles
Olvera, V.; Garcia-Alvarado, M. A; GUnata, Z. "GC-MS and GC-olfactometry
analysis of aroma compounds in a representative organic aroma extract from cured
vanilla (Vanilla planifolia G. Jackson) beans." Food Chem. 2006,99, 728-735.
18. Smith, D. C.; forland, S.; Bachanos, E.; Matejka, M.; Barrett, V. "Qualitative
Analysis of Citrus Fruit Extracts by GC/MS: An Undergraduate Experiment." Chem.
Educator. 2001, 6, 28-31.
19. Seidel, A Ed., Kirk-Othmer Encyclopedia of Chemical Technology, 5th ed.; John
Wiley & Sons, Inc.: Hoboken, New Jersey, 2007; vol. 7, pp 263.

45
Chapter III: Quantitative Analysis
Experimental
Liquid carbon dioxide extractions that were performed for quantitative purposes
were performed identically to the qualitative extractions. The extracts were dissolved in
acetonitrile rather than dichloromethane. For multiple extractions on a single sample, the
sample and filter trap were transferred to a new extraction tube for each consecutive
extraction.
An Agilent GC-FID was used for quantitative analysis rather than the GC/MS.
This was done because the GC-FID provided better software capabilities for integration
than the GCIMS. The GC-FID software used is Agilent's GC ChemStation (Rev.
A.09.01). An LC/MS/MS would have ultimately been the optimum choice, buttime
constraints and instrument availability proved this option unfeasible at this time. Using
an LC/MSIMS would allow quantitation through the daughter ions as well as the parent
ions, potentially allowing for better specificity. LCIMS/MS quantitation is desired for
future work.
Instrumental Specifications
The Agilent 6890N GC was equipped with a flame ionization detector and an
HP-5 capillary column (30 m x 0.32 mm x 0.25 Ilm film thickness) with a stationary
phase consisting of 5 % phenyl methyl siloxane (Agilent Technologies, Inc.). The oven
temperature was programmed with an initial temperature of 60°C held for 3 min,
followed by an increase of20 °C/min to 250 oe, and then held for the remainder of the
- ----- ----- - ----------- ---
46
analysis. The injector temperature was held constant at 250°C. Helium was used as a
carrier gas at a constant column flow rate of 1.7 mLimin at a pressure of 8.67 psi.
Calibration Solutions
Calibration solutions were made for the analytes limonene, carvone, and vanillin
with menthol as the internal standard. Seven solutions were made with the analyte
concentrations 10, 20, 50, 100, 200, 500, and 1000 ppm. These solutions each contained
54.7 ppm menthol as an internal standard. Acetonitrile was used as the solution solvent.
The concentrations were measured, but the calculated concentrations are used in the data.
The retention times for each analyte are compared for the GCIMS and GC-FID in Table
1. The calibration curves for these analytes are displayed in Figure 1, with the y-axis'
being a peak area response factor with respect to the menthol internal standard. The
regression data is shown in Table 2. Internal standardization was used as the method of
calibration (1).
Table 1. Retention time of each analyte (in minutes)
Anal~te Ge/MS GC-FID Limonene 4.83 6.78 Menthol 6.04 8.38 Carvone 6.55 9.05 Vanillin 7.70 10.36
----------------------------
30
25 ... ~
y = 0.0313x + 0.13 R2 = 0.9994
y = 0.0277x + 0.0845 R2 = 0.9978
~ 20 Q) til s:: 0 c. 15 ~ ns e! 10 « ~ ns Q) a..
5
0 0 200 400
y = 0.0181x - 0.1433 R2 = 0.9956
600
Concentration (ppm)
800 1000 1200
• Lifl10nene _ Carvone • Vanillin -Linear (Limonene) -Linear (Carvone) -Linear (Vanillin)
Figure 1. Calibration curves for limonene, carvone, and vanillin
Table 2. Regression data and figures of merit
Regression Correlation Instrumental Calibrated
Retention Coefficient Precision Range
Equation (R2) (%RSD) (ppm) Time (min)
Limonene y = 0.0313x + 0.1300 0.9994 6.642 % 7.79- 817.9 6.779 ± 0.001
Carvone y = 0.0277x + 0.0845 0.9978 6.757 % 8.86- 930.2 9.050 ± 0.002
Vanillin y = 0.0181x + 0.1433 0.9956 5.524 % 9.35 - 981.9 10.357 ± 0.002
The instrumental precision was obtained by injecting the 100 ppm calibration solution
five times. The values shown are the percent relative standard deviation of the
instrumental response of each analyte in the solution.
ExtractiQn Data
Extractions were carried out in triplicate for caraway seeds and orange zest, and
47
vanilla beans. The data show that 1.65 ± 1.02 mg limonene and 3.79 ± 2.26 mg carvone
48
are extracted from caraway seeds from one extraction with our method (5.44 ± 3.28 mg
total). The data also show that 21.98 ± 4.34 mg limonene is extracted from 2.0 g orange \
zest from one extraction with our method. This is nearly a 1.1 % (w/w) extraction yield.
Approximately 240 mg of total extract was isolated from 2.6 g orange zest during a
Soxhlet extraction. This is a 9.2 % extraction yield. There probably is some residual
dichloromethane and water left in the extract after the rotary evaporatory process; so the
actual yield is probably less. Results are inconclusive at this time for the quantit",tion of
the extraction of vanillin from vanilla beans.
Five consecutive extractions were carried out in triplicate for 2.00 g caraway
seeds. Table 3 displays the numerical data, while Figure 2 displays this data graphically.
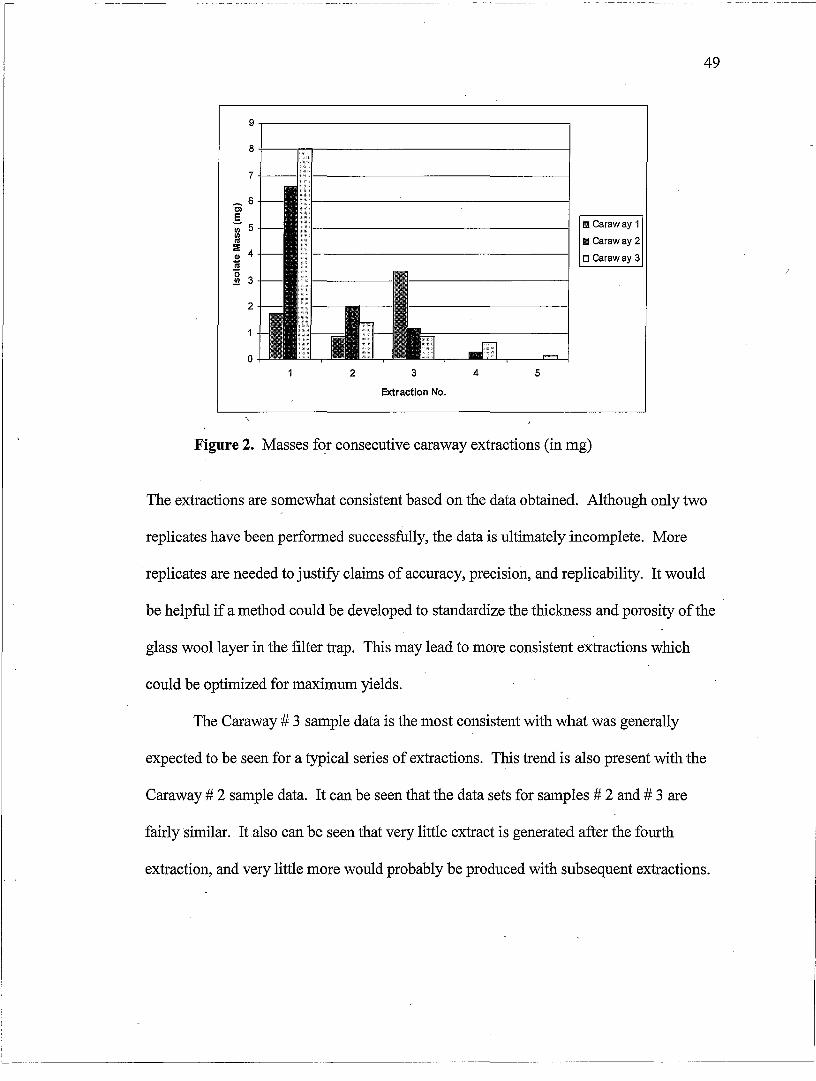
Table 3. Masses for consecutive caraway seed extractions (in mg)
Extraction No. Limonene' Carvone Total 1 st 1.65 ± 1.02 3.79 ± 2.26 5.44 ± 3.28
2nd 0.30 ± 0.13 1.13± 0.44 1.43 ± 0.58
3rd 0.33 ± 0.28 1.48 ± 1.04 1.80 ± 1.32
4th* 0.06 ± 0.03 0.39 ± 0.24 0.44 ± 0.26
5th** 0.09 0.06 0.14
*Extraction performed in duplicate **Only single extraction performed
9,----------------------------------.
8,----~r_--------------------------~
7 -1---1
2
o 2 3 4 5
Extraction No.
Ii! Caraway 1
III Caraway 2
o Caraway 3
Figure 2. Masses for consecutive caraway extractions (in mg)
49
The extractions are somewhat consistent based on the data obtained. Although only two
replicates have been performed successfully, the data is ultimately incomplete. More
. replicates are needed to justify claims of accuracy, precision, and replicability. It would
be helpful if a method could be developed to standardize the thickness and porosity ofthe
glass wool layer in the filter trap. This may lead to more consistent extractions which
could be optimized for maximum yields.
The Caraway # 3 sample data is the most consistent with what was generally
expected to be seen for a typical series of extractions. This trend is also present with the
Caraway # 2 sample data. It can be seen that the data sets for samples # 2 and # 3 are
fairly similar. It also can be seen that very little extract is generated after the fourth
extraction, and very little more would probably be produced with subsequent extractions.
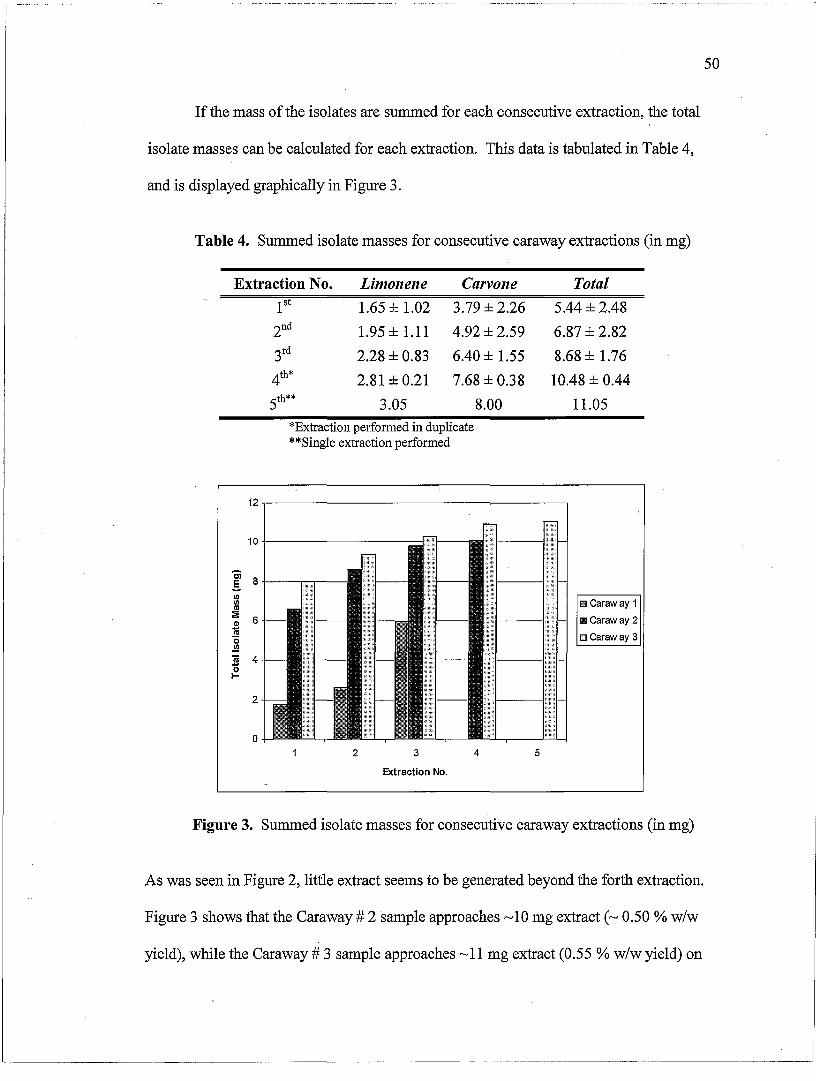
If the mass of the isolates are summed for each consecutive extraction, the total
isolate masses can be calculated for each extraction. This data is tabulated in Table 4,
and is displayed graphically in Figure 3.
Table 4. Summed isolate masses for consecutive caraway extractions (in mg)
Extraction No. Limonene Carvone Total 1 st 1.65 ± 1.02 3.79 ± 2.26 5.44 ± 2.48
2nd 1.95 ± 1.11 4.92 ± 2.59 6.87 ± 2.82
3rd 2.28 ± 0.83 6.40 ± 1.55 8.68 ± 1.76
4th* 2.81 ± 0.21 7.68 ± 0.38 10.48 ± 0.44
5th** 3.05 8.00 11.05
*Extraction performed in duplicate **Single extraction performed
12~----------------------~------~
10r---------------~1'"
E 8r--=--
~ ::iE 6 ~ '0 .!!l iii 4 ~
2
o 2 3
Extraction No.
4 5
El Caraway 1
l\III Caraway 2
o Caraway 3
Figure 3. Summed isolate masses for consecutive caraway extractions (in mg)
As was seen in Figure 2, little extract seems to be generated beyond the forth extraction.
Figure 3 shows that the Caraway # 2 sample approaches ~ 10 mg extract (~ 0.50 % w/w
yield), while the Caraway # 3 sample approaches ~ 11 mg extract (0.55 % w/w yield) on
50
51
the fourth consecutive extraction. Approximately 190 mg of total extract was isolated
from 2.00 g caraway seeds during a Soxhlet extraction. This is a 9.5 % extraction yield.
As with the orange zest, there probably is some residual dichloromethane and water left
in the extract after the rotary evaporatory process; so the actual yield is probably less.
Quantitation Issues
Several issues 8.!ose which made quantitation difficult. Mainly, the isolates tend .
to adhere to the glass wool, not fully collecting at the bottom of the tube. This appears to
be less of an issue when a smaller amount of glass wool is used. The amount of glass
wool that is used (both the thickness and the volume) for each sample is different. This
affects the amount of extract collected for analysis. If a different and more uniform type
of filter material can be used successfully, perhaps this issue can be avoided.
The tightness of the cap on the tube may also affect quantitation. The tighter the
cap is, the longer the CO2 remains in the liquid state and is available as in extraction
solvent. If the cap can be standardized to a particular "tightness" (and thus a particular
extraction time), the extraction procedure can be made more consistent. Also, tube
explosions impede safety and convenience, especially during consistent extractions.
Future Quantitative Work
The extraction efficiency of the method needs to be evaluated. If a known
amount of a terpene or terpenoid can be spiked into a sample substrate prior to extraction,
then the recovered amount of the original spike can be determined. This can be studied
for a variety of samples, as well as for consecutive extractions. This can be used as a
52
means to determine how many extractions are necessary to recover 95 % of the original
spike. The only issue with this method of analysis is the loss of the sample matrix effect.
Spiking the sample causes the analyte to lie on the surface of the substrate, rather than
within the substrate cells. In a typical extraction, the compounds are isolated by
extracting the compounds from within the substrate cells. No standard reference
materials have been found for terpenes or terpenoids in herbs or spices.
More extractions will also be necessary to validate the data. Consecutive
extractions in triplicate for orange zest and vanilla beans will also be necessary. This
study can also be expanded to include a larger variety of sample substrates.
Conclusions
The data seems to show that the extractions are not very consistent and generally
do not generate much extract yield. It must be noted, however, that the data generated in
Table 3 and Table 4 (and the resulting data in Figure 2 and Figure 3) is still preliminary.
More extractions are needed to justify claims of accuracy, precision, and reproducibility.
The evaluation of the extraction efficiency of our method will greatly help with making
these justifications.
Overall Conclusions
As was shown in Chapter II, this method is very selective towards terpenes and
terpenoids from a variety of different food items. In some cases, such as orange zest,
caraway seeds, and vanilla beans, only a few compounds were extracted. In most cases,
however, only terpenes and terpenoids were observed as extraction products.
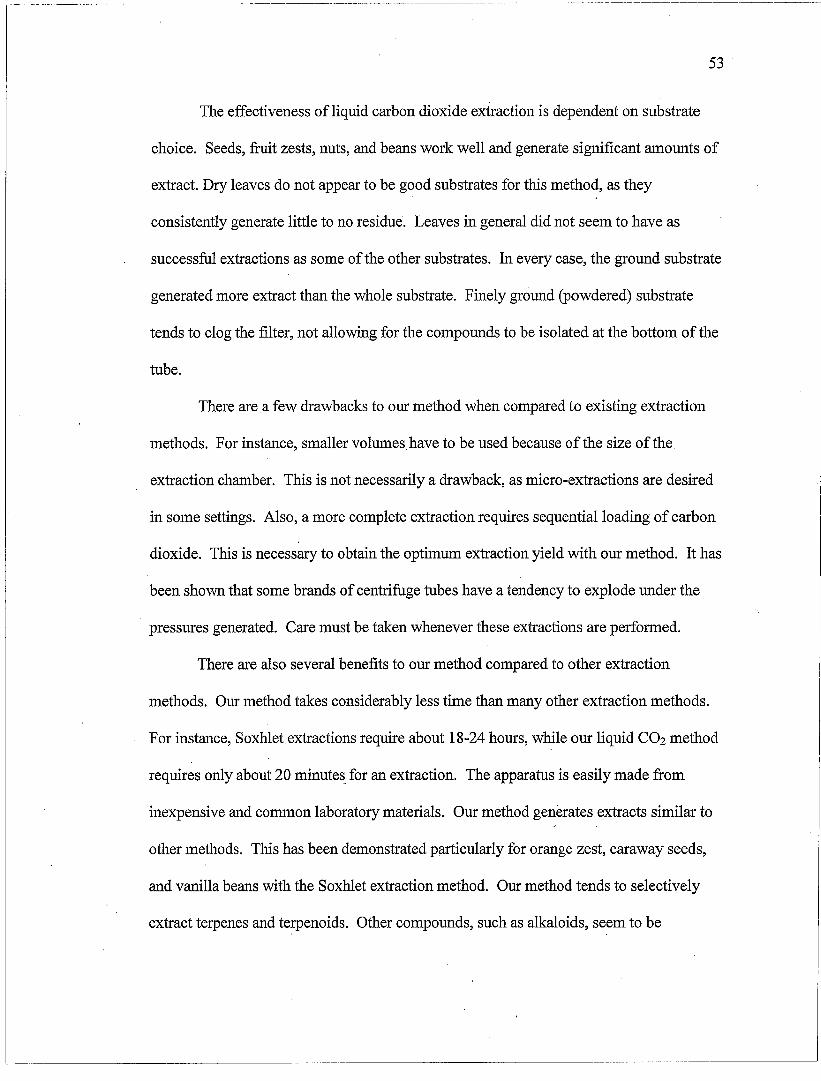
- - - - --------- ------------------------------------------------------------------------------------
53
The effectiveness of liquid carbon dioxide extraction is dependent on substrate
choice. Seeds, fruit zests, nuts, and beans work well and generate significant amounts of
extract. Dry leaves do not appear to be good substrates for this method, as they
consistently generate little to no residue. Leaves in general did not seem to have as
successful extractions as some of the other substrates. In every case, the ground substrate
generated more extract than the whole substrate. Finely ground (powdered) substrate
tends to clog the filter, not allowing for the compounds to be isolated at the bottom of the
tube.
There area few drawbacks to our method when compared to existing extraction
methods. For instance, smaller volumes have to be used because ofthe size of the
extraction chamber. This is not necessarily a drawback, as micro-extractions are desired
in some settings. Also, a more complete extraction requires sequential loading of carbon
dioxide. This is necessary to obtain the optimum extraction yield with our method. It has
been shown that some brands of centrifuge tubes have a tendency to explode under the
pressures generated. Care must be taken whenever these extractions are performed.
There are also several benefits to our method compared to other extraction
methods. Our method takes considerably less time than many other extraction methods.
For instance, Soxhlet.extractions require about 18-24 hours, while our liquid C02 method
requires only about 20 minutes_ for an extraction. The apparatus is easily made from
inexpensive and common laboratory materials. Our method generates extracts similar to
other methods. This has been demonstrated particularly for orange zest, caraway seeds,
and vanilla beans with the Soxhlet extraction method. Our method tends to selectively
extract terpenes and terpenoids. Other compounds, such as alkaloids, seem to be
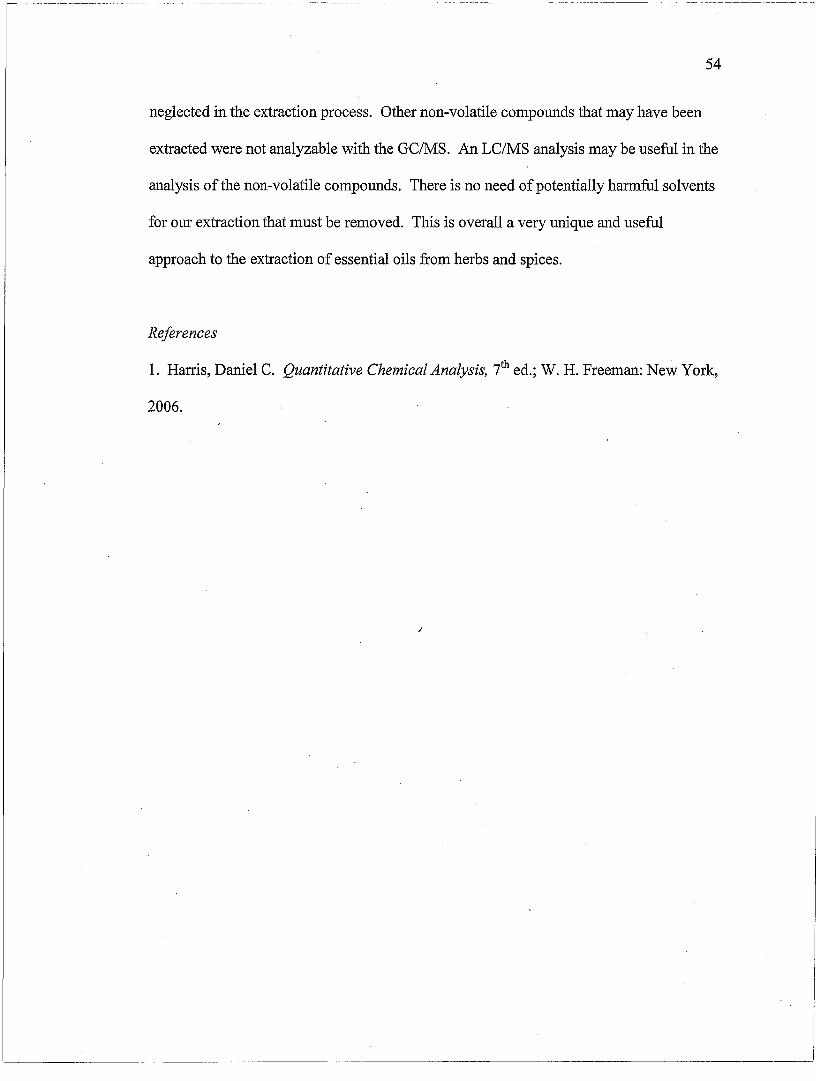
54
neglected in the extraction process. Other non-volatile compounds that may have been
extracted were not analyzable with the GC/MS. An LC/MS analysis may be useful in the
analysis ofthe non-volatile compounds. There is no need of potentially harmful solvents
for our extraction that must be removed. This is overall a very unique and useful
approach to the extraction of essential oils from herbs and spices.
References
1. Harris, Daniel C. Quantitative Chemical Analysis, i h ed.; W. H. Freeman: New York,
2006.
/
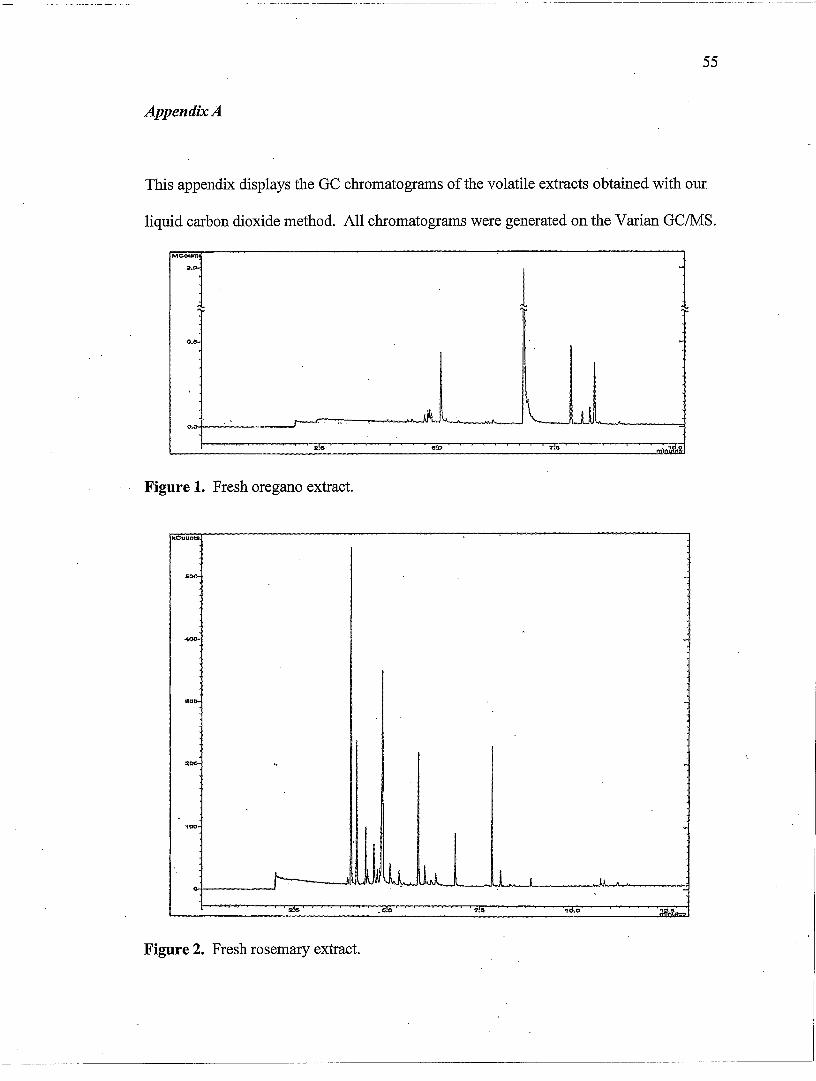
55
Appendix A
This appendix displays the GC chromatograms of the volatile extracts obtained with our.
liquid carbon dioxide method. All chromatograms were generated on the Varian GC/MS.
MOO"'"t
~ . .,.
1 .
0 ....
--....,., . .. . J d o.
-:2." ".0 7U mlll...r.R
Figure 1. Fresh oregano extract.
""',,""""
soo- -
400
"01). -
200- " .
'00 ~
I---J ~ II lLl , I I
... "
:2." ~6.0 7.G 10." .:tiI~'t
Figure 2. Fresh rosemary extract.
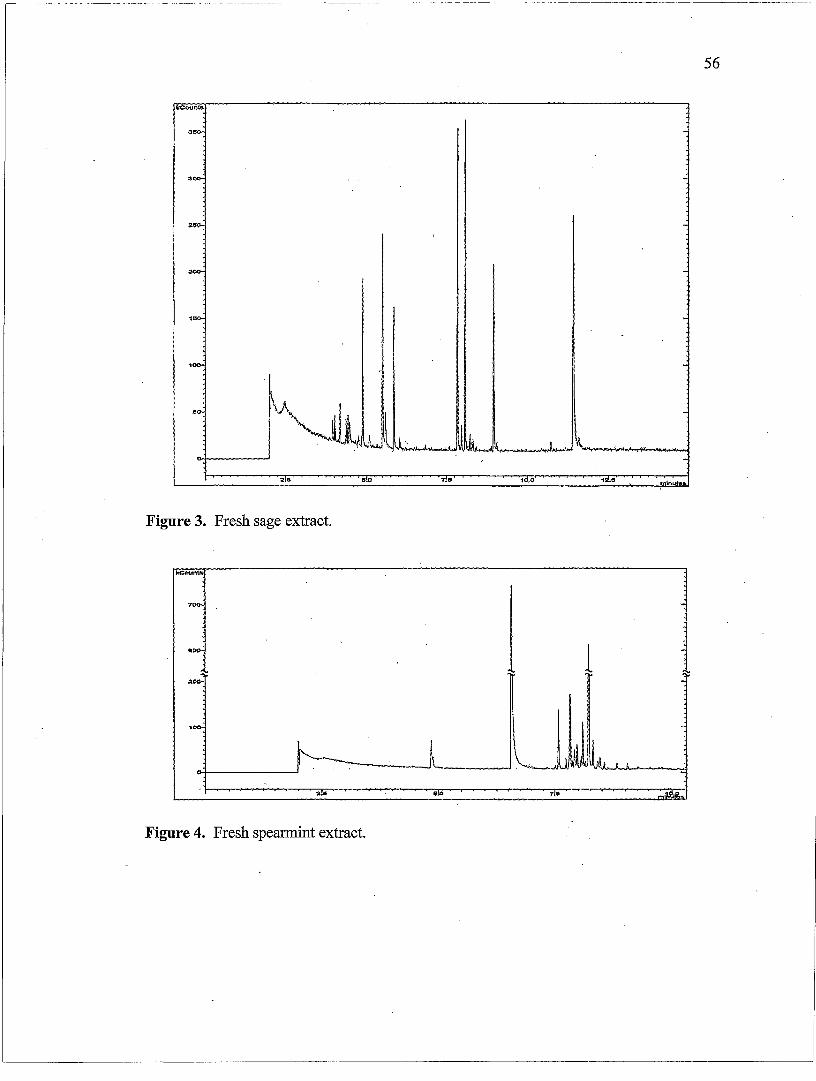
56
kCoun
80 J\
',~ ,L J. \\ "
2.G 8.0 7.S 1 .0 , .8 In" .,
Figure 3. Fresh sage extract.
kC(:IIJl'\tIJI
1 70"':
1
.. 0....: 1 1 2CO-
'00- Jl ~--l ::a.S ............. I S!Q 7!e ----,.........-----
tnil,'l:-'
Figure 4. Fresh spearmint extract.
- - --- -----~---- -- ~-- ----- --- - - -------.~~-
57
MCo~1'l
-
10.0-
~
2 ....
ul~ 0.0-I~~\ A ~
... ;s .. ;- &- m';;;J.;;;'
Figure 5. Nutmeg extract.
1
6.0 10:0 mlnulell
Figure 6. Black peppercorn extract.
58
MOOi.m.!! -
0.1'" 1 ~
0.2&-
___ tL 0.0
2." "'0 "',$ ,a.o' I I
""nul.
Figure 7. Clove extract.
1 1 11'
1
2.5 6.0 1d.o mFnules
Figure 8. Caraway seed extract.
59
kcount
100- 1 •.
::
eo-
2&- ~~ . '-... . """- . ~~ ..... -, ~ ~
, -C>-
ae $.0 7 •• "1d.c . . mInutes
Figure 9. Vanilla bean extract.
MOQ!,m
1 ,.". 1 5- -
. ___ ~L .. .A..
,,'" s!q 7.· 1d.9,. o.
Figure 10. Orange zest extract.
I"'CO~ .
1 .,.,
:to-
,0-~
,uJ I
2." i:$!o """H'""t" ... 7." ~ . Figure 11. Lemon zest extract.
60
Meoun\;
12 ....
1 -
~ "
2.a- li 0
JJ _~ ,~Ll
:a.~ $.0 7$ ""jl?,,~~.
Figure 12. Lime zest extract.
",coun ,,":
1 -:
, ...
°1 1 ..1
~o . "-,.
: :: . ~ : : : : , af. ~ . , . 7!$
, . , '--"'i'€::
Figure 13. Red grapefruit zest extract.
61
AppendixB
This Appendix displays the mass spectra of the major compounds discussed in Table 4 of
chapter II (p. 32). All mass spectra were generated on the Varian GC/MS.
o 2 <> a 0mlz
Figure 1. Mass spectrum of a-pinene.
,2 0 m'"
Figure 2. Mass spectrum of camphene.
0:$ 4.,.3'rSmln.
~OO"""
'75"'-
1 135
50 .... 61
25-; 3~
1.1
~ 1.\:$ 1,1 1,- ~D7 T 171
~ f ,.,.9
<> /l'(I ,flO 1$0 20<>
, '2$'" 31!i°ml~'
Figure 3. Mass spectrum of sabinene.
62
.. "
171
'do
Figure 4. Mass spectrum of ~-pinene.
4 .. 834 min. -81
iOO.,.. -1""
7.5'Kr, -
.5O'Kr, U -
$7 107 12'
~ t ,III -
o ' "r 6r I ! . illl .11 1.1 147 ,$7
60 7'5 100 126 150 !!l'Z
Figure 5. Mass spectrum of limonene.
100~ 03
'2$0 ' mlz
Figure 6. Mass spectrum of 1,8-cineole.
l!i.082mlr'l ..
200
Figure 7. Mass spectrum ofy-terpinene.
63
$6 S.8S0mln.
10~ . 7"""i -
108
e7 "' ,,~ ,. .. "'"
'''''''';
t. .1111 dill J .I 0 111. Ii '''3 1fT
0'0 100 1&50 """ ""0 mI%
Figure 8. Mass spectrum of camphor.
"" O.6eemln ..
100 ..... ~
,." 7 .......
.... 50%- 93 108 -
""%0 t I .' iT. 1.111 t 'r 0
III. .11. III! '.F 'tS .1'1'<5
<10 100 1110 "CO :ztffi,=
Figure 9. Mass spectrum of carvone.
160
Figure 10. Mass spectrum of thymol.
1 ....
" 0
Figure 11. Mass spectrum of eugenol.
64
~'"
137
"ClIo '
Figure 12. Mass spectrum of vanillin.
1 i ) 2~0ml.z
Figure 13. Mass spectrum of ~-caryophyllene.
8.057 min.
Figure 14. Mass spectrum of a-humulene.
1.""
204
2°mt%
Figure 15. Mass spectrum of gennacrene D.
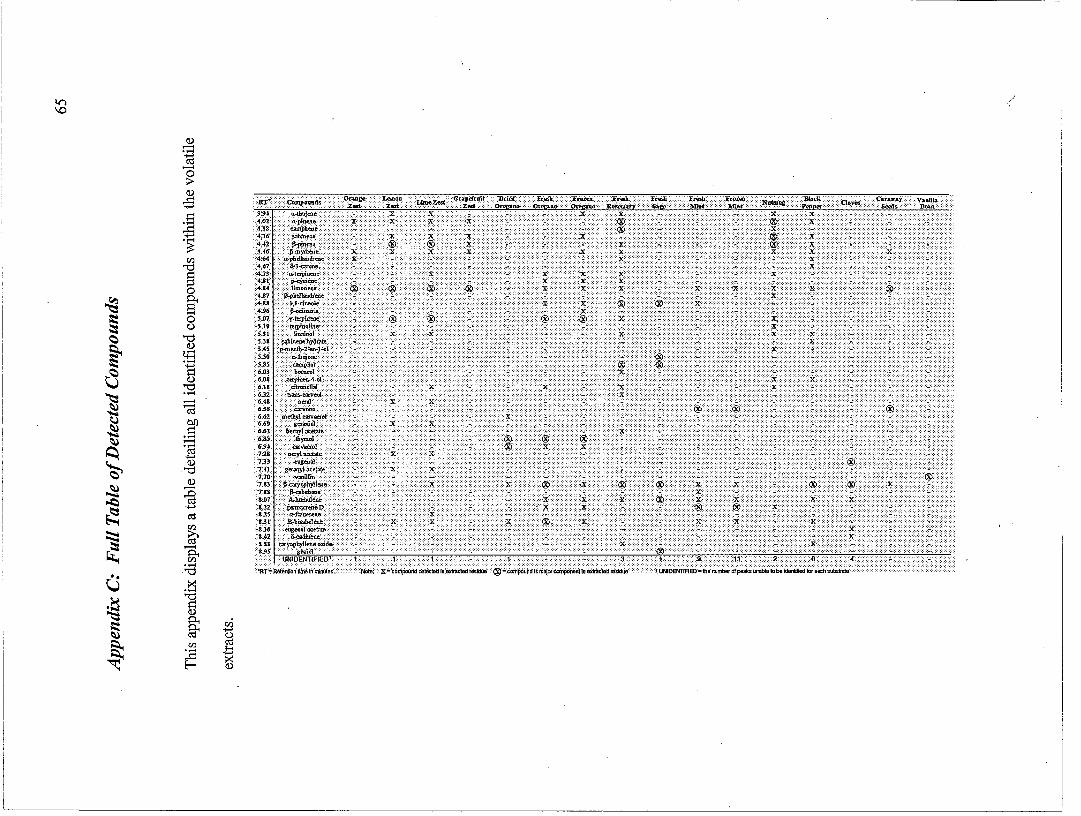
t(") ! \0
Q) ,....... ....... ~ ,....... 0 ;>
.s I=l
:.E1 ;-> ....... ~ <Zl
§ 0
~ S' l::! 0 :::: 0
~ '"d
~ Q)
tq .......
a i:l Q)
'"d "c:::
....... ,.......
~ ~ ~ OJ)
~ I=l ....... ~
,.......
~ ....... C\l
~ ~ '"d
~ Q) ,.......
~ ~ ~
;->
C\l <Zl
~ ~ ~
,....... At <Zl .......
U '"d ~ .......
.~ "8 ~
Q)
l::! At <Zi g. ;->
~ 0
~ <Zl C\l
:.E1 ~ ~ E--