Embed Size (px)
DESCRIPTION
Liquid Architecture. Microarchitecture Optimization for Embedded Systems. D. Schuehler, B. Brodie, R. Chamberlain, R. Cytron, S. Friedman, J. Fritts, P. Jones, P. Krishnamurthy, J. Lockwood, S. Padmanabhan, and H. Zhang Dept. of Computer Science and Engineering - PowerPoint PPT Presentation
Citation preview

Liquid Architecture
D. Schuehler, B. Brodie, R. Chamberlain, R. Cytron,
S. Friedman, J. Fritts, P. Jones, P. Krishnamurthy,
J. Lockwood, S. Padmanabhan, and H. Zhang
Dept. of Computer Science and EngineeringWashington University in St. Louis
Supported by NSF ITR-0313203
Microarchitecture Optimizationfor Embedded Systems

Liquid Architecture
• Configurable architecture that can adapt to needs of particular application
• E.g., within an FPGA– Soft-core processors
• E.g., as an embedded processor– Tensilica supports configuration at fab
time– Stretch support configuration at run time
• Today’s discussion is on performance analysis and configuration choice

Block Diagram
`̀`̀Layered Internet Protocol Wrappers
ControlPacket
Processor
ExternalMemory
AHB
APB
I-Cache D-Cache
UARTUARTLEDLED
AdapterAdapter BootRom
FPGA
StatisticsModule
NetworkInterface
FPXEvent Bus
MemoryController
LEONSPARC-
compatibleprocessor

Microarchitecture Configurability
• Instruction set• Memory subsystem
– Cache size (I and D)– Associativity– Cache line size
• Co-processor(s)• Instruction pipeline• Full HDL source is available

Design Flow
Write and compile embedded SPARC application with GCC
Internet
Reconfigure FPX hardware via Internet and upload system software.
Identify configuration for candidatearchitecture
Execute program on FPX Platform and measure run-time performance
Cycle-accurate profiling
MethodTime / Cycles
.text
main
addQuery
findMatch
computeKey
computeBase
computeStep
fillQuery
Rnd
• Choose methods to profile from the user interface

MethodAddressRange
.text
main
addQuery
findMatch
computeKey
computeBase
computeStep
fillQuery
Rnd
0x400003EFHi
0x4000027CLo

Method
.text
main
addQuery
findMatch
computeKey
computeBase
computeStep
fillQuery
Rnd
0x400003EFHi
0x4000027CLo
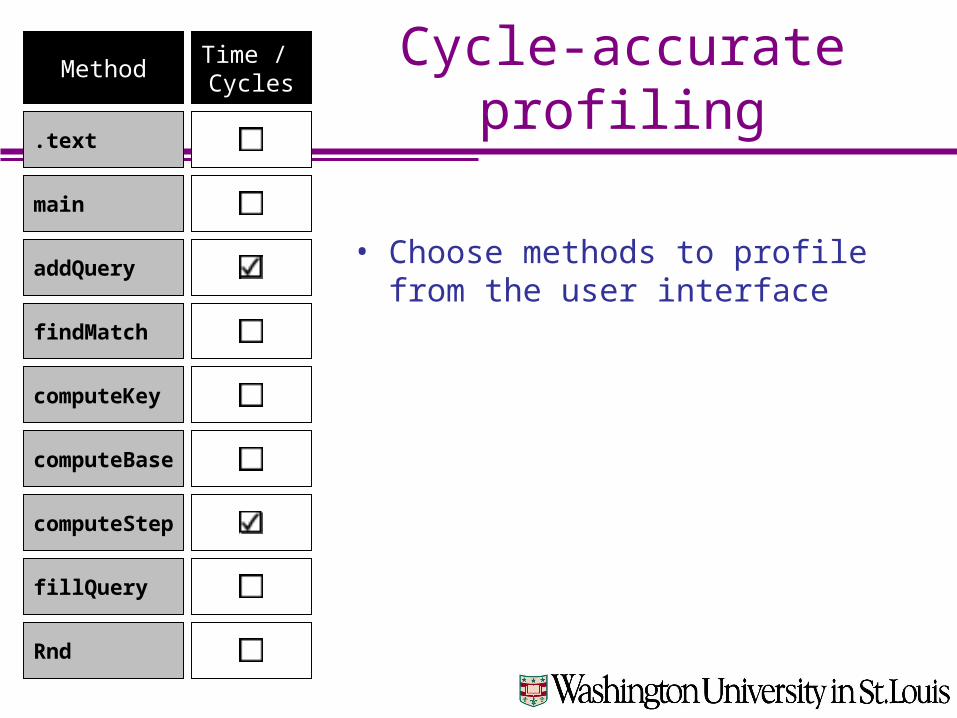
0x4000035A
Statistics Module
PC CLK
Event Bus
Function
.text
main
addQuery
findMatch
computeKey
computeBase
computeStep
fillQuery
Rnd
0x400003EFHi
0x4000027CLo
0x4000035A≤ ≤
Counter
Statistics Module
PC CLK
Event Bus
INCR

Function
.text
main
addQuery
findMatch
computeKey
computeBase
computeStep
fillQuery
Rnd
0x400003EFHi
0x4000027CLo
0x4000035A≤ ≤
Counter
PC CLK
0x4000061FHi
0x400005D8Lo
0x4000035A≤ ≤
Counter
Statistics Module
Event Bus
INCR
INCR

0x400003EFHi
0x4000027CLo
0x4000035A≤ ≤
Counter
PC CLK
0x4000061FHi
0x400005D8Lo
0x4000035A≤ ≤
Counter
Statistics Module
Event Bus
To User
INCR
INCR

Where is time spent?
0%
10%
20%
30%
40%
50%
60%
70%
80%
90%
100%
128K 32K
Size of hash table (Bytes)
% o
f to
tal ru
nti
me Rest
coreLoopfindMatch BLASTN
biosequencesearchapplication

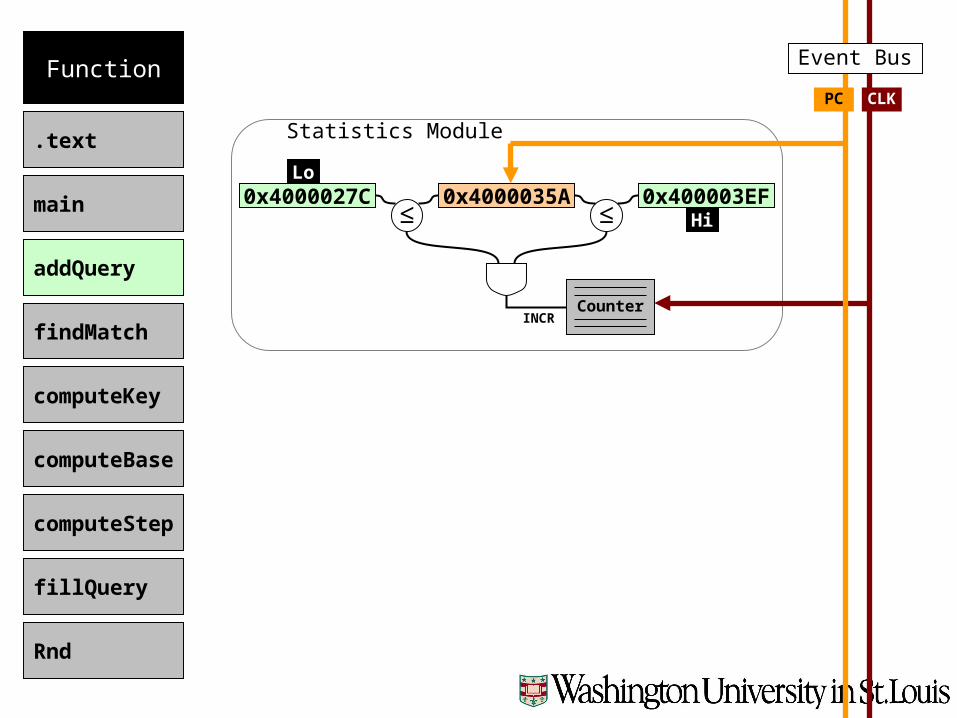
FunctionTime / Cycles
.text
main
addQuery
findMatch
computeKey
computeBase
computeStep
fillQuery
Rnd
Cache Hits / Misses
Read Write
Expand tomeasure cachehits/misses

Measure Several Configurations

Impact of D-cache Configuration
BLASTNbiosequencesearchapplication
86
88
90
92
94
96
98
100
128K, 1Kx1 128K,32Kx1
128K,16Kx2
32K, 1Kx1 32K, 32Kx1 32K, 16Kx2
Size of hash table, D-cache configuration
hit
rat
e (%
)
TotalfindMatchcoreLoop

Impact of I-cache Configuration
BLASTNbiosequencesearchapplication
0
5
10
15
20
25
30
35
128K 32K
BLASTN hash table sizes (Bytes)
Ru
n t
ime (
secs)
1KB I -Cache4KB I -Cache
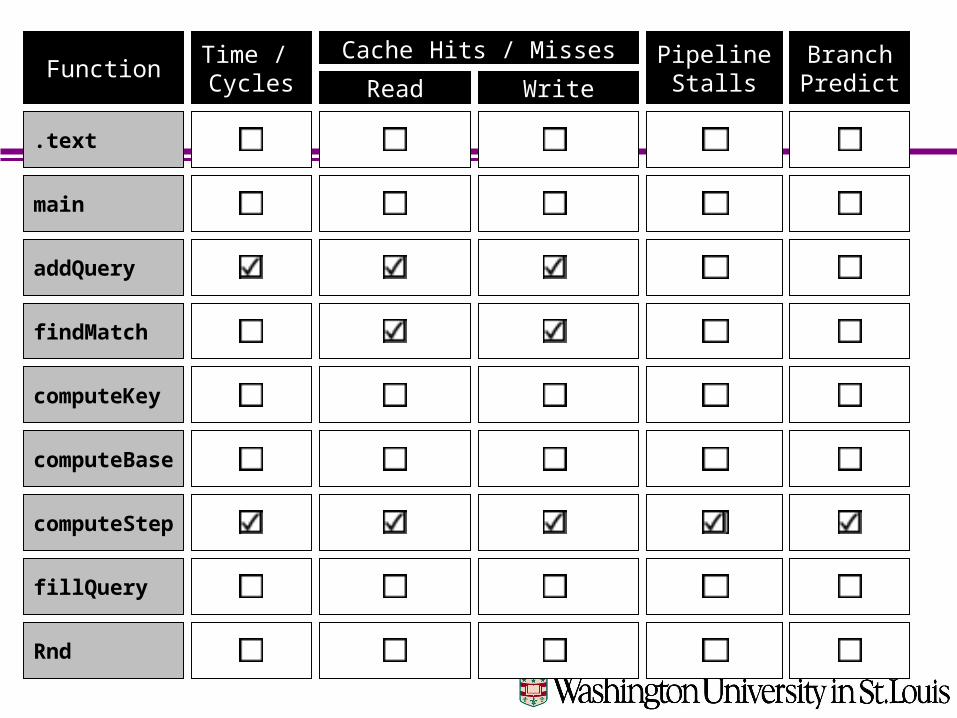
FunctionTime / Cycles
Cache Hits / Misses
Read Write
.text
main
addQuery
findMatch
computeKey
computeBase
computeStep
fillQuery
Rnd
PipelineStalls
BranchPredict

Time for Single Run
Almost 2orders ofmagnitudefaster thansimulation
80000
1800
1
10
100
1000
10000
100000
SimpleScalar 3.0 LEON
Tim
e (
sec)

Implications of Slow Simulation
• Focus has historically been on measuring the performance of a single thread of a single application
• Real apps are often executed in a multitasking environment– Impacts cache behavior– Ignores OS (system call) performance
• Liquid architecture system enables direct measurement, including OS

OS Boot Sequence

Summary
• Run-time reconfigurable processors will be available sooner rather than later
• Determining desired configuration is a difficult design task– Large search space– Depends on accurate performance data
• Liquid architecture system enables direct measurement of performance properties

Current and Future Work
• Evaluation of several arch. design ideas• Automated search of the design space• Characterizing performance analysis
methods– Analytic models– Simulation models– Direct execution models
• Usable as is for evaluating soft-core procs
• Like to extend to higher-speed procs