Embed Size (px)
Citation preview
LIQUEFACTION POTENTIAL OF COHESIONLESS SOILS
GEOTECHNICAL DESIGN PROCEDURE
GDP-9 Revision #3
AUGUST 2015

EB 15-025 Page 1 of 62
GEOTECHNICAL DESIGN PROCEDURE:
LIQUEFACTION POTENTIAL OF COHESIONLESS SOILS
GDP-9
Revision #3
STATE OF NEW YORK
DEPARTMENT OF TRANSPORTATION
GEOTECHNICAL ENGINEERING BUREAU
AUGUST 2015

EB 15-025 Page 2 of 62
ABSTRACT
This report provides basic knowledge about liquefaction of cohesionless soils under seismic
loading. Presented also are the most widely accepted methods for evaluating the liquefaction
potential of cohesionless oils in level ground, for estimating earthquake-induced settlements and
for analyzing slope stability against flow slides. Sample problems to demonstrate each design
procedure are included in the appendices.
A brief review is presented of the seismicity of New York State, the level of which can be
characterized as moderate. The State historically has experienced earthquakes up to a magnitude
of 6.0. Earthquakes of this magnitude can cause structural and ground failures from liquefaction.
Liquefaction-induced failure types and factors affecting liquefaction susceptibility are also
reviewed.
Finally, methods for improving in-situ soil conditions to reduce liquefaction susceptibility are
discussed.
EB 15-025 Page 3 of 62
TABLE OF CONTENTS
ABSTRACT .....................................................................................................................................2
TABLE OF CONTENTS .................................................................................................................3
LIST OF FIGURES ..........................................................................................................................5
LIST OF TABLES ...........................................................................................................................6
1. INTRODUCTION................................................................................................................7
1.1 Purpose .....................................................................................................................7
1.2 General .....................................................................................................................7
1.3 Liquefaction Phenomena ..........................................................................................7
1.4 Seismicity of the State of New York .......................................................................8
1.5 Ground Motions .....................................................................................................13
2. FAILURE TYPES AND FACTORS AFFECTING
LIQUEFACTION SUSCEPTIBILITY ..............................................................................20
2.1 Failure Types ..........................................................................................................20
2.1.1 Flow Failures .............................................................................................20
2.1.2 Lateral Spreading .......................................................................................20
2.1.3 Ground Oscillation .....................................................................................21
2.1.4 Loss of Bearing Capacity ...........................................................................21
2.1.5 Effects of Liquefaction on Piles .................................................................23
2.2 Factors Affecting Liquefaction Susceptibility .......................................................24
2.2.1 Grain-Size Distribution and Soil Types .....................................................24
2.2.2 Relative Density .........................................................................................26
2.2.3 Earthquake Loading Characteristics ..........................................................26
2.2.4 Vertical Effective Stress and Overconsolidation .......................................26
2.2.5 Age and Origin of the Soils........................................................................26
2.2.6 Seismic Strain History ...............................................................................27
2.2.7 Degree of Saturation ..................................................................................27
2.2.8 Thickness of Sand Layer ............................................................................27
3. EVALUATION OF LIQUEFACTION POTENTIAL .......................................................29
3.1 Introduction ............................................................................................................29
3.2 Evaluation of Liquefaction Potential of Horizontal Ground
Using SPT Resistance ............................................................................................32
3.2.1 Sands and Silty Sands ................................................................................32
3.2.2 Gravelly Soils .............................................................................................40
3.3 A Simplified Steady-State Strength Procedure for Analyzing Stability of
Embankments and Slopes Against Flow Failures ..................................................40
3.4 Estimation of Earthquake-Induced Settlements in Sands and Sandy Silts ............44
4. METHODS FOR IMPROVING LIQUEFACTION-PRONE SOILS ................................48
EB 15-025 Page 4 of 62
4.1 Introduction ............................................................................................................48
4.2 Dewatering .............................................................................................................48
4.3 Soil Improvement by In-Situ Techniques ..............................................................48
ACKNOWLEDGEMENTS ...........................................................................................................53
REFERENCES ..............................................................................................................................54
APPENDIX ....................................................................................................................................62
A. Modified Mercalli Intensity and Richter Scale Magnitude ................................. A-1
B. Example Problem for evaluating the Liquefaction Potential and for
Estimating the Earthquake-Induced Settlement of Soil Deposits Under
Level Ground Conditions (US Customary Units) ................................................ B-1
Example Problem for evaluating the Liquefaction Potential and for
Estimating the Earthquake-Induced Settlement of Soil Deposits Under
Level Ground Conditions (International System of Units) .................................. B-5
C. Example Problem for Analyzing the Stability of an Embankment
Against Flow Failure (US Customary Units) .......................................................C-1
Example Problem for Analyzing the Stability of an Embankment
Against Flow Failure (International System of Units) .........................................C-2
EB 15-025 Page 5 of 62
LIST OF FIGURES
FIGURE PAGE
1. Map of All Known Earthquake Activity from 1534 to 1986 for the Northeast United
States and Adjacent Canada ...............................................................................................10
2. Seismic Zonation Map of New York .................................................................................12
3. Map of Horizontal Accelerations in Rock with 10% Probability of Being
Exceeded in 50 Years .........................................................................................................15
4. Map of Horizontal Accelerations in Rock with 10% Probability of Being
Exceeded in 250 Years .......................................................................................................16
5. Approximate Relationship Between Maximum Accelerations on Rock and Maximum
Ground Acceleration ..........................................................................................................17
6. Amplification - attenuation Relationship for Modifying Bedrock Acceleration at
Soft Soil Sites ....................................................................................................................18
7. Lateral Spread Before and After Liquefaction ...................................................................22
8. Ground Oscillation Before and After Liquefaction ...........................................................22
9. Limits in the Gradation Curves Separating Liquefiable and Nonliquefiable Soils ............25
10. Proposed Boundary Curves for Site Identification of Liquefaction-Induced Damage ......28
11. Undrained Stress-Strain Curve for Loose Sand .................................................................31
12. Undrained Stress-Strain Curve for Dense Sand .................................................................31
13. Stress Reduction Factor in Relation to Depth ....................................................................34
14. Relationship Between Stress Ratios Required to Cause Liquefaction and
(N1)60 Values for Cohesionless Soils Having Fines Content Less Than 5%
in M=5.25-8.25 .................................................................................................................36
15. Relationship Between Stress Ratios Required to Cause Liquefaction and
(N1)60 Values for Cohesionless Soils Having Fines Content of 15%
in M=5.25-8.25 ..................................................................................................................37
16. Relationship Between Stress Ratios Required to Cause Liquefaction and
(N1)60 Values for Cohesionless Soils Having Fines Content of 35%
in M=5.25-8.25 ..................................................................................................................38
17. Effects of Plasticity Index on the Cyclic Resistance of Soil ..............................................39
18. Effects of Gravel content on the Cyclic Resistance of Gravelly Soils ...............................42
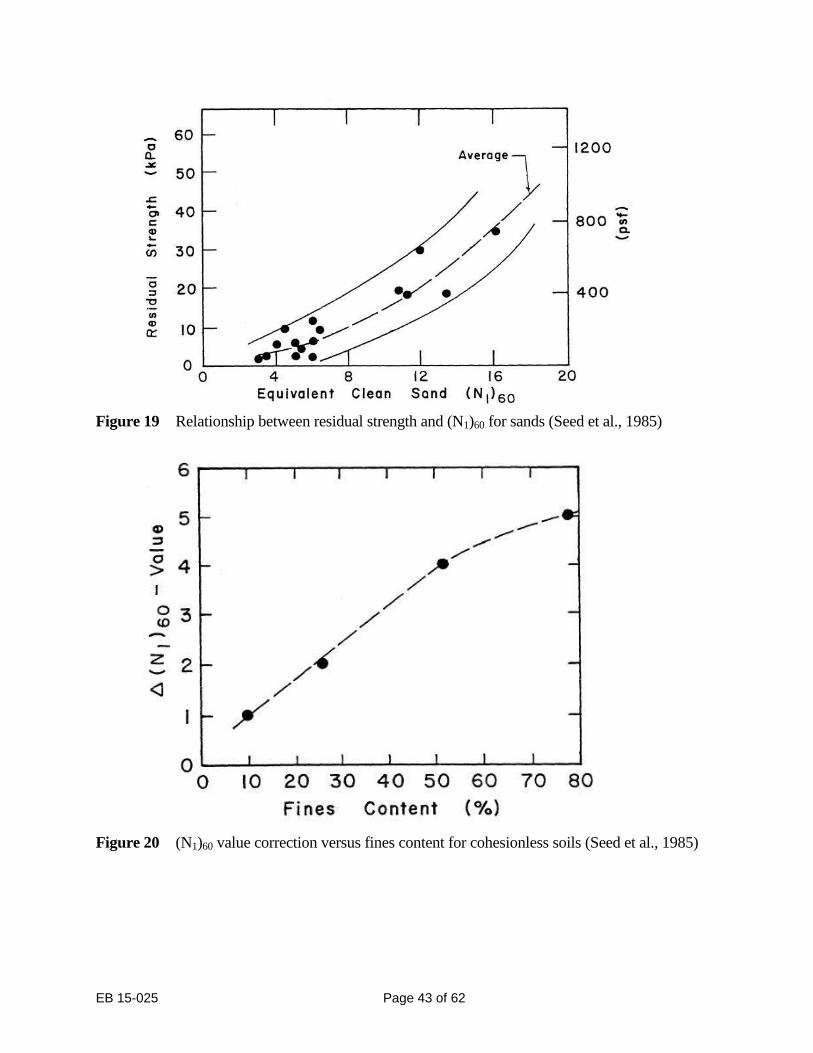
19. Relationship Between Residual Strength and (N1)60 for Sands .........................................43
20. (N1)60 Value Correction Versus Fines Content for Cohesionless Soils .............................43
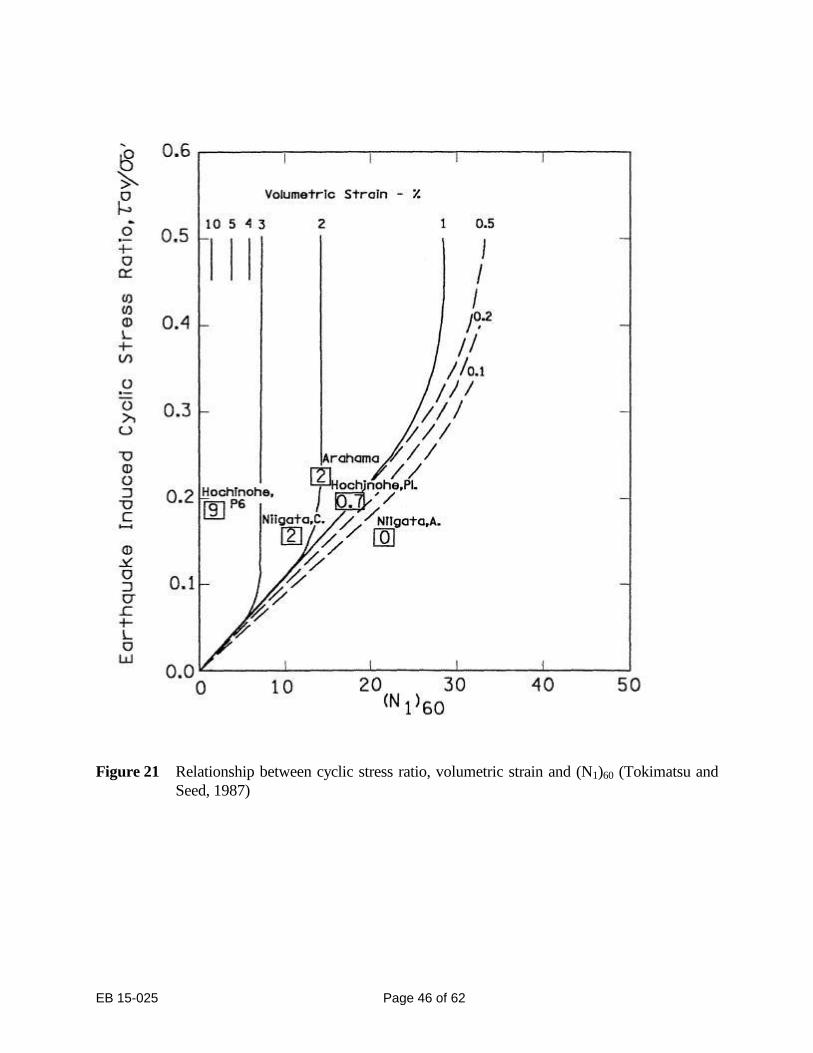
21. Relationship Between Cyclic Stress Ratio, Volumetric Strain and (N1)60 .........................46
22. Scaling Factor for Effect of Earthquake Magnitude on Cyclic Stress Ratio ......................47
A-1. Modified Mercalli Intensity Levels for the Loma Prieta Earthquake.............................. A-3
EB 15-025 Page 6 of 62
LIST OF TABLES
TABLE PAGE
1. Significant Earthquakes in Northeast United States and Canada from 1534 to 1991 ........11
2. Classes of Liquefaction-Induced Structural Instability .....................................................23
3. Recommended SPT Procedure for Use in Liquefaction Correlations ...............................35
4. Summary of Energy Ratios for SPT Procedures. ...............................................................35
5. Improvement of Liquefiable Soil Foundation Conditions .................................................43
A.1. Modified Mercalli Scale ................................................................................................. A-2
A.2. Relationship Between the Richter Scale Magnitude and the Amount
of Energy Released. ........................................................................................................ A-5
EB 15-025 Page 7 of 62
1. INTRODUCTION
1.1 Purpose
The purpose of this report is to provide basic knowledge about liquefaction of cohesionless soils
under seismic loading for NYSDOT Geotechnical Engineering Bureau designers, and secondly, to
present the most widely accepted methods for evaluating the liquefaction potential of soils, for
analyzing stability of embankments and slopes against flow failures resulting from liquefaction and
for estimating the earthquake-induced settlements in cohesionless soil deposits. Due to the
complex nature of the subject and the fact that controversies concerning liquefaction still exist, this
report may be subject to revision as new design procedures or consensus become available.
Interested readers may refer to publications by Seed (1979), Finn (1981), Ishihara (1985), National
Research Council (1985) and Castro (1987).
1.2 General
A number of failures of embankments, natural slopes, earth structures and foundations have been
attributed to the liquefaction of sands caused by either static or seismic loading. Case histories of
landslides or flow failures due to liquefaction are the 1937 Zeeland coast of Holland slides
involving 7 million cubic meters of alluvial sands, and the 1944 Mississippi River slide near Baton
Rouge containing about 4 million cubic meters of fine sands. Failures of hydraulic fill dams such
as the Calaveras Dam in California in 1918, the Fort Peck Dam in Montana in 1938, and the Lower
San Fernando Dam during the 1971 San Fernando Earthquake in California, just to name a few,
were triggered by the liquefaction of sands. Although the importance of liquefaction of sands
induced by static loading has been recognized since the work of Casagrande (1936), the subject of
liquefaction of sands by seismic loading had not received a great deal of attention until 1964 when
two major earthquakes shook Anchorage, Alaska, and Niigata, Japan, resulting in substantial
damage and loss. The Alaska earthquake in 1964, a shock with a magnitude, M, of 9.2 on the
Richter scale, destroyed or damaged more than 200 bridges and caused massive landslides. During
the 7.5-magnitude earthquake of June 16, 1964, in Niigata, Japan, the extensive liquefaction of sand
deposits resulted in major damage to buildings, bridges, highways and utilities. It was estimated
that more than 60,000 buildings and houses were destroyed.
To date, after 30 years of intensive research on this subject, much progress has been made in
understanding the liquefaction phenomena of cohesionless soils under seismic loading. A variety
of methods for evaluating the liquefaction potential of soils have been proposed.
New York State generally is not as seismically active as states that have areas located near tectonic
plate boundaries. The probability of the State being struck by a major earthquake is small.
However, historical records indicate that New York State has experienced M=4 to 6 earthquakes,
which can produce ground shaking levels up to VIII on the Modified Mercalli Intensity, MMI (For
definitions of MMI and Richter magnitudes, see Appendix A). Earthquakes of this intensity can
cause liquefaction resulting in structural and ground failures.
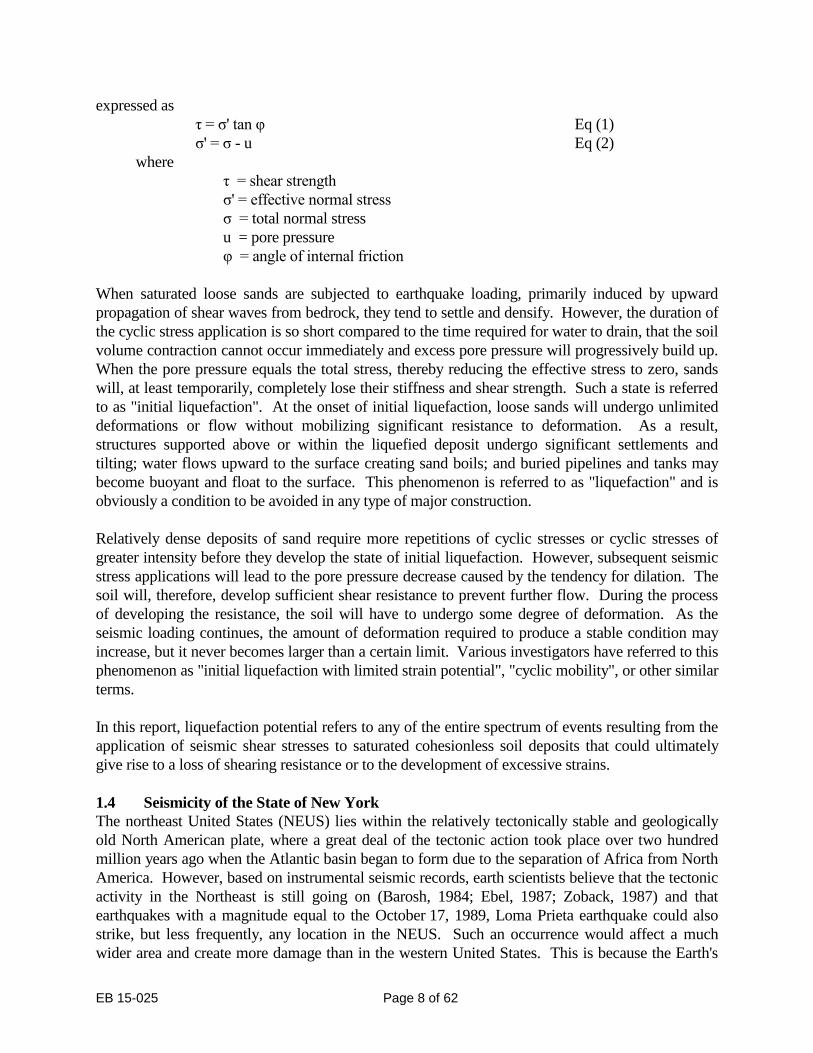
1.3 Liquefaction Phenomena
The liquefaction phenomenon of soil deposits can be described as the reduction of shear strength
due to pore pressure buildup in the soil skeleton. The shear strength of cohesionless soil, τ, depends
mainly on the angle of internal friction and the effective stress acting on the soil skeleton and can be
EB 15-025 Page 8 of 62
expressed as
τ = σ' tan φ Eq (1)
σ' = σ - u Eq (2)
where
τ = shear strength
σ' = effective normal stress
σ = total normal stress
u = pore pressure
φ = angle of internal friction
When saturated loose sands are subjected to earthquake loading, primarily induced by upward
propagation of shear waves from bedrock, they tend to settle and densify. However, the duration of
the cyclic stress application is so short compared to the time required for water to drain, that the soil
volume contraction cannot occur immediately and excess pore pressure will progressively build up.
When the pore pressure equals the total stress, thereby reducing the effective stress to zero, sands
will, at least temporarily, completely lose their stiffness and shear strength. Such a state is referred
to as "initial liquefaction". At the onset of initial liquefaction, loose sands will undergo unlimited
deformations or flow without mobilizing significant resistance to deformation. As a result,
structures supported above or within the liquefied deposit undergo significant settlements and
tilting; water flows upward to the surface creating sand boils; and buried pipelines and tanks may
become buoyant and float to the surface. This phenomenon is referred to as "liquefaction" and is
obviously a condition to be avoided in any type of major construction.
Relatively dense deposits of sand require more repetitions of cyclic stresses or cyclic stresses of
greater intensity before they develop the state of initial liquefaction. However, subsequent seismic
stress applications will lead to the pore pressure decrease caused by the tendency for dilation. The
soil will, therefore, develop sufficient shear resistance to prevent further flow. During the process
of developing the resistance, the soil will have to undergo some degree of deformation. As the
seismic loading continues, the amount of deformation required to produce a stable condition may
increase, but it never becomes larger than a certain limit. Various investigators have referred to this
phenomenon as "initial liquefaction with limited strain potential", "cyclic mobility", or other similar
terms.
In this report, liquefaction potential refers to any of the entire spectrum of events resulting from the
application of seismic shear stresses to saturated cohesionless soil deposits that could ultimately
give rise to a loss of shearing resistance or to the development of excessive strains.
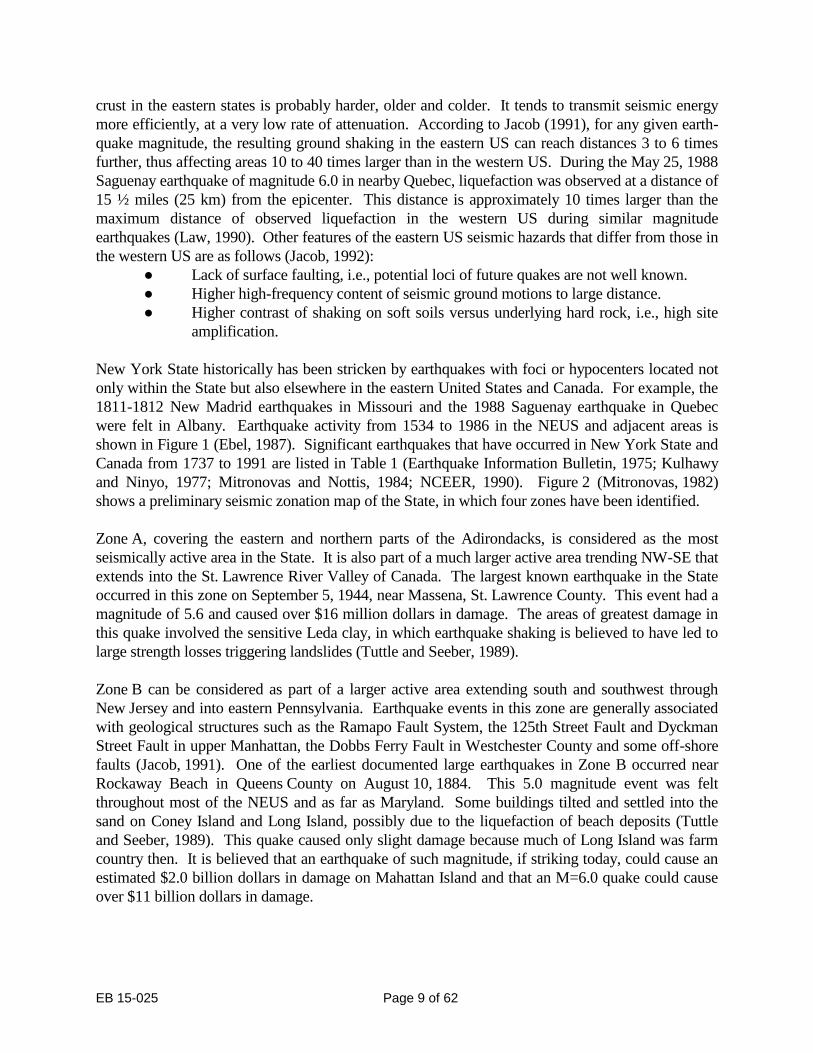
1.4 Seismicity of the State of New York
The northeast United States (NEUS) lies within the relatively tectonically stable and geologically
old North American plate, where a great deal of the tectonic action took place over two hundred
million years ago when the Atlantic basin began to form due to the separation of Africa from North
America. However, based on instrumental seismic records, earth scientists believe that the tectonic
activity in the Northeast is still going on (Barosh, 1984; Ebel, 1987; Zoback, 1987) and that
earthquakes with a magnitude equal to the October 17, 1989, Loma Prieta earthquake could also
strike, but less frequently, any location in the NEUS. Such an occurrence would affect a much
wider area and create more damage than in the western United States. This is because the Earth's
EB 15-025 Page 9 of 62
crust in the eastern states is probably harder, older and colder. It tends to transmit seismic energy
more efficiently, at a very low rate of attenuation. According to Jacob (1991), for any given earth-
quake magnitude, the resulting ground shaking in the eastern US can reach distances 3 to 6 times
further, thus affecting areas 10 to 40 times larger than in the western US. During the May 25, 1988
Saguenay earthquake of magnitude 6.0 in nearby Quebec, liquefaction was observed at a distance of
15 ½ miles (25 km) from the epicenter. This distance is approximately 10 times larger than the
maximum distance of observed liquefaction in the western US during similar magnitude
earthquakes (Law, 1990). Other features of the eastern US seismic hazards that differ from those in
the western US are as follows (Jacob, 1992):
● Lack of surface faulting, i.e., potential loci of future quakes are not well known.
● Higher high-frequency content of seismic ground motions to large distance.
● Higher contrast of shaking on soft soils versus underlying hard rock, i.e., high site
amplification.
New York State historically has been stricken by earthquakes with foci or hypocenters located not
only within the State but also elsewhere in the eastern United States and Canada. For example, the
1811-1812 New Madrid earthquakes in Missouri and the 1988 Saguenay earthquake in Quebec
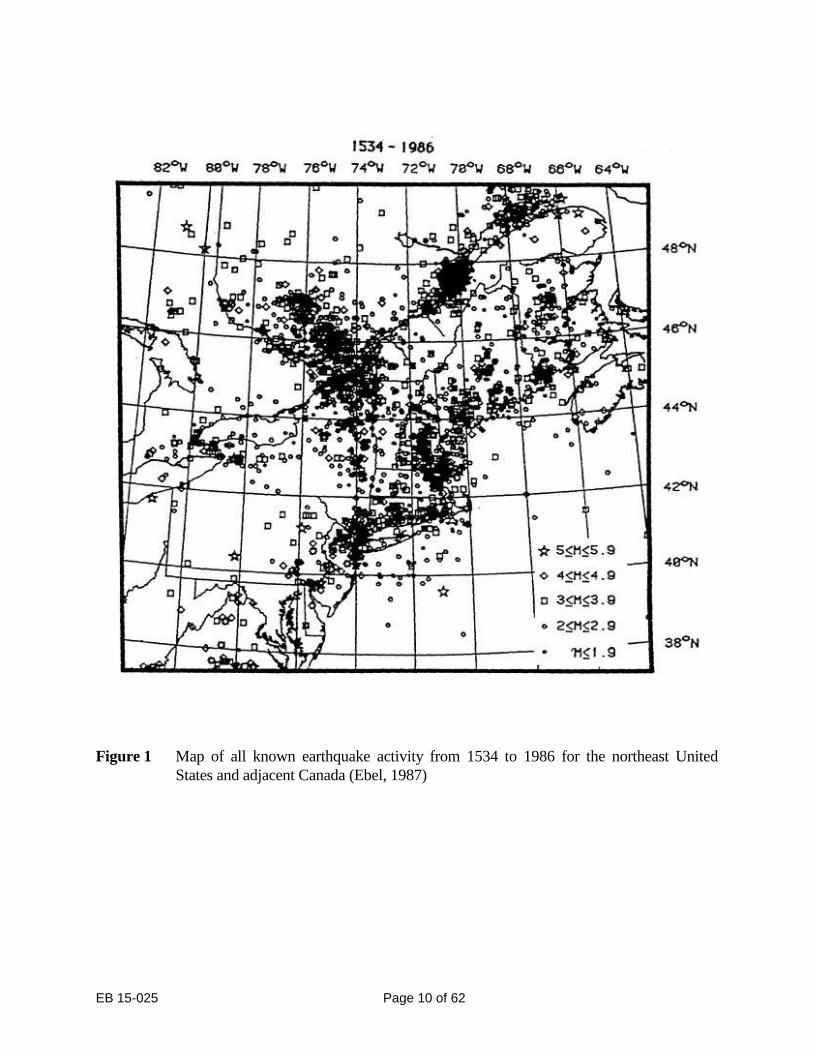
were felt in Albany. Earthquake activity from 1534 to 1986 in the NEUS and adjacent areas is
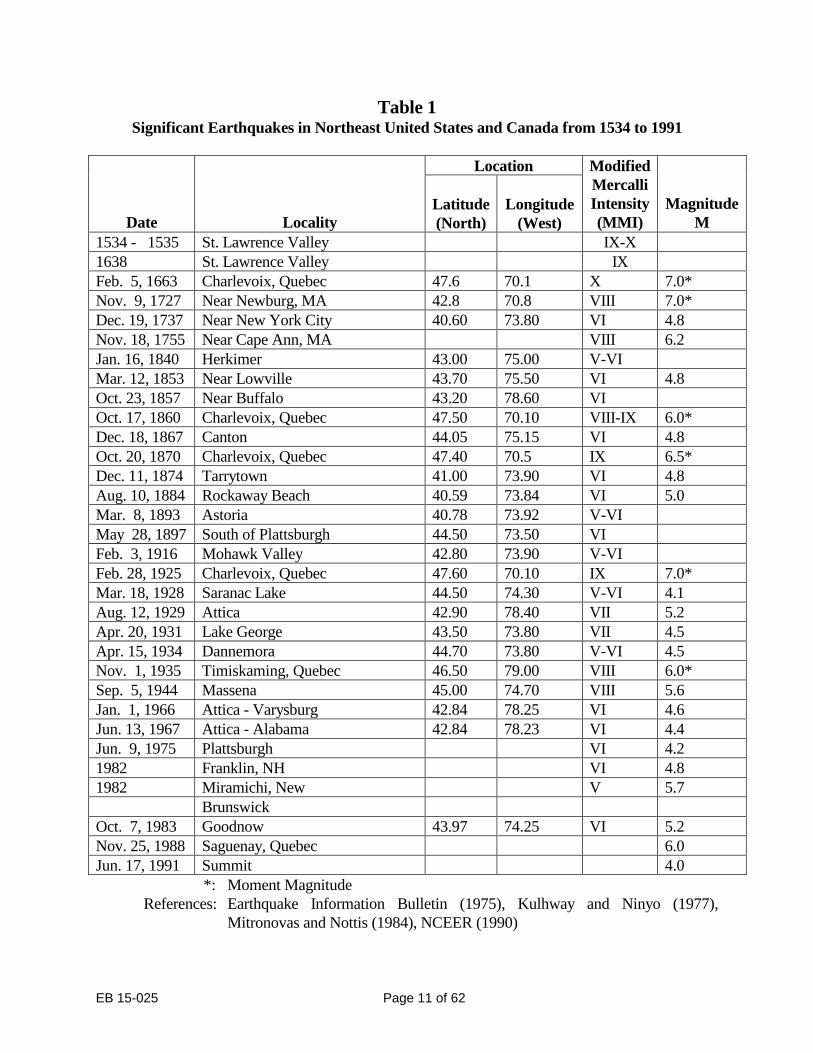
shown in Figure 1 (Ebel, 1987). Significant earthquakes that have occurred in New York State and
Canada from 1737 to 1991 are listed in Table 1 (Earthquake Information Bulletin, 1975; Kulhawy
and Ninyo, 1977; Mitronovas and Nottis, 1984; NCEER, 1990). Figure 2 (Mitronovas, 1982)
shows a preliminary seismic zonation map of the State, in which four zones have been identified.
Zone A, covering the eastern and northern parts of the Adirondacks, is considered as the most
seismically active area in the State. It is also part of a much larger active area trending NW-SE that
extends into the St. Lawrence River Valley of Canada. The largest known earthquake in the State
occurred in this zone on September 5, 1944, near Massena, St. Lawrence County. This event had a
magnitude of 5.6 and caused over $16 million dollars in damage. The areas of greatest damage in
this quake involved the sensitive Leda clay, in which earthquake shaking is believed to have led to
large strength losses triggering landslides (Tuttle and Seeber, 1989).
Zone B can be considered as part of a larger active area extending south and southwest through
New Jersey and into eastern Pennsylvania. Earthquake events in this zone are generally associated
with geological structures such as the Ramapo Fault System, the 125th Street Fault and Dyckman
Street Fault in upper Manhattan, the Dobbs Ferry Fault in Westchester County and some off-shore
faults (Jacob, 1991). One of the earliest documented large earthquakes in Zone B occurred near
Rockaway Beach in Queens County on August 10, 1884. This 5.0 magnitude event was felt
throughout most of the NEUS and as far as Maryland. Some buildings tilted and settled into the
sand on Coney Island and Long Island, possibly due to the liquefaction of beach deposits (Tuttle
and Seeber, 1989). This quake caused only slight damage because much of Long Island was farm
country then. It is believed that an earthquake of such magnitude, if striking today, could cause an
estimated $2.0 billion dollars in damage on Mahattan Island and that an M=6.0 quake could cause
over $11 billion dollars in damage.
EB 15-025 Page 10 of 62
Figure 1 Map of all known earthquake activity from 1534 to 1986 for the northeast United
States and adjacent Canada (Ebel, 1987)
EB 15-025 Page 11 of 62
Table 1 Significant Earthquakes in Northeast United States and Canada from 1534 to 1991
Date
Locality
Location Modified
Mercalli
Intensity
(MMI)
Magnitude
M
Latitude
(North)
Longitude
(West)
1534 - 1535 St. Lawrence Valley IX-X
1638 St. Lawrence Valley IX
Feb. 5, 1663 Charlevoix, Quebec 47.6 70.1 X 7.0*
Nov. 9, 1727 Near Newburg, MA 42.8 70.8 VIII 7.0*
Dec. 19, 1737 Near New York City 40.60 73.80 VI 4.8
Nov. 18, 1755 Near Cape Ann, MA VIII 6.2
Jan. 16, 1840 Herkimer 43.00 75.00 V-VI
Mar. 12, 1853 Near Lowville 43.70 75.50 VI 4.8
Oct. 23, 1857 Near Buffalo 43.20 78.60 VI
Oct. 17, 1860 Charlevoix, Quebec 47.50 70.10 VIII-IX 6.0*
Dec. 18, 1867 Canton 44.05 75.15 VI 4.8
Oct. 20, 1870 Charlevoix, Quebec 47.40 70.5 IX 6.5*
Dec. 11, 1874 Tarrytown 41.00 73.90 VI 4.8
Aug. 10, 1884 Rockaway Beach 40.59 73.84 VI 5.0
Mar. 8, 1893 Astoria 40.78 73.92 V-VI
May 28, 1897 South of Plattsburgh 44.50 73.50 VI
Feb. 3, 1916 Mohawk Valley 42.80 73.90 V-VI
Feb. 28, 1925 Charlevoix, Quebec 47.60 70.10 IX 7.0*
Mar. 18, 1928 Saranac Lake 44.50 74.30 V-VI 4.1
Aug. 12, 1929 Attica 42.90 78.40 VII 5.2
Apr. 20, 1931 Lake George 43.50 73.80 VII 4.5
Apr. 15, 1934 Dannemora 44.70 73.80 V-VI 4.5
Nov. 1, 1935 Timiskaming, Quebec 46.50 79.00 VIII 6.0*
Sep. 5, 1944 Massena 45.00 74.70 VIII 5.6
Jan. 1, 1966 Attica - Varysburg 42.84 78.25 VI 4.6
Jun. 13, 1967 Attica - Alabama 42.84 78.23 VI 4.4
Jun. 9, 1975 Plattsburgh VI 4.2
1982 Franklin, NH VI 4.8
1982 Miramichi, New V 5.7
Brunswick
Oct. 7, 1983 Goodnow 43.97 74.25 VI 5.2
Nov. 25, 1988 Saguenay, Quebec 6.0
Jun. 17, 1991 Summit 4.0
*: Moment Magnitude
References: Earthquake Information Bulletin (1975), Kulhway and Ninyo (1977),
Mitronovas and Nottis (1984), NCEER (1990)

EB 15-025 Page 12 of 62
Figure 2 Seismic zonation map of New York (Mitronovas, 1982)
EB 15-025 Page 13 of 62
Zone C can be considered as another high risk seismic zone within the State, although the number
of known earthquakes in this zone is smaller than that in Zones A and B. One of the largest
earthquakes in the State occurred in this zone near Attica in Wyoming County on August 12, 1929.
The area receiving the severest damage stretched from Southeastern Genesee County into north-
central Wyoming County. The villages of Attica and Warsaw were significantly damaged. This
event is believed to be associated with the Clarendon-Lindon Fault System, which may be the
largest, oldest and most seismically active fault system in western New York.
Zone D, the central part of the State, has historically shown the least amount of seismic activity.
Fischer and McWhorter (1972) and Mitronovas (1982), based upon the available instrumental data,
have suggested a possible north-south connection between Zones A and B along the eastern border
of the State and that the mid-Hudson-Mohawk River valleys may be as seismically hazardous as
Zone B.
According to the New York State Geological Survey (1989), earthquakes up to magnitudes of 6.0-
6.5 are believed to be possible anywhere in the State. Earthquakes up to magnitudes of 7.0-7.5 are
believed to be possible in Zones A and B. However, the state-of-the-art earthquake prediction
technology is unable to predict when or where the next damaging earthquake in the State will occur,
nor its severity.
1.5 Ground Motions
It is generally agreed, based upon analytical study and instrumental records, that earthquake
magnitude, distance from the hypocenter and local subsurface conditions are the three major factors
that affect the seismic intensity at the site. The larger the magnitude or shorter the distance from the
earthquake focus, the stronger is the seismic intensity at a given site. In addition, the level of
shaking intensity in rock is generally different from that in a soil deposit at ground surface or at any
depth below the ground surface. Other factors being equal, local subsurface conditions alone can
both amplify and attenuate earthquake forces. During small earthquakes and microtremors, the
ground surface accelerations on soil deposits, especially on soft compressible clay layers and
alluvial deposits, are usually higher than those occurring on bedrock. However, as earthquake
magnitudes become greater, the horizontal accelerations on soil sites may be equal to or lower than
those on rock sites.
Ground response due to soil amplification and soil attenuation is a complex subject and is beyond
the scope of this report. However, the degree of amplification and attenuation of horizontal
acceleration at the ground surface is believed to depend on factors ( Dobry and Vucetic, 1987; Law,
1990) such as: soil type, consistency and natural period of the soil deposit, degree of stress-
strain nonlinearity of the soil under shaking, dynamic soil properties, range of shear strains induced
in the soil by earthquake, soil-structure interaction, local geological features, frequency content of
the ground motions, etc. As noted by Ishihara (1985), when a soil layer is liquefied, the energy of
the vertically propagating shear waves will, to a certain degree, be absorbed by the liquefied soil.
As a result, the transmission of incoming acceleration to ground surface is depressed and the
shaking intensity attenuated. He suggests using 0.2g as the maximum ground surface acceleration
on top of a liquefied layer.
EB 15-025 Page 14 of 62
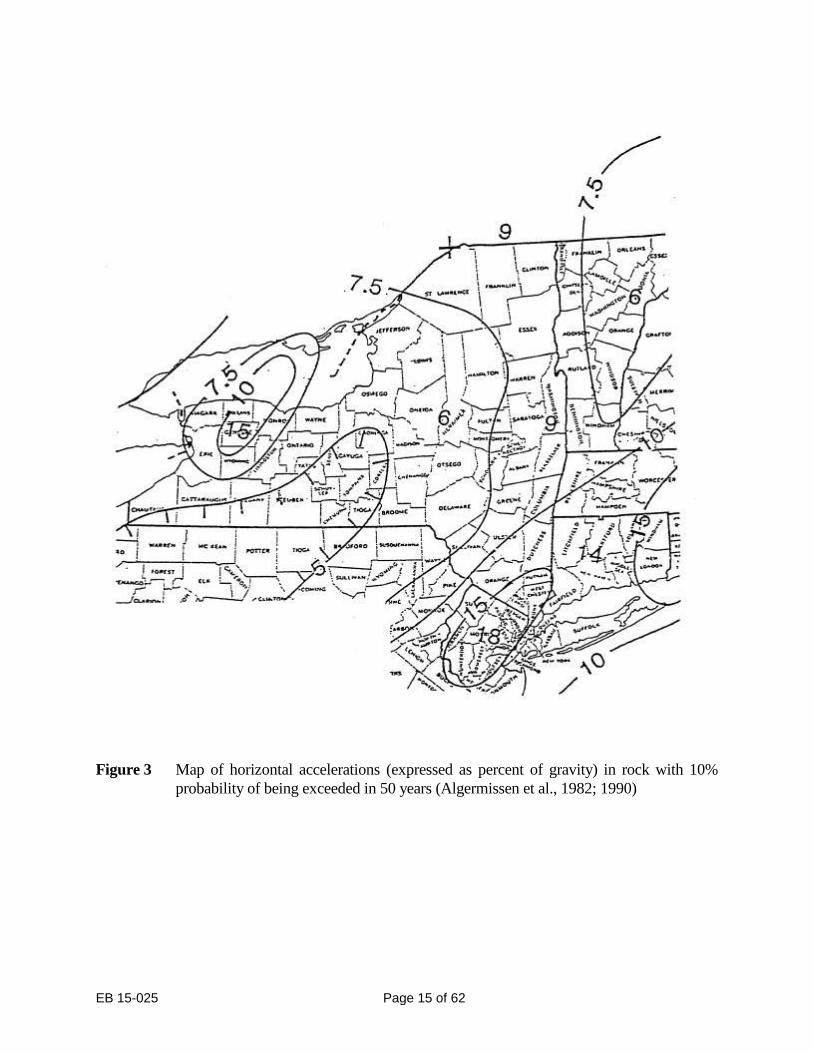
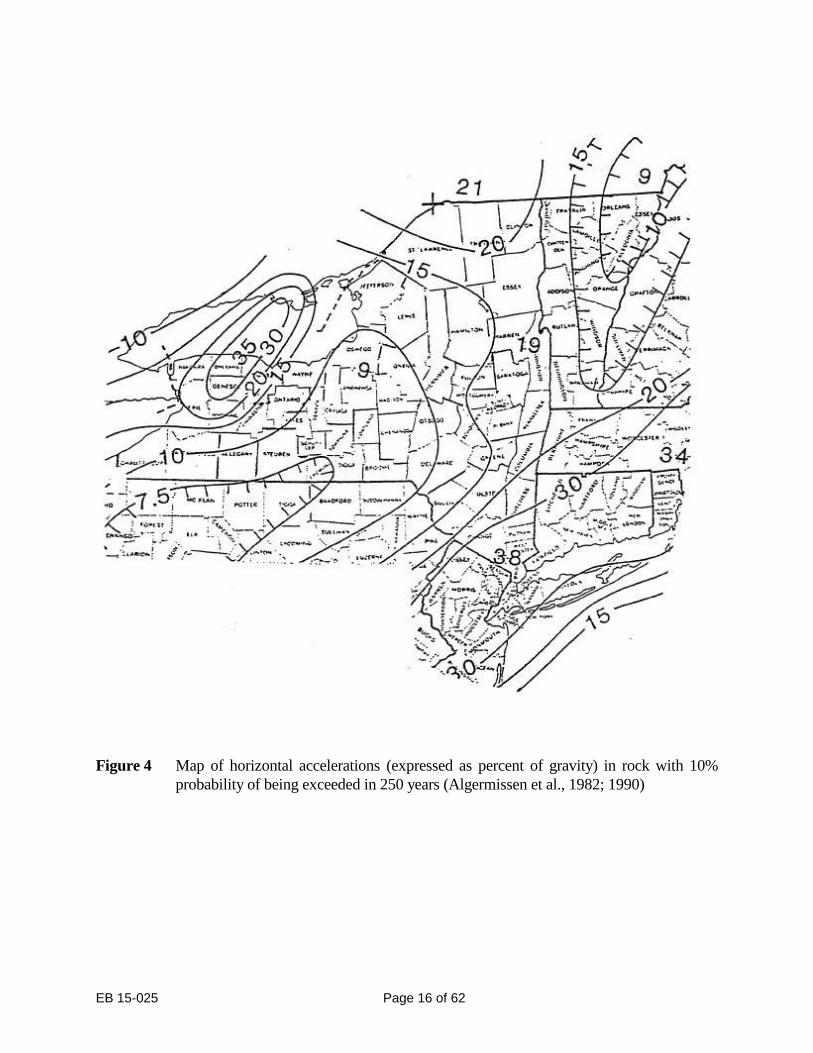
The rock acceleration coefficients, expressed as percent of gravity, for the State may be determined
from the contour maps of Figures 3 and 4 (FEMA, 1988). The coefficients were mapped by the
U.S. Geological Survey (Algermissen et al., 1982; 1990) at two different probability levels -
10 percent chance of exceedance in 50 and 250 years - to show relative hazard which may be appro-
priate for ordinary bridges and bridges providing critical services, respectively. Linear interpolation
should be used for sites located between contour lines or between a contour line and a local
maximum or minimum.
The maximum ground acceleration caused by an earthquake may be obtained from field
measurements or numerical methods using the wave propagation theory (Idriss and Seed, 1968;
Schnabel et al., 1972; Finn et al., 1976; Liou et al., 1977; Martin and Seed, 1978; Singh et al.,
1981; Prevost, 1989). The most widely used numerical method to estimate the ground site response
has been a quasi-linear total stress analysis using the computer program SHAKE developed by
Schnabel et al. (1972), in which nonlinear stress-strain behavior of soil is accounted for by
adjusting shear modulus and damping, iteratively, until the computed dynamic shear strains
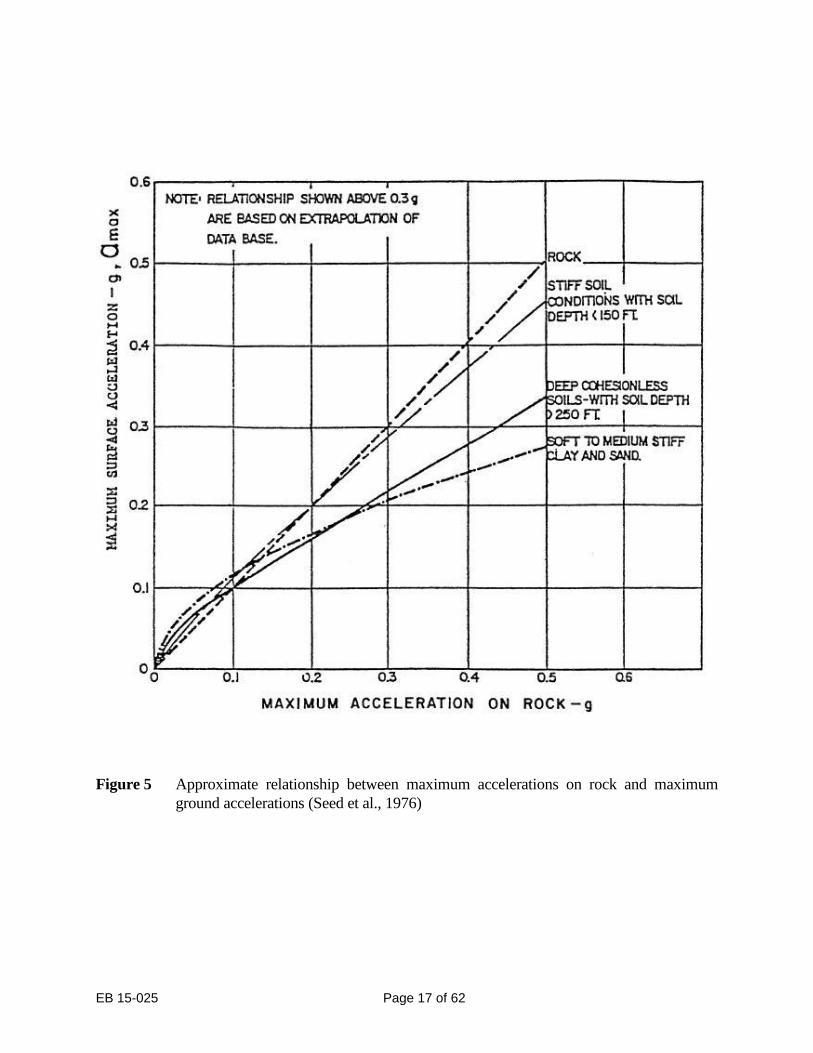
converge. For design simplicity, Seed et al. (1976) established approximate relationships between
maximum accelerations on rock and maximum ground accelerations for various subsurface
conditions, as shown in Figure 5. It shows that maximum horizontal accelerations on rock and on
stiff soil sites are almost identical over a wide range of accelerations. The curve that represents soft
to medium clay and sand sites is believed to be unconservative for soft and medium clays in
estimating the maximum ground accelerations and, therefore, should not be used for such soil
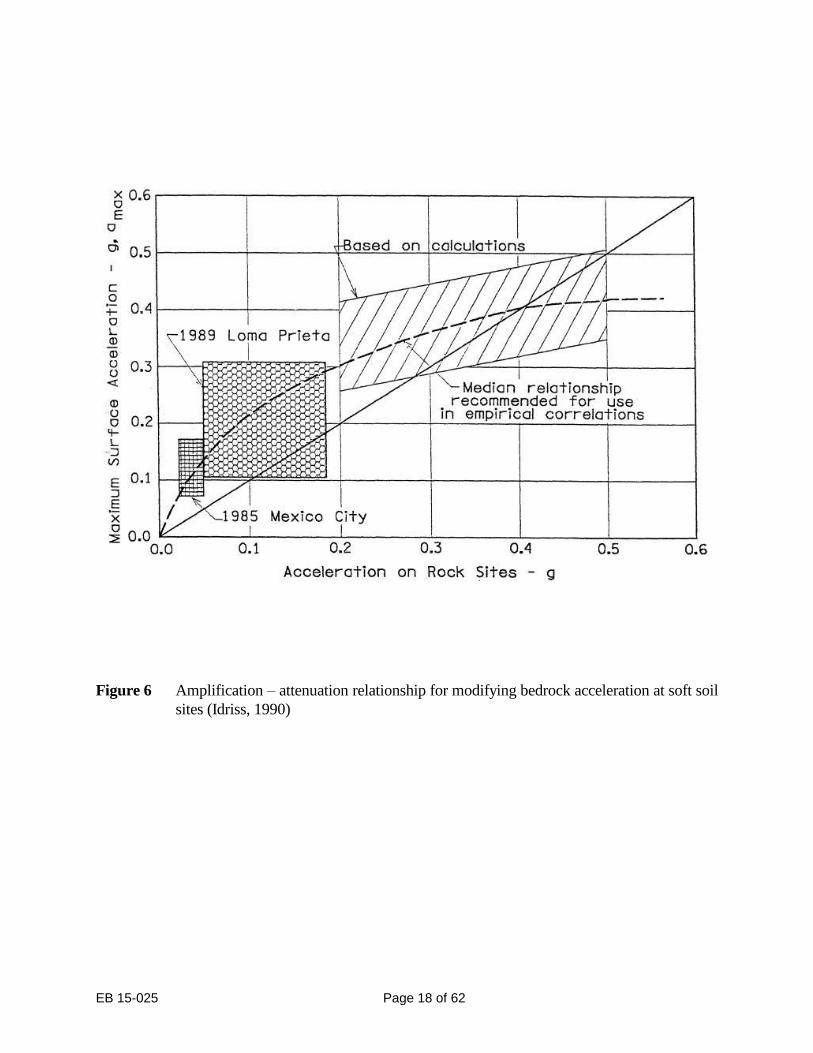
deposits for any design purposes. Idriss (1990) modified this curve to Figure 6 based on the ground
motion data obtained at soft clay sites in the 1985 Mexico City earthquake and the 1989 Loma
Prieta earthquake and a number of site response analyses of soft clay deposits subjected to the 1964
Alaska acceleration time history. This figure indicates that bedrock accelerations beneath soft soil
sites are generally amplified by the soft sediment below 0.4g and attenuated above 0.4g.
EB 15-025 Page 15 of 62
Figure 3 Map of horizontal accelerations (expressed as percent of gravity) in rock with 10%
probability of being exceeded in 50 years (Algermissen et al., 1982; 1990)
EB 15-025 Page 16 of 62
Figure 4 Map of horizontal accelerations (expressed as percent of gravity) in rock with 10%
probability of being exceeded in 250 years (Algermissen et al., 1982; 1990)
EB 15-025 Page 17 of 62
Figure 5 Approximate relationship between maximum accelerations on rock and maximum
ground accelerations (Seed et al., 1976)
EB 15-025 Page 18 of 62
Figure 6 Amplification – attenuation relationship for modifying bedrock acceleration at soft soil
sites (Idriss, 1990)
EB 15-025 Page 19 of 62
However, special precautions should be taken when using this curve because it represents the
ground response of a number of soft, sensitive and highly plastic clay deposits, which tend to have
relatively lower damping values under seismic loading than those of low to medium plasticity clays.
For ordinary bridges founded on deposits of stiff soils and cohesionless soils, the maximum ground
accelerations obtained from Figures 3 and 5 may be used to evaluate the liquefaction potential of
the foundation soils (see Section 3.2). However, for projects involving soft soils and for bridges
providing critical services, a special site-specific seismic response study may be required to
determine the design maximum ground acceleration.
EB 15-025 Page 20 of 62
2. FAILURE TYPES AND FACTORS AFFECTING LIQUEFACTION
SUSCEPTIBILITY
2.1 Failure Types
There are four basic types of ground failure that commonly result from liquefaction: flow failure,
lateral spread, ground oscillation and loss of bearing capacity. Other phenomena associated with
liquefaction include rise of pore water pressure, sand boils and various types of deformation. Sand
boils, by themselves, are not strictly a form of ground failure, but rather are diagnostic evidence of
pore water pressure buildup at depth, indicating that liquefaction has occurred.
2.1.1 Flow Failures
Flow failures occur in sloping areas inclined at 5 percent or greater and are basically landslides
on a very large scale. They are the most damaging type of ground failure caused by
liquefaction. Flow failures occur when a mass of loose granular soil loses its strength after
initial liquefaction and flows like a heavy liquid producing very large deformations. The
incipient condition for the inducement of flow type deformation is closely associated with the
residual strength or steady-state strength which is mobilized in soils after they have undergone
deformations. Flow failures commonly displace large masses of soil for hundreds of feet
(meters).
Materials involved in flows may consist of completely liquefied soil or blocks of intact material
riding on a layer of liquefied soil. Flow failures may occur in natural ground, but are also likely
in man-made earth structures, such as earth dams, mine-tailing dams and fill placed behind
waterfront retaining structures. The earliest known flow failures in the U.S. occurred in the
1811-1812 New Madrid earthquake in Missouri (Fuller, 1912). More recently, the failure of the
upstream slope of the Lower San Fernando Dam during the 1971 San Fernando, California,
earthquake is another notable example of flow failure (Seed et al., 1975).
2.1.2 Lateral Spreading
Lateral spreading is the most common type of ground failure triggered by liquefaction
(Varnes, 1978). Primarily, it involves lateral displacement of large, blocks of intact, surficial
soil as a result of liquefaction in underlying layers (see Figure 7). Other phenomena such as
rotational movements and subsidence occur during lateral spreading. Lateral spreads generally
develop on gentle slopes, as flat as 3 degrees, and move toward a free face, such as an incised
river channel. Permanent displacements ranging from a few inches (centimeters) to over 30 ft.
(10 m) have been observed in the U.S., Japan and other countries, causing damage to
embankments, buried pipelines, roads, bridges, foundations of buildings and canals (National
Research Council, 1985; Youd and Perkins, 1987). During the 1964 Alaska earthquake, for
example, 266 bridges were displaced and damaged by spreading of flood plain deposits toward
river channels. All of these bridges were supported on piles and in nearly all instances the tops
were laterally displaced.
In their 1992 review of several hundred case histories that involve earth failures from
earthquakes, Barlett and Youd found that the potential for significant lateral displacement due
to liquefaction diminishes tremendously for earthquake magnitudes below 6 and that no
significant lateral spreading is likely to occur in dense to very dense sands if the magnitude of
EB 15-025 Page 21 of 62
the earthquake is less than 8.
2.1.3 Ground Oscillation
When the ground is too flat to permit lateral movement, liquefaction at depth may create
separations at the surface by decoupling overlying soil blocks, allowing the blocks to jostle back
and forth on the liquefied layer, as shown in Figure 8. This phenomenon of soil block jostling
produces an oscillation as ground waves. It is reported (Youd, 1984) that the decoupled surface
layer vibrates in a different mode than the underlying and surrounding firm ground, causing
fissures to form and impacts to occur between oscillating blocks and adjacent firm ground.
Ground oscillation and associated sand boils can present an enormous clean-up problem if they
occur in a built-up area. If accompanied by ground settlement, damage and disruption can also
occur.
2.1.4 Loss of Bearing Capacity
When the soil supporting a structure liquefies and loses strength, large deformations can occur,
leading to large settlements and/or tilting of structures. Loss of soil bearing capacity may also
occur when liquefaction that has initially developed in a sand layer a few meters below a
footing propagates upward through overlying sand layers and subsequently weakens the soil
supporting the structure.

EB 15-025 Page 22 of 62
Figure 7 Lateral spread before and after liquefaction (Youd, 1984)
Figure 8 Ground oscillation before and after liquefaction (Youd, 1984)
EB 15-025 Page 23 of 62
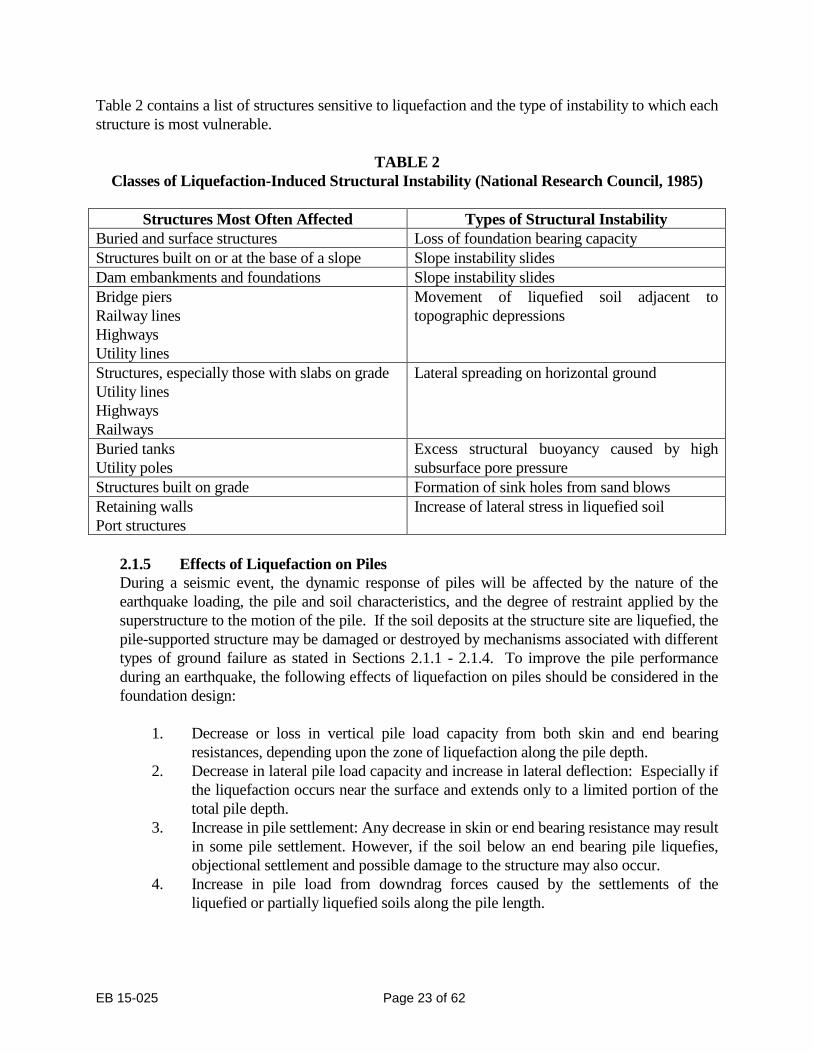
Table 2 contains a list of structures sensitive to liquefaction and the type of instability to which each
structure is most vulnerable.
TABLE 2
Classes of Liquefaction-Induced Structural Instability (National Research Council, 1985)
Structures Most Often Affected Types of Structural Instability
Buried and surface structures Loss of foundation bearing capacity
Structures built on or at the base of a slope Slope instability slides
Dam embankments and foundations Slope instability slides
Bridge piers
Railway lines
Highways
Utility lines
Movement of liquefied soil adjacent to
topographic depressions
Structures, especially those with slabs on grade
Utility lines
Highways
Railways
Lateral spreading on horizontal ground
Buried tanks
Utility poles
Excess structural buoyancy caused by high
subsurface pore pressure
Structures built on grade Formation of sink holes from sand blows
Retaining walls
Port structures
Increase of lateral stress in liquefied soil
2.1.5 Effects of Liquefaction on Piles
During a seismic event, the dynamic response of piles will be affected by the nature of the
earthquake loading, the pile and soil characteristics, and the degree of restraint applied by the
superstructure to the motion of the pile. If the soil deposits at the structure site are liquefied, the
pile-supported structure may be damaged or destroyed by mechanisms associated with different
types of ground failure as stated in Sections 2.1.1 - 2.1.4. To improve the pile performance
during an earthquake, the following effects of liquefaction on piles should be considered in the
foundation design:
1. Decrease or loss in vertical pile load capacity from both skin and end bearing
resistances, depending upon the zone of liquefaction along the pile depth.
2. Decrease in lateral pile load capacity and increase in lateral deflection: Especially if
the liquefaction occurs near the surface and extends only to a limited portion of the
total pile depth.
3. Increase in pile settlement: Any decrease in skin or end bearing resistance may result
in some pile settlement. However, if the soil below an end bearing pile liquefies,
objectional settlement and possible damage to the structure may also occur.
4. Increase in pile load from downdrag forces caused by the settlements of the
liquefied or partially liquefied soils along the pile length.
EB 15-025 Page 24 of 62
2.2 Factors Affecting Liquefaction Susceptibility
Based on field observation and laboratory testing results, liquefaction characteristics of
cohesionless soils are affected by a number of factors:
2.2.1 Grain-Size Distribution and Soil Types
The type of soil most susceptible to liquefaction is one in which the resistance to deformation is
mobilized by friction between particles. If other factors such as grain shape, uniformity
coefficient and relative density are equal, the frictional resistance of cohesionless soil decreases
as the grain size of soils becomes smaller. Tsuchida (1970) summarized the results of sieve
analyses performed on a number of alluvial and diluvial soils that were known to have liquefied
or not to have liquefied during earthquakes. He proposed ranges of grain size curves separating
liquefiable and nonliquefiable soils as shown in Figure 9. The area within the two inner curves
in the figure represents sands and silty sands, the soils with the lowest resistance to liquefaction.
A soil with a gradation curve falling in the zones between the outer and inner curves is less
likely to liquefy. Soils with a higher percentage of gravels tend to mobilize higher strength
during shearing, and to dissipate excess pore pressures more rapidly than sands. However, there
are case histories indicating that liquefaction has occurred in loose gravelly soils (Seed, 1968;
Ishihara, 1985; Andrus, et al., 1991) during severe ground shaking or when the gravel layer is
confined by an impervious layer. The space between the two curves farthest to the left reflects
the influence of fines in decreasing the tendency of sands to densify during seismic shearing.
Fines with cohesion and cementation tend to make sand particles more difficult to liquefy or to
seek denser arrangements. However, nonplastic fines such as rock flour, silt and tailing slimes
may not have as much of this restraining effect. Ishihara (1985) stated that clay- or silt-size
materials having a low plasticity index value will exhibit physical characteristics resembling
those of cohesionless soils, and thus have a high degree of potential for liquefaction. Walker
and Steward (1989), based on their extensive dynamic tests on silts, have also concluded that
nonplastic and low plasticity silts, despite having their grain size distribution curves outside of
Tsuchida's boundaries for soils susceptible to liquefaction, have a potential for liquefaction
similar to that of sands and that increased plasticity will reduce the level of pore pressure
response in silts. This reduction, however, is not significant enough to resist liquefaction for
soils with plasticity indices of 5 or less.

EB 15-025 Page 25 of 62
Figure 9 Limits in the gradation curves separating liquefiable and nonliquefiable soils
(Tsuchida, 1970)

EB 15-025 Page 26 of 62
Even though major slide movements during earthquakes have occurred in clay deposits, they
are commonly considered to be nonliquefiable during earthquakes in the sense that an extensive
zone of clay soil is converted into a heavy fluid condition. However, it is believed that quick
clays may lose most of their strength after strong shaking and that other types of clay may lose a
proportion of their strength resulting in slope failures. Frequently, landslides in clay deposits
containing sand or silt lenses are initially triggered by the liquefaction of these lenses before any
significant strength loss occurs in the clay. This has been supported by laboratory test results
which indicate that the strain required to liquefy sands is considerably smaller than the strain
required to overcome the peak strength of cohesive soils (Seed, 1968; Poulos, Robinsky and
Keller, 1985).
There is also ample evidence to show that uniformly graded materials, generally having a
uniformity coefficient smaller than five, are more susceptible to liquefaction than well-graded
materials (Ross, et al., 1969; Lee and Fitton, 1969) and that for uniformly graded soils, fine
sands tend to liquefy more easily than coarse sands, gravelly soils, silts or clay.
2.2.2 Relative Density
Laboratory test results and field case histories indicate that, for a given soil, initial void ratio or
relative density is one of the most important factors controlling liquefaction. Liquefaction
occurs principally in saturated clean sands and silty sands having a relative density less than
50%. For dense sands, however, their tendency to dilate during cyclic shearing will generate
negative pore water pressures and increase their resistance to shear stress. The lower limit of
relative density beyond which liquefaction will not occur is about 75%.
2.2.3 Earthquake Loading Characteristics
The vulnerability of any cohesionless soil to liquefaction during an earthquake depends on the
magnitude and number of cycles of stresses or strains induced in it by the earthquake shaking.
These in turn are related to the intensity, predominant frequency, and duration of ground
shaking.
2.2.4 Vertical Effective Stress and Overconsolidation
It is well known that an increase in the effective vertical stress increases the bearing capacity
and shear strength of soil, and thereby increases the shear stress required to cause liquefaction
and decreases the potential for liquefaction. From field observations it has been concluded by a
number of investigators that saturated sands located deeper than 50 to 60 feet (15 to 18 m) are
not likely to liquefy. These depths are in general agreement with Kishida (1969) who states that
a saturated sandy soil is not liquefiable if the value of the effective overburden pressure exceeds
2 tsf (190 kN/m2).
Both theory and experimental data show that for a given soil a higher overconsolidation ratio
leads to higher lateral earth pressure at rest and thereby increases the shear stress ratio required
to cause liquefaction.
2.2.5 Age and Origin of the Soils
Natural deposits of alluvial and fluvial origins generally have soil grains in the state of loose
packing. These deposits are young, weak and free from added strength due to cementation and
EB 15-025 Page 27 of 62
aging. Youd and Hoose (1977) stated that, as a rule of thumb, alluvial deposits older than late
Pleistocene (10,000- 130,000 years) are unlikely to liquify except under severe earthquake
loading conditions, while late Holocene deposits (1,000 years or less) are most likely to liquefy,
and earlier Holocene (1,000-10,000 years) deposits are moderately liquefiable.
2.2.6 Seismic Strain History
It has been demonstrated from laboratory test results that prior seismic strain history can
significantly affect the resistance of soils to liquefaction (Finn et al., 1970; Seed et al., 1977;
Singh et al., 1980). Low levels of prior seismic strain history, as a result of a series of previous
shakings producing low levels of excess pore pressure, can significantly increase soil resistance
to pore pressure buildup during subsequent cyclic loading. This increased resistance may result
from uniform densification of the soil or from better interlocking of the particles in the original
structure due to elimination of small local instabilities at the contact points without any general
structural rearrangement taking place. Large strains, however, associated with large pore
pressure generation and conditions of full liquefaction can develop weak zones in the soil due to
uneven densification and redistribution of water content (National Research Council, 1985;
Whitman, 1985), and thus lower the resistance of the soil to pore pressure generation during
subsequent cyclic loading.
2.2.7 Degree of Saturation
Liquefaction will not occur in dry soils. Only settlement, as a result of densification during
shaking, may be of some concern. Very little is known on the liquefaction potential of partially
saturated sands. Available laboratory test results (Sherif et al., 1977) show liquefaction
resistance for soils increases with decreasing degree of saturation, and that sand samples with
low degree of saturation can become liquefied only under severe and long duration of
earthquake shaking.
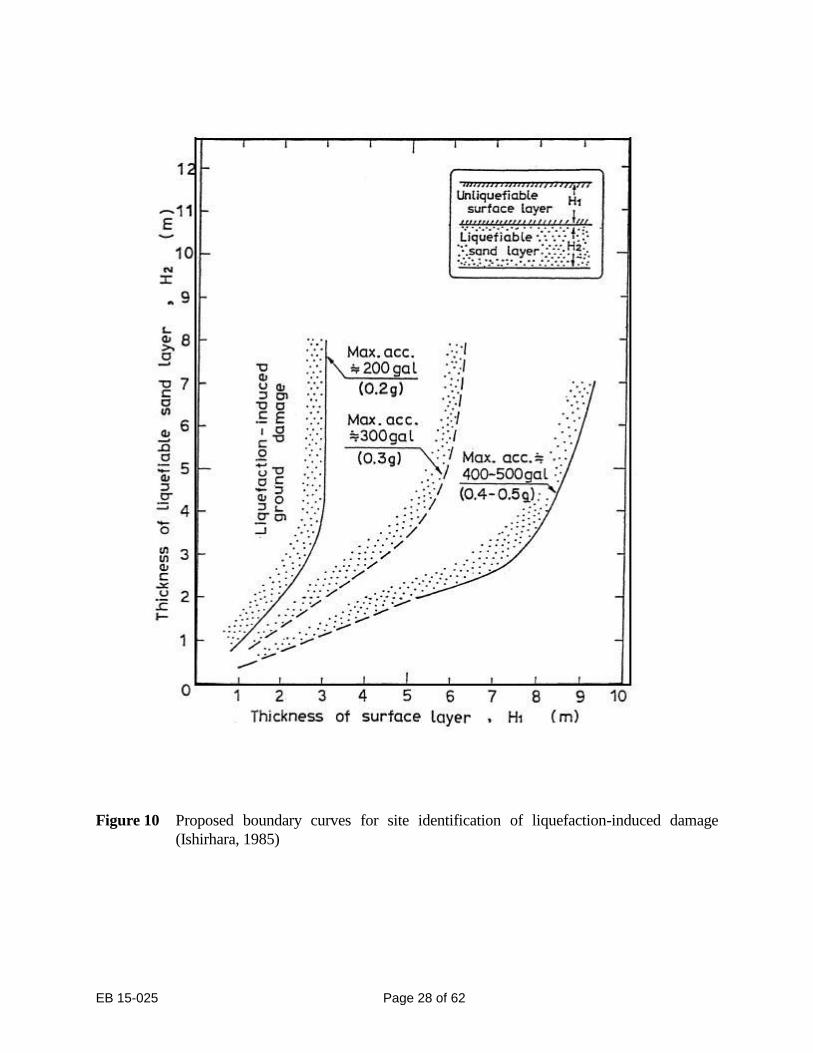
2.2.8 Thickness of Sand Layer
In order to induce extensive damage at level ground surface from liquefaction, the liquefied soil
layer must be thick enough so that the resulting uplift pressure and amount of water expelled
from the liquefied layer can result in ground rupture such as sand boiling and fissuring
(Ishihara, 1985; Dobry, 1989). If the liquefied sand layer is thin and buried within a soil profile,
the presence of a nonliquefiable surface layer may prevent the effects of the at-depth
liquefaction from reaching the surface. Ishihara (1985) has set up a criterion to stipulate a
threshold value for the thickness of a nonliquefiable surface layer to avoid ground damage due
to liquefaction, as shown in Figure 10. Although this figure is believed to be speculative and
should not be used for design purposes, it provides initial guidance in this matter for sites
having a buried liquefiable sand layer with a standard penetration resistance of less than
10 blows per foot (0.3 m). It should also be noted that even though the thickness of a
nonliquefiable surface layer exceeds the threshold thickness shown in the figure, the ground
surface may still experience some settlement which may be undesirable for certain settlement-
sensitive structures. Like all of the empirical curves shown in this report, this figure, based on
just three case histories, may need to be modified as more data become available.
EB 15-025 Page 28 of 62
Figure 10 Proposed boundary curves for site identification of liquefaction-induced damage
(Ishirhara, 1985)
EB 15-025 Page 29 of 62
3. EVALUATION OF LIQUEFACTION POTENTIAL
3.1 Introduction
Various procedures for evaluating the liquefaction potential of saturated soil deposits have been
proposed in the past twenty years. These procedures, requiring various degrees of laboratory and/or
in-situ testing, may be classified into the following categories:
1. Mapping Based on Geological Criteria:
A method for constructing liquefaction potential maps was developed by Youd and
Perkins (1978), relating geological age, origin of sediments and site distance to the potential
earthquake epicenter. The proposed criteria are widely used for general assessment of
regional liquefaction hazards (Youd et al., 1978; Anderson et al., 1982; Tinsley et al., 1985).
2. Empirical Correlations Between In-Situ Characteristics and Observed Performance
Soil liquefaction characteristics determined by field performance have been correlated with
a variety of soil parameters such as
a. Standard Penetration Test (SPT) Resistance (Seed and Idriss, 1971; Seed, 1979; Seed
et al., 1983, 1985; Ishihara, 1985)
b. Cone Penetration Resistance (Douglas et al., 1981; Robertson et al., 1983; Kovas et al.,
1984; Baldi et al., 1985; Robertson and Campanella, 1985; Seed et al., 1985;)
c. Shear Wave Velocity (Dobry et al., 1981; Campanella and Robertson, 1984;
Bierschwale and Stokoe, 1984)
d. Resistivity and Capacitance of Soil (Arulanandan, 1977; Arulmoli et al., 1985)
3. Threshold Shear Strain Concept
There exists for a given cohesionless soil a threshold shear strain, typically 0.01 percent. If
the peak shear strain induced by an earthquake does not exceed this strain, the shaking will
not cause a buildup of excess pore pressure regardless of the number of loading cycles, and,
therefore, liquefaction cannot occur (Dobry et al., 1980). The peak shear strain caused by
an earthquake ground motion may be estimated with reasonable accuracy using the
following equation:
r = 1.2 a Z / Vs2 Eq (3)
where r equals strain, a equals peak acceleration at ground surface, Z equals depth, and
Vs equals shear wave velocity.
4. Liquefaction Probability
Probabilistic approaches to liquefaction analyses have been proposed by several researchers
(Yegian and Whitman, 1978; Haldar and Tang, 1979; Fardis and Veneziano, 1982;
Chameau and Clough, 1983; Liao et al., 1988). However, the usefulness of this approach
depends on the soundness of the assumed mechanistic models and on the feasibility of
quantifying uncertainty for model parameters.
5. Steady-State Strength Concept for Analyzing Stability of Embankments and Slopes
Against Flow Failures
The steady-state strength concept, founded on Casagrande's "Critical Void Ratio Theory"
EB 15-025 Page 30 of 62
(Casagrande, 1936), has been developed to evaluate the susceptibility of an embankment or
slope to a liquefaction flow failure (Castro, 1969; Poulos, 1981; Castro et al., 1982; Poulos,
Castro and France, 1985). Castro and Poulos have shown that even after liquefaction, many
sands retain a strength which may be appreciable. Seed and his co-workers use the term
residual strength to refer to the strength of liquefied materials. In this report, the terms
steady-state and residual strengths are used interchangeably.
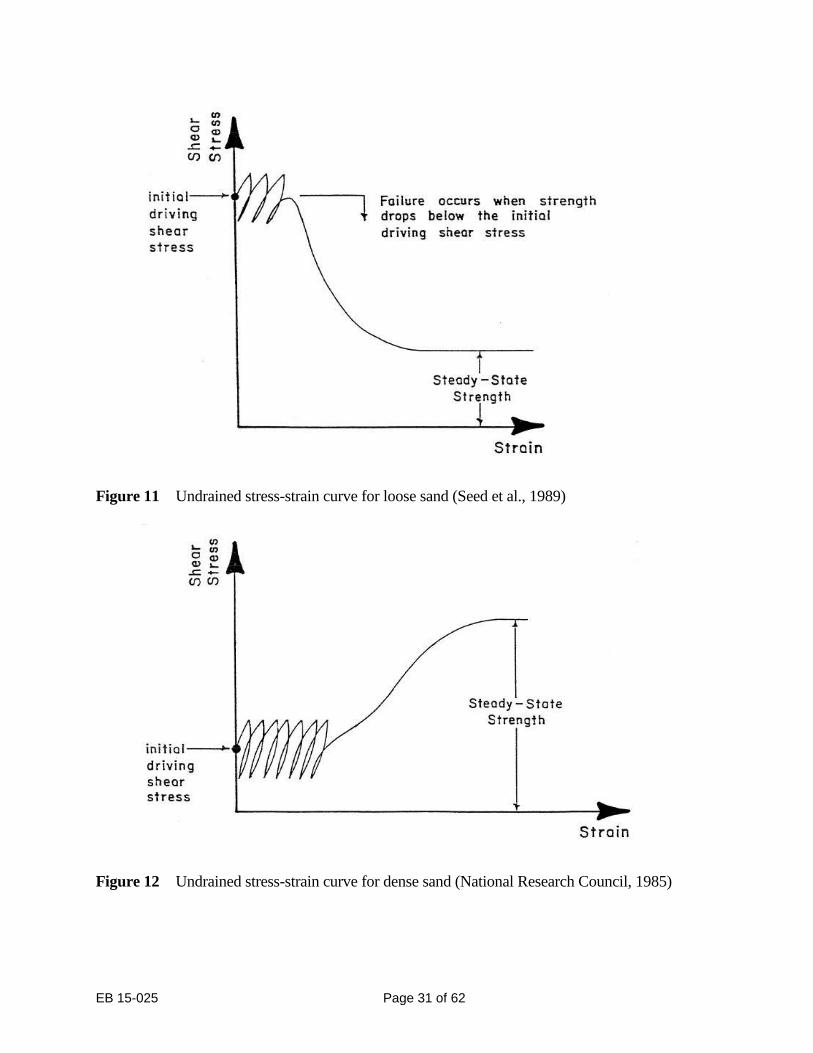
If the sand beneath an embankment or slope is very loose and has the type of stress-strain
behavior shown in Figure 11, a seismic loading of sufficient intensity and duration can
strain the soil over the peak of the stress-strain curve and trigger initial liquefaction. Once
this condition is reached, creep and progressive failure will cause the shear resistance of the
soil to continuously decline until the steady state or residual strength is reached. If the
undrained steady-state strength is smaller than the initial shear stress required for static
equilibrium, the slope will be destabilized and a flow failure will occur. Therefore, when a
flow failure occurs, the reduced strength need not be zero, and, conversely, even a very low
reduced strength may not lead to a flow failure if other soils along the potential failure
surface are strong enough to prevent a loss of stability.
EB 15-025 Page 31 of 62
Figure 11 Undrained stress-strain curve for loose sand (Seed et al., 1989)
Figure 12 Undrained stress-strain curve for dense sand (National Research Council, 1985)
EB 15-025 Page 32 of 62
During earthquake shaking, dense sands have a tendency to dilate and generate negative pore
water pressure. As a result, soil shearing resistance increases until a maximum value is
reached, as shown in Figure 12. At the end of the shaking, the initial static shear stress is still
less than the peak shear resistance. Therefore, slope instability is unlikely to occur in dense
sands under earthquake loading.
The evaluation procedure involves laboratory steady-state strength testing followed by
appropriate conservative corrections to the in-situ void ratio condition taking all relevant
factors into account.
Of all the available methods described above, only two procedures will be summarized in separate
sections below. They are (1) the empirical correlation based on the SPT blow count and field
performance, and (2) a simplified steady-state procedure for analyzing stability of embankments
and slopes against flow failures. These approaches have proved to give the most plausible results
and will be considered by the Bureau as the only acceptable procedures for evaluating the
liquefaction potential of cohesionless soils.
3.2 Evaluation of Liquefaction Potential of Horizontal Ground Using SPT Resistance
3.2.1 Sands and Silty Sands
Investigations based upon in-depth theoretical study and extensive review of field performance
of sands and silty sands during actual earthquakes in the western United States, Alaska, South
America, Japan and China, show that a high correlation exists between soil liquefaction
resistance under earthquake shaking and soil SPT resistance in level ground conditions (Seed
et al., 1983, 1985; Tokimatsu and Yoshimi, 1983). Based on this correlation, a design
procedure for evaluating the liquefaction potential of level ground has been developed for the
Bureau as follows:
a. Establish the soil profiles and identify the potentially liquefiable layers by comparing soil
gradation curves with Figure 9. For projects involving only ordinary bridges, use a design
earthquake magnitude of 6.00 for sites located in Zones A, B or C of Figure 2. A
magnitude of 5.25 is used elsewhere in the State. However, a special seismic study may be
required to determine the design earthquake magnitude for bridges providing critical
services.
b. Compute the average induced cyclic shear stress ratio due to earthquake shaking for each
potentially liquefiable layer using the following relationship (Seed and Idriss, 1971):
τav
/ σo' = 0.65 ∙ (a
max / g) ∙ (σ
o / σ
o') ∙ Yd Eq (4)
Where τav
/ σo' = earthquake-induced cyclic shear stress ratio
τav
= average peak shear stress
amax
= maximum horizontal ground acceleration
σo = total overburden pressure at depth under consideration

EB 15-025 Page 33 of 62
σo' = effective overburden pressure at depth under consideration
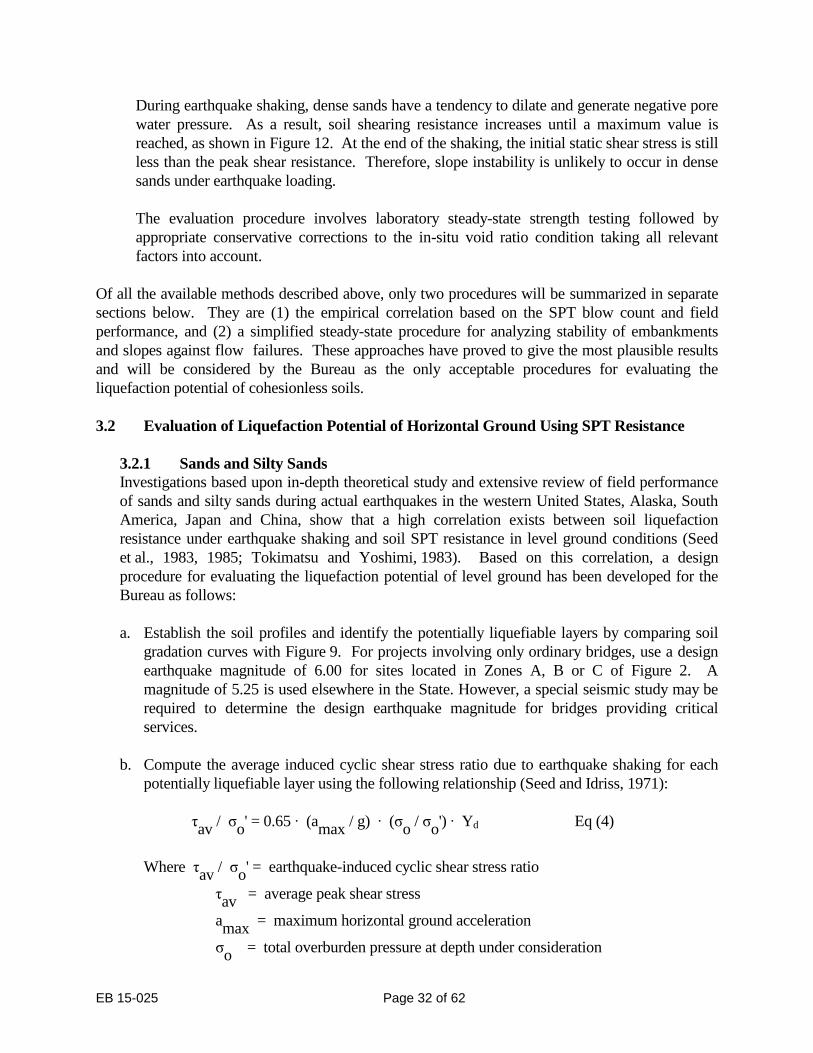
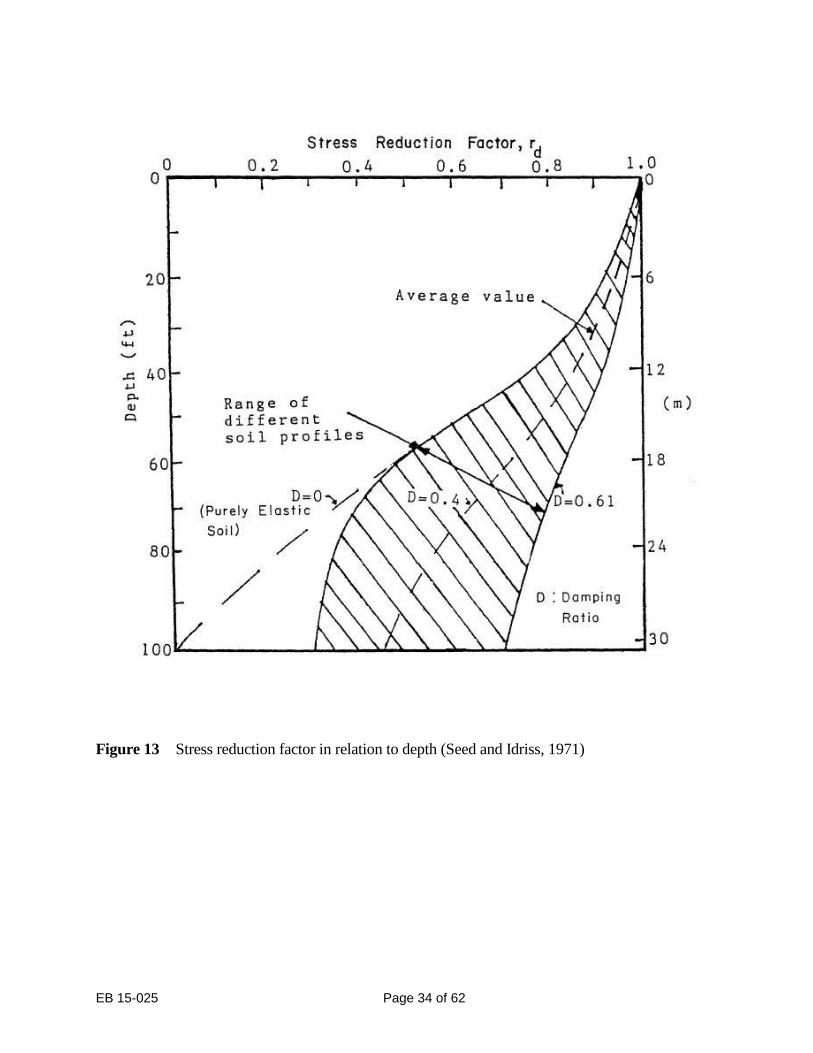
Yd = a stress reduction factor which decreases linearly from a value of 1 at the
ground surface to a value of 0.9 at a depth of 35 ft. (10.67 m), use Figure
13 for depths greater than 35 ft. (10.67 m)
g = acceleration due to gravity
For ordinary bridges founded on deposits of cohesionless soils and stiff soils, choose a
maximum ground acceleration from Figures 3 and 5. However, for projects involving soft
soils and for bridges providing critical services, a special seismic site response study may be
required to determine the design maximum ground acceleration.
c. Correct the measured New York State penetration resistance value, NNY, to (N1)60 using the
following formula:
(N1)60 = 1.29 CN ERm NNY /60 Eq (5)
Where (N1)60= normalized standard penetration resistance under an effective overburden
pressure of 1 tsf (95.76 kN/m2) for an SPT test performed with a hammer
providing 60% of the theoretical free-fall energy, in accordance with the
conditions listed in Table 3
CN = an overburden correction factor, equal to (σo'/2000)
-1/2 but not greater than
2.0, where σo' is in psf, or (σ
o'/95.76)
-1/2 where σ
o' is in kN/m
2 (Liao and
Whitman, 1985)
ERm = energy ratio defined as the percent of theoretical free fall energy delivered to
the drill rods. A summary of the average energy ratios used in different
countries using different types of hammers and hammer release mechanisms
is shown in Table 4
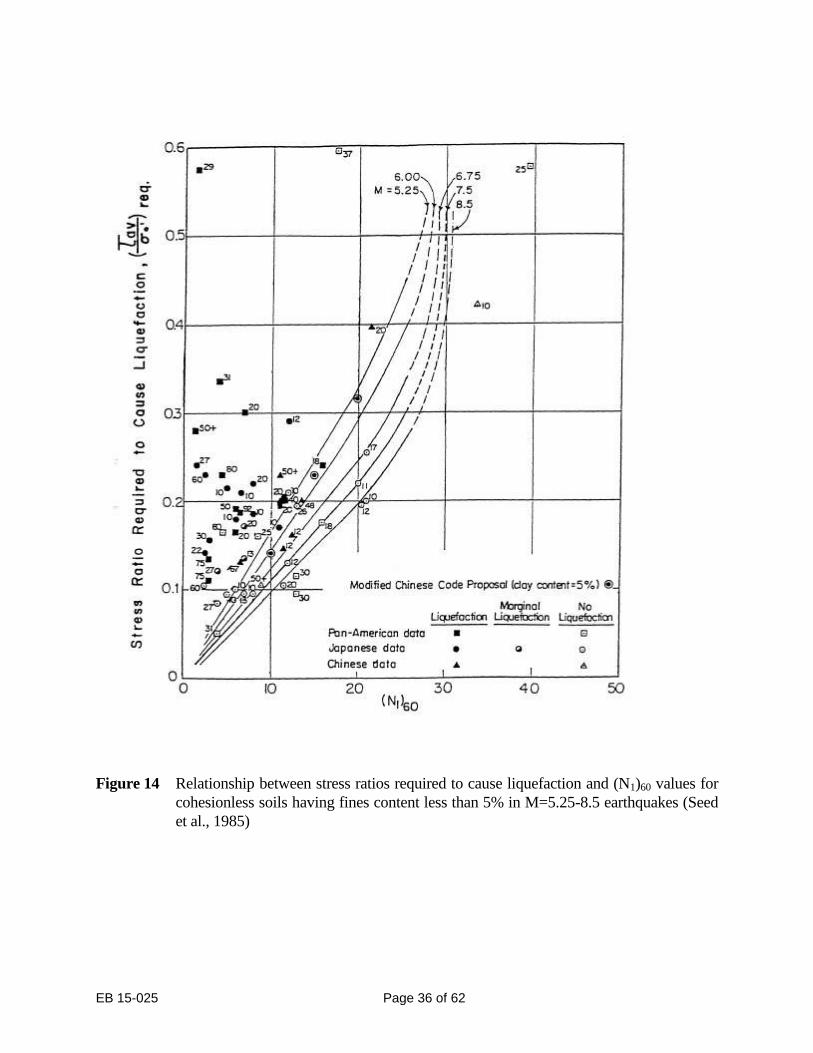
d. For the design earthquake magnitude with given values of fines content of soil and (N1)60,
read off the shear stress ratio required to cause liquefaction from charts shown in Figures
14 through 16. Fines content is defined as the percent of soil particles passing the No. 200
(75 m) sieve. If the fines content of soil is not greater than 30%, skip Step e and go to Step
f.
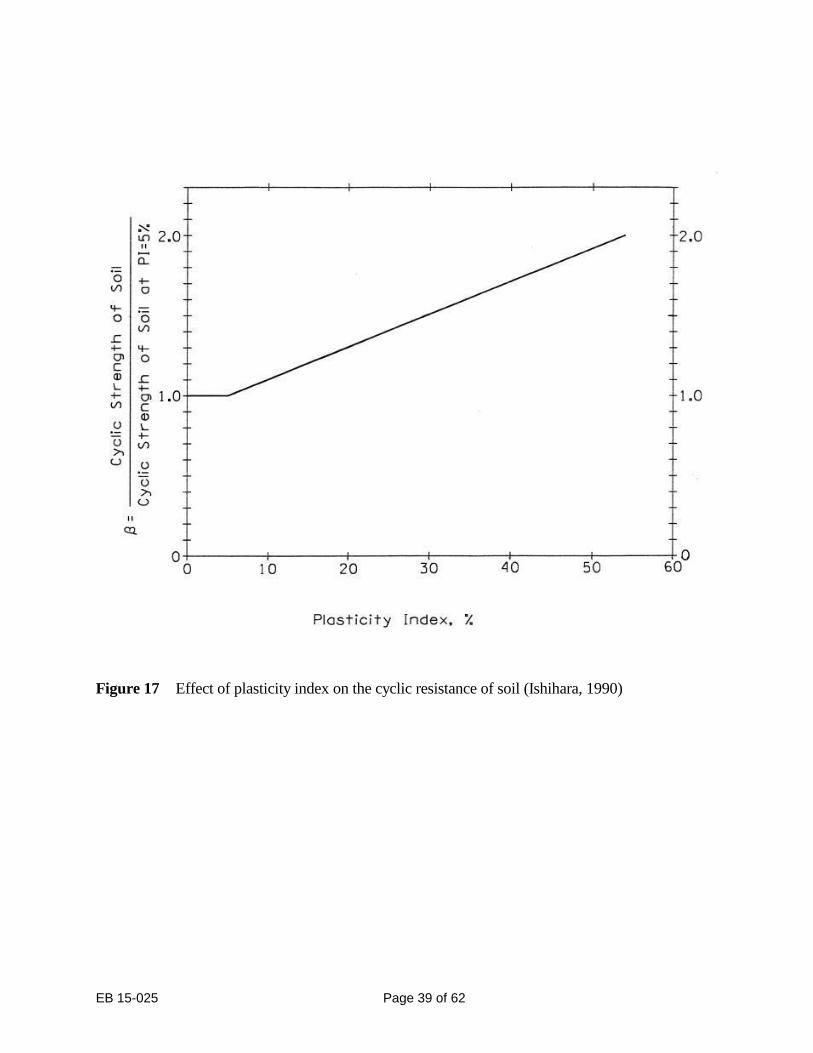
e. If the fines content of soil is greater than 30%, a correction may be made to the shear stress
ratio required to cause liquefaction depending on the plasticity index of soil. If the plasticity
index of the soil is greater than 5%, multiply the shear stress ratio required to cause
liquefaction by a correlation coefficient ß from Figure 17. For soil with plasticity index not
greater than 5%, ß equals one and no correction to the resisting shear stress ratio is needed.
The correlation coefficient ß is defined as the ratio between the cyclic strength of soil and
the cyclic strength of soil with a plasticity index of 5%.
f. Calculate the safety factor against liquefaction, which is defined as the ratio between the
shear stress ratio required to cause liquefaction as obtained from Steps d and e and the
induced shear stress ratio computed in Step b. The minimum required factor of safety
against liquefaction is 1.1.
The design procedure is demonstrated with a sample problem in Appendix B.
EB 15-025 Page 34 of 62
Figure 13 Stress reduction factor in relation to depth (Seed and Idriss, 1971)
EB 15-025 Page 35 of 62
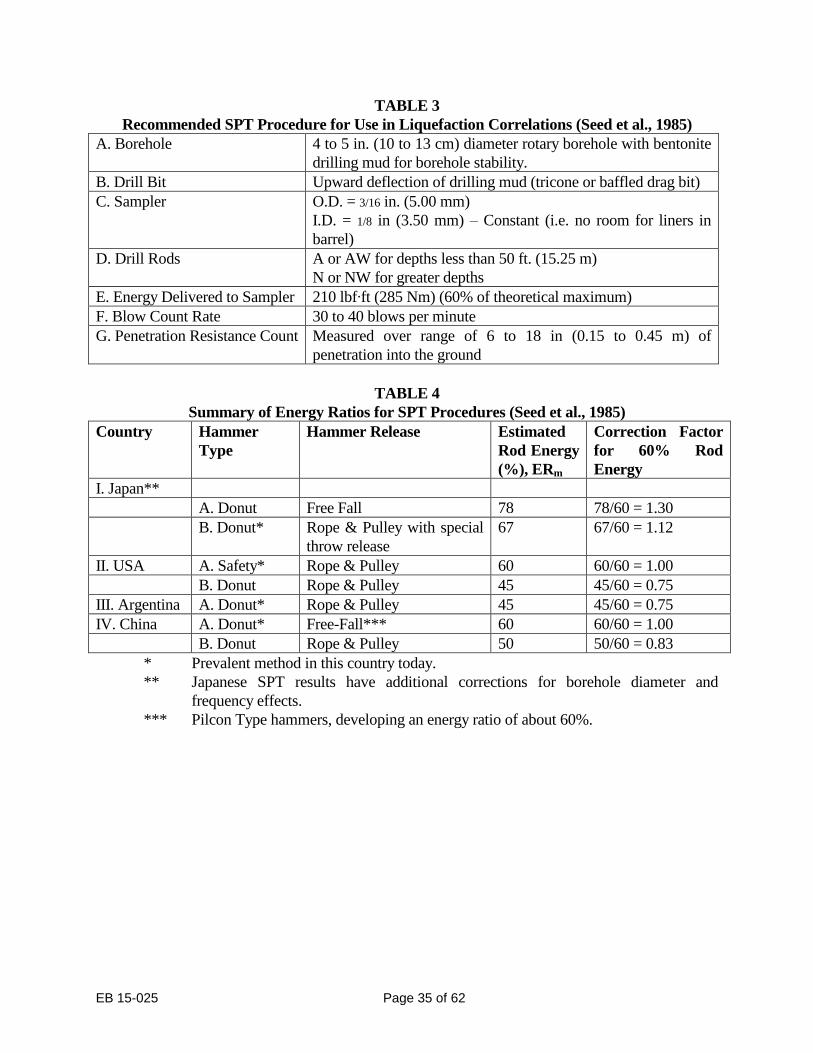
TABLE 3
Recommended SPT Procedure for Use in Liquefaction Correlations (Seed et al., 1985)
A. Borehole 4 to 5 in. (10 to 13 cm) diameter rotary borehole with bentonite
drilling mud for borehole stability.
B. Drill Bit Upward deflection of drilling mud (tricone or baffled drag bit)
C. Sampler O.D. = 3/16 in. (5.00 mm)
I.D. = 1/8 in (3.50 mm) – Constant (i.e. no room for liners in
barrel)
D. Drill Rods A or AW for depths less than 50 ft. (15.25 m)
N or NW for greater depths
E. Energy Delivered to Sampler 210 lbf∙ft (285 Nm) (60% of theoretical maximum)
F. Blow Count Rate 30 to 40 blows per minute
G. Penetration Resistance Count Measured over range of 6 to 18 in (0.15 to 0.45 m) of
penetration into the ground
TABLE 4
Summary of Energy Ratios for SPT Procedures (Seed et al., 1985)
Country Hammer
Type
Hammer Release Estimated
Rod Energy
(%), ERm
Correction Factor
for 60% Rod
Energy
I. Japan**
A. Donut Free Fall 78 78/60 = 1.30
B. Donut* Rope & Pulley with special
throw release
67 67/60 = 1.12
II. USA A. Safety* Rope & Pulley 60 60/60 = 1.00
B. Donut Rope & Pulley 45 45/60 = 0.75
III. Argentina A. Donut* Rope & Pulley 45 45/60 = 0.75
IV. China A. Donut* Free-Fall*** 60 60/60 = 1.00
B. Donut Rope & Pulley 50 50/60 = 0.83
* Prevalent method in this country today.
** Japanese SPT results have additional corrections for borehole diameter and
frequency effects.
*** Pilcon Type hammers, developing an energy ratio of about 60%.
EB 15-025 Page 36 of 62
Figure 14 Relationship between stress ratios required to cause liquefaction and (N1)60 values for
cohesionless soils having fines content less than 5% in M=5.25-8.5 earthquakes (Seed
et al., 1985)
EB 15-025 Page 37 of 62
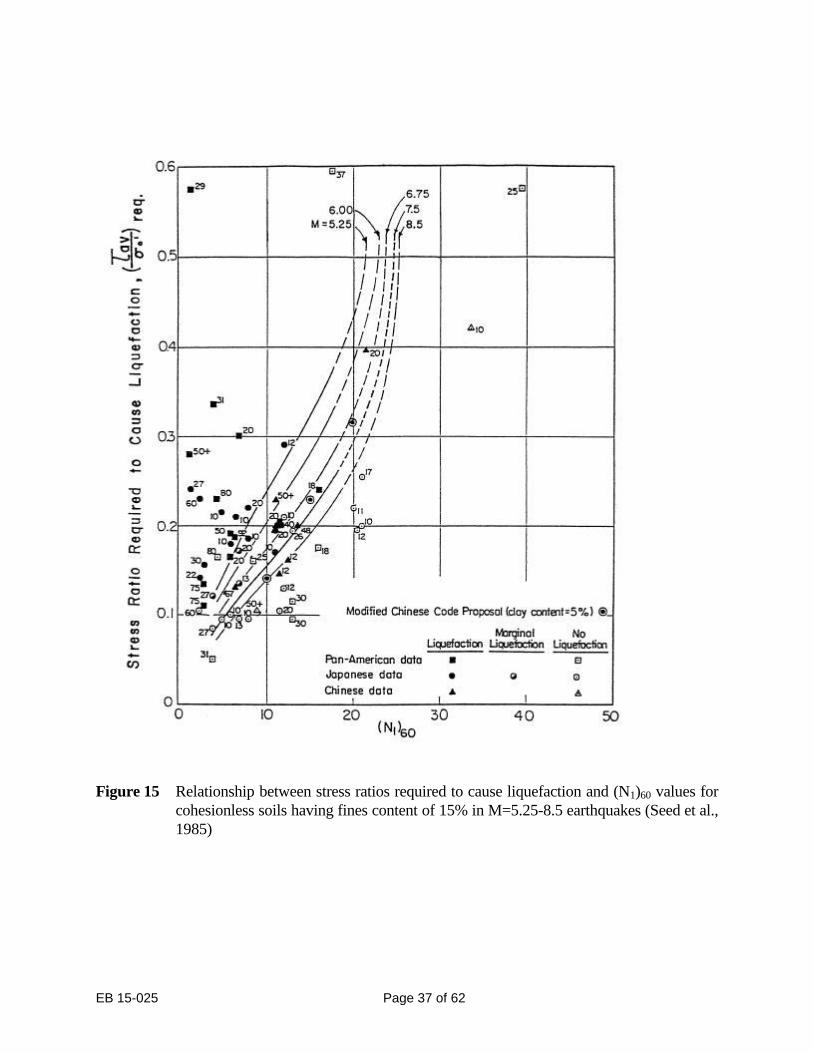
Figure 15 Relationship between stress ratios required to cause liquefaction and (N1)60 values for
cohesionless soils having fines content of 15% in M=5.25-8.5 earthquakes (Seed et al.,
1985)
EB 15-025 Page 38 of 62
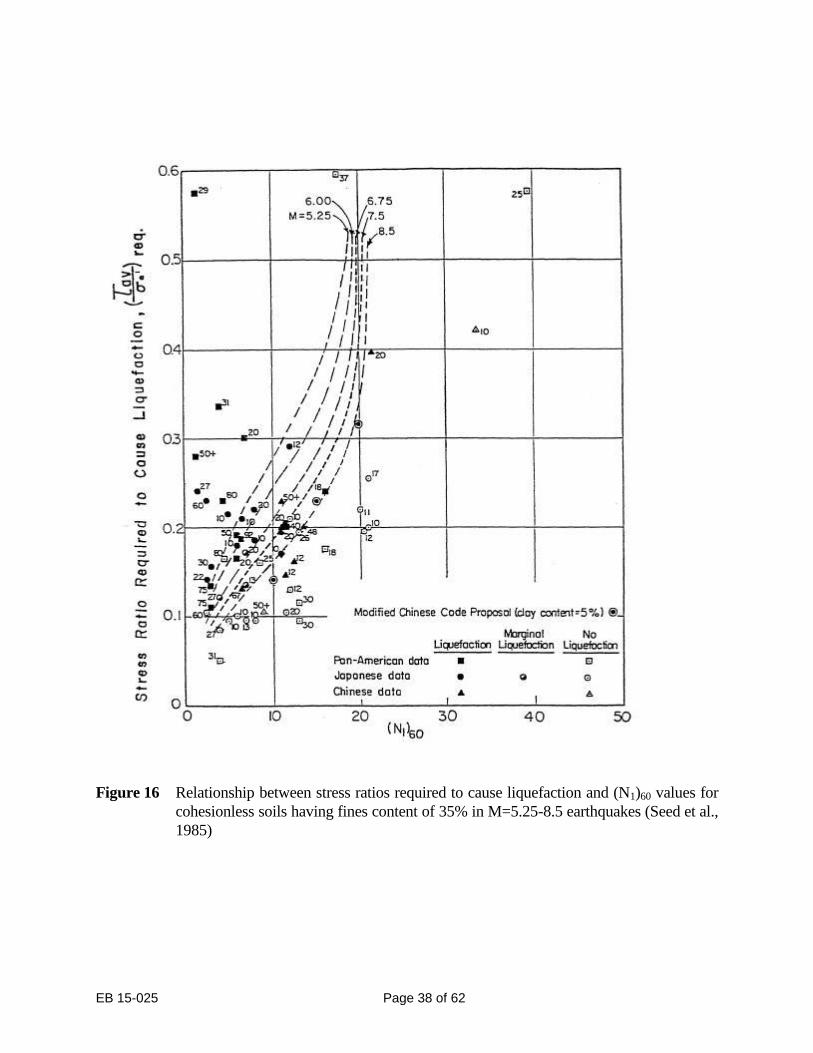
Figure 16 Relationship between stress ratios required to cause liquefaction and (N1)60 values for
cohesionless soils having fines content of 35% in M=5.25-8.5 earthquakes (Seed et al.,
1985)
EB 15-025 Page 39 of 62
Figure 17 Effect of plasticity index on the cyclic resistance of soil (Ishihara, 1990)
EB 15-025 Page 40 of 62
3.2.2 Gravelly Soils
Little information is available on the characteristic and field performance of gravelly soils such
as gravelly sands and sandy gravels. As a result, there is no well accepted procedure for
evaluating their resistance to liquefaction. However, for preliminary evaluation purposes, the
following procedure may be used until a predictive procedure for these soils is available:
a. Determine the soil particle size at 20 percent finer by weight, D20. If D20 > No. 35
(0.6 mm), no liquefaction is expected to develop, provided there are no overlying or
intervening layers of low permeability soils to inhibit drainage.
b. If D20 No. 35 (0.6 mm), follow Step b of Section 3.2.1 to compute the average induced
cyclic shear stress ratio.
c. Follow Step c of Section 3.2.1 to obtain either the average (N1)60 value of sand layers at
sites in the vicinity of the gravelly soil deposit in question is considered to have been
formed under identical geological conditions or the (N1)60 value of a sand layer, in the same
drill hole, immediately above or below the gravelly layer.
d. Follow Steps d and e of Section 3.2.1 to obtain the shear stress ratio required to cause
liquefaction.
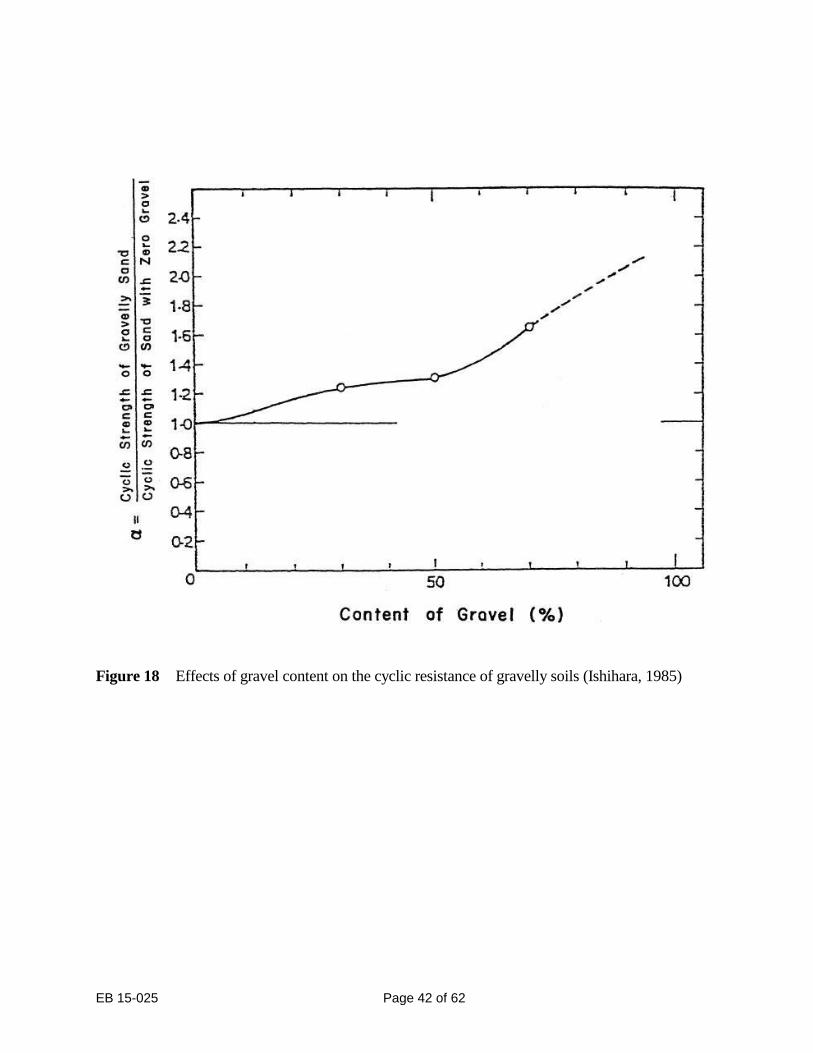
e. Multiply the shear stress ratio required to cause liquefaction by a correlation coefficient α
from Figure 18 to obtain the corrected shear stress ratio required to cause liquefaction for
gravelly soils. The correlation coefficient α depends on the gravel content of soil and is
defined as the ratio between the cyclic strength of gravelly sand and the cyclic strength of
sand with zero percent of gravel.
f. Calculate the safety factor against liquefaction, which is defined as the ratio between the
corrected shear stress ratio required to cause liquefaction as obtained from Step d or e and
the induced shear stress ratio computed in Step b.
3.3 A Simplified Steady-State Strength Procedure for Analyzing Stability of
Embankments and Slopes Against Flow Failures
While the steady-state strength approach is theoretically well founded and has drawn wide
attention in the geotechnical profession, the evaluation procedure is still in the developmental
stage with some uncertainties remaining (Konrad, 1990; Vasquez-Herrera and Dobry, 1989;
Seed et al., 1989; Kramer, 1989; Riemer et al., 1990). In view of these, Seed (1987), De Alba
et al. (1988) and Seed et al. (1989), based on investigations of a number of case histories of
embankment slope failures involving liquified materials, have developed a correlation between
the residual strength or steady-state strength of the liquefied sands and the equivalent clean sand
(N1)60 values for the soils involved, as shown in Figure 19. A simplified procedure using this
empirical curve for stability against flow failures can be summarized in the following steps:
a. Evaluate the liquefaction potential of each cohesionless soil layer in question in accordance
with the procedure as detailed in Section 3.2.1. If the analysis indicates vulnerability to
liquefaction, potential stability problems due to flow failure exist. Follow the next step and
EB 15-025 Page 41 of 62
complete the stability analysis. If the soil layers are nonliquefiable, no stability problem is
anticipated, and stop the analysis.
b. For liquefied sands having more than 5 percent of fines, correct the penetration blow count
to an equivalent clean sand blow count by adding an increment, Δ(N1)60, to the (N1)60 value
obtained from Step c of Section 3.2.1 (see Figure 20). This is due to the fact that, even for
equal conditions of pore pressure generation-resistance or relative density, the penetration
resistance of silty sands and sandy silts is lower than that for clean sands.
c. For the equivalent clean sand (N1)60, read off the liquefied undrained residual strength of
sands from Figure 19.
d. Assign the appropriate shear strength parameters to other soil layers: peak drained strengths
for nonliquefiable cohesionless soils, peak undrained shear strength for non-sensitive and
medium-sensitive plastic soils (sensitivity index less than four), and residual shear strengths
for sensitive plastic soils (sensitivity index greater than four).
e. Perform a static slope stability analysis to determine the factor of safety against flow failure.
If it is greater than 1, the slope is assumed to be invulnerable to flow slide.
The use of the procedure is illustrated by a sample problem in Appendix C.
EB 15-025 Page 42 of 62
Figure 18 Effects of gravel content on the cyclic resistance of gravelly soils (Ishihara, 1985)
EB 15-025 Page 43 of 62
Figure 19 Relationship between residual strength and (N1)60 for sands (Seed et al., 1985)
Figure 20 (N1)60 value correction versus fines content for cohesionless soils (Seed et al., 1985)
EB 15-025 Page 44 of 62
3.4 Estimation of Earthquake-Induced Settlements in Sands and Sandy Silts
Liquefaction of saturated loose cohesionless soils is always accompanied by ground settlements as
the excess pore pressures generated during the earthquake shaking dissipate. The settlement is
typically completed within seconds to about one day after the shaking depending on the
characteristics of the soil and the length of the drainage path. Post liquefaction settlements as high
as 2-3% of the sand layer thickness for loose to medium sands and more than 5% for very loose
sands have been reported.
Even though the factor of safety against liquefaction is greater than 1.1 and liquefaction may not
occur in cohesionless soil deposits, some pore pressure may be generated and partial liquefaction
may occur in these deposits during the earthquake shaking. The dissipation of the pore pressure
may result in small amounts of settlement. If the factor of safety against liquefaction is greater than
1.25, the effect of settlement due to partial liquefaction is likely to be insignificant for structures and
no settlement analysis is needed. If the factor of safety is less than 1.25, perform a settlement
analysis following the procedure described below.
Tokimatsu and Seed (1987) compiled laboratory test data from studies reported by other researchers
on the pre-liquefaction and post-liquefaction volumetric strain behavior of saturated clean sands,
and concluded that the primary factors controlling the settlement in saturated sands are the cyclic
stress ratio and the maximum shear strain induced by the earthquake shaking. Based upon these
studies and field observations, they have established a chart, as shown in Figure 21, for an M=7.5
magnitude earthquake, which indicates that the induced volumetric strain is a function of the cyclic
stress ratio and (N1)60. This figure is applicable only for sands that have no more than 5% in fines.
The simplified procedure for estimating the amount of settlement in clean sands may be described
as follows:
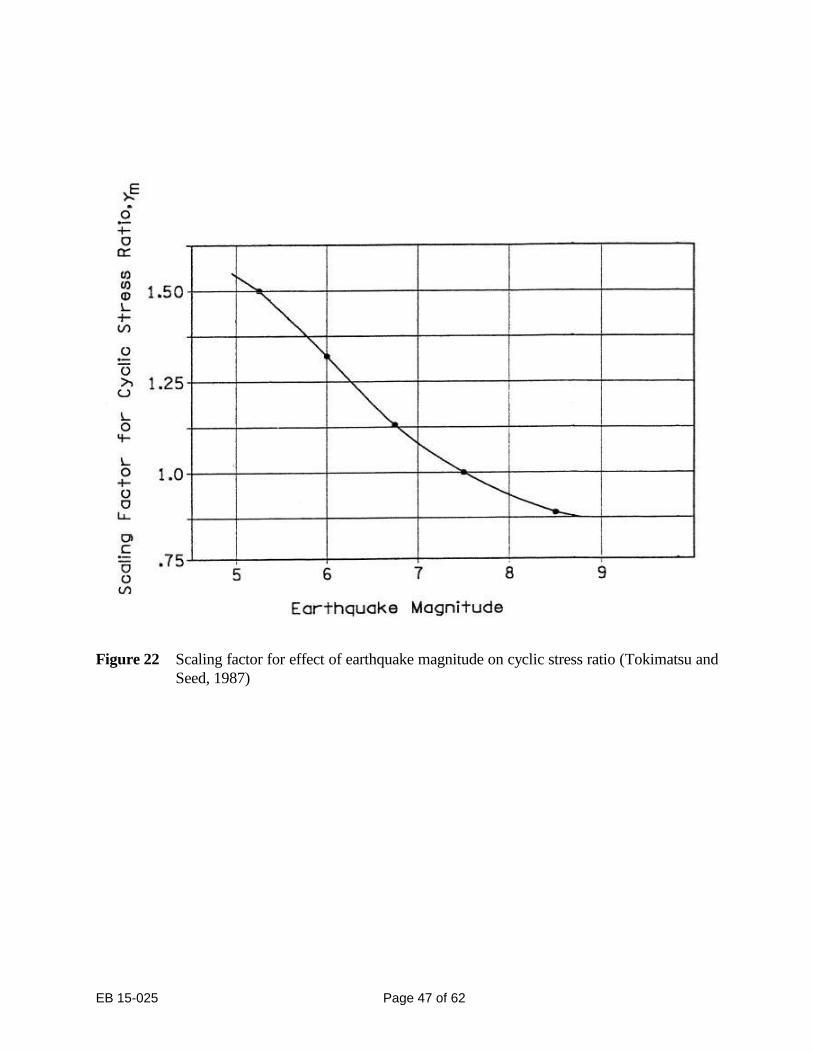
1. For each potentially liquefiable layer as identified by the procedure stated in Section 3.2.1,
transfer the value of the cyclic stress ratio induced at the design earthquake magnitude to the
equivalent cyclic stress ratio value for an M=7.5 event using the following relationship:
(τav
/ σo' ) induced by an M=7.5 earthquake = (τ
av / σ
o' ) induced by an M=design magnitude earthquake ∙ (1/γ
m) Eq(6)
where γm
is the correction factor that has the values shown in Figure 22.
2. With the calculated values of (N1)60 and τav
/σo' induced at M=7.5, estimate amount of
volumetric strain, εv, from Figure 21.
3. The total liquefaction induced settlement can be obtained by summing up the contributions
of εvH of all potentially liquefiable soil layers, where H is the layer thickness.
No design chart is currently available for estimating the settlement in silty sands and silts.
However, in a case study on the geotechnical aspects of the Loma Prieta earthquake by O'Rourke et
al. (1991), it was found that using Figure 21 along with the aforementioned procedure
overestimated the settlements which occurred in the silty sand fills in San Francisco during this
EB 15-025 Page 45 of 62
earthquake by about 100%. For preliminary estimation purposes, the amount of settlement in silty
sands and silts may be assumed to be half of that estimated by the aforementioned procedure for
clean sands. The use of the procedure for estimating seismically induced settlements in liquefied
and partially liquefied sands is illustrated in Appendix B.
Settlements can also occur in loose dry and unsaturated sands due to seismic compaction, but much
smaller than those associated with liquefaction in saturated sands. It was found by Silver and Seed
(1971) that, for a given soil density and number of seismic cycles, settlement of dry and unsaturated
sands due to cyclic loading is not significantly affected by the value of the vertical stress but
depends only on the shear strain amplitude in the soil. The maximum volumetric strain induced by
an M=7.5 earthquake in dry and unsaturated sands is about 0.5%. For practical purposes, it is
assumed that for ordinary bridge projects using a design earthquake magnitude of 6 or less, the
amount of settlement in dry and unsaturated sands is very small and can be neglected in foundation
design. However, for projects involving bridges that provide critical services, and are settlement
sensitive, a special settlement analysis using the procedures proposed by Seed and Silver (1972),
Pyke et al. (1975) and Tokimatsu and Seed (1987) may be performed.
EB 15-025 Page 46 of 62
Figure 21 Relationship between cyclic stress ratio, volumetric strain and (N1)60 (Tokimatsu and
Seed, 1987)
EB 15-025 Page 47 of 62
Figure 22 Scaling factor for effect of earthquake magnitude on cyclic stress ratio (Tokimatsu and
Seed, 1987)
EB 15-025 Page 48 of 62
4. METHODS FOR IMPROVING LIQUEFACTION–PRONE SOILS
4.1 Introduction
Numerous case histories on earthquake activities have documented that liquefaction of cohesionless
soils is one of the major causes for structure damage and human casualties. However, one can
ensure that liquefaction in loose cohesionless soils cannot be triggered if the effective stress of the
soil during shaking is always greater than zero. The development of initial liquefaction in dense
sands is often of no practical significance, since subsequent straining will decrease the amount of
pore pressure generated.
The danger of liquefaction at a site can be significantly reduced or eliminated by (1) dewatering, (2)
increasing the in-situ density and, (3) making provisions to reduce the time required for relieving
the excess pore water pressures generated by earthquake loading. These, except dewatering, may
be best achieved by ground improvement techniques.
4.2 Dewatering
Dewatering increases the effective stress and shear strength and reduces the extent of saturated soil,
all of which increase resistance to liquefaction. However, dewatering a foundation soil is not an
easy task. It may require continuous pumping and construction of slurry trenches or walls. It may
not be cost-effective and may not be feasible in an alluvial deposit.
4.3 Soil Improvement by In-Situ Techniques
If the potentially liquefiable soil layer is located at the ground surface and is not thicker than 11 ½
ft. (3.5 m), the most economical solution may be removal and replacement with properly compacted
nonliquefiable soils. However, for liquefaction-prone soil layers located deeper than 11 ½ ft. (3.5
m) from the ground surface, ground modification techniques such as dynamic compaction,
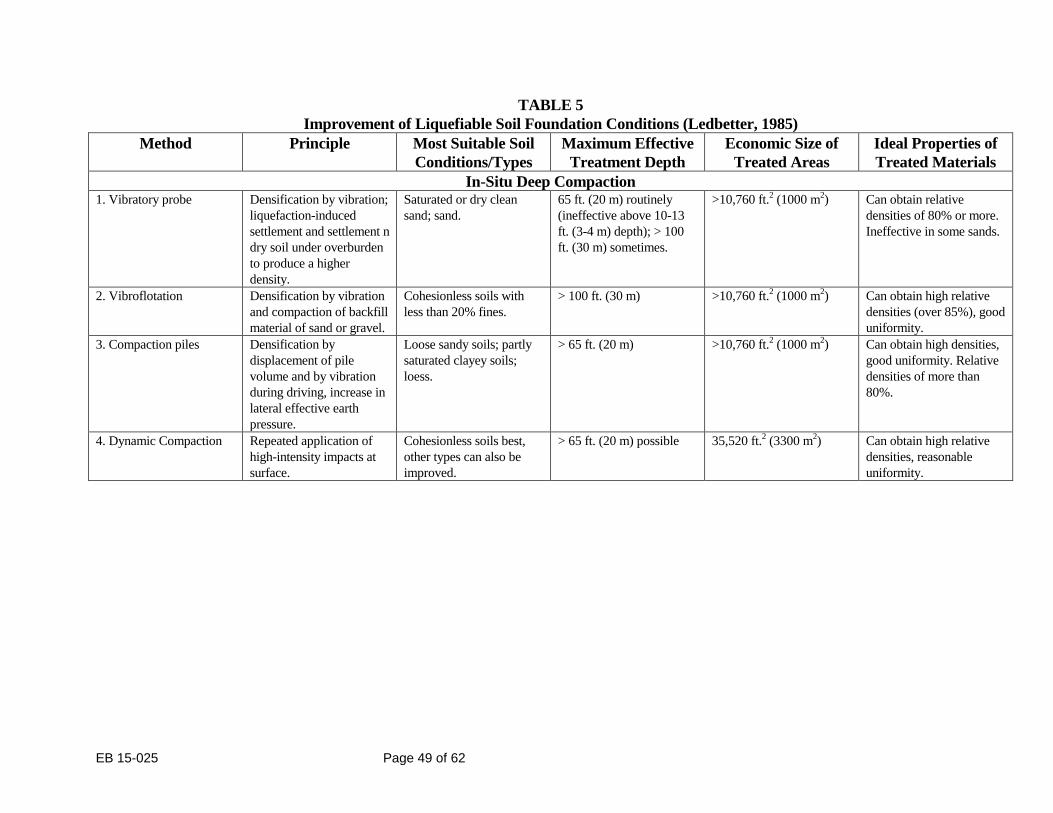
vibroflotation, stone columns and grouting may be the optimal solution. Table 5 summarizes the
technical considerations for 15 methods to improve potentially liquefiable soil foundation
conditions (Ledbetter, 1985). Each method, according to its function, can be classified into at least
one of the following categories:
1. In-situ deep compaction
2. Compression
3. Pore pressure relief
4. Injection and grouting
5. Admixture stabilization
6. Soil reinforcement
It should be noted that two of the most important factors for consideration in choosing an
improvement method are the verifiability of improvement and stabilization, and the absence of
perceivable safety problems during construction.
EB 15-025 Page 49 of 62
TABLE 5
Improvement of Liquefiable Soil Foundation Conditions (Ledbetter, 1985)
Method Principle Most Suitable Soil
Conditions/Types
Maximum Effective
Treatment Depth
Economic Size of
Treated Areas
Ideal Properties of
Treated Materials
In-Situ Deep Compaction 1. Vibratory probe Densification by vibration;
liquefaction-induced
settlement and settlement n
dry soil under overburden
to produce a higher
density.
Saturated or dry clean
sand; sand.
65 ft. (20 m) routinely
(ineffective above 10-13
ft. (3-4 m) depth); > 100
ft. (30 m) sometimes.
>10,760 ft.2 (1000 m
2) Can obtain relative
densities of 80% or more.
Ineffective in some sands.
2. Vibroflotation Densification by vibration
and compaction of backfill
material of sand or gravel.
Cohesionless soils with
less than 20% fines.
> 100 ft. (30 m) >10,760 ft.2 (1000 m
2) Can obtain high relative
densities (over 85%), good
uniformity.
3. Compaction piles Densification by
displacement of pile
volume and by vibration
during driving, increase in
lateral effective earth
pressure.
Loose sandy soils; partly
saturated clayey soils;
loess.
> 65 ft. (20 m) >10,760 ft.2 (1000 m
2) Can obtain high densities,
good uniformity. Relative
densities of more than
80%.
4. Dynamic Compaction Repeated application of
high-intensity impacts at
surface.
Cohesionless soils best,
other types can also be
improved.
> 65 ft. (20 m) possible 35,520 ft.2 (3300 m
2) Can obtain high relative
densities, reasonable
uniformity.

EB 15-025 Page 50 of 62
TABLE 5 (cont.)
Improvement of Liquefiable Soil Foundation Conditions (Ledbetter, 1985)
Method Principle Most Suitable Soil
Conditions/Types
Maximum Effective
Treatment Depth
Economic Size of
Treated Areas
Ideal Properties of
Treated Materials
Compression 5. Displacement/
Compaction grout
Highly viscous grout acts
as radial hydraulic jack
when pumped in under
high pressure.
All soils. Unlimited Small Grout bulbs within
compressed soil matrix.
Soil mass as a whole is
strengthened.
6. Surcharge/ Buttress The weight of a
surcharge/buttress
increases the liquefaction
resistance by increasing
the effective continuing
pressures in the
foundation.
Can be placed on any soil
surface.
-- >10,760 ft.2 (1000 m
2) Increase strength and
reduce compressibility.
Pore Water Pressure Relief
7. Gravel Drains Relief of excess pore
water pressure to prevent
liquefaction.
Sand, silt, clay. > 100 ft. (30 m) >16,150 ft.2 (1500 m
2) Fast relief of excess pore
water pressure will prevent
liquefaction.
Injection and Grouting
8. Particulate grouting
Penetration grouting-fill
soil pores with soil,
cement, and/or clay.
Medium to coarse sand
and gravel.
Unlimited. Small Impervious, high strength
with cement grout. Voids
filled so they cannot
collapse under cyclic
loading.

EB 15-025 Page 51 of 62
TABLE 5 (cont.)
Improvement of Liquefiable Soil Foundation Conditions (Ledbetter, 1985)
Method Principle Most Suitable Soil
Conditions/Types
Maximum Effective
Treatment Depth
Economic Size of
Treated Areas
Ideal Properties of
Treated Materials 9. Chemical grouting Solutions of two or more
chemicals react in soil
pores to form a gel or a
solid precipitate.
Medium silts and coarser. Unlimited Small Impervious, low to high
strength. Voids filled so
they cannot collapse under
cyclic loading.
10. Pressure-injected lime Penetration grouting – fill
soil pores with lime.
Medium to coarse sand
and gravel.
Unlimited Small Impervious to some
degree. No significant
strength increase. Collapse
of voids under cyclic
loading reduced.
11. Electrokinetic
injection
Stabilizing chemicals
move into and fill soil
pores by electro-osmosis
or colloids into pores by
electro-phoresis.
Saturated sands, silts, silty
clays.
Unknown Small Increased strength,
reduced compressibility,
voids filled so they cannot
collapse under cyclic
loading.
12. Jet grouting High-speed jets at depths
excavate, inject, and mix a
stabilizer with soil to form
columns or panels.
Sands, silts, clays. Unknown Small Solidified columns and
walls.
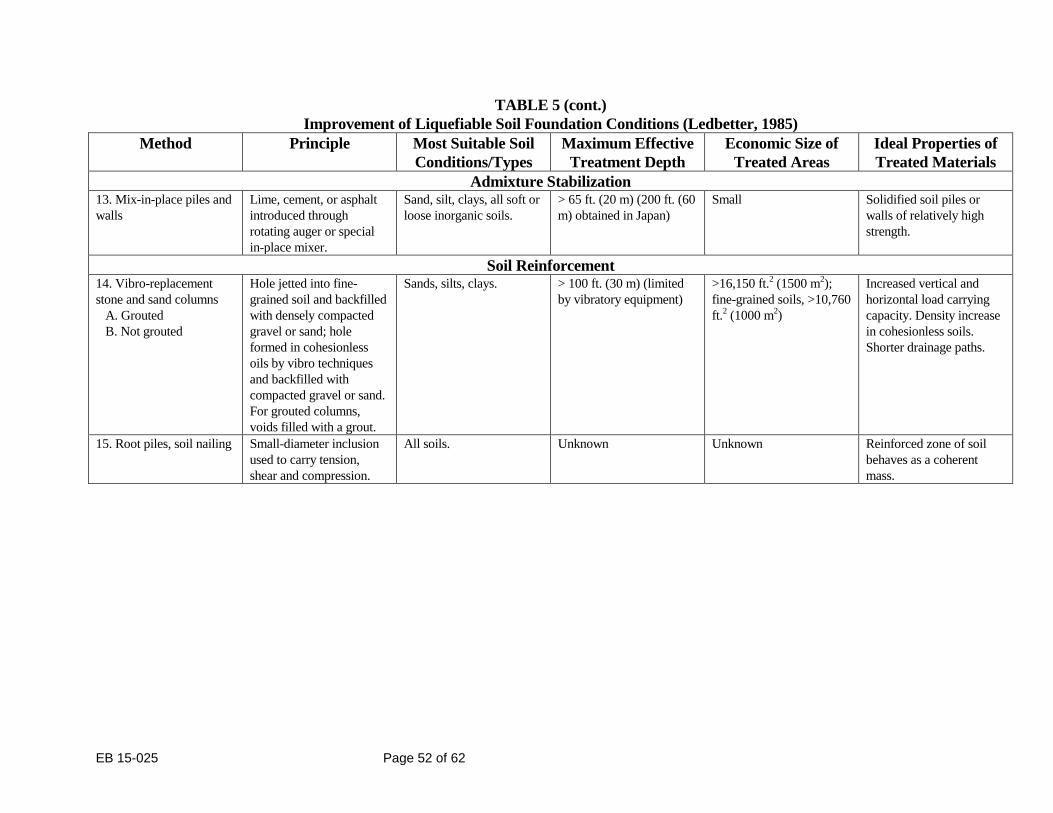
EB 15-025 Page 52 of 62
TABLE 5 (cont.)
Improvement of Liquefiable Soil Foundation Conditions (Ledbetter, 1985)
Method Principle Most Suitable Soil
Conditions/Types
Maximum Effective
Treatment Depth
Economic Size of
Treated Areas
Ideal Properties of
Treated Materials
Admixture Stabilization
13. Mix-in-place piles and
walls
Lime, cement, or asphalt
introduced through
rotating auger or special
in-place mixer.
Sand, silt, clays, all soft or
loose inorganic soils.
> 65 ft. (20 m) (200 ft. (60
m) obtained in Japan)
Small Solidified soil piles or
walls of relatively high
strength.
Soil Reinforcement 14. Vibro-replacement
stone and sand columns
A. Grouted
B. Not grouted
Hole jetted into fine-
grained soil and backfilled
with densely compacted
gravel or sand; hole
formed in cohesionless
oils by vibro techniques
and backfilled with
compacted gravel or sand.
For grouted columns,
voids filled with a grout.
Sands, silts, clays. > 100 ft. (30 m) (limited
by vibratory equipment)
>16,150 ft.2 (1500 m
2);
fine-grained soils, >10,760
ft.2 (1000 m
2)
Increased vertical and
horizontal load carrying
capacity. Density increase
in cohesionless soils.
Shorter drainage paths.
15. Root piles, soil nailing
Small-diameter inclusion
used to carry tension,
shear and compression.
All soils. Unknown Unknown Reinforced zone of soil
behaves as a coherent
mass.
EB 15-025 Page 53 of 62
ACKNOWLEDGEMENTS
This report was prepared by J. Teh Sung. It has benefited from reviews by A. R. Schnore of this
Bureau and Klaus Jacob of the Lamont-Doherty Geological Observatory of Columbia University,
and from discussions with Walter Mitronovas of the New York State Geological Survey, Ricardo
Dobry of Rensselaer Polytechnic Institute, and Martitia Tuttle of the Lamont-Doherty Geological
Observatory.

EB 15-025 Page 54 of 62
REFERENCES
Algermissen, S. T., Perkins, D. M., Thenhaus, P. C., Hanson, S. L., and Bender, B. L.,
"Probabilistic Estimates of Maximum Acceleration and Velocity in Rock in the Contiguous United
States," U. S. Geological Survey, Open File Report 82-1033, 1982.
Algermissen, S. T., Perkins, D. M., Thenhaus, P. C., Hanson, S. L., and Bender, B. L.,
"Probabilistic Earthquake Acceleration and Velocity Maps for the United States and Puerto Rico,"
Miscellaneous Field Studies Map MF-2120, U. S. Geological Survey, 1990.
Anderson, L. R., Keaton, J. R., Aubry, K., and Ellis, S. J., "Liquefaction Potential Map for Davis
County, Utah," Department of Civil and Environmental Engineering, Utah State University, Logan,
Utah, 1982.
Andrus, R. D., Stokoe, K. H., and Roesset, J. M., "Liquefaction of Gravelly Soil at Pence Ranch
During the 1983 Borah Peak, Idaho Earthquake," First International Conference on Soil Dynamics
and Earthquake Engineering V, Karlsruhe, Germany, September 1991.
Arulanandan, K., "Method and Apparatus for Measuring In-Situ Density and Fabric Soils," patent
application, Regents of the University of California, Berkeley, California, 1977.
Arulmoli, K., Arulanandan, K., and Seed, H. B., "New Method for Evaluating Liquefaction
Potential," Journal of the Geotechnical Engineering Division, ASCE, Vol. 111, No. GT1, 1985.
Baldi, G., Bellotti, R., Ghionna, V., Jamiolkowski, M., and Pasqualini, E., "Penetration Resistance
and Liquefaction of Sands," Proceedings of the 11th International Conference on Soil Mechanics
and Foundation Engineering, San Francisco, 1985.
Barosh, P. J., "Earthquake Controls and Zonation in New York," Proceedings of Conference XXIV,
U.S. Geological Survey, Open File 85-386, 1984.
Bartlett, S. F., and Youd, T. L., "Empirical Analysis of Horizontal Ground Displacement Generated
by Liquefaction-Induced Lateral Spreads," Report No. NCEER-92-0021, NCEER, SUNY at
Buffalo, 1992.
Bierschwale, J. G., and Stokoe, K. H., II, "Analytical Evaluation of Liquefaction Potential of Sands
Subjected to the 1981 Westmoreland Earthquake," Geotechnical Engineering Report GR-84-15,
Civil Engineering Department, University of Texas, Austin, Texas, 1984.
Campanella, R. G., and Robertson, P. K., "A Seismic Cone Penetrometer to Measure Engineering
Properties of Soil," Proceedings of the Fifty-fourth Annual Meeting of the Society of Exploration
Geophysicists, Atlanta, Georgia, 1984.
Casagrande, A., "Characteristics of Cohesionless Soils Affecting the Stability of Slopes and Earth
Fills," Journal of the Boston Society of Civil Engineers, 1936, reprinted in Contributions to Soil
Mechanics, 1925 to 1940, Boston Society of Civil Engineers, Oct., 1940.
EB 15-025 Page 55 of 62
Castro, G., "Liquefaction of Sands," Thesis Presented to Harvard University in Fulfillment of the
Requirements for the Degree of Doctor of Philosophy, 1969.
Castro, G., "On the Behavior of Soils During Earthquakes - Liquefaction," Proceedings of the 3rd
International Conference on Soil Dynamics and Earthquake Engineering, Princeton, New Jersey,
June, 1987.
Castro, G., Poulos, S. J., France, J. W., and Enos, J. L., "Liquefaction Induced by Cyclic Loading,"
Report to National Science Foundation, Geotechnical Engineers, Inc., Winchester, Massachusetts,
1982.
Chameau, J. L., and Clough, G. W., "Probabilistic Pore Pressure Analysis for Seismic Loading,"
Journal of the Geotechnical Engineering Division, ASCE, Vol. 109, No. GT4, 1983.
De Alba, P. A., Seed, H. B., Retamal, E., and Seed, R. H., "Analysis of Dam Failures in 1985
Chilean Earthquake," ASCE, Journal of the Geotechnical Engineering Division, ASCE, Vol. 114,
No. GT12, 1988.
Dobry, R., "Some Basic Aspects of Soil Liquefaction During Earthquakes," Proceedings of the
Conference on Earthquake Hazards and the Design of Constructed Facilities in the Eastern
United States, Academy of Sciences, New York, Feb. 24-26, 1989.
Dobry, R., Powell, D. J., Yokel F. Y., and Ladd, R. S., "Liquefaction Potential of Saturated Sand -
The Stiffness Methods," Proceedings of the 7th World Conference on Earthquake Engineering,
Istanbul, Vol. 3, 1980.
Dobry, R., and Vucetic, M., "Dynamic Properties and Seismic Response of Soft Clay Deposits,"
Proceedings of the International Symposium on Geotechnical Engineering of Soft Soils, Mexico,
Vol. 2, Session 1B, 1987.
Dobry, R., Yokel, F. Y., and Ladd, R. S., "Liquefaction Susceptibility from S-Wave Velocity,"
ASCE National Convention, St. Louis, Missouri, October, 1981.
Douglas, B. J., Olsen, R. S., and Martin, G. R., "Evaluation of the Cone Penetrometer Test for SPT-
Liquefaction Assessment," In Situ Testing to Evaluate Liquefaction Susceptibility, Preprint 81-544,
ASCE National Convention, St. Louis, Missouri, 1981.
Earthquakes and Volcanoes, "The Loma Prieta, California, Earthquake of October 17, 1989," U.S.
Geological Survey, Vol. 21, No. 5, 1989.
Earthquake Information Bulletin, U. S. Geological Survey, Department of the Interior, Washington,
D. C., Vol. 7, No.4, July-August, 1975.
Ebel, J.,"The Seismicity of the Northeastern United States," Proceedings of the Symposium on
Seismic Hazards, Ground Motions, Soil-Liquefaction and Engineering Practice in Eastern North
America, NCEER, SUNY at Buffalo, October, 1987.
EB 15-025 Page 56 of 62
Fardis, M. N., and Veneziano, D, "Probabilistic Analysis of Deposit Liquefaction," Journal of the
Geotechnical Engineering Division, ASCE, Vol. 108, No. GT3, 1982.
FEMA, "NEHRP Recommended Provisions for the Development of Seismic Regulations for New
Buildings," Federal Emergency Management Agency, Earthquake Hazards Reduction Series 17,
FEMA 95, October 1988.
Finn, W. D. L., "Liquefaction Potential: Developments Since 1976," Proceedings of the
International Conference on Recent Advances in Geotechnical Earthquake Engineering and Soil
Dynamics, University of Missouri, Rolla, Missouri, 1981.
Finn, W. D. L., Brandy, P. L., and Pickering, D. L., "Effect of Strain History on Liquefaction of
Sand," Journal of the Geotechnical Engineering Division, ASCE, Vol. 96, No. GT6, November,
1970.
Finn, W.D. Liam, Lee, Kwok W., and Martin, Geoffrey R., "An Effective Stress Model for
Liquefaction of Sands", Journal of the Geotechnical Engineering Division, ASCE, Vol. 102, No.
GT8, 1976.
Fischer, J. A., and McWhorter, J. G., "The Microzonation of New York State," Microzonation
Conference for Safer Construction Research and Applications, Seattle, Oct., 1972.
Fuller, M. L., "The New Madrid Earthquake," Bulletin 494, U.S. Geological Survey, Department of
Interior, Washington, D.C., 1912.
Geotechnical News, Volume 8, No.1, March, 1990.
Haldar, A., and Tang, W. H., "Probabilistic Evaluation of Liquefaction Potential," Journal of the
Geotechnical Engineering Division, ASCE, Vol. 105, No. GT2, 1979.
Idriss, I. M., "Response of Soft Soil Sites During Earthquakes," Proceedings of the Memorial
Symposium to Honor Professor Harry Bolton Seed, University of California, Berkeley, May, 1990.
Idriss, I. M., and Seed, H. B., "Seismic Response of Horizontal Soil Layers," Journal of the Soil
Mechanics and Foundation Division, ASCE, Vol. 96, No. SM4, 1968.
Ishihara, K., "Stability of Natural Deposits During Earthquakes," Proceedings of the Eleventh
International Conference on Soil Mechanics and Foundation Engineering, San Francisco, 1985.
Ishihara, K., "Evaluation of Liquefaction Potential and Consequent Deformations in Sandy Fills,"
Proceedings of the Seismic Workshop on the Port of Los Angeles, 1990.
Jacob, K. H., "Seismic Hazard in New York City Area," Seminar Notes for the Practical Aspects of
Earthquake Engineering, Architecture, and Construction, New York City, May 23, 1991.

EB 15-025 Page 57 of 62
Jacob, K. H., "Seismic Hazards in the Eastern U.S. and the Impact on Transportation Lifelines,"
Proceedings of the Lifeline Earthquake Engineering in the Central and Eastern US, ASCE, New
York, September, 1992.
Konard, J. M., "Minimum Undrained Strength of Two Sands," Journal of the Geotechnical
Engineering Division, ASCE, Vol. 116, No. GT6, June, 1990.
Kovacs, W. D., Yokel, F. Y., Salomone, L. A., and Holtz, R. D., "Liquefaction Potential and the
International SPT," Proceedings of the Eighth World Conference on Earthquake Engineering,
Volume 3, Prentice-Hall, Inc., Englewood Cliffs, New Jersey, 1984.
Kramer, S. L., "Uncertainty in Steady-State Liquefaction Evaluation Procedures," Journal of the
Geotechnical Engineering Division, ASCE, Vol. 115, No. GT10, October, 1989.
Kulhway, F. H., and Ninyo, A., "Earthquakes and Earthquake Zones in New York State," Bulletin
of Association of Engineering Geologists, Vol. XIV, No. 2, 1977.
Law, K. T., "Analysis of Soil Liquefaction During the 1988 Saguenay Earthquake," Proceedings of
the 43rd Canadian Geotechnical Conference, Quebec, October 10-12, 1990.
Ledbetter, R. H., "Improvements of Liquefiable Foundation Conditions Beneath Existing
Structures," Technical Report REMR-GT-2, U.S. Army Corps of Engineers, Waterways
Experiment Station, Vicksburg, Mississippi, 1985.
Lee, K. L., and Fitton, J. A., "Factors Affecting the Cyclic Loading Strength of Soil," Vibration
Effects of Earthquakes on Soils and Foundations, ASTM STP 450, American Society for Testing
and Materials, 1969.
Liao, S., and Whitman, R. V., "Overburden Correction Factors for SPT in Sand," Journal of the
Geotechnical Engineering Division, ASCE, Vol. 112, No. GT3, 1986.
Liao, S., Veneziano, P., and Whitman, R., "Regression Model for Evaluating Liquefaction
Probability," Journal of the Geotechnical Engineering Division, ASCE, Vol. 114, No. GT4, 1988.
Lindh, A. G., "Earthquake Prediction Comes of Age," Technology Review, February/March, 1990.
Liou, C. P., Streeter, V. L., and Richart, F. E., "A Numerical Model for Liquefaction," Journal of
the Geotechnial Engineering Division, ASCE, No. GT6, 1977.
Martin, P. P., and Seed, H. B., "MASH: A Computer Program for the Nonlinear Analysis of
Vertically Propagating Shear Waves in Horizontally Layered Deposits," Report UCB/EERC 78/23,
Earthquake Engineering Research Center, University of California, Berkeley, October, 1978.
Mitronovas, W., "Earthquake Statistics in New York State," Earthquake Notes, Vol. 53, No. 2,
April-June, 1982.

EB 15-025 Page 58 of 62
Mitronovas, W., and Nottis, G. N., "Seismicity of New York: Current Status of Scientific
Knowledge and Research in Historical Seismicity," Proceedings of Conference XXIX, U.S.
Geological Survey, Open File 85-386, 1984.
National Research Council, "Liquefaction of Soils During Earthquakes," Committee on Earthquake
Engineering, National Research Council, National Academy Press, Washington, D.C., 1985.
New York State Geological Survey, "Current Facts About Earthquakes and Earthquake
Preparedness in New York," NYSGS, October, 1989.
NCEER, "Fact Sheet," National Center for Earthquake Engineering Research, SUNY at Buffalo,
1990.
O'Rourke, T. D., Gowdy, T. E., Steward, H. E., and Pease, J. W., "Lifeline Performance and
Ground Deformation in Marine During the 1989 Loma Prieta Earthquake," Report No.NCEER-90-
0001, NCEER, Feb., 1991.
Poulos, S. J., "The Steady State of Deformation," Journal of the Geotechnical Engineering Division,
ASCE, Vol. 107, No. GT5, 1981.
Poulos, S. J., Castro, G., and France, J. W., "Liquefaction Evaluation Procedure," Journal of the
Geotechnical Engineering Division, ASCE, Vol. 111, No. GT6, 1985.
Poulos, S. J., Robinsky, E. I., and Keller, T. O., "Liquefaction Resistance of Thickened Tailings,"
Journal of the Geotechnical Engineering Division, ASCE., Vol. 111, No. GT12, 1985.
Prevost, J. H., "DYNAID: A Computer Program for Nonlinear Seismic Site Response Analysis,"
Technical Report NCEER-89-0025, National Center for Earthquake Engineering Research, SUNY
at Buffalo, 1989.
Pyke, R., Seed, H. B., and Chan, C. K., "Settlement of Sands Under Multidirectional Shaking,"
Journal of the Geotechnical Engineering Division, ASCE, GT4, 1975.
Riemer, M., Seed, R., Nicholson, P., and Jong, H. L., "Steady State Testing of Loose Sands:
Limiting Minimum Density," Journal of the Geotechnical Engineering Division, ASCE, Vol. 116,
No. GT2, February, 1990.
Robertson, P. K., and Campanella, R. G., "Liquefaction Potential of Sands Using the CPT," Journal
of the Geotechnical Engineering Division, ASCE, Vol. 111, No. GT3, 1985.
Robertson, P. K., Campanella, R. G., and Wightman, A., "SPT-CPT Correlations," Journal of the
Geotechnical Engineering Division, ASCE, Vol. 109, No. GT11, 1983.
Ross, G. A., Seed, H. B., and Migliaccio, R. R. "Bridge Foundations in Alaska Earthquake,"
Journal of the Soil Mechanics and Foundation Engineering, ASCE, Vol. 95, No. SM4, July, 1969.
EB 15-025 Page 59 of 62
Schnabel, P. B., Lysmer, J., and Seed, H. B., "SHAKE: A Computer Program for Earthquake
Response Analysis of Horizontally Layered Sites," Report No. EERC 72-12, University of
California, Berkeley, California, December, 1972.
Seed, H. B., "Landslides During Earthquakes," Journal of the Soil Mechanics and Foundations
Division, ASCE, Vol. 94, No. SM5, September, 1968.
Seed, H. B., "Soil Liquefaction and Cyclic Mobility Evaluation for Level Ground During
Earthquakes," Journal of the Geotechnical Engineering Division, ASCE, Vol. 105, No. GT2, 1979.
Seed, H. B., "Design Problems in Soil Liquefaction," Journal of the Geotechnical Engineering
Division, ASCE, Vol. 113, No. GT8, 1987.
Seed, H. B., and Idriss, I. M., "Simplified Procedure for Evaluating Soil Liquefaction Potential,"
Journal of the Soil Mechanics and Foundation Division, ASCE, Vol. 97, No. SM9, 1971.
Seed, H. B., and Silver, M. L., "Settlement of Dry Sands during Earthquakes," Journal of the Soil
Mechanics Foundation Division, ASCE, No. SM4, 1972.
Seed, H. B., Idriss, I. M., and Arango, I., "Evaluation of Liquefaction Potential Using Field
Performance Data," Journal of the Geotechnical Engineering Division, ASCE, Vol. 109, No. GT3,
1983.
Seed, H. B., Lee, K. L., Idriss, I. M., and Makdisi, F. I., "The Slides in the San Fernando Dams
During the Earthquake of February 9, 1971," Journal of the Geotechnical Engineering Division,
ASCE, Vol. 101, No. GT7, July, 1975.
Seed, H. B., Mori, K., and Chan, C. K., "Influence of Seismic History on Liquefaction of Sand,"
Journal of the Geotechnical Engineering Division, ASCE, Vol. 103, No. GT4, 1977.
Seed, H. B., Muraka, R., Lysmer, J., and Idriss, I., "Relationships of Maximum Acceleration,
Maximum Velocity, Distance From Source, and Local Site Conditions for Moderately Strong
Earthquakes," Bulletin of the Seismological Society of America, Vol. 66, No. 4, August, 1976.
Seed, H. B., Seed, R. B., Harder, L. F., and Jong, H. L., "Examination of the Post-Earthquake Slide
of February 9, 1971," Re-evaluation of the Lower San Fernando Dam Report 2, Department of the
Army, U.S. Army Corps of Engineers, Washington, D.C., Contract Report GL-89-2, September,
1989.
Seed, H. B., Tokimatsu, K., Harder, L. F., and Chung, R. M., "Influence of SPT Procedures in Soil
Liquefaction Resistance Evaluations," Journal of the Geotechnical Engineering Division, ASCE,
Vol. 3, No. GT12, 1985.
Sherif, M. A., Ishibashi, I., and Tsuchiya, C., "Saturation Effects on Initial Soil Liquefaction,"
Journal of the Geotechnical Engineering Division, ASCE, Vol. 103, No. GT8, 1977.

EB 15-025 Page 60 of 62
Silver, M. L., and Seed, H. B., "Volume Changes in Sands During Cyclic Loading," Journal of the
Soil Mechanics Foundation Division, ASCE, No. SM9, 1971.
Singh, R. D., Dobry, R., Doyle, E., and Idriss, I., "Nonlinear Seismic Response of Soft Clay Sites,"
Journal of the Geotechnical Engineering Division, ASCE, Vol. 107, NO. GT9, 1981.
Singh, S., Donovan, N. C., and Park, F., "A Re-examination of the effect of Prior Loadings on the
Liquefaction Resistance of Sands," Proceedings of the 8th World Conference on Earthquake
Engineering, Vol. 3, Istanbul, Turkey, September, 1980.
Tinsley, J. C., Youd, T. L., Perkins, D. M., and Chen, A. T. F., "Evaluating Liquefaction Potential,"
Evaluating Earthquake Hazards in the Los Angeles Region, an Earth Science Perspective,
Professional Paper 1360, J. I. Ziony, Ed., U.S. Geological Survey, 1985.
Tokimatsu, K., and Seed, H. B., "Evaluation of Settlement in Sands due to Earthquake Shaking,"
Journal of the Geotechnical Engineeering Division, N0. GT8, 1987.
Tokimatsu, K., and Yoshimi, Y., "Empirical Correlation of Soil Liquefaction Based on SPT N-
Value and Fines Content," Soils and Foundations, Japanese Society of Soil Mechanics and
Foundation Engineering, Vol. 23, No. 4, 1983.
Tsuchida, H., "Prediction and Countermeasure Against the Liquefaction in Sand Deposits,"
Abstract of the Seminar in the Port and Harbor Research Institute (in Japanese), 1970.
Tuttle, M., and Seeber, L., "Earthquake-Induced Liquefaction in the Northeastern United States:
Historical Effects and Geological Constraints," Proceedings of the Conference on Earthquake
Hazards and Design of Construction Facilities in the Eastern United States, Academy of Sciences,
New York, Feb. 24-26, 1989.
Varnes, D. J., "Slope Movements and Processes," Landslides - Analysis and Control, National
Academy of Sciences, Washington, D.C., Special Report 176, 1978.
Vasequez-Herrera, A., and Dobry, R., "The Behavior of Undrained Contractive Sand and its Effect
on Seismic Liquefaction Flow Failures of Earth Structures," Re-evaluation of the Lower San
Fernando Dam Report 3, Rensselaer Polytechnic Institute, prepared for Department of the Army,
U.S. Corps of Engineers, Washington, D.C., Contract Report GL-89-2, September, 1989.
Walker, A.J., and Steward, H.E., "Cyclic Undrained Behavior of Nonplastic and Low Plasticity
Silts," Technical Report NCEER-89-0035, National Center for Earthquake Engineering Research,
SUNY at Buffalo, July 26, 1989.
Whitman, R. V., "On Liquefaction," Proceedings of the Eleventh International Conference on Soil
Mechanics and Foundation Engineering, San Francisco, 1985.
Yegian, M., and Whitman, R. V., "Risk Analysis for Ground Failure by Liquefaction," Journal of
the Geotechnical Engineering Division, ASCE, Vol. 104, No. GT7, 1978.
EB 15-025 Page 61 of 62
Youd, T. L., "Geologic Effects - Liquefaction and Associated Ground Failure," Proceedings of the
Geologic and Hydrologic Hazards Training Program, Open-File Report 84-760, U.S. Geological
Survey, Menlo Park, California, 1984.
Youd, T. L., and Hoose, S. N., "Liquefaction Susceptibility and Geologic Setting," Proceedings of
the Sixth World Conference on Earthquake Engineering, Volume 3, Prentice-Hall, Inc., Englewood
Cliffs, New Jersey, 1977.
Youd, T. L., and Perkins, M., "Mapping Liquefaction-Induced Ground Failure Potential," Journal of
the Geotechnical Engineering Division, ASCE, Vol. 104, No. GT4, 1978.
Youd, T. L., and Perkins, M., " Mapping of Liquefaction Severity Index," Journal of the
Geotechnical Engineering Division, ASCE, Vol. 113, No. GT11, 1987.
Youd, T. L., Tinsley, J. C., Perkins, D. M., King, E. J., and Preston, R. F., "Liquefaction Potential
Map of San Fernando Valley, California," Proceedings of the Second International Conference on
Microzonation for Safety Construction - Research and Applications, Volume 1, National Science
Foundation, Washington, D.C., 1978.
Zoback, M. D., "In Situ Stress, Crustal Strain and Seismicity in Eastern North America,"
Proceedings of the Symposium on Seismic Hazards, Ground Motions, Soil-Liquefaction and
Engineering Practice in Eastern North America, Edited by K. H. Jacob, Technical Report NCEER-
87-0025, NCEER, SUNY at Buffalo, December, 1987.

EB 15-025 Page 62 of 62
APPENDIX
APPENDIX A
EB 15-025 A-1
Modified Mercalli Intensity and
Richter Scale Magnitude
The severity of an earthquake can be expressed in terms of both intensity and magnitude. However,
the two terms have quite different meanings as described below.
Intensity
The effect of an earthquake on the Earth's surface is called the intensity. It is generally expressed by
scales describing a subjective evaluation at the place of observation of the destructiveness from the
energy released at the earthquake focus. Although numerous intensity scales have been developed
over the last several hundred years, the one currently used in the United States is the Modified
Mercalli Intensity scale, MMI, developed in 1931 by Harry Wood and Frank Neumann. This scale
ranks the shaking levels in an ascending order from I to XII. A condensed version of the MMI scale
is given in Table A.1. Sand boils and ground failures resulting from liquefaction are generally
assigned to MMI level VIII and higher.
The MMI generally decreases with the distance from the earthquake epicenter. However, the
intensity of ground shaking at a given site is a complex function of many factors, such as size of the
earthquake at focus, site distance to the earthquake epicenter, type and thickness of the soil and rock
deposits that underlie the site, attenuation, soil amplification, soil-structure interaction, etc.
Therefore, the earthquake intensity level at a given site may vary considerably from that observed a
short distance away. For example, an assessment of the distribution of MMI resulting from the
Loma Prieta earthquake is shown in Figure A.1. (Earthquakes and Volcanoes, 1989). It can be seen
that the estimated intensity levels in western Oakland and eastern and northern San Francisco,
where alluvium and soft clay are deposited, are one to three units higher than in other areas of the
cities.
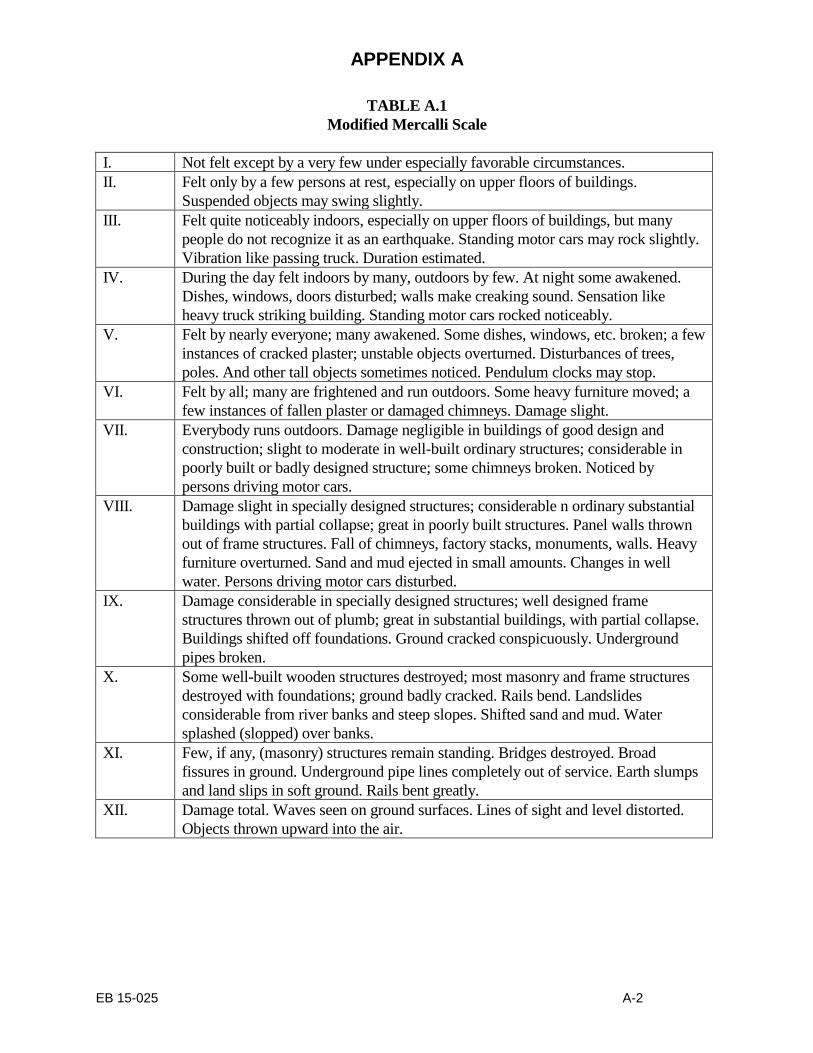
APPENDIX A
EB 15-025 A-2
TABLE A.1
Modified Mercalli Scale
I. Not felt except by a very few under especially favorable circumstances.
II. Felt only by a few persons at rest, especially on upper floors of buildings.
Suspended objects may swing slightly.
III. Felt quite noticeably indoors, especially on upper floors of buildings, but many
people do not recognize it as an earthquake. Standing motor cars may rock slightly.
Vibration like passing truck. Duration estimated.
IV. During the day felt indoors by many, outdoors by few. At night some awakened.
Dishes, windows, doors disturbed; walls make creaking sound. Sensation like
heavy truck striking building. Standing motor cars rocked noticeably.
V. Felt by nearly everyone; many awakened. Some dishes, windows, etc. broken; a few
instances of cracked plaster; unstable objects overturned. Disturbances of trees,
poles. And other tall objects sometimes noticed. Pendulum clocks may stop.
VI. Felt by all; many are frightened and run outdoors. Some heavy furniture moved; a
few instances of fallen plaster or damaged chimneys. Damage slight.
VII. Everybody runs outdoors. Damage negligible in buildings of good design and
construction; slight to moderate in well-built ordinary structures; considerable in
poorly built or badly designed structure; some chimneys broken. Noticed by
persons driving motor cars.
VIII. Damage slight in specially designed structures; considerable n ordinary substantial
buildings with partial collapse; great in poorly built structures. Panel walls thrown
out of frame structures. Fall of chimneys, factory stacks, monuments, walls. Heavy
furniture overturned. Sand and mud ejected in small amounts. Changes in well
water. Persons driving motor cars disturbed.
IX. Damage considerable in specially designed structures; well designed frame
structures thrown out of plumb; great in substantial buildings, with partial collapse.
Buildings shifted off foundations. Ground cracked conspicuously. Underground
pipes broken.
X. Some well-built wooden structures destroyed; most masonry and frame structures
destroyed with foundations; ground badly cracked. Rails bend. Landslides
considerable from river banks and steep slopes. Shifted sand and mud. Water
splashed (slopped) over banks.
XI. Few, if any, (masonry) structures remain standing. Bridges destroyed. Broad
fissures in ground. Underground pipe lines completely out of service. Earth slumps
and land slips in soft ground. Rails bent greatly.
XII. Damage total. Waves seen on ground surfaces. Lines of sight and level distorted.
Objects thrown upward into the air.
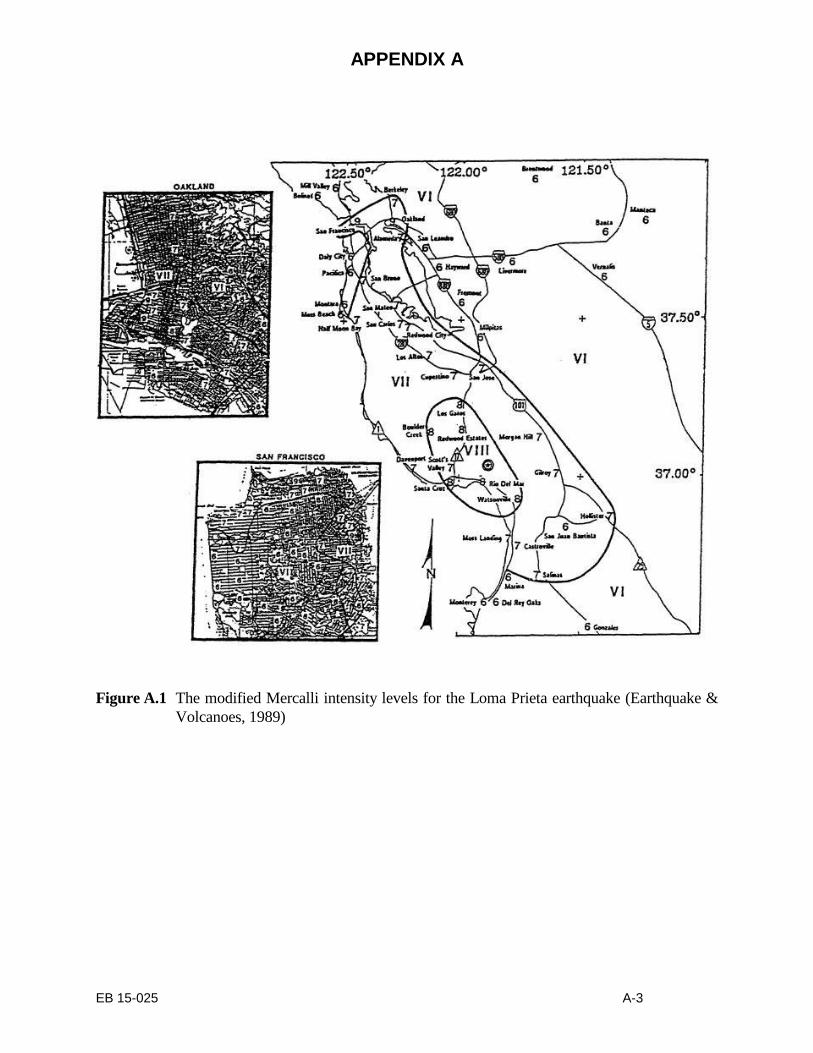
APPENDIX A
EB 15-025 A-3
Figure A.1 The modified Mercalli intensity levels for the Loma Prieta earthquake (Earthquake &
Volcanoes, 1989)

APPENDIX A
EB 15-025 A-4
Magnitude
Magnitude is related to the amount of seismic energy released at the hypocenter of the earthquake.
Richter magnitude is based on the amplitude of the seismic waves recorded on instruments called
seismographs. These devices may amplify ground motions beneath the instruments to over one
million times, transcribing the motion into a zig-zag trace called a seismogram. From the data
expressed in seismograms, the time, epicenter and focal depth of an earthquake can be determined
and estimates can be made of its relative size and the amount of energy that was released.
When Richter and Gutenberg first introduced the earthquake scales in 1933 for local magnitude,
ML, surface wave magnitude, MS, and body-wave magnitude, mb, they intended that all three scales
would give the same number for a given earthquake. However, the scales do not yield the same
number because the shape of the ground motion spectrum changes as the size of the earthquake
changes. ML defines the magnitude as the logarithm of the maximum amplitude, in microns, traced
on a seismograph at a distance of 60 miles (100 km) from the epicenter. Body-wave magnitude
determines the magnitude from the amplitude of the body wave at 1 Hz or with a period of 1
second, and MS from the amplitude at 0.05 Hz or with period close to 20 seconds. Another popular
measure of the size of an earthquake used by seismologists is the moment magnitude, MW, because
it basically follows the theory of focal mechanisms. Moment magnitude is defined in terms of the
seismic moment, which is the product of three factors: the area of the rupture surface, the average
slip, and the rigidity modulus of the rock mass at the hypocenter.
Magnitude on the Richter scale is expressed in whole numbers and decimal fractions. Each whole
number step of magnitude on the scale represents an increase of 10 times in the measured wave
amplitude of an earthquake. Thus, the amplitude of an 8.0 magnitude earthquake is not twice as
large as a shock of magnitude 4.0 but 10,000 times as large. However, the amount of energy
released, as shown in Table A.2, increases even faster - by a factor of about 30 per one step of the
scale.
The Richter magnitudes commonly cited in the news media and among engineers are ML for
earthquakes with ML less than 6.5 and MS for earthquakes with MS greater than 6.5. Moment
magnitudes are approximately the same as the commonly cited Richter magnitudes for earthquakes
with MW less than 8.0.
Earthquakes with magnitude of about 2.0 or less are not commonly felt by people. Events with
magnitudes of about 4.5 or greater are strong enough to be recorded by sensitive seismographs all
over the world. Many investigators have stated that magnitude 5.5 may be the lowest threshold for
earthquake-induced liquefaction.
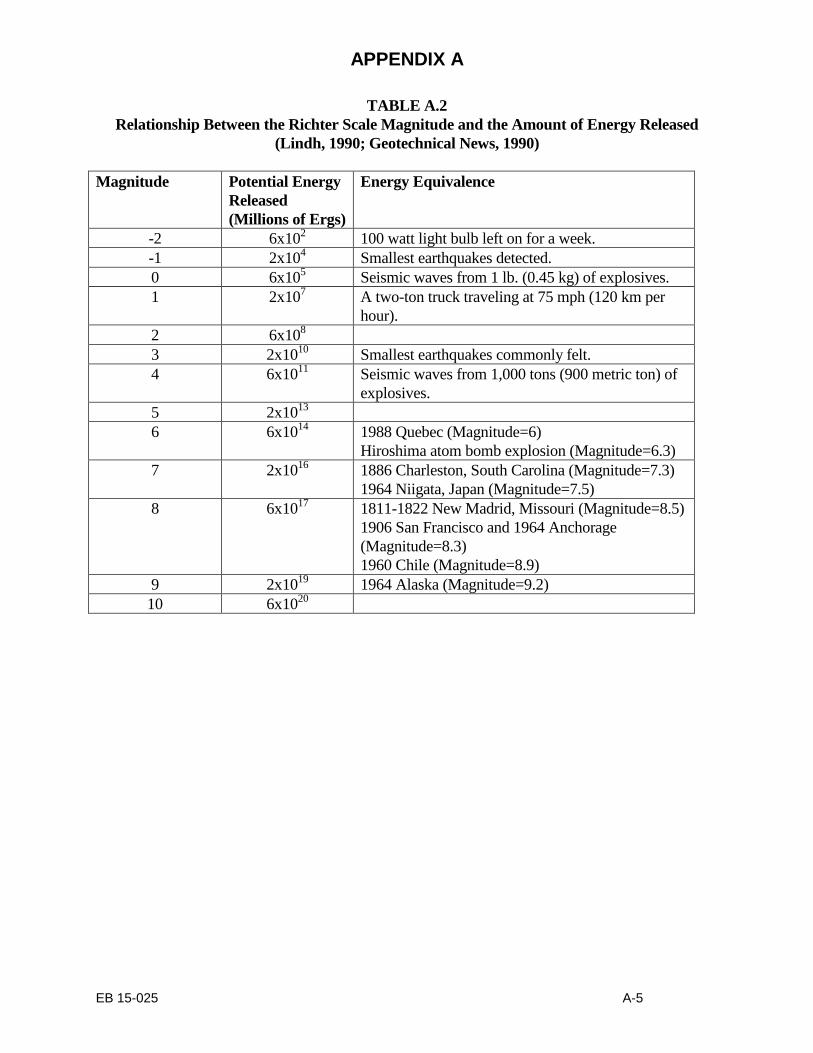
APPENDIX A
EB 15-025 A-5
TABLE A.2
Relationship Between the Richter Scale Magnitude and the Amount of Energy Released
(Lindh, 1990; Geotechnical News, 1990)
Magnitude Potential Energy
Released
(Millions of Ergs)
Energy Equivalence
-2 6x10² 100 watt light bulb left on for a week.
-1 2x10⁴ Smallest earthquakes detected.
0 6x10⁵ Seismic waves from 1 lb. (0.45 kg) of explosives.
1 2x10⁷ A two-ton truck traveling at 75 mph (120 km per
hour).
2 6x10⁸
3 2x10¹⁰
Smallest earthquakes commonly felt.
4 6x10¹¹
Seismic waves from 1,000 tons (900 metric ton) of
explosives.
5 2x10¹³
6 6x10¹⁴
1988 Quebec (Magnitude=6)
Hiroshima atom bomb explosion (Magnitude=6.3)
7 2x10¹⁶
1886 Charleston, South Carolina (Magnitude=7.3)
1964 Niigata, Japan (Magnitude=7.5)
8 6x10¹⁷
1811-1822 New Madrid, Missouri (Magnitude=8.5)
1906 San Francisco and 1964 Anchorage
(Magnitude=8.3)
1960 Chile (Magnitude=8.9)
9 2x10¹⁹
1964 Alaska (Magnitude=9.2)
10 6x10²⁰

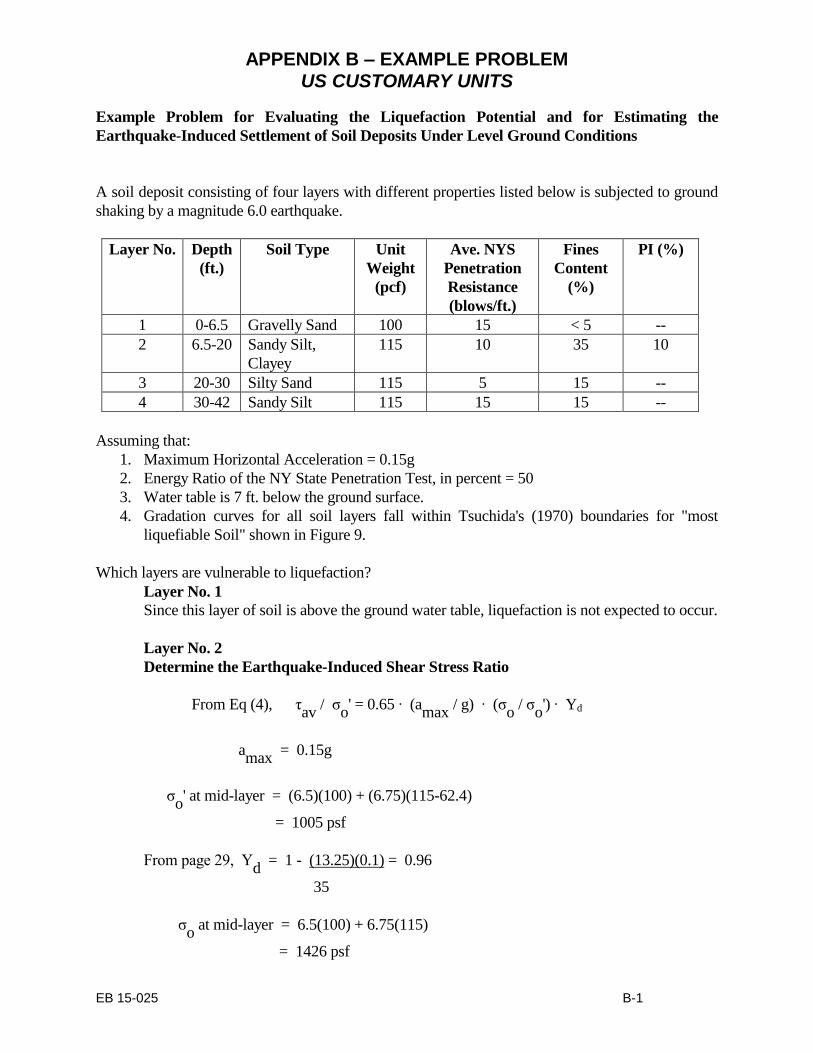
APPENDIX B – EXAMPLE PROBLEM US CUSTOMARY UNITS
EB 15-025 B-1
Example Problem for Evaluating the Liquefaction Potential and for Estimating the
Earthquake-Induced Settlement of Soil Deposits Under Level Ground Conditions
A soil deposit consisting of four layers with different properties listed below is subjected to ground
shaking by a magnitude 6.0 earthquake.
Layer No. Depth
(ft.)
Soil Type Unit
Weight
(pcf)
Ave. NYS
Penetration
Resistance
(blows/ft.)
Fines
Content
(%)
PI (%)
1 0-6.5 Gravelly Sand 100 15 < 5 --
2 6.5-20 Sandy Silt,
Clayey
115 10 35 10
3 20-30 Silty Sand 115 5 15 --
4 30-42 Sandy Silt 115 15 15 --
Assuming that:
1. Maximum Horizontal Acceleration = 0.15g
2. Energy Ratio of the NY State Penetration Test, in percent = 50
3. Water table is 7 ft. below the ground surface.
4. Gradation curves for all soil layers fall within Tsuchida's (1970) boundaries for "most
liquefiable Soil" shown in Figure 9.
Which layers are vulnerable to liquefaction?
Layer No. 1
Since this layer of soil is above the ground water table, liquefaction is not expected to occur.
Layer No. 2
Determine the Earthquake-Induced Shear Stress Ratio
From Eq (4), τav
/ σo' = 0.65 ∙ (a
max / g) ∙ (σ
o / σ
o') ∙ Yd
amax
= 0.15g
σo' at mid-layer = (6.5)(100) + (6.75)(115-62.4)
= 1005 psf
From page 29, Υd
= 1 - (13.25)(0.1) = 0.96
35
σo at mid-layer = 6.5(100) + 6.75(115)
= 1426 psf

APPENDIX B – EXAMPLE PROBLEM US CUSTOMARY UNITS
EB 15-025 B-2
(τav
/ σo' ) induced = (0.65) ∙ (0.15g / g) ∙ (1426 / 1005) ∙ (0.96)
= 0.13
Estimate the Shear Stress Ratio Requird to Cause Liquefaction
NNY = 10
ERm = 50
σo' = 1005 psf
CN = (1005/2000)-1/2
= 1.41
From Eq (5), (N1)60 = (1.29) CN ∙ ERm ∙ (NNY /60) =
= (1.29)(1.41)(50)(10)/(60) = 15
For an earthquake magnitude of 6.0, and fines content of 35%, from Figure 16,
(τav
/ σo' ) req. = 0.32
Considering the effect of soil plasticity by following Step e of Sec. 3.2.1.: Given fines
content=35% and PI= 10%, ß=1.1 from Figure 17. Correct the shear stress ratio required to
cause liquefaction to
(τav
/ σo' ) req. = (0.32) ∙ (1.1) = 0.35
Factor of Safety against liquefaction = (0.35 / 0.13) = 2.17 > 1.1
Therefore, layer No. 2 is nonliquefiable.
Layer No. 3
Determine the Earthquake-Induced Shear Stress Ratio
σo' at mid-layer = (6.5)(100)+(13.5)(115-62.4)+(5)(115-62.4)
= 1623 psf
σo at mid-layer = (6.5)(100)+(13.5)(115)+(5)(115)
= 2778 psf
Yd = 1 – ((30)(0.1))/ 35 = 0.91
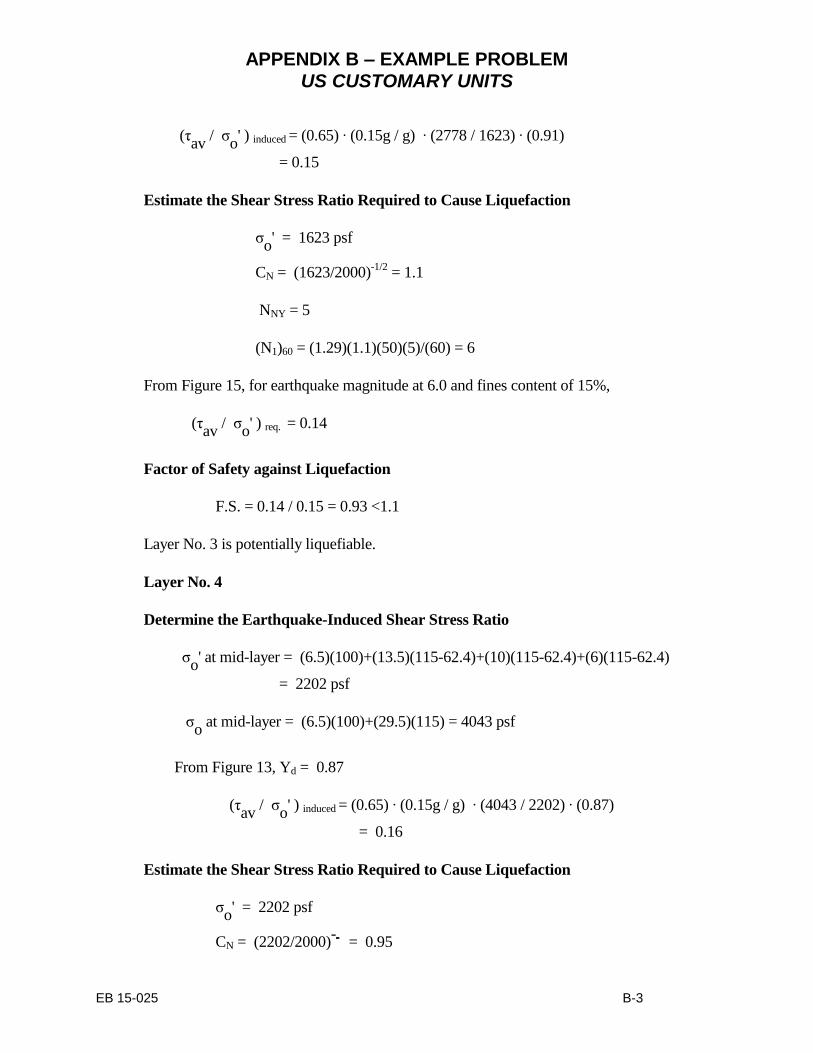
APPENDIX B – EXAMPLE PROBLEM US CUSTOMARY UNITS
EB 15-025 B-3
(τav
/ σo' ) induced = (0.65) ∙ (0.15g / g) ∙ (2778 / 1623) ∙ (0.91)
= 0.15
Estimate the Shear Stress Ratio Required to Cause Liquefaction
σo' = 1623 psf
CN = (1623/2000)-1/2
= 1.1
NNY = 5
(N1)60 = (1.29)(1.1)(50)(5)/(60) = 6
From Figure 15, for earthquake magnitude at 6.0 and fines content of 15%,
(τav
/ σo' ) req. = 0.14
Factor of Safety against Liquefaction
F.S. = 0.14 / 0.15 = 0.93 <1.1
Layer No. 3 is potentially liquefiable.
Layer No. 4
Determine the Earthquake-Induced Shear Stress Ratio
σo' at mid-layer = (6.5)(100)+(13.5)(115-62.4)+(10)(115-62.4)+(6)(115-62.4)
= 2202 psf
σo at mid-layer = (6.5)(100)+(29.5)(115) = 4043 psf
From Figure 13, Yd = 0.87
(τav
/ σo' ) induced = (0.65) ∙ (0.15g / g) ∙ (4043 / 2202) ∙ (0.87)
= 0.16
Estimate the Shear Stress Ratio Required to Cause Liquefaction
σo' = 2202 psf
CN = (2202/2000)-2
= 0.95
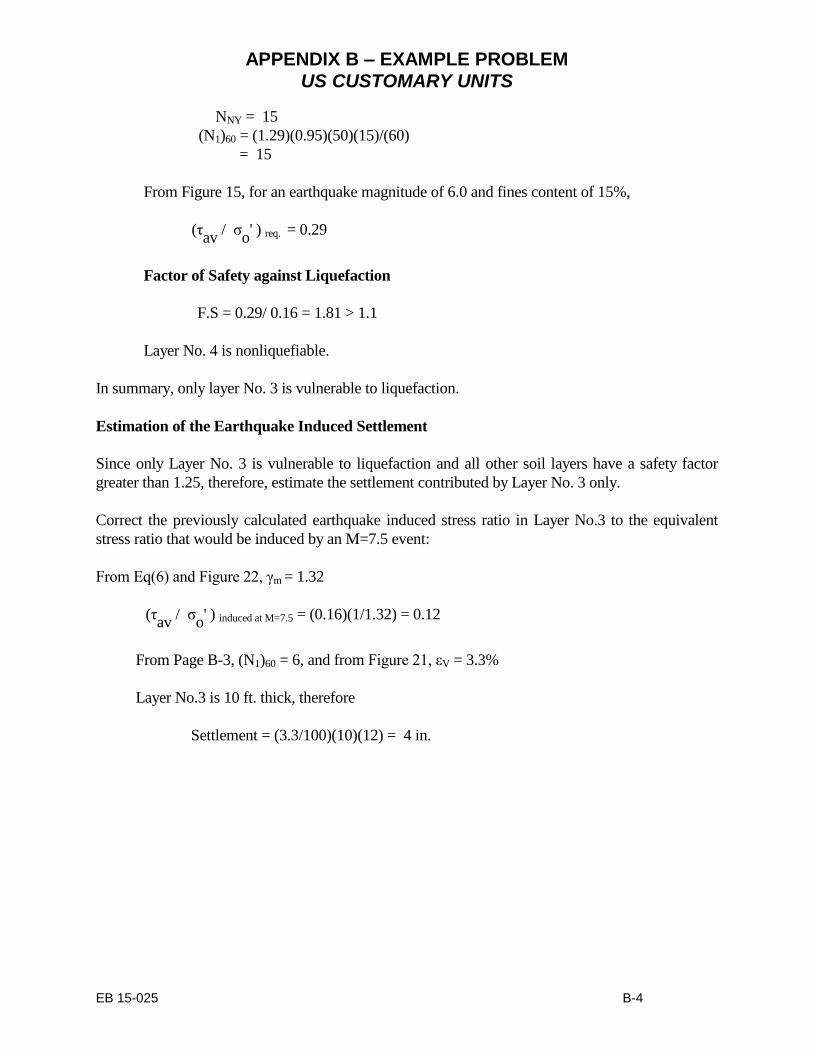
APPENDIX B – EXAMPLE PROBLEM US CUSTOMARY UNITS
EB 15-025 B-4
NNY = 15
(N1)60 = (1.29)(0.95)(50)(15)/(60)
= 15
From Figure 15, for an earthquake magnitude of 6.0 and fines content of 15%,
(τav
/ σo' ) req. = 0.29
Factor of Safety against Liquefaction
F.S = 0.29/ 0.16 = 1.81 > 1.1
Layer No. 4 is nonliquefiable.
In summary, only layer No. 3 is vulnerable to liquefaction.
Estimation of the Earthquake Induced Settlement
Since only Layer No. 3 is vulnerable to liquefaction and all other soil layers have a safety factor
greater than 1.25, therefore, estimate the settlement contributed by Layer No. 3 only.
Correct the previously calculated earthquake induced stress ratio in Layer No.3 to the equivalent
stress ratio that would be induced by an M=7.5 event:
From Eq(6) and Figure 22, γm = 1.32
(τav
/ σo' ) induced at M=7.5 = (0.16)(1/1.32) = 0.12
From Page B-3, (N1)60 = 6, and from Figure 21, εV = 3.3%
Layer No.3 is 10 ft. thick, therefore
Settlement = (3.3/100)(10)(12) = 4 in.
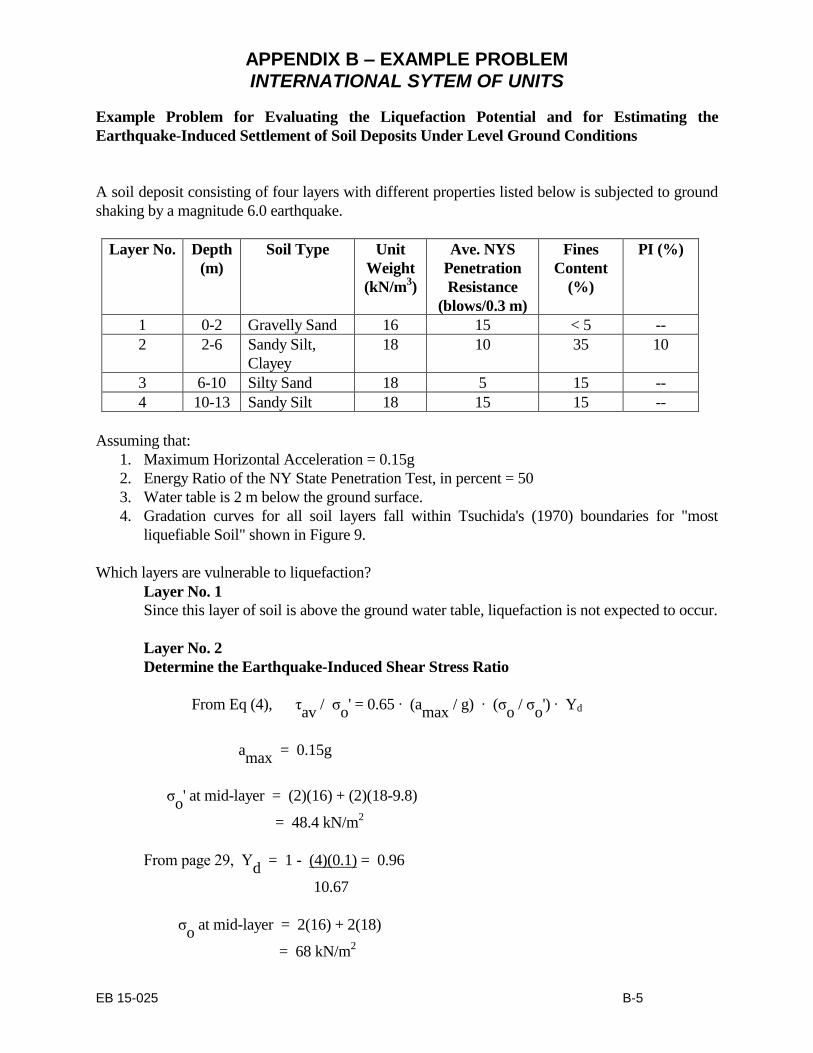
APPENDIX B – EXAMPLE PROBLEM INTERNATIONAL SYTEM OF UNITS
EB 15-025 B-5
Example Problem for Evaluating the Liquefaction Potential and for Estimating the
Earthquake-Induced Settlement of Soil Deposits Under Level Ground Conditions
A soil deposit consisting of four layers with different properties listed below is subjected to ground
shaking by a magnitude 6.0 earthquake.
Layer No. Depth
(m)
Soil Type Unit
Weight
(kN/m3)
Ave. NYS
Penetration
Resistance
(blows/0.3 m)
Fines
Content
(%)
PI (%)
1 0-2 Gravelly Sand 16 15 < 5 --
2 2-6 Sandy Silt,
Clayey
18 10 35 10
3 6-10 Silty Sand 18 5 15 --
4 10-13 Sandy Silt 18 15 15 --
Assuming that:
1. Maximum Horizontal Acceleration = 0.15g
2. Energy Ratio of the NY State Penetration Test, in percent = 50
3. Water table is 2 m below the ground surface.
4. Gradation curves for all soil layers fall within Tsuchida's (1970) boundaries for "most
liquefiable Soil" shown in Figure 9.
Which layers are vulnerable to liquefaction?
Layer No. 1
Since this layer of soil is above the ground water table, liquefaction is not expected to occur.
Layer No. 2
Determine the Earthquake-Induced Shear Stress Ratio
From Eq (4), τav
/ σo' = 0.65 ∙ (a
max / g) ∙ (σ
o / σ
o') ∙ Yd
amax
= 0.15g
σo' at mid-layer = (2)(16) + (2)(18-9.8)
= 48.4 kN/m2
From page 29, Υd
= 1 - (4)(0.1) = 0.96
10.67
σo at mid-layer = 2(16) + 2(18)
= 68 kN/m2
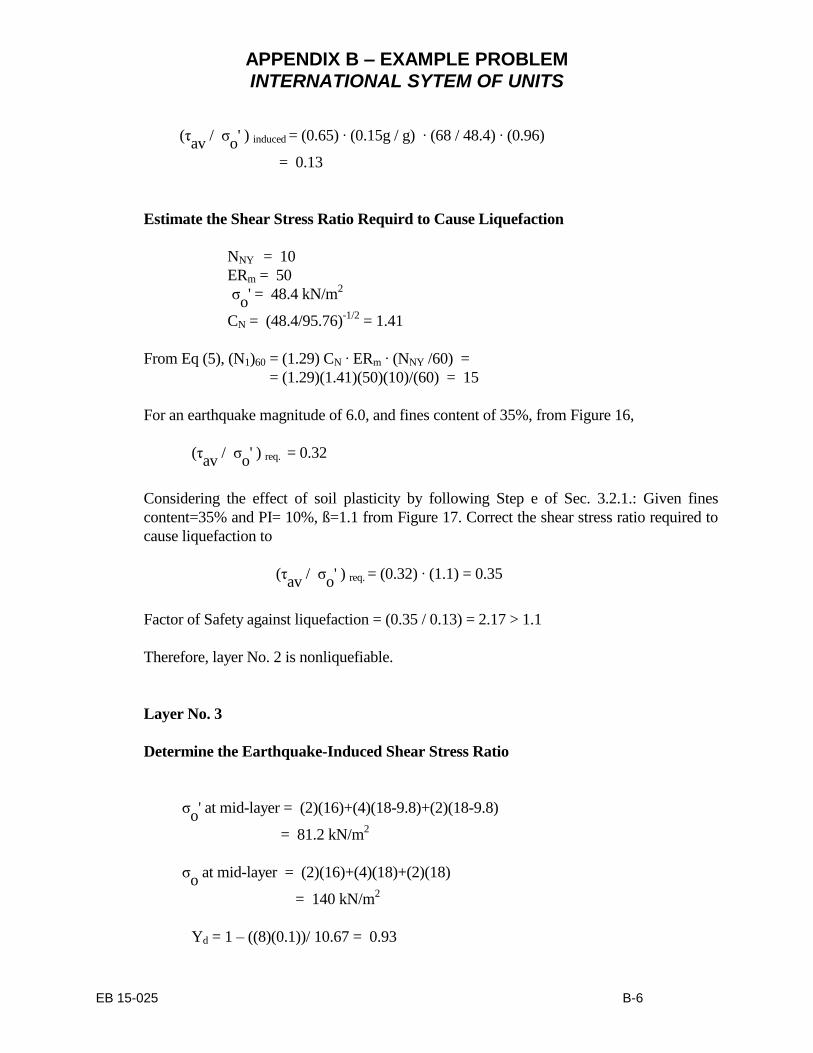
APPENDIX B – EXAMPLE PROBLEM INTERNATIONAL SYTEM OF UNITS
EB 15-025 B-6
(τav
/ σo' ) induced = (0.65) ∙ (0.15g / g) ∙ (68 / 48.4) ∙ (0.96)
= 0.13
Estimate the Shear Stress Ratio Requird to Cause Liquefaction
NNY = 10
ERm = 50
σo' = 48.4 kN/m
2
CN = (48.4/95.76)-1/2
= 1.41
From Eq (5), (N1)60 = (1.29) CN ∙ ERm ∙ (NNY /60) =
= (1.29)(1.41)(50)(10)/(60) = 15
For an earthquake magnitude of 6.0, and fines content of 35%, from Figure 16,
(τav
/ σo' ) req. = 0.32
Considering the effect of soil plasticity by following Step e of Sec. 3.2.1.: Given fines
content=35% and PI= 10%, ß=1.1 from Figure 17. Correct the shear stress ratio required to
cause liquefaction to
(τav
/ σo' ) req. = (0.32) ∙ (1.1) = 0.35
Factor of Safety against liquefaction = (0.35 / 0.13) = 2.17 > 1.1
Therefore, layer No. 2 is nonliquefiable.
Layer No. 3
Determine the Earthquake-Induced Shear Stress Ratio
σo' at mid-layer = (2)(16)+(4)(18-9.8)+(2)(18-9.8)
= 81.2 kN/m2
σo at mid-layer = (2)(16)+(4)(18)+(2)(18)
= 140 kN/m2
Yd = 1 – ((8)(0.1))/ 10.67 = 0.93
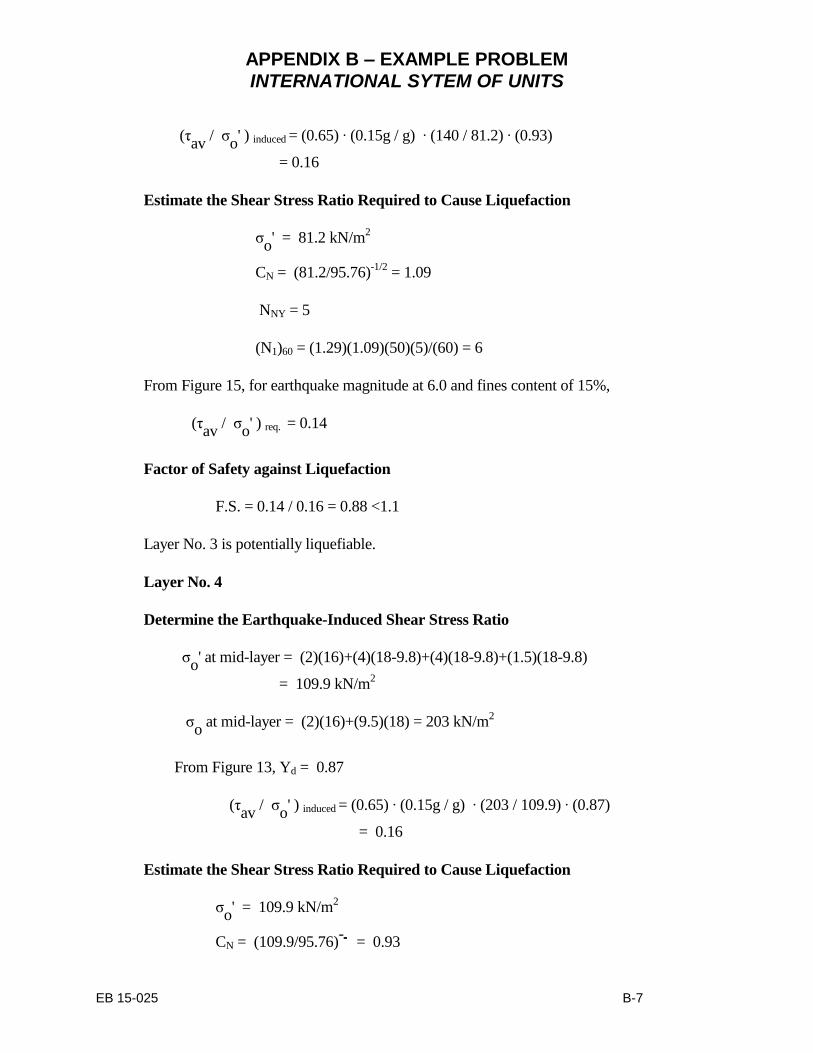
APPENDIX B – EXAMPLE PROBLEM INTERNATIONAL SYTEM OF UNITS
EB 15-025 B-7
(τav
/ σo' ) induced = (0.65) ∙ (0.15g / g) ∙ (140 / 81.2) ∙ (0.93)
= 0.16
Estimate the Shear Stress Ratio Required to Cause Liquefaction
σo' = 81.2 kN/m
2
CN = (81.2/95.76)-1/2
= 1.09
NNY = 5
(N1)60 = (1.29)(1.09)(50)(5)/(60) = 6
From Figure 15, for earthquake magnitude at 6.0 and fines content of 15%,
(τav
/ σo' ) req. = 0.14
Factor of Safety against Liquefaction
F.S. = 0.14 / 0.16 = 0.88 <1.1
Layer No. 3 is potentially liquefiable.
Layer No. 4
Determine the Earthquake-Induced Shear Stress Ratio
σo' at mid-layer = (2)(16)+(4)(18-9.8)+(4)(18-9.8)+(1.5)(18-9.8)
= 109.9 kN/m2
σo at mid-layer = (2)(16)+(9.5)(18) = 203 kN/m
2
From Figure 13, Yd = 0.87
(τav
/ σo' ) induced = (0.65) ∙ (0.15g / g) ∙ (203 / 109.9) ∙ (0.87)
= 0.16
Estimate the Shear Stress Ratio Required to Cause Liquefaction
σo' = 109.9 kN/m
2
CN = (109.9/95.76)-2
= 0.93
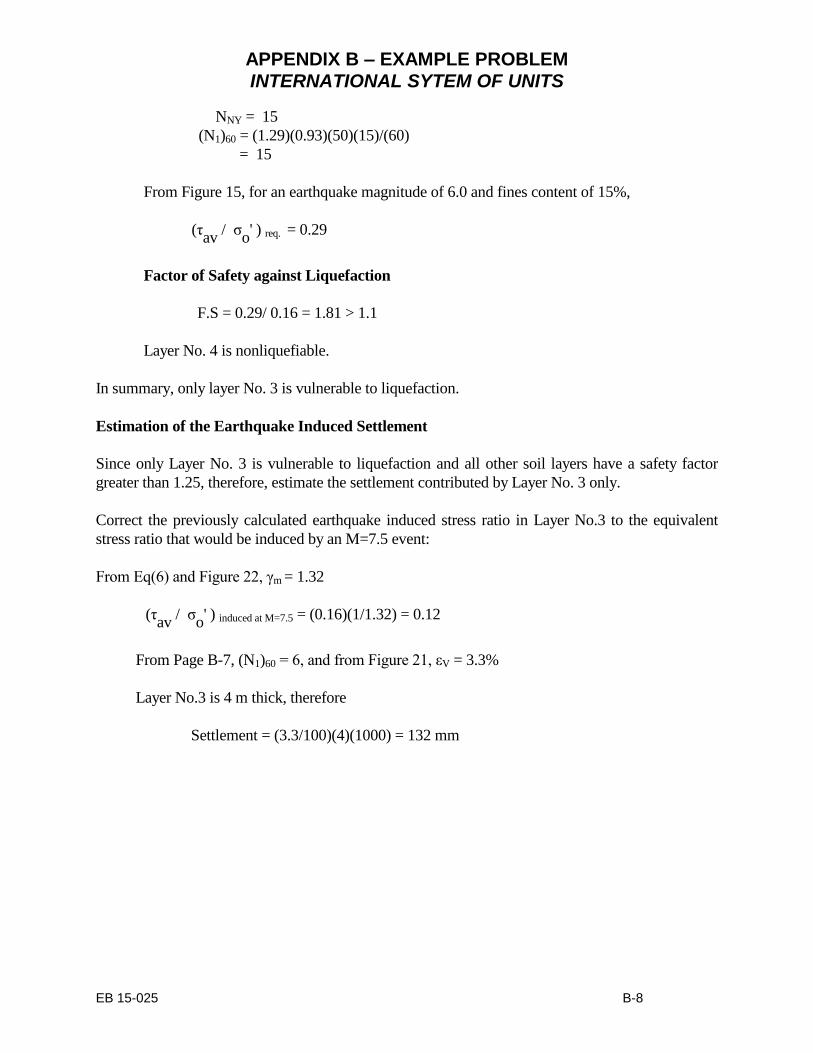
APPENDIX B – EXAMPLE PROBLEM INTERNATIONAL SYTEM OF UNITS
EB 15-025 B-8
NNY = 15
(N1)60 = (1.29)(0.93)(50)(15)/(60)
= 15
From Figure 15, for an earthquake magnitude of 6.0 and fines content of 15%,
(τav
/ σo' ) req. = 0.29
Factor of Safety against Liquefaction
F.S = 0.29/ 0.16 = 1.81 > 1.1
Layer No. 4 is nonliquefiable.
In summary, only layer No. 3 is vulnerable to liquefaction.
Estimation of the Earthquake Induced Settlement
Since only Layer No. 3 is vulnerable to liquefaction and all other soil layers have a safety factor
greater than 1.25, therefore, estimate the settlement contributed by Layer No. 3 only.
Correct the previously calculated earthquake induced stress ratio in Layer No.3 to the equivalent
stress ratio that would be induced by an M=7.5 event:
From Eq(6) and Figure 22, γm = 1.32
(τav
/ σo' ) induced at M=7.5 = (0.16)(1/1.32) = 0.12
From Page B-7, (N1)60 = 6, and from Figure 21, εV = 3.3%
Layer No.3 is 4 m thick, therefore
Settlement = (3.3/100)(4)(1000) = 132 mm
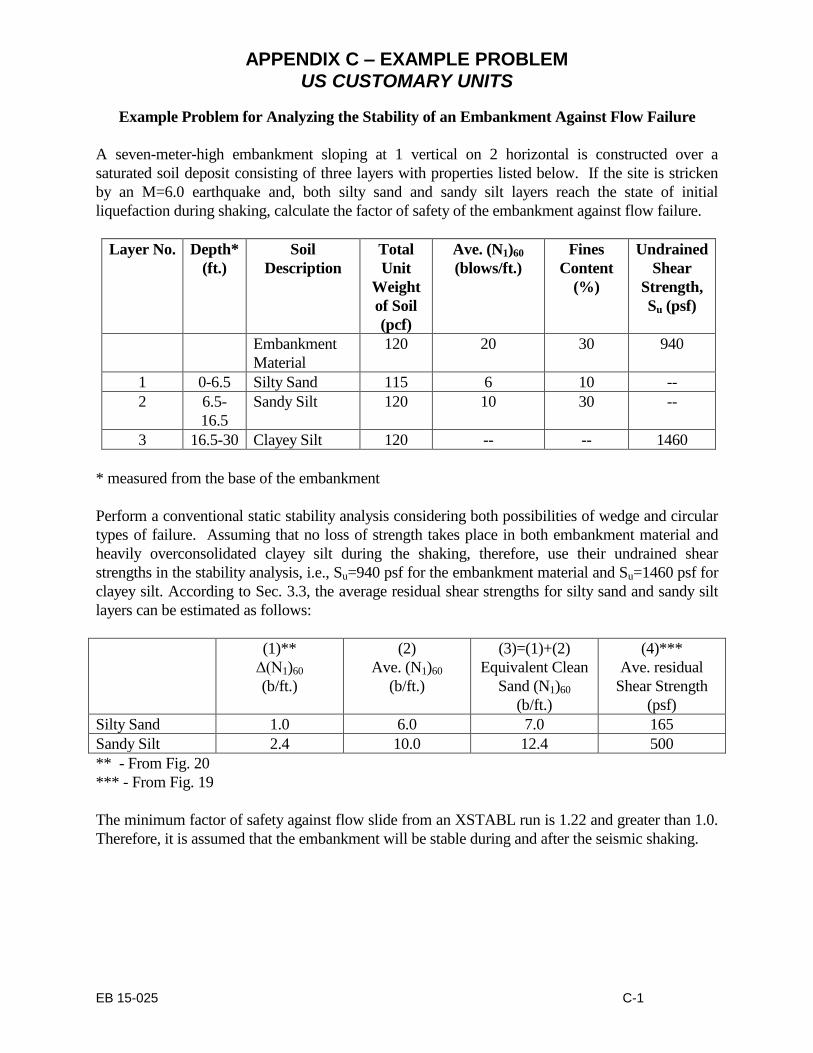
APPENDIX C – EXAMPLE PROBLEM US CUSTOMARY UNITS
EB 15-025 C-1
Example Problem for Analyzing the Stability of an Embankment Against Flow Failure
A seven-meter-high embankment sloping at 1 vertical on 2 horizontal is constructed over a
saturated soil deposit consisting of three layers with properties listed below. If the site is stricken
by an M=6.0 earthquake and, both silty sand and sandy silt layers reach the state of initial
liquefaction during shaking, calculate the factor of safety of the embankment against flow failure.
Layer No. Depth*
(ft.)
Soil
Description
Total
Unit
Weight
of Soil
(pcf)
Ave. (N1)60
(blows/ft.)
Fines
Content
(%)
Undrained
Shear
Strength,
Su (psf)
Embankment
Material
120 20 30 940
1 0-6.5 Silty Sand 115 6 10 --
2 6.5-
16.5
Sandy Silt 120 10 30 --
3 16.5-30 Clayey Silt 120 -- -- 1460
* measured from the base of the embankment
Perform a conventional static stability analysis considering both possibilities of wedge and circular
types of failure. Assuming that no loss of strength takes place in both embankment material and
heavily overconsolidated clayey silt during the shaking, therefore, use their undrained shear
strengths in the stability analysis, i.e., Su=940 psf for the embankment material and Su=1460 psf for
clayey silt. According to Sec. 3.3, the average residual shear strengths for silty sand and sandy silt
layers can be estimated as follows:
(1)**
Δ(N1)60
(b/ft.)
(2)
Ave. (N1)60
(b/ft.)
(3)=(1)+(2)
Equivalent Clean
Sand (N1)60
(b/ft.)
(4)***
Ave. residual
Shear Strength
(psf)
Silty Sand 1.0 6.0 7.0 165
Sandy Silt 2.4 10.0 12.4 500
** - From Fig. 20
*** - From Fig. 19
The minimum factor of safety against flow slide from an XSTABL run is 1.22 and greater than 1.0.
Therefore, it is assumed that the embankment will be stable during and after the seismic shaking.
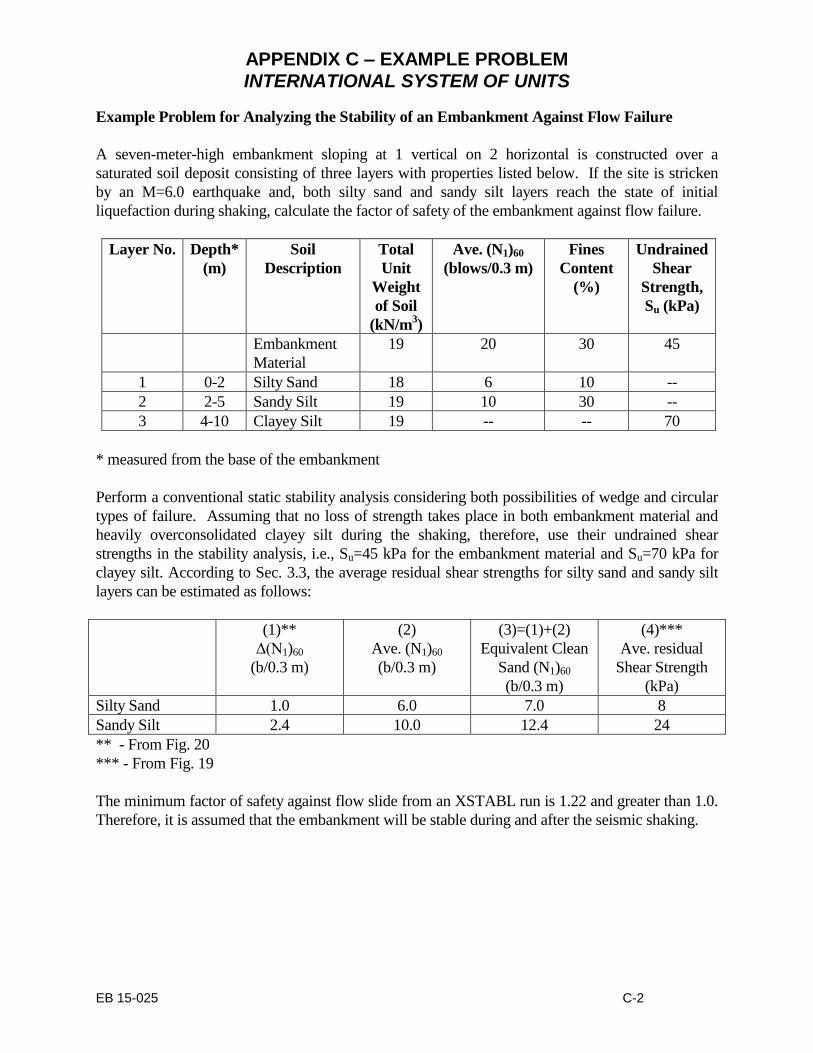
APPENDIX C – EXAMPLE PROBLEM INTERNATIONAL SYSTEM OF UNITS
EB 15-025 C-2
Example Problem for Analyzing the Stability of an Embankment Against Flow Failure
A seven-meter-high embankment sloping at 1 vertical on 2 horizontal is constructed over a
saturated soil deposit consisting of three layers with properties listed below. If the site is stricken
by an M=6.0 earthquake and, both silty sand and sandy silt layers reach the state of initial
liquefaction during shaking, calculate the factor of safety of the embankment against flow failure.
Layer No. Depth*
(m)
Soil
Description
Total
Unit
Weight
of Soil
(kN/m3)
Ave. (N1)60
(blows/0.3 m)
Fines
Content
(%)
Undrained
Shear
Strength,
Su (kPa)
Embankment
Material
19 20 30 45
1 0-2 Silty Sand 18 6 10 --
2 2-5 Sandy Silt 19 10 30 --
3 4-10 Clayey Silt 19 -- -- 70
* measured from the base of the embankment
Perform a conventional static stability analysis considering both possibilities of wedge and circular
types of failure. Assuming that no loss of strength takes place in both embankment material and
heavily overconsolidated clayey silt during the shaking, therefore, use their undrained shear
strengths in the stability analysis, i.e., Su=45 kPa for the embankment material and Su=70 kPa for
clayey silt. According to Sec. 3.3, the average residual shear strengths for silty sand and sandy silt
layers can be estimated as follows:
(1)**
Δ(N1)60
(b/0.3 m)
(2)
Ave. (N1)60
(b/0.3 m)
(3)=(1)+(2)
Equivalent Clean
Sand (N1)60
(b/0.3 m)
(4)***
Ave. residual
Shear Strength
(kPa)
Silty Sand 1.0 6.0 7.0 8
Sandy Silt 2.4 10.0 12.4 24
** - From Fig. 20
*** - From Fig. 19
The minimum factor of safety against flow slide from an XSTABL run is 1.22 and greater than 1.0.
Therefore, it is assumed that the embankment will be stable during and after the seismic shaking.