Embed Size (px)
Citation preview
13th World Conference on Earthquake Engineering Vancouver, B.C., Canada
August 1-6, 2004 Paper No. 2880
LIQUEFACTION HAZARD MITIGATION USING VERTICAL COMPOSITE DRAINS
Kyle ROLLINS1, Joshua K.S. ANDERSON2, R. Robert GOUGHNOUR3, Aaron K. MCCAIN4
SUMMARY Liquefaction has typically been mitigated by in-situ densification; however vertical composite drains offer the possibility of preventing liquefaction and associated settlement while reducing the cost and time required for treatment. To evaluate the behavior of these drains, controlled blasting techniques were employed to liquefy loose sand at two field test sites. Similar blast charges were then detonated at adjacent sites treated with drains. Measurements demonstrated that the drains could significantly increase the rate of pore pressure dissipation and reduce settlement. In addition, the installation process typically densified the surrounding soil, thereby decreasing the liquefaction potential. Computer analyses successfully matched the measured response.
INTRODUCTION Liquefaction and the resulting loss of shear strength can lead to landslides, lateral spreading of bridge abutments and wharfs, loss of vertical and lateral bearing support for foundations, and excessive foundation settlement and rotation. Liquefaction resulted in nearly $1 billion worth of damage during the 1964 Niigata Japan earthquake (NRC, [1]), $99 million damage in the 1989 Loma Prieta earthquake (Holzer, [2]), and over $11.8 billion in damage to ports and wharf facilities in the 1995 Kobe earthquake (EQE, [3]). The loss of these major port facilities subsequently led to significant indirect economic losses Typically, liquefaction hazards have been mitigated by densifying the soil in-situ using techniques such as vibro-compaction, deep soil mixing, dynamic compaction, or explosive compaction. While these techniques have generally proven effective in clean sands, they are less successful for sands with higher fines contents. An alternative to densifying the sand is to provide drainage so that the excess pore water pressures generated by the earthquake shaking are rapidly dissipated thereby preventing liquefaction from occurring. The concept of using vertical gravel drains for liquefaction mitigation was pioneered by Seed and Booker [4]. They developed design charts that could be used to determine drain diameter and 1 Prof., Civil & Environ. Engrg. Dept., Brigham Young Univ., Provo, UT, [email protected] 2 Staff Engineer, Mendenhall-Smith, Inc., Las Vegas, NV 3 Geotechnical Engineer, Nilex, Inc., Leesburg, VA 4 Project Engineer, GeoEngineers, Bellingham, WA

spacing. Improved curves which account for head loss in the drains were developed by Onoue [5]. Although gravel drains or stone columns have been utilized at many sites for liquefaction mitigation, many designers have relied on the densification provided by the stone column installation rather than the drainage. Some investigators suspect that significant settlement might still occur even if drainage prevents liquefaction. In addition, investigators have found that sand infiltration can reduce the hydraulic conductivity and flow capacity of gravel drains in practice relative to lab values (Boulanger et al [6]). One recent innovation for providing drainage is the use of vertical, slotted plastic drain pipes known as “EQ drains”, 75 to 150 mm in diameter. These drains are installed with a vibrating steel mandrel in much the same way that smaller pre-fabricated vertical drains (PVDs) are installed for consolidation of clays. The EQ drains are typically placed in a triangular grid pattern at center-to-center spacings of 1 to 2 m depending on the permeability of the treated soil. In contrast to conventional PVDs, which have limited flow capacity (2.83 x 10⁻⁵ m3/sec, for a gradient of 0.25), a 100 mm diameter drain can carry very large flow volumes (0.093 m3/sec) sufficient to relieve water pressure in sands. This flow volume is more than 10 times greater than that provided by a typical 1 m diameter stone column (6.51x10⁻³ m3/sec). Filter fabric tubes are placed around the drains to prevent infiltration of silt and sand. These vertical drains can be installed more rapidly and at a fraction of the cost of stone columns. Typically, drains can be installed at 25% to 40% of the cost of stone columns. In addition, the drains can be installed in about one-third to one-half of the time required for stone columns. In addition, the time and cost associated with quality assurance efforts to evaluate the improvement produced by densification are virtually eliminated when drains are used. Although vertical drains have already been used at a few sites in the US, no installation has experienced an earthquake. This lack of field performance data is a major impediment to expanding the use of this technique. In addition, there is very little data available to indicate what degree of densification would be produced during drain installation and how this would improve overall performance. Rather than instrumenting a field site and waiting for an earthquake to test the drain behavior, we have used controlled blasting techniques to produce liquefaction under field conditions and compared behavior with and without vertical drains. This paper describes field tests performed at the Treasure Island NGES site in San Francisco Bay and at a CANALEX test site in Vancouver, BC.
BLAST TESTING AT TREASURE ISLAND
Drain performance at the Treasure Island test site was evaluated by installing several drain clusters at one site and comparing the pore pressure and settlement behavior with an untreated adjacent site after blasting. Treasure Island is a 1.62 km2 man-made island immediately northwest of the rock outcrop on Yerba Buena Island in San Francisco Bay. It was constructed in 1936-37 by hydraulic and clamshell dredging. A perimeter rock dike was built which acted as a retaining system for the sand that was placed by hydraulic filling inside. Treasure Island served as a US naval installation since World War II, but was recently decommissioned as part of a nation-wide base closure. Sand boils and lateral spreading were observed due to liquefaction of the hydraulic sand fill during the 1989 Loma Prieta earthquake. Treasure Island is also a National Geotechnical Experimentation Site (NGES), therefore a substantial amount of geotechnical data was available in the vicinity of the site. Drain Properties The corrugated ADS drain pipes used in the study had an inside diameter of 10.2 cm and a flow area of 81.7 cm2. The corrugations on the drains were 9.5 mm deep, so the outside diameter was 120.7 mm. Three horizontal slots, approximately 25 mm long, were cut into each corrugation. This gave the drains an orifice area of 40.2 cm2/m. A standard ADS filter fabric or “sock” was placed around some of the drains to prevent infiltration of sand. The fabric had a permittivity of 0.33 cubic meters of water per

second per square meter of fabric per meter of head and an AOS that corresponds to a #50 sieve. Based on the median grain size determined during the geotechnical investigation this filter fabric met the filter criteria listed by both Carrol [7] and Giroud [8]. Soil Properties Geotechnical investigations were carried out at both the untreated site and the drain site and the soil profile and properties were essentially equivalent at both sites. The soil profile consisted of hydraulically placed fill and native shoal sands to a depth of 4.2 m. The sand typically classified as SP-SM material according to the Unified Soil Classification system (USCS) and generally had a D50 between 0.2 and 0.3 mm. This sand was underlain by silty sand (SM) to a depth of 7.5 m. The silty sand was underlain by Young Bay Mud. The water table was approximately 0.15 m below the ground surface during testing. In-situ tests included standard penetration tests (SPT) and cone penetration tests (CPT). As shown in Fig. 1, the (N1)60 values in the sand typically ranged from 7 to 16 in the cleaner sand layer but dropped to about 6 in the silty sand. Six CPT tests were performed across each test site and the average values for the two sites were very similar. The average cone resistance, shown in Fig. 1, was typically about 14 MPa in the upper meter of the profile but dropped to between 6 to 9 MPa in the upper sand layer and 4 to 6 MPa in the underlying silty sand layer.
0
1
2
3
4
5
6
7
8
0 5 10 15 20 25
CPT Cone Resistance, qc1
(MPa)
Pre-Drain MeanMean-SDMean+SDPost-Drain
0
1
2
3
4
5
6
7
8
0 10 20 30
SPT Blow Count, N1(60)(Blows/300 mm)
0
1
2
3
4
5
6
7
8
0 20 40 60 80 100
Relative Density, Dr
(%)
CPT-Before DrainsCPT-After DrainsSPT
Interpreted Soil Profile
0
1
2
3
4
5
6
7
8
0 0.1 0.2 0.3 0.4 0.5 0.6 0.7 0.8 0.9 1
Dep
th B
elow
Exc
avat
ed S
urfa
ce (m
) Interbedded Fine SandandSilty Sand(SP-SM)
Fine Silty Sand (SM)
Fine Sandw/ Shells(SP)
Silty Clay (CL)
Fig. 1 Soil profile along with profiles of CPT cone tip resistance, SPT blow count and interpreted relative density before and after drain installation at Treasure Island test site.

The relative density (Dr) based on the SPT was computed using the equation
5.0601
40)(
=
NDr(1)
developed by Kulhawy and Mayne (1990). The relative density based on the CPT was computed using the equation (2)
p
5.0
1
305
= a
c
r
q
D developed by Kulhawy and Mayne [9] where pa is atmospheric pressure and the sand is assumed to be normally consolidated The estimated Dr was typically between 40 and 60% in the clean sand layers and dropped to about 35% in the silty sands. The interpreted Dr was generally very similar for both sites and indicates that the liquefaction susceptibility of the drain site is at least as high as that for the untreated site. Drain Installation and Layout Fig. 2 presents the layout of blast holes at the untreated site as well as the layout of the blast holes and drain clusters at the treated site. The same blast charges and layout were used for the adjacent untreated test site. The drain pipes were attached to a steel anchor plate and pushed to the target depth of 7.6 m using a mandrel. The mandrel was then withdrawn leaving the drain in place. The mandrel was contained within a mast mounted to a converted CAT 235 excavator with a 149 kW engine. A downward force of 133.4 kN could be applied to the mandrel along with a vibratory energy of 113 J produced by an eccentric mass. The mandrel consisted of a 165 mm OD steel pipe with three 200 mm x 12.75 mm fins extending from the pipe. The fins were attached to increase the installation induced vibration and settlements. One drain could typically be installed to the design depth of 7.6 m in 2 to 3 minutes. Initially, some difficulty was encountered in anchoring the drains because the clay below the sand was relatively soft. However, larger anchor plates solved this problem. The drains were installed in clusters of seven drains each, arranged so that six of the drains formed the corners of a hexagon while the seventh was placed directly in the center. This layout duplicated the triangular spacing that is normally employed over a much larger area. Theoretically, the drain at the center of the cluster would behave the same as a typical drain in a large group of drains since it was surrounded on all sides by drains. Wick drain clusters were also installed along with the earthquake drains for comparison purposes. Each cluster was installed with the attributes listed in Table 1, which indicate drain type, drain spacing, use of a filter fabric, and relative amount of vibration energy during installation. By varying these properties, the performance of the drains could be observed in slightly different situations during the test blast. However, this also added other sources of variability to the results. Installation Induced Soil Improvement Over 110 survey stakes were placed in a grid throughout the site to evaluate settlement. The change in elevation of these stakes was used to determine settlement due to drain installation and due to blast-induced liquefaction. Significant settlement craters developed around each drain cluster during installation. This settlement was monitored at each cluster and the results are summarized in Table 1. The installation of wick drains caused practically no settlement.

Table 1 Installation induced settlements in drain clusters.
Cluster Cluster Characteristics Max. Settlement (mm) 2 Wick drain, 0.9m spacing, filter, no vibration 20 4 EQ-drain, 1.2 m spacing, filter, no vibration 130 1 EQ-drain, 1.2 m spacing, filter, normal vibration 185 7 EQ-drain, 1.2 m spacing, filter, increased vibration 210 6 EQ-drain, 0.9 m spacing, filter, increased vibration 260 8 EQ drain, 1.2 m spacing, no filter, maximum vibration 275
Cluster 2 (Wick Drains)
Cluster 5 (Wick Drains)
Cluster 4 Cluster 3
Cluster 7
Cluster 1
Cluster 6
Cluster 8
(a) (b)
2 4 6 8 8 4 6 2
6 4 2 Fig. 2 Settlement contours (in cm) for (a) the untreated test site and (b) the site treated with drains on Treasure Island. Blast charge locations are indicated by black dots. The clusters of earthquake drains installed with vibration and a finned mandrel (1, 3, 6, 7, 8) experienced considerably more settlement than the drains installed without vibration. The settlement in the drains installed without vibration ranged from 60 to 150 mm less than those drains installed with vibration. In fact, at Cluster 7 (drain, 1.2 m spacing, filter, increased vibration) and Cluster 8 (drain, 1.2 m spacing, no filter, max. vibration) the maximum settlements were twice as large as the maximum settlement of Cluster 4 (drain, 1.2 m spacing, filter, no vibration), where no vibration was employed. Assuming a soil profile with an average unit weight of 20.1 kN/m3 and an average height of 6.5 m the observed settlement

resulted in a 3-4% increase in unit weight and a volumetric strain of 2.8 to 4.2% when vibration was used to install the drain. One post-treatment CPT sounding was also performed within drain cluster 8 approximately one week after the installation of the drains. The cone tip resistance typically increased by 20 to 35% from the mean pre-treatment values (see Fig. 1). The estimated relative density of the sand after drain installation is also shown in Fig. 1 and there is typically an increase of 5 to 10 percentage points. Both the CPT and settlement data indicate that the installation procedure produced significant soil improvement as a side benefit. The increased density and decreased compressibility reduce the potential for earthquake induced settlement and will also increase the rate of pore pressure dissipation. Blast Testing In preparation for the test blast, the settlement craters that had developed during installation were backfilled with uncompacted sand to provide a level surface. A total of 16 explosive charges were detonated to produce a liquefied state. The charges were placed around the periphery of two 5 m diameter circles as shown in Fig. 2. Each charge consisted of ammonium nitrate and nitro-methane and produced the equivalent explosive energy of 0.5 kg of TNT. The charges were detonated two at a time with a delay of approximately 250 milliseconds. The charges were placed at the base of a drill hole at a depth of 3 m below the ground surface. The drill holes were backfilled with pea gravel so that the explosive energy would be directed horizontally rather than just vertically. Essentially, the same blast charges, blast delays, and layout were used for testing in both the drain test and untreated test areas. Shortly after the charge detonation water flowed out of both the wick drains and the earthquake drains. Pore pressure transducers were installed at comparable locations within drain clusters and in the untreated test area. The transducers were located within nylon cone tips which were pushed into the soil using hydraulic pressure on the drill rig. Each transducer was designed to survive transient blast pressures of up to 41.4 MPa, yet be sensitive enough to measure pressure variations as small as 0.69 kPa. The excess pore pressure measured by each transducer was divided by the vertical effective stress at that depth to obtain the excess pore pressure ratio, Ru. An Ru value of 1.0 indicates liquefaction, while an Ru of 0 indicates static water pressure. No consistent trends between rate of dissipation and drain spacing could be observed from the measured pore pressure data. This is likely due to the relatively large number of variables for each cluster and the relatively limited number of transducers. Nevertheless, some trends were clearly observed between treated and untreated areas. Fig. 3 presents a plot of the average Ru vs. time curve for transducers in the untreated test area in comparison with the curve for comparable transducers in the treated areas at a depth of 2.7 m. In both cases, the initial Ru value reached approximately one. The extreme pressures, generated in milliseconds, by the blasting process made it impossible for the drains to prevent initial liquefaction. However, in an earthquake, where excess pore pressures develop over tens of seconds, the drains would have time to be more effective. Therefore, for this investigation the primary concern was not simply the initial magnitude of the pore pressure but also the rate at which the pressures dissipated with time. Therefore, it is important to note that there was a rapid decrease in the Ru versus time curve for the site with drains relative to that for the untreated sites. The Ru value in the treated area dropped to about 0.10 but then rose to approximately 0.3 before dropping off again. Field measurements and computer analyses suggest that this rise in Ru is the result of sand infiltration in the drains. Although the drain fabric supposedly met filter criteria, subsequent lab tests confirmed that the sand could easily pass through the filter fabric. Following the blast, measurements of the depth of sand in each drain indicated that significant sand infiltration had occurred. In addition, computer analyses using FEQDrain developed by Pestana et al [10] matched the rapid drop in Ru assuming that the drains were fully open as shown in Fig. 4. However, the computed pore pressure ratio
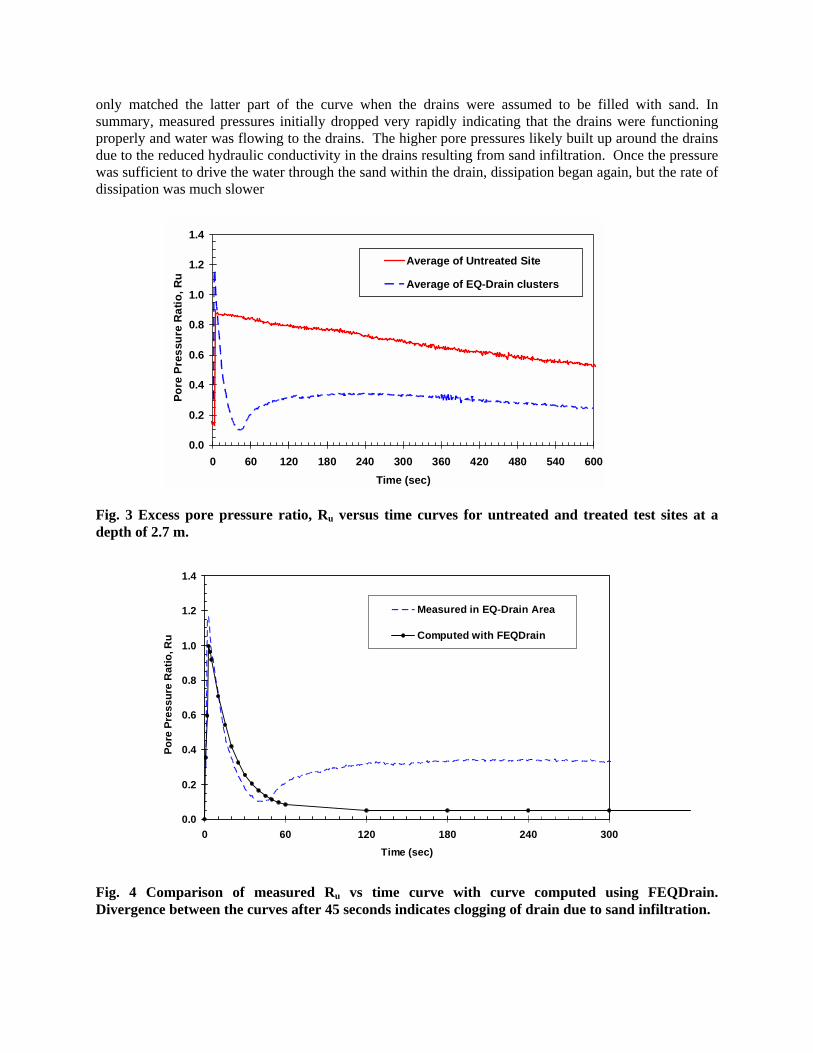
only matched the latter part of the curve when the drains were assumed to be filled with sand. In summary, measured pressures initially dropped very rapidly indicating that the drains were functioning properly and water was flowing to the drains. The higher pore pressures likely built up around the drains due to the reduced hydraulic conductivity in the drains resulting from sand infiltration. Once the pressure was sufficient to drive the water through the sand within the drain, dissipation began again, but the rate of dissipation was much slower
0.0
0.2
0.4
0.6
0.8
1.0
1.2
1.4
0 60 120 180 240 300 360 420 480 540 600Time (sec)
Pore
Pre
ssur
e R
atio
, Ru
Average of Untreated Site
Average of EQ-Drain clusters
Fig. 3 Excess pore pressure ratio, Ru versus time curves for untreated and treated test sites at a depth of 2.7 m.
0.0
0.2
0.4
0.6
0.8
1.0
1.2
1.4
0 60 120 180 240 300Time (sec)
Pore
Pre
ssur
e R
atio
, Ru
Measured in EQ-Drain Area
Computed with FEQDrain
Fig. 4 Comparison of measured Ru vs time curve with curve computed using FEQDrain. Divergence between the curves after 45 seconds indicates clogging of drain due to sand infiltration.

Settlement response Contour maps of the blast-induced settlement for the untreated and drain test sites are presented in Fig. 2(a) and 2(b), respectively. The settlement contours in the untreated test area are generally concentric about the center of the test area and the maximum settlement is 9.5 cm. In contrast to the untreated site, the settlement in the drain test site is generally concentrated in the quadrant of the site where drains were not installed. The maximum settlement in this area (10.2 cm) is very similar to the maximum at the untreated test site. The settlement that occurred in the other parts of the drain test site, where more drain clusters were located, typically ranged between 2 and 4 cm. This is only 20-40% of the settlement that occurred in non-treated areas or at the untreated test site and represents a significant reduction in blast induced settlement. The maximum settlement in the treated area was located between the two blast zones within Cluster 6. Similar abnormal blast-induced settlement was observed around Clusters 7 and 8. This is initially contrary to expectations because these drain clusters also experienced the greatest settlement during installation and should have been the densest profiles. However, because these three clusters developed the largest craters during installation they also required the most backfilling to level them out. This backfill, consisting of sand from the site, was placed by hand and was not mechanically compacted in any way. Therefore, the settlement that occurred around these drain clusters may be largely attributed to settlement of the loose backfill material. While the densification produced by the drain installation likely had an effect on the settlement during the blast, drainage provided by the drains may be more accountable for the variation. If the installation induced settlements were responsible for the reduction in settlement at the site then there should have been a difference between the settlements around Cluster 1 installed with the finned mandrel and a vibratory push (19.5 cm maximum installation settlement) and Cluster 4 installed without vibration (13.1 cm maximum installation settlement). Instead, the blast-induced settlement was nearly identical at 3.0 cm in Cluster 4 and 3.4 cm in Cluster 1. Additionally, the area around the wick drains, which didn't experience any significant settlement during the installation process, experienced the lowest settlement during the blast. Earthquake Analysis Additional analyses were also performed for hypothetical earthquake events using the FEQDrain computer model which was calibrated based on the results of the blast testing. The earthquake was assumed to be a M7.75 event producing 20 stress cycles with a duration of 40 seconds (Seed et al [11]). The maximum computed excess pore pressure ratio (Ru) was 0.35 and the maximum settlement was 1.8 cm. This compares to a predicted settlement of 8 cm for the untreated profile (similar to measured blast induced settlement) for the earthquake event using techniques developed by Tokimatsu and Seed [12].
BLAST TESTING IN VANCOUVER, BRITISH COLUMBIA
Drain behavior at the Vancouver test site was evaluated by installing 35 earthquake drains at one site and comparing the pore pressure and settlement behavior with an adjacent untreated site after blasting. Fig. 5 shows the layout of the drains, blast charges and transducers at the drain test area. The same blast charges and layout were used for the adjacent untreated test site. The Vancouver earthquake drain tests were conducted at a test site near the south portal of the Massey tunnel which runs under the Fraser River. This site is within about 200 m of a test site thoroughly characterized in connection with the Canadian Liquefaction Experiment (CANALEX) (Wride et al, [13]). Drain Properties The same corrugated 120.7 mm OD drain pipes used for the Treasure Island tests were also used for the Vancouver test. However, an improved filter fabric (Synthetic Industries SB252) was used with a finer AOS of 50 microns. Additionally, the end of the fabric tube was tied to prevent infiltration. These changes prevented infiltration through the fabric into the drain pipe.

Soil Properties Two CPT soundings were performed to compare the soil properties at the drain test site with the untreated site and the cone tip resistance profiles can be compared in Fig. 5. The soil profiles were very similar at each site and generally consisted of silty sand and silt layers to a depth of about 5 m which were underlain by loose clean sand to a depth of about 15 m. The clean sand typically classified as SP material according to the USCS and generally had a D50 between 0.2 and 0.3 mm. The water table was approximately 2.8 m below the ground surface during testing. The average cone resistance was typically between 5 and 7 MPa in the clean sand layer. Based on the CPT correlation in Eq. 2, the relative density (Dr) in the loose sand was generally between 40 and 45% as shown in Fig. 5
Interpreted Soil Profile
0
1
2
3
4
5
6
7
8
9
10
11
12
13
14
15
Dep
th (m
)
Sand
Silty sand/sand
Silt and Sandy Silt
Sand to Silty Sand
Cone Tip Resistance qc (MPa)
0 2 4 6 8 10 12
UntreatedPre-DrainPost-Drain
Relative Density Dr (%)
0 20 40 60 80 100
UntreatedPre-DrainPost-Drain
Fig. 5 Soil profile along with CPT cone tip resistance and interpreted relative density profiles at untreated site and drain test site before and after drain installation. Drain Installation and Layout Fig.6 shows the layout of the drains and transducers as well as the location of the blast charges. The drains were installed in a triangular pattern with a spacing of 1.22 m center to center. The drain pipes were attached to 150 mm square steel anchor plates and pushed to the target depth of 12.8 m using the

finned mandrel described previously. The mandrel was installed using an ICE Model 44 vibratory hammer suspended from a 70 tonne mobile crane.
Drains spaced at 1.22 m on centers. Blast holes at 5 m from center drain.
KEYBlast Hole Earthquake Drain Pore Pressure Transducer
Fig. 6 Layout of earthquake drains, blast charges, and pore pressure transducers for Vancouver, BC drain test. Instrumentation Four pore pressure transducers were pushed into the ground around the center drain as shown in Fig. 6. The transducers were located at depths of 6.7, 9.1, 11.6, and 14.0 m below the ground surface. In the untreated test area, two transducers were installed at a depth of 8.2 m and two transducers were installed at a depth of 12.5 m. In addition, transducers were lowered to depths of 6.7 and 11.6 in the center drain pipe to provide a comparison between the pressure inside the drain and that in the surrounding soil. The transducer data was recorded using a laptop based data acquisition system which recorded at a rate of 10 Hz. Settlement was monitored using survey points along eight rays spaced at 45° angles extending from the center of each test area. The change in elevation of these points was used to determine settlement due to drain installation and the settlement due to blast-induced liquefaction. Blast induced settlement was also recorded using several string potentiometers attached to a cable which was stretched over the test site. Installation Induced Soil Improvement
-50
0
50
100
150
200
250
300
350
400
0 2 4 6 8 10 12 14
Radial Distance from Center Drain (m)
Set
tlem
ent (
mm
)
Approximate Edge of Drain Cluster
A plot of the drain installation induced settlement is presented in Fig. 7. Nearly 350 mm of settlement occurred at the center of the drain test area which decreased to about 50 mm at the periphery of the drain Fig. 7 Drain installation induced settlement profile as a function of distance from the center of the drain test site.

cluster. This differential settlement is likely due to arching against the surrounding untreated soil. The settlement trough produced by the drain installation was left in place prior to the blast testing. Although the drain installation clearly compacted the sand in the profile, CPT tests performed a few days after the insertion of the drains actually indicated that the cone tip resistance had dropped to about half of its original value. However, the cone tip resistance did eventually increase as discussed subsequently. Blast Testing A total of 16 explosive charges were detonated to produce a liquefied state. Four charges were placed in each of four holes around the periphery of a 5 m radius circle as shown in Fig. 5. In each hole, charges of 1.8, 1.8, 1.8 and 2.7 kg were placed at depths of 5, 8, 11, and 14 m, respectively. The charges were detonated one at a time with a delay of approximately 500 milliseconds. The total energy of the explosvive charges was about four times greater than that used for the Treasure Island tests. Pore Pressure Response Shortly after the first four charges were detonated around the drain test site, water began rapidly flowing out of the drains indicating that high pore pressures had been produced. The measured pore pressure time histories also indicated that liquefaction was produced in about three or four stress cycles produced by the blasting. The large blast weights and the low liquefaction resistance of the loose sand combined to produce the rapid liquefaction. This blast sequence represents an extreme loading that is more severe than many earthquakes. Plots of Ru vs. time for transducers in the untreated test site and drain test site are presented in Fig. 8 for two depths. In addition, Ru vs. time plots are provided for the transducers positioned in the drains themselves. Although the drains were insufficient to prevent initial liquefaction, the rate of dissipation at both depths was significantly greater in the drain test area than in the untreated area. This clearly indicates that the drains were performing their function. The Ru value in the drains themselves also rose following blasting due to water flowing out of the drain and ponding on the ground surface at an elevation more than 2 m above the original static water table. Once the Ru in the ground dropped below the Ru in the drain, the drains no longer provided any benefit and the dissipation rate became equal to that of the untreated soil. Eventually the ponded surface water flowed back down the drains and the static water level was re-established. Settlement Response Plots of liquefaction induced settlement vs. distance from the center of the drain test area and the untreated test area are shown in Fig. 9. Despite the fact that initial liquefaction occurred in both test areas, the maximum settlement in the untreated test area was 30 to 65% higher than that in the drain test area. In addition, the settlement within the drain test area was much more uniform than what was observed for the untreated test area. Part of the reduction in settlement is likely due to the densification produced by the installation of the drains; however, as shown by the Treasure Island testing, some of the reduction is likely due to the increased rate of dissipation Improvement Evaluation using CPT Tests CPT tests were performed periodically after the blasting to evaluate improvement with time. The CPT cone resistance gradually increased with time up to about one month after the blasting them remain relatively constant. A plot of the average cone resistance with depth after about one month is presented in Fig. 5 for comparison with the untreated site for comparison. A substantial increase in the cone resistance is evident in the zone from 6 to 13 m. The relative density interpreted from the CPT test indicates that the relative density typically increased from about 40% before blasting to about 60% after drain installation and blasting as shown in Fig. 5. Similar testing at the untreated site suggests that a little more than half of this improvement resulted from drain installation and the rest was due to blasting.

-0.2
0.0
0.2
0.4
0.6
0.8
1.0
1.2
0 5 10 15 20 25 30 35 40 45 50 55 60Time (minutes)
Exc
ess
Por
e P
resu
re R
atio
, Ru
Soil in Untreated Area-8.2 m depth
Soil in Drain Test Area-6.7 m depth
Inside Drain-6.7 m depth
-0.2
0.0
0.2
0.4
0.6
0.8
1.0
1.2
0 5 10 15 20 25 30 35 40 45 50 55 60Time (minutes)
Exc
ess
Por
e P
ress
ure
Rat
io,
Ru
Soil in Untreated Area-12.5 m depth
Soil in Drain Test Area-11.6 m depth
Inside Drain-11.6 m depth
Fig. 8 Comparison of Ru vs. time curves for the transducers in the drain test and untreated test sites in Vancouver at two depth levels.
0
100
200
300
400
500
600
0 5 10 15
Radial Distance From Center of Test Area (m)
Set
tlem
ent
(mm
)
20
Drain Test Area
Untreated Test Area
Fig. 9 Liquefaction induced settlement versus radial distance from the center of the drain test and untreated test areas.
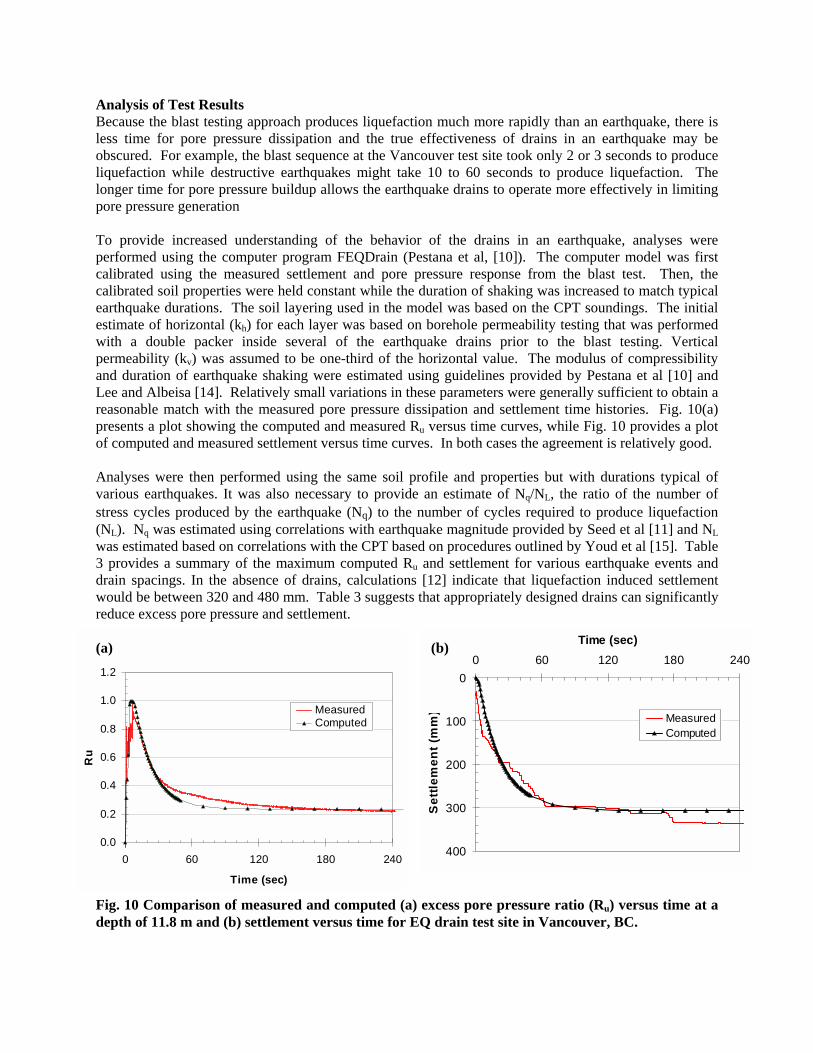
Analysis of Test Results Because the blast testing approach produces liquefaction much more rapidly than an earthquake, there is less time for pore pressure dissipation and the true effectiveness of drains in an earthquake may be obscured. For example, the blast sequence at the Vancouver test site took only 2 or 3 seconds to produce liquefaction while destructive earthquakes might take 10 to 60 seconds to produce liquefaction. The longer time for pore pressure buildup allows the earthquake drains to operate more effectively in limiting pore pressure generation To provide increased understanding of the behavior of the drains in an earthquake, analyses were performed using the computer program FEQDrain (Pestana et al, [10]). The computer model was first calibrated using the measured settlement and pore pressure response from the blast test. Then, the calibrated soil properties were held constant while the duration of shaking was increased to match typical earthquake durations. The soil layering used in the model was based on the CPT soundings. The initial estimate of horizontal (kh) for each layer was based on borehole permeability testing that was performed with a double packer inside several of the earthquake drains prior to the blast testing. Vertical permeability (kv) was assumed to be one-third of the horizontal value. The modulus of compressibility and duration of earthquake shaking were estimated using guidelines provided by Pestana et al [10] and Lee and Albeisa [14]. Relatively small variations in these parameters were generally sufficient to obtain a reasonable match with the measured pore pressure dissipation and settlement time histories. Fig. 10(a) presents a plot showing the computed and measured Ru versus time curves, while Fig. 10 provides a plot of computed and measured settlement versus time curves. In both cases the agreement is relatively good. Analyses were then performed using the same soil profile and properties but with durations typical of various earthquakes. It was also necessary to provide an estimate of Nq/NL, the ratio of the number of stress cycles produced by the earthquake (Nq) to the number of cycles required to produce liquefaction (NL). Nq was estimated using correlations with earthquake magnitude provided by Seed et al [11] and NL was estimated based on correlations with the CPT based on procedures outlined by Youd et al [15]. Table 3 provides a summary of the maximum computed Ru and settlement for various earthquake events and drain spacings. In the absence of drains, calculations [12] indicate that liquefaction induced settlement would be between 320 and 480 mm. Table 3 suggests that appropriately designed drains can significantly reduce excess pore pressure and settlement.
0
2
4
6
8
0
2
0 60 120 180 240
Time (sec)
Ru
Measured Computed
0
100
200
300
400
0 60 120 180 240
Time (sec)
Set
tlem
ent (
mm
) MeasuredComputed
(a) (b)
0. 0.
0.
0.
0.
1.
1.
Fig. 10 Comparison of measured and computed (a) excess pore pressure ratio (Ru) versus time at a depth of 11.8 m and (b) settlement versus time for EQ drain test site in Vancouver, BC.

Table 3 Summary of computed maximum Ru and settlement for various earthquake events and drain spacings at the Vancouver site.
Magnitude
Duration
(sec)
Nq/Nl
Drain Spacing
(m)
Maximum. Ru
Settlement
(mm) Blast 8 4.0 1.22 1.0 310 6.0 8 2.0 0.91 0.40 31
6.75 17 2.0 0.91 0.47 35 6.75 17 3.0 0.91 0.61 48 7.5 35 2.0 0.91 0.65 53
CONCLUSIONS
1. Earthquake drains offer a side benefit of inducing significant settlement during installation. This leads to increased density and a lower compressibility which should reduce the amount of settlement and increase the rate of pore pressure dissipation relative to untreated sites. 2. The presence of earthquake drains significantly increased the rate of excess pore water pressure dissipation relative to untreated areas. Some of this increase can be attributed to increased density but the increase was also observed when densification was less significant. 3. Settlement in areas treated with drains was reduced to only 20 to 60% of the settlement measured in untreated sites even when excess pore pressure ratios temporarily reached 100% due to blasting. 4. Reasonable estimates of pore pressure dissipation rates and settlement can be obtained for the blast tests using finite element techniques such as those employed in FEQDrain. 5. Additional computer analyses, using soil properties calibrated with the blast test data, suggest that vertical drains can successfully limit pore pressure buildup and associated settlement for earthquake motions to acceptable levels when stress cycles are applied more slowly than during a blasting event.
ACKNOWLEDGEMENTS We are grateful to the US Navy and the City of San Francisco for use of the Treasure Island site and to the British Columbia Ministry of Transportation for use of the Vancouver site. Dr. Blair Gohl of Pacific Geodynamics, Inc. provided data for the untreated test area at the Vancouver test site. David Anderson of BYU provided technical support for both studies. Funding was provided by grants from the NCHRP-IDEA program, FHWA, and a pooled-fund grant with Caltrans as the lead agency for six state highway departments.
REFERENCES 1. National Research Council. Liquefaction of Soils During Earthquakes, National Academy Press,
1985: 240 p. 2. Holzer, TL. “Introduction”. The Loma Prieta, California, Earthquake of October 17, 1989-
Liquefaction, U.S. Geological Survey Professional Paper 1551-B, U.S. Government Printing Office, 1998: B1-B8.

3. EQE “The January 17, 1995 Kobe Earthquake” Summary Report, www.eqe.com/publications/kobe/economic.htm, 1995.
4. Seed, HB, and Booker, JR. “Stabilization of potentially liquefiable sand deposits using gravel drains”. J. Geotechnical Engrg. Div., ASCE, 103(GT7), 1977: 757-768.
5. Onoue, A. “Diagrams considering well resistance for designing spacing ratio of gravel drains”. Soils and Foundations, Japanese Soc. of Soil Mechanics and Foundation Engineering, 28(3), 1988: 160-168.
6. Boulanger, DP, Hashish, Y and Schmidt, B. “Drainage capacity of stone columns or gravel drains for mitigating liquefaction”. 2nd Geotechnical Earthquake Engineering and Soil Dynamics Conference, Seattle, Vol. I, ASCE, 1997: 678-690.
7. Carroll, RG, Jr. “Geotextile filter Criteria”, Trans. Research Record 916, Trans. Research Board, Washington D.C., 1983: 43-46.
8. Giroud, JP. “Filter Criteria for Geotextiles”, Procs. 2nd Intl. Conf. on Geotextiles, Vol. 1, 1982: 103-109.
9. Kulhawy, FH and Mayne, PW. Manual on Estimating Soil Properties for Foundation Design, Electric Power Research Institute, Palo Alto, California, Research Report EERI EL-6800, 1990.
10. Pestana, JM, Hunt, CE and Goughnour, RR. “FEQDrain: A finite element computer program for the analysis of the earthquake generation and dissipation of pore water pressure in layered sand deposits with vertical drains,” Report No. EERC 97-17, Earthquake Engineering Res. Ctr., UC-Berkeley, CA, 1997
11. Seed, HB, Idriss, IM, Makdisi, F, and Banerjee, N. and Banerjee, “Representation of irregular stress time histories by equivalent uniform stress series in liquefaction analyses”, Report No. EERC 75-29, Earthquake Engineering Res. Ctr., UC-Berkeley, CA, 1975.
12. Tokimatu, K and See, HB. “Evaluation of settlements in sands due to earthquake shaking”. J. of Geotechnical Engineering, ASCE, 113(8), 1987:861-878.
13. Wride, CE, Robertson, PK, Biggar, KW, Campanella, RG, Hofmann, BA, Hughes, JMG, Kuppper, A, and Woeller, DJ. “Interpretation of in-situ test results from the CANLEX sites”, Canadian Geotechnical Journal, NRC, 37, 2000: 505-529.
14. Lee, KL and Albeisa, A. “Earthquake induced settlements in saturated sands”. J. of the Soil Mechanics and Foundations Div., ASCE, 100(GT4), 1974: 387-406.
15. Youd, T.L., Idriss, I.M., Andrus, R.D., Arango, I., Castro, G., Christian, J.T., Dobry, R., Finn, W.D.L., Harder, L.F., Hynes, M.E., Ishihara, K., Koester, J.P., Liao, S.S.C., Marcuson, W.F., Martin, G.R., Mitchell, J.K., Moriwaki, Y., Power, M.S., Robertson, P.K., Seed, R.B., and Stokoe, K.H “Liquefaction resistance of soils: summary report from the 1996 NCEER and 1998 NCEER/NSF workshops on evaluation of liquefaction resistance of soils, J. Geotech. and Geoenviron. Engrg., ASCE, 127(10), 2001: 817-833.