Embed Size (px)
Citation preview
LIQUEFACTION IN TOKYO BAY AND KANTO REGIONS IN THE 2011 GREAT EAST JAPAN
EARTHQUAKE
Kenji ISHIHARA
Professor, Research and Development Initiative, Chuo University, Tokyo, Japan,
ABSTRACT: Features of the 2011 earthquake in Japan are characterized by predominance of the ground failure due to liquefaction and scour of the ground caused by Tsunami. Unprecedented long duration of the shaking combined with large aftershocks have created the worst situations resulting in the extensive damage due to liquefaction over the Tokyo Bay and the downstream plain areas of the Tone River 300~400km distant away from the epicentral area. In this paper, focus is placed on the characteristic features in the occurrence of liquefaction and consequent damage to the ground. Key Words: Mega earthquake, Liquefaction, Lateral flow, Settlements
INTRODUCTION An extremely large earthquake rocked the widespread area in the northern part of Japan Mainland at 14:46:33 (JST) on March 11, 2011. The magnitude of the quake was M=9.0, an event accompanied with an unprecedentedly large amount of energy release at a centroid depth of 24km where the Pacific tectonic plate subsides into the North Pacific plate underneath the Japan Mainland. This quake was the largest ever recorded during the last 150 years since the start of seismic observation in Japan. Subsequently, the two big-scale aftershocks occurred, one at 15:09 with M=7.4 in the north and the other at 15:15 with M=7.7 in the south on the same day as displayed in the map of Fig. 1.
The fault zone covered a wide area about 500km long and 200km wide. It is noted that the biggest first quake with whopping M=9.0 occurred at an epicentre under the sea 130km off the coast of Sendai, followed by the second largest event at an epicentre about 150km east of northern coast. The fault ruptures moved southward, generating the third largest aftershock at a southern site 30km off-shore from the coast of Fukushima prefecture. Strong shaking was felt and recorded at a number of sites over a widespread area from the northern prefectures, Iwate, Miyagi and Fukushima, down to the southern region such as Ibaragi, Chiba and Tokyo metropolis. Extensive liquefaction developed in the area of Tokyo Bay as well as over the flat lowlands surrounding lakes in the lower reaches of the Tone River north of Tokyo. The characteristic features of liquefaction and associated ground movements and damage will be described in some details in the following pages of this paper.
Proceedings of the International Symposium on Engineering Lessons Learned from the 2011 Great East Japan Earthquake, March 1-4, 2012, Tokyo, Japan
63

GROUND MOTION CHARACTERISTICS IN TOKYO REGION There are several K-Net and Kik-Net stations installed in the Kanto region where strong motion recorders were triggered. Locations of some of these stations are shown in Fig. 1. Typical motions obtained at Urayasu K-Net station in Chiba is demonstrated in Fig. 2. It is noted here that the main shock by the largest quake was triggered at Urayasu several seconds after the start of the motion at Sendai. This difference is the time required for the tremor to travel through the distance of approximately 350km from Sendai to Tokyo area. Thus, the velocity of propagation of the first wave front is estimated to have been 3.1km/sec. It can be seen in Fig. 2 that the peak horizontal acceleration (PGA) was 160g in E-W direction. Note that this K-Net station is located in the section in Urayasu city where there was no sign of liquefaction on the ground surface.
A majority of records obtained in Tokyo Bay area had a PGA in the range of 150 to 230 gals, and that recorded at Urayasu is considered as being representative of many others in this region. It is to be noted in Fig. 2 that the main shaking in Tokyo lasted as long as 150 seconds which are considered as being larger, perhaps, than any others ever recorded in the world. It should be mentioned herein that such a long duration of motions has been the major cause of the liquefaction-related damage which were vastly disastrous as described below.
The response spectra of the recorded acceleration at the Urayasu K-Net station are displayed in Fig. 3, where it is noted that the peak spectral acceleration occurred at the period of about 1.0 second.
Fig. 1 Epicentral zone of the 2011 Great East Japan Earthquake (Hayes et al. 2011)
64

-100
0
100
-100
0
100
Acc
ele
ratio
n, a
cc (
ga
l)
0 20 40 60 80 100 120 140 160 180 200 220 240
-100
0
100
Time in seconds
N-S
E-W
U-D
14:48:10
URAYASU - KNet
Fig. 2 Recorded motions at the K-Net station at Urayasu
0 2 4 6 8 100
100
200
300
400
500
600
Period in seconds
Sp
ect
ral r
esp
on
se a
cc, S
A (
ga
l)
N-SE-WU-D
URAYASU
Fig. 3 Response of accelerations recorded at the Urayasu K-Net station (for 5% of critical damping)
GROUND DAMAGE IN TOKYO BAY AREA Liquefaction in Kanto region
Extensive liquefaction was induced in reclaimed and alluvial deposits along rivers and bay shore areas in the plain of Kanto region including Ibaragi, Chiba and Tokyo which are located as far as 300~400km southwest of the epicentre of the main shock. The total land area in which signs of
65

liquefaction were observed is purported to have been of the order of 70km2. In terms of the long distance from the epicentre and also in terms of the large expanse net area, the liquefaction in the Kanto region by the 2011 earthquake was unprecedented and truly record-breaking. Shown in Fig. 4 is the distribution of places where apparent signs of liquefaction were observed such as sand oozing, boiling, ground cracking and associated ground settlements. These may be classified as (1) those which developed in the reclaimed waterfront area along the Tokyo Bay, (2) the liquefaction in the lakeshore district south of Kasumiga-ura in the lower reach of Tone River, and (3) the spotwise occurrence of liquefaction at many locales along the Tone River and its tributaries where landfills had been conducted in originally marshy flat lands. The areas of liquefaction along the Tokyo Bay are roughly displayed in Fig. 4 where it is noted that its effects extended south to the city of Kanazawa-bunko in Yokohama and also that the low-land areas west of the lower reach of the Edo River in Tokyo suffered the damage due to liquefaction. Several cities in Chiba Prefecture east of Urayasu were also affected seriously by the liquefaction. These cities are shown in a enlarged map in Fig. 5.
Fig. 4 Liquefaction - affected area in Kanto Region (S. Yasuda, 2011)
66

Fig. 5 Liquefaction-affected areas in Chiba along the Tokyo Bay Damage in Urayasu City Amongst the cities in Chiba Prefecture, Urayasu was the one most seriously affected by liquefaction. The major areas in Urayasu are indicated in Fig. 6 where apparent signs of liquefaction were observed at the time of the first strongest shaking on March 11, 2011 as well as in the aftershocks. Most of the areas affected were those reclaimed over the period of 1960~1980 and developed to provide landspaces for residential houses, parks, schools and warehouses for industries. There was a sharp contrast between the areas of liquefaction or no liquefaction which is divided by the old shore-line before the reclamation started early in 1960’s. This boundary line is indicated on the map in Fig. 6.
Most severely affected areas in Urayasu were districts where land expansion was undertaken towards the shallow sea waters starting from early in 1960’s. The progress of land reclamation is indicated in Fig. 7 where it can be seen that the filling in the reclaimed area had been finished by the end of 1970’s. The landfilling was conducted by dredging shallow-depth seabed deposits near the shores. The sandy soils were transported hydraulically by pipes and sedimented under water. The photos in Fig. 8 show the reclamation works then underway. After filling hydraulically, dry sand was transported onland and spread by bulldozers to a thickness of 1~3m. No means was taken further to compact the soils. Soil improvements were left to the hands of owners who purchased the land. Roughly speaking, the city of Urayasu is divided into three zones, as indicated by dashed lines in Fig. 6. These are (1) old town (Moto-machi) north of the old beach line, (2) middle town (Naka-machi) located on the man-made land southeast of the old town and (3) new town (Shin-machi) on the man-made land due southeast of the middle town.
The old town part of Urayasu was practically free from any distress by the quake due probably to relatively stiff nature of the alluvium. The middle town area which is residential and commercial zone suffered serious damage due to liquefaction, because of the newly filled loose sandy soil deposit existing near the ground surface and also because of the high ground water table shallower than 1.0m. In the new town area, the ground had been raised to an elevation of 4~5m above the sea level by placing additional fills transported on land. Thus, the ground water table was rather lower. The majority of structures in the new town were hotels, office building etc. which were constructed on
67

sound foundations supported by improved soils and long piles. Because of these favourable conditions in the new town, the damage was rather minor, except for several buildings and facilities having poor foundation works. The soil profile at Urayasu consists generally of loose sand layers of reclaimed and alluvial origin underlain by a thick soft clay-silty layer to a depth of 40~70m.
Fig. 6 Places of serious damage to private houses in Urayasu
Fig. 7 Progress of reclamation work in Urayasu
68

A typical soil profile in the middle town at a site at Irifune 3-chome is shown in Fig. 9, with the exact location indicated in the inset. It can be seen that a soft clayey silt deposit of alluvial origin exists to a depth of 45m at this site overlaid by alternate layers of silty and sandy soils of alluvial era. The loose sandy layer near the surface to a depth of 5m having a SPT N-value of 3~10 is the one placed newly by the reclamation. A series of boring data obtained along the alignment D-D’ in Fig. 10 are arranged in a form of a side view shown in Fig. 11.
(a) Distant view (b) Pipes for hydraulic transmission
Fig. 8 Photos showing the reclamation work by the hydraulic method
(offered by Urayasu city office)
Fig. 9 Soil profile at Irifune 3-chome
69

Fig. 10 Counter lines of valleys buried by alluvial deposits at Urayasu
Fig. 11 Cross Section D-D' in Fig. 25, Urayasu (from the Urayasu city office)
70

It is of interest to notice that, although the SPT N-value of 5-15 for the alluvial sand is slightly larger as compared to N=5~10 for reclaimed sand, the new sand deposit was more vulnerable to liquefaction, as evidenced by the clear manifestation on the ground in the reclaimed area in contrast to no liquefaction in the old town area in the north. This fact seems to indicate that effects of solidification of fines due to aging might have contributed for strengthening of sandy soils, although it is not clearly reflected in the penetration resistance of the SPT. Upon compilation of many other boring data, the bottom of the old alluvium was established and shown in Fig. 10 as contour lines of buried valleys.
Several of photos showing the ground devastation by liquefaction are shown in Fig. 12. Fig. 12(a) shows tilting of trees and inundation of spurted muddy water over the road in Mihama residential section. Shown in Fig. 12(b) is uplifting of a sewage manhole on the sideway about 1.5m above the ground. The features of the ground damage in general are shown in Fig. 12(c).
It should be noted that the ejected sand was mostly laden with silt and clay, making it easier to flow and spread over the ground surface. Fig. 13(a) shows a photo indicating settlement and tilt of a house. Fig. 13(b) shows a house tilted and settled as a result of liquefaction. In the building supported by firm foundations such as piles, considerable vertical offset developed relative to the surrounding ground surface, as typically displayed in Fig. 13(c). The gap about 50cm between the building foundation and the subsided ground in its vicinity did result in breakage or tear-off of several pipelines and cables entering the buildings such as water and gas supply, sewage pipes, and electricity and telecommunication cables. The breakage of the lifelines as above was fatal for continued living for residents for some weeks because of lack of operational conditions for the buildings.
(a) Ground devastation in a residential section
(b) Floating of sewage manhole (c) Spreading of sand over the road
Fig. 12 Destruction of the ground due to liquefaction (Offered by Urayasu city office)
71

(a) Settlement and tilt of a house
(b)Sinking of an apartment house (c) Offset between an undamaged
building and settlement of the surrounding ground
Fig. 13 Settlements and tilts of houses due to liquefaction (Offered by Urayasu city office)
LIQUEFACTION-INDUCED DAMAGE IN THE DOWNSTREAM
AREA OF THE TONE RIVER In some districts over the flood plain in the downstream area of the Tone River, severe damage was incurred to residential lands and to roadways due to occurrence of liquefaction. The cities of Itako and Kamisu were the two major districts where the damage was most disastrous. Damage in Itako City (1) General As seen in the map of Fig.14, the city is located in the area surrounded by Kasumigaura Lake on the northwest, Kitaura Lake on the north and the large flat land in the lower reaches of the Tone River on the south. Fig. 14 also shows the particular areas of severe damage due to liquefaction, that is, Hinode. A map of Itako further enlarged is demonstrated in Fig. 15.
While places of liquefaction were scattered widely over Itako city, severe damage was concentrated predominantly in the district of Hinode about 25km long and 15km wide as indicated in Fig. 15. This area is a land which was in an early period created by draining off the lagoon called Uchina-Sakara. The lagoon area as of 1893 prior to the drain-off is shown in Fig. 16. The drain-off
72
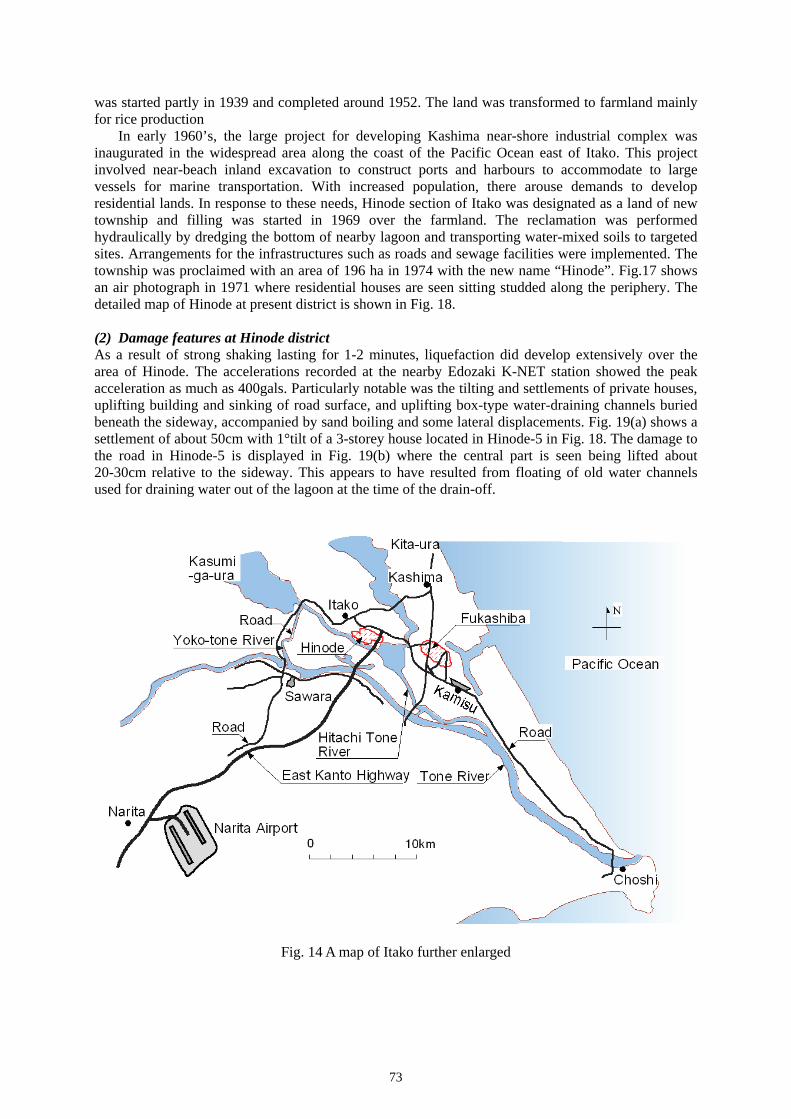
was started partly in 1939 and completed around 1952. The land was transformed to farmland mainly for rice production
In early 1960’s, the large project for developing Kashima near-shore industrial complex was inaugurated in the widespread area along the coast of the Pacific Ocean east of Itako. This project involved near-beach inland excavation to construct ports and harbours to accommodate to large vessels for marine transportation. With increased population, there arouse demands to develop residential lands. In response to these needs, Hinode section of Itako was designated as a land of new township and filling was started in 1969 over the farmland. The reclamation was performed hydraulically by dredging the bottom of nearby lagoon and transporting water-mixed soils to targeted sites. Arrangements for the infrastructures such as roads and sewage facilities were implemented. The township was proclaimed with an area of 196 ha in 1974 with the new name “Hinode”. Fig.17 shows an air photograph in 1971 where residential houses are seen sitting studded along the periphery. The detailed map of Hinode at present district is shown in Fig. 18. (2) Damage features at Hinode district As a result of strong shaking lasting for 1-2 minutes, liquefaction did develop extensively over the area of Hinode. The accelerations recorded at the nearby Edozaki K-NET station showed the peak acceleration as much as 400gals. Particularly notable was the tilting and settlements of private houses, uplifting building and sinking of road surface, and uplifting box-type water-draining channels buried beneath the sideway, accompanied by sand boiling and some lateral displacements. Fig. 19(a) shows a settlement of about 50cm with 1°tilt of a 3-storey house located in Hinode-5 in Fig. 18. The damage to the road in Hinode-5 is displayed in Fig. 19(b) where the central part is seen being lifted about 20-30cm relative to the sideway. This appears to have resulted from floating of old water channels used for draining water out of the lagoon at the time of the drain-off.
Fig. 14 A map of Itako further enlarged
73

Fig. 15 Places of liquefaction, Hinode, in Itako city
Fig. 16 Lagoon area as of 1893 prior to the drain-off (from Itako city office)
74

Fig. 17 Hinode district of Itako city in 1971 (from Itako city office)
Fig. 18 Hinode district of Itako at present (from Itako city office)
75

(a) Tilting of a house (b) Heave at the center of a road
Fig. 19 Damage to houses and roads in Hinode
(3) Geotechnical Conditions Soil conditions in Hinode district at Itako were investigated, prior to and after the earthquake, by in-situ boring combined with the Standard penetration test (SPT). The soil profiles along the N-S line, ○1 ,○2 ,○3 ,○4 indicated in Fig. 18, is demonstrated in Fig. 20 where it can be seen that below the surface fills there exists a loose deposit of sandy soil having a low SPT N-value of the order of 5-15. Saturated with a high ground water table of 1~2m below the ground surface, the near-surface sand fill is deemed to be a new sand deposit which was placed hydraulically at the time of the recent reclamation in 1965-1981. It is obvious that this deposit had developed liquefaction during the earthquake. It is also likely that the loose alluvial sand deposit below the fills have induced liquefaction as well.
Fig. 20 Soil profile in N-S direction at the center of Hinode, Itako (from Itako city office)
76

Damage in Kamisu city (1) General The city is located in the downstream plain area of the Tone River as shown in the map of Fig. 14. An enlarged map in Fig. 21 indicates that the Kamisu city is about 7km east of Itako city and about 5km from the coast of the Pacific Ocean. The district of severe liquefaction in Kamisu is at Horiwari and Fukashiba and sporadically distributed spots in their vicinity.
According to an old map, there existed a fairly large lake with triangular shape in the north of the Gono Lake. Its location is also shown in Fig. 21 with a dashed line. This lake was buried around 1960 when the near shore industrial complex was developed, but the belt zone about 1km wide and 200m wide was left and reshaped as the new Gono Lake as accordingly indicated in Fig. 21. The shore line of this lake was also damaged by the lateral flow of liquefied materials.
(2) Damage features In Fukabori district, the gravel layers were excavated in 1950~1960 to a maximum of 10m depth even below the ground water table to take gravels for construction purposes. Later on, the large pit areas were buried by borrow sands. Then, they were transformed into residential district. When houses were built in 1980’s, there was no compaction efforts expended to stabilize loose sand deposits for providing competent bases and foundations. The consequence of liquefaction was truly disastrous as seen in a photo shown in Fig. 22(a) where houses look as if they were afloat on a lake water. Fig. 22(b) shows another example of houses tilted on the liquefied ground. (3) Geotechnical conditions The soil conditions in this district were investigated by means of the SPT combined with Swedish cone. The results of the investigations are reported in papers by Tsukamoto et al. (2012a, 2012b). Soi1 investigations were performed at numerous other sites at Fukashiba as shown in Fig. 23. Some of the results of these borings are displayed in Fig. 24 in the form of sideviews where it is apparently seen that the sand fills (Bn, Fl) or alluvial sand (As1) developed liquefaction. Particularly to be noticed is the existence of the thick deposit of man-made fill, Fl, towards the north-east, as demonstrated by the boring B4-1 and K-21 in Fig. 24. This is the typical deposit formed by backfilling the open pits in recent years.
Fig. 21 Areas of liquefaction-induced damage
77

Fig. 22 Damage to houses in Kamisu
Fig. 23 Places of soil borings at Fukashiba district in Kamisu city
(a) Mud water around private houses (b) Apartment house unt tilted and subsided
78

(a) Soil profiles in Fukashiba, Kamisu
(b) Soil profiles in Fukashiba, Kamisu
Fig. 24 Side views of soil profiles at Fukashiba, Kamisu (from Kamisu city)
CLASSFICATION OF LIQUEFACTION-AFFECTED AREAS
In terms of micro-geology and history of land formation, the areas of liquefaction in Tokyo bay and Kanto region in the present earthquake may be classified as follows. 1) Near-shore extension of lands towards the sea. The new land space created by dreading and filling in the Tokyo Bay is a typical example of the area of loose sand deposits which is vulnerable to liquefaction. The city of Urayasu, Ichikawa, Narashino,
79

and district of Makuhari and Inage in Chiba are examples of this type of land formation. 2) Reclamed land after drain-off The drain-off and fillings conducted in Itako producing a highly liquefiable locale is an example of this category of the deposits. It is to be noticed that there were remains of small box-type water channel, at the time of the drain-off, which had buried at shallow depths and covered by sands where refilling was made afterwards. These underground objects have made the damage worse. 3) Refilled lots after excavation There are several sections in the city of Kamisu where open excavation had been performed under ground water to take gravelly materials for the use of construction. The open pits about 5-10m deep, were buried later by just dumping sandy soils without any compaction. The near-surface soil deposits formed by sedimentation of these borrow materials did exist at various places in Kamisu. These deposits were highly susceptible to liquefaction. 4) Buried deposits in old meandering river course When short-cut channels are constructed across meandering brooks or rivers, the old portions of the channel is buried by placing borrow materials without compaction. The loose soils thus placed are generally vulnerable to liquefaction during earthquakes. There are many places of this kind along the tributary streams of the Tone River. 5) Buried scoured hollows along river embankments When levees of rivers are breached by flood, the ground outside the river channels is scoured. The depressed ground formed by the scour is buried by borrow materials when restoration work was done. This leaves buried hollows in a loose state of deposition which is highly vulnerable to liquefaction. The devastation by liquefaction at studded isolated places such as Fusa and Kurihashi along the middle stream of the Tone River are typical examples of liquefaction-induced damage which occurred during the present earthquake.
CONCLUDING REMARKS
There were several characteristics in the occurrence of liquefaction and consequence damage in the 2011 event which are different from a number of cases experienced in the past earthquakes. These are summed up as follows. 1. It was probably the first case to the knowledge of today’s geotechnical engineers to observe such a wide-spread occurrence of liquefaction in the area more than 350km distant from the epicentre. This may be attributed to the rarely encountered huge magnitude-scale earthquake as great as M=9.0. Corresponding to the large-scale event, the duration of shaking was as long as 2~3minutes. In the light of the 10~20 seconds duration hitherto encountered in the magnitude 7~8 events, the shaking duration in the East-Japan Great Earthquake can be cited as extraordinarily long. This fact appears to have made the damage level worst, as compared to any other cases of liquefaction ever encountered. 2. In Urayasu city there was a section where practically no sign of liquefaction was observed. This was the old city part, while there was severe damage in the newly reclaimed area. In old deposits comprised of the alluvium, it is conceivable that effects of aging tend to act towards solidifying deposits more pronouncedly for the fines containing sands. This could perhaps be a reason why there was a sharp contrast regarding the liquefaction between areas of alluvial deposits and newly reclaimed sections in Urayasu city.
80

3. In the city of Itako, residential district, Hinode, suffered severe damage due to liquefaction. The looseness of recent man-made fills combined with high level of the ground water table could be the reasons to cause the liquefaction and consequent damage. 4. In the city of Kamisu, there were several places where a large amount of gravels hade been mined in open excavation to take gravels for the use of construction. This was carried out under the ground water table. These open pits were buried later by sands, and transformed to residential lands without stabilizing the loose sands. Extensive liquefaction had developed in these areas..
ACKNOWLEGEMENTS
In preparing this paper, the information on the progress of reclamation in Urayasu city and general features of the damage was given by the courtesy of Mr. Ichiro Ishii of the Urayasu city office. The soil profile data and air photos of Itako city were offered through Ms. M. Murata. The soil boring data in Kamisu city was provided by Mr. T. Ando of Kamisu city office. The author wishes to express his deep thanks to the office and persons as mentioned above.
REFERENCES
Kawabe, S., Tsukamoto, T. and Takahashi, R. (2012), “Soil liquefaction observed at Katori city located along the lower stream of Tonegawa River during 2011 Great East Japan Earthquake.”, submitted to the present conference.
Towhata, I., Goto, H., Kazama, M., Kiyota, T., Wakamatsu, K., Wakai, A., Yasuda, S. and Yoshida, N.
(2011), “On gigantic Tohoku Pacific Earthquake in Japan.”, Earthquake News, ISSMGE Bulletin, Vol. 5, Issue 2.
Tsukamoto, Y., Kawabe, S. Kokusho, T. and Araki, K. (2012). “Observed performance and estimated
soil profiles of reclaimed and natural deposits at Kamisu city during 2011 Great East Japan Earthquake.” Proc. 9th International Conference on Urban Earthquake Engineering, Tokyo institute of technology.
Tsukamoto, Y., Kawabe, S., Kokusho, T. and Araki, K. (2012). “Soil liquefaction observed at areas
located along the lower stream of Tonegawa River during 2011 Great East Japan Earthquake.” Proc. of the present conference.
Urabe, A. (2011), “Liquefaction damage at the residential land in the inland area of Kanto
district-Itako. Hinode and Kuki. Minami-Kurihashi.” Proc. Symposium on Liquefaction in the Plain of Tone River, Socio-Geotechnical Society, 22-25. (In Japanese)
Urayasu City Official Site http//www.city.urayasu.chiba.jp Yasuda, S. (2011), “Liquefaction-Induced Damage in Kanto Region.” Report of Investigation for the
Tohoku Off-Ocean Earthquake, Japanese Geotechnical Society (in Japanese)
81


![Japan National Tourism Organization · Japan. Endless Discovery. Fukushima Kanto Tokyo Sea of Japan Kanazawa Fukui Kensal K C Osaka NME Chubu Shlzuou 3,776 n: u n. luthoftunînonni]](https://img.pdfslide.us/doc/110x75/5fd10d6de804112027149a64/japan-national-tourism-organization-japan-endless-discovery-fukushima-kanto-tokyo.jpg)