Embed Size (px)
Citation preview
Ⓔ
Liquefaction Features Produced by the 2010–2011 Canterbury
Earthquake Sequence in Southwest Christchurch, New Zealand,
and Preliminary Assessment of Paleoliquefaction Features
by P. Villamor, P. Almond, M. P. Tuttle, M. Giona-Bucci, R. M. Langridge, K. Clark, W. Ries,S. H. Bastin, A. Eger, M. Vandergoes, M. C. Quigley, P. Barker, F. Martin, and J. Howarth
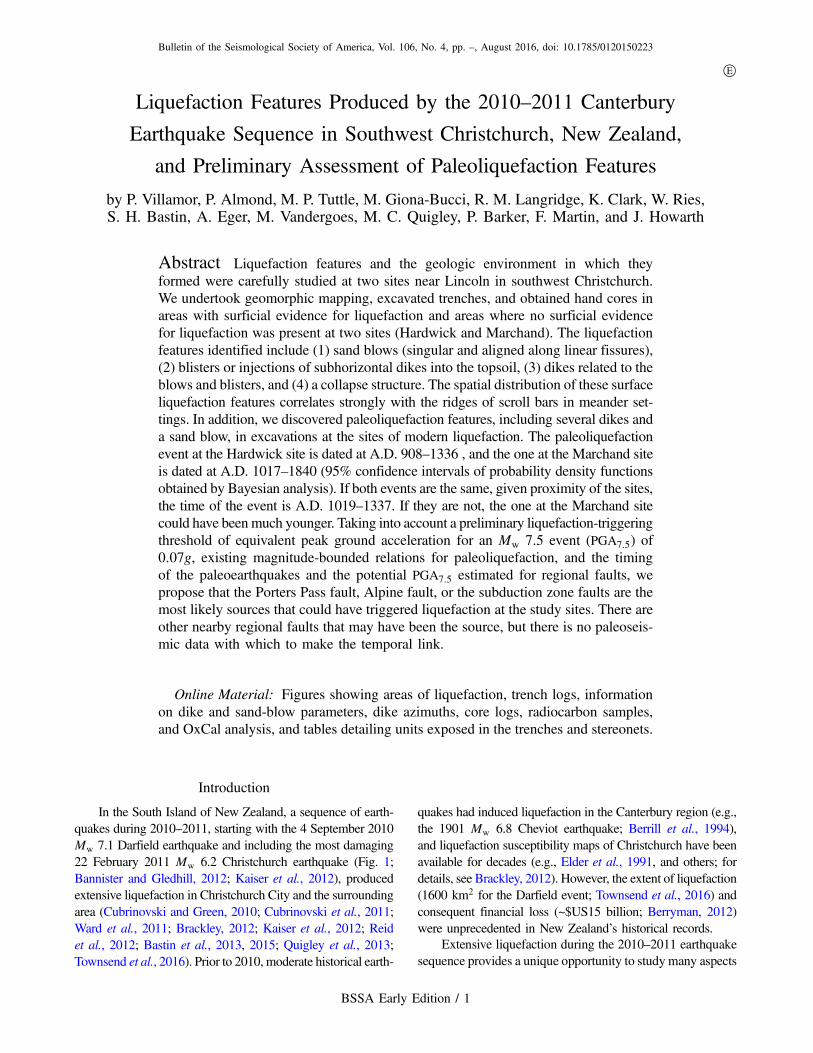
Abstract Liquefaction features and the geologic environment in which theyformed were carefully studied at two sites near Lincoln in southwest Christchurch.We undertook geomorphic mapping, excavated trenches, and obtained hand cores inareas with surficial evidence for liquefaction and areas where no surficial evidencefor liquefaction was present at two sites (Hardwick and Marchand). The liquefactionfeatures identified include (1) sand blows (singular and aligned along linear fissures),(2) blisters or injections of subhorizontal dikes into the topsoil, (3) dikes related to theblows and blisters, and (4) a collapse structure. The spatial distribution of these surfaceliquefaction features correlates strongly with the ridges of scroll bars in meander set-tings. In addition, we discovered paleoliquefaction features, including several dikes anda sand blow, in excavations at the sites of modern liquefaction. The paleoliquefactionevent at the Hardwick site is dated at A.D. 908–1336 , and the one at the Marchand siteis dated at A.D. 1017–1840 (95% confidence intervals of probability density functionsobtained by Bayesian analysis). If both events are the same, given proximity of the sites,the time of the event is A.D. 1019–1337. If they are not, the one at the Marchand sitecould have beenmuch younger. Taking into account a preliminary liquefaction-triggeringthreshold of equivalent peak ground acceleration for an Mw 7.5 event (PGA7:5) of0:07g, existing magnitude-bounded relations for paleoliquefaction, and the timingof the paleoearthquakes and the potential PGA7:5 estimated for regional faults, wepropose that the Porters Pass fault, Alpine fault, or the subduction zone faults are themost likely sources that could have triggered liquefaction at the study sites. There areother nearby regional faults that may have been the source, but there is no paleoseis-mic data with which to make the temporal link.
Online Material: Figures showing areas of liquefaction, trench logs, informationon dike and sand-blow parameters, dike azimuths, core logs, radiocarbon samples,and OxCal analysis, and tables detailing units exposed in the trenches and stereonets.
Introduction
In the South Island of New Zealand, a sequence of earth-quakes during 2010–2011, starting with the 4 September 2010Mw 7.1 Darfield earthquake and including the most damaging22 February 2011 Mw 6.2 Christchurch earthquake (Fig. 1;Bannister and Gledhill, 2012; Kaiser et al., 2012), producedextensive liquefaction in Christchurch City and the surroundingarea (Cubrinovski and Green, 2010; Cubrinovski et al., 2011;Ward et al., 2011; Brackley, 2012; Kaiser et al., 2012; Reidet al., 2012; Bastin et al., 2013, 2015; Quigley et al., 2013;Townsend et al., 2016). Prior to 2010, moderate historical earth-
quakes had induced liquefaction in the Canterbury region (e.g.,the 1901 Mw 6.8 Cheviot earthquake; Berrill et al., 1994),and liquefaction susceptibility maps of Christchurch have beenavailable for decades (e.g., Elder et al., 1991, and others; fordetails, see Brackley, 2012). However, the extent of liquefaction(1600 km2 for the Darfield event; Townsend et al., 2016) andconsequent financial loss (~$US15 billion; Berryman, 2012)were unprecedented in New Zealand’s historical records.
Extensive liquefaction during the 2010–2011 earthquakesequence provides a unique opportunity to study many aspects
BSSA Early Edition / 1
Bulletin of the Seismological Society of America, Vol. 106, No. 4, pp. –, August 2016, doi: 10.1785/0120150223

of liquefaction. For example, aerial photography and light de-tection and ranging (lidar) surveys acquired immediately afterthe two largest events in the sequence, the Darfield and Christ-church earthquakes, were used to produce regional-scale mapsthat precisely record the locations, types, and extent of surficialliquefaction features in association with each event (Townsendet al., 2016). Also, observations of recurrent liquefaction dur-ing the sequence, following both the larger earthquakes andother moderate events have been considered, in combinationwith measurements of ground motion by a dense seismographnetwork, to assess the threshold of shaking required to induceliquefaction at a site of highly susceptible sediment (Quigleyet al., 2013). Groundwater characteristics recorded during theevents were successfully used to assess the influence of theliquefaction process on changes in artesian pressure in con-fined aquifers (Cox et al., 2012).
Paleoseismological trenching studies have contributedto an understanding of the occurrence and preservation ofliquefaction features in the geologic record (Almond et al.,
2012; Bastin et al., 2013, 2015, 2016; Quigley et al., 2013;Villamor et al., 2014). A few pre-2010 liquefaction featureshave been found in excavations of 2010–2011 sand blows inChristchurch City. Some of the pre-2010 features tentativelyhave been attributed to a local historic earthquake in 1869 or,alternatively, to either the 1717 Alpine or Porters Pass earth-quakes (Bastin et al., 2015).
This article considers liquefaction from the Canterburyearthquake sequence close to Lincoln township, 16 km to thesouthwest of Christchurch City. The study area lies on a lateHolocene, low-lying floodplain–delta complex formed byold distributary channels of the Waimakairiri River, whichnow flows to the Pacific Ocean north of Christchurch (Fig. 1).The water table in the area is shallow, varying from 1.5 to 2 mbelow the surface during the dry season. We have chosen twostudy sites southwest of Lincoln for the following reasons.
1. Liquefaction occurred here during both the Darfield(4 September 2010) and Christchurch (22 February 2011)
Figure 1. (a) General geology and active faults of the Canterbury region. Black stars are epicenters of historic earthquakes: (1) 1929Arthur’s Pass (Mw 7.1), (2) 1888 Amuri (Mw 7.1), (3) 2010 Darfield (Mw 7.1), (4) 1870 Lake Ellesmere (Mw 5.8), (5) 1869 Christchurch(Mw 4.9), (6) February 2011 Christchurch (Mw 6.2), (7) December 2011 (Mw 5.9), and (8) June 2011 (Mw 6.0). Small black dots are ourstudy sites (M, Marchand site; H, Hardwick site). (b) Active faults of the central part of the South Island (Forsyth et al., 2008; Barnes et al.,2011; see Data and Resources): HF, Hope fault; CF, Clarence fault; AWF, Awatere fault; PF, Poulter fault; and RF, Rakaia fault.
2 P. Villamor, et al.
BSSA Early Edition

earthquakes, and minor liquefaction occurred during the13 June 2011 earthquake (hereafter also referred to asSeptember 2010, February 2011, and June 2011 events).The level of shaking experienced was different for eachevent in the area (note that peak ground accelerations[PGAs] used here were recorded at LINC seismic station,which is located ∼3 km away from the sites and sits onsimilar soil type): (a) the epicenter of the September 2010Mw 7.1 earthquake was 29 km away (closest distanceto the Greendale fault is ∼15 km) and produced PGA of0:42g in Lincoln (magnitude-weighted PGA7:5 of 0:38g;Table 1; epicentral distance to LINC station is 27 km);(b) the epicenter of the February 2011Mw 6.2 earthquakewas 17 km away from the study sites and generated 0:12gPGA in Lincoln (PGA7:5 of 0:07g; Table 1; epicentral dis-tance to LINC station is 18 km); and (c) the epicenter ofthe 13 June 2011Mw 6.0 earthquake was 22 km away andgenerated PGA of 0:06g at Lincoln (PGA7:5 of 0:04g;Table 1; epicentral distance to LINC station is 23 km).
2. The study sites are located at similar distances from bothmajor earthquake sources (i.e., from Greendale fault,source for the 4 September 2010 earthquake; and fromthe 22 February 2011 earthquake), and thus can provideinsights into feature type and size for distal sites of lique-faction as well as the relationship between distance of sur-face expression of liquefaction and earthquake magnitude.
3. The study sites are on farmland with few buildings and
therefore favorable both for conducting ground investiga-tions and using aerial photography and lidar for mappingsurface features.
4. The study sites were visited during the postearthquake re-connaissance allowing preliminary field data to be gatheredimmediately after the liquefaction events. This informationwas supplemented by excellent photographic and observa-tional records by the landowner of the Hardwick site.
Our study has reviewed pre-2010 aerial photography andaerial photography and lidar-derived digital elevation models(DEMs) taken after the events; produced detailed local geo-morphic maps; excavated and logged shallow (∼1–1:5 m)trenches; and analyzed handcored sediments to a depth of 5 m.This detailed data collection has allowed us to document thecharacteristics of the 2010–2011 earthquake-induced liquefac-tion features in the Lincoln area, to recognize paleoliquefac-tion features, and to compare paleoliquefaction features withmodern features at the same sites. We further present prelimi-nary inferences about the sediment layers that liquefied duringthe earthquake sequence and on potential correlations betweenthe geomorphic elements of the fluvial sedimentary environ-ments and the distribution of the 2010–2011 liquefaction fea-tures. We also estimate the age of paleoliquefaction featuresdiscovered at the two study sites near Lincoln and discuss pos-sible earthquake sources of the paleoearthquake(s) that causedpaleoliquefaction. The data allow us to make recommenda-
Table 1Estimated PGA7:5 at Hardwick and Marchand Sites from Rupture of Known Active Faults and Historic Earthquakes from GMPEs
Seismic Source Type* Mw Mean* Distance†RecordedPGA‡
PGA7:5McVerry/Bradley§
Probability (%)Maurer||
HistoricLiquefactionat Study Site
Subduction zone (full rupture) Rv 9.0 170 0.086Subduction zone (southern segment) Rv 8.1–8.4 170 0.036–0.053Alpine fault Ss 8.1 135 0.077/0.080 31Hope-Conway fault Ss 7.4 120 0.048/0.043 <7
Kelly fault Ss 7.3 120 0.043/0.038 <7
Hope-Hope River fault (1888 Amuri EQ) Ss 7.1 112 0.040/0.033 <7 NoHope-Hurunui fault Ss 7 107 0.038/0.031 <7
Poulter fault Ss 7.1 109 0.041/0.034 <7
Porters Pass fault Sr 7.5 55 0.133/0.121 50Springfield fault Rv 7 58 0.092/0.069 16Ashely fault Rv 7.2 45 0.137/0.018 50Hororata fault Rv 7.2 38 0.155/0.123 50–69Springbank fault Rv 7 38 0.134/0.104 50Rakaia fault Sr 7.1 24 0.174/0.168 69–84Greendale, 4 September 2010 Sr 7.1 15 0.423 0.381 93 Yes1869 Christchurch earthquake Sr 4.9 15 0.048/0.021 <7 No1870 Lake Elsmere earthquake Sr 5.8 15 0.095/0.075 50 NoChristchurch fault, 22 February 2011 Rv 6.2 15 0.118 0.073 50 Yes13 June 2011 Sr 6 24 0.071 0.040 16 Yes
*From Stirling et al. (2012) for fault sources and Downes and Yetton (2012) for historic earthquakes. Ss, strike slip; Sr, strike-slip reverse; Rv, reverse.†Distance from closest point of fault source to site or epicentral distance to site (for 1869 Christchurch and 1870 Elsmere earthquakes).‡Recorded peak ground acceleration (PGA) is the geometric mean of the two horizontal components at LINC seismic station (3 km away from the study site).§PGA7:5 is either the conversion of recorded PGA (for 4 September, 11 February, and 13 June events) to magnitude weighted PGA (Youd et al., 2001) or the
estimated PGA7:5 value from rupture of fault sources using two ground-motion prediction equations (GMPEs): (median value) from McVerry et al. (2006; forsoil type D) and Bradley (2013; for VS30 � 200 m=s and depth to 1 km=s as 400 m). Bradley (2013) does not have a GMPE for subduction zone earthquakes.
||Probability of inducing liquefaction based on New Zealand magnitude-bounded relationships from Maurer et al. (2015).
Liquefaction Features by Canterbury Earthquake Sequence and Assessment of Paleoliquefaction Features 3
BSSA Early Edition

tions regarding future paleoliquefaction studies in the Christ-church area. With this study of liquefaction sites in the Canter-bury area and future studies in other low seismicity areas, weaim to improve understanding of earthquake potential and re-duce uncertainties in the seismic-hazard model of New Zealand.The newly gained data and understanding can be used to cal-ibrate current earthquake-hazard models of the area, includingthe assessment of recurrence of nearby medium-size “floatingearthquakes” (sourced from blind faults or otherwise unmappedfaults not represented in the active fault maps). Also, the newinformation will assist in the production of appropriate probabi-listic liquefaction maps through calibration against the prehis-toric record.
Quaternary Geology
Sedimentary Context
The Canterbury Plains are underlain by Quaternaryfluvioglacial outwash and marine sediments. Eustatic sea-level changes in association with glacial–interglacial cycleshave led to a complex interfingering of terrestrial and marinedeposits (Brown et al., 1988; Field et al., 1989; Brown andWeeber, 1992; Browne and Naish, 2003). Most of the sedi-ment at and near the coast is fine grained (sand, silt, clay, andpeat) and water saturated (high water table). As a conse-quence, most sediment is characterized by high-to-moderateliquefaction susceptibility (Elder et al., 1991).
Our field area contains sedimentary deposits of theSpringston Formation (Brown and Weeber, 1992) that areassociated with the evolution of the Waimakariri River. Post-glacial surfaces are found near the lower Waimakariri River inthe form of several very young river terraces and abandonedriver channels. Some currently abandoned channels can betraced through the wider area of Christchurch and were prob-ably active within the last 500 years (Forsyth et al., 2008).Older channels suggest that, during their formation, the Wai-makariri River (or a branch of it) flowed to the south of BanksPeninsula, reaching the sea in the region of the shores of thepresent Lake Ellesmere (Fig. 1). At present, the HalswellRiver is a much lower discharge river than the Waimakaririand flows in one of these relict channels, previously occupiedby the Waimakariri River (Forsyth et al., 2008).
Tectonic Context
The current tectonic environment of the Canterbury Plainsis characterized by reverse (anticlinal growth and blind, or par-tially buried, thrusts and backthrusts) and strike-slip faults in acompressional zone east of the plate-boundary fault, the Alpinefault (Forsyth et al., 2008; Campbell et al., 2012; Fig. 1). ThePacific and Australian plates are converging obliquely at∼35–40 mm=year (Beavan et al., 2007), with up to 80% ofthe total rate being accommodated by the strike-slip/reverseAlpine fault (e.g., Beavan et al., 2007; Sutherland et al., 2007;Wallace et al., 2007) and, farther north, by the Marlboroughstrike-slip fault system (Hope, Clarence, Awatere, and Wairau
faults; Langridge et al. 2003; Fig. 1b). The Canterbury Plainsexperience moderate strain rates (∼2 mm=yr; Wallace et al.,2007) and low levels of seismicity. Tectonic contraction in theregion is accommodated by a series of blocks rooted in an∼12-km-deep decollement (Campbell et al., 2012, and refer-ences therein). Each block contains northeast-striking re-verse faults with a frontal thrust (e.g., Springbank andHororata faults) and internal synthetic and antithetic thrusts.Strike-slip faults with an east–west trend (e.g., Ashley andGreendale faults) represent transfer zones linking thrustzones (Campbell et al., 2012). All these active faults respondto a uniform regional stress field with maximum horizontalcompressive stress oriented 115°� 5° (Sibson et al., 2011).Although the presence of faults in the plains is well known,not all active faults in the plains have surface expression andthus have not been mapped. This was demonstrated by the2010 Darfield earthquake, which occurred along a previouslyunknown active fault, the Greendale fault (Quigley et al.,2012; Fig. 1). However, prior to 2010, it was known that un-mapped faults have to be present in the plains to accommodatethe ∼2 mm=yr fraction of the total deformation across the plateboundary that could not be assigned to known faults (Stirlinget al., 2012). Because of the poor or subtle surface expressionof most of the Canterbury Plains’ faults (Forsyth et al., 2008),little is known on the timing of fault events in the area. Paleo-earthquake histories are only known for a few faults such as thePorters Pass fault (Howard et al., 2005), Ashley fault (Sissonet al., 2001), and Greendale fault (Hornblow et al., 2014).
The Canterbury earthquake sequence (Fig. 1) started withthe Mw 7.1 Darfield earthquake on 4 September 2010 (Ban-nister and Gledhill, 2012). A series of aftershocks followed un-til 22 February 2011, when the most devastating Mw 6.2Christchurch earthquake occurred (Kaiser et al., 2012), result-ing in 185 fatalities and substantial financial losses. More after-shocks followed, with a significant one (Mw 6.0) on 13 June.During December 2011, seismicity shifted offshore and in-cluded two events with Mw 5.8 and Mw 5.9. Strong groundmotions recorded during the 22 February event relate to prox-imity to fault rupture (Beavan et al., 2012) and fault directivityof seismic energy toward the city (Holden, 2011).
Liquefaction in the Canterbury Plains
Five damaging historic earthquakes occurred within∼150 km of Christchurch between 1869 and 1922 (Downesand Yetton, 2012); however, no liquefaction was reported inChristchurch following any of these events. Liquefaction wasreported in the residential areas of Kaiapoi and Belfast, north ofChristchurch following the 1901 Mw 6.8 Cheviot earthquake(Berrill et al., 1994). ModifiedMercalli intensity 7 shaking andinfrastructure damage (including collapse of the Christchurchcathedral spire) was reported in the 1869 ∼Mw 4.8 Christ-church earthquake (Downes and Yetton, 2012). Following thisearthquake, it was observed by a local resident that “the tideruns higher up the Heathcote River than formerly” (HeathcoteRiver is located within Christchurch City), suggesting that set-
4 P. Villamor, et al.
BSSA Early Edition

tlement potentially induced by liquefaction may have occurred(Downes and Yetton, 2012). The 1870 Mw ∼ 5:7 Lake Elles-mere, 1888 Mw ∼ 7:2 Hope fault, 1901 Mw ∼ 6:8 Cheviot,and 1922 Mw ∼ 6:4 Motunau, North Canterbury, earthquakesall caused strong shaking and infrastructure damage in Christ-church and other areas of Canterbury (Downes and Yetton,2012), but no liquefaction was reported for our study site.
Liquefaction induced by the 4 September 2010 Darfieldand the 22 February 2011 Christchurch earthquakes and otheraftershocks produced sand volcanoes or blows and relatedground failures, including fissures, lateral spreading, and sub-sidence and uplift. Sand blows ranged in size from tens of cen-timeters to meters, and concentrations of sand blows occurredover large areas up to ∼1 km2, with a variety of expressions ofliquefaction occurring over a wider area of 40 × 20 km2 (Cu-brinovski and Green, 2010; Cubrinovski et al., 2011; Wardet al., 2011; Almond et al., 2012; Kaiser et al., 2012; Reidet al., 2012; Quigley et al., 2013; Bastin et al., 2015; Townsendet al., 2016). As many as 10 distinct liquefaction episodes werereported for a site in Avonside in eastern Christchurch that isunderlain by very liquefiable sediment (Quigley et al., 2013).As demonstrated by liquefaction-related lateral spreading andsubsidence (up to 1.5 m of horizontal and 0.5 m vertical dis-placement recorded in eastern Christchurch; Bastin et al.,2015) and increased flooding and marine inundation in partsof eastern Christchurch (Hughes et al., 2015), earthquake-induced liquefaction poses a significant hazard with long-termeconomic and societal implications.
Methods
The Hardwick and Marchand sites near Lincoln wereselected for detailed field investigations. To document lique-faction at our study sites, we first interviewed witnessesabout their observations during the 2010–2011 events. Thoseobservations provided firsthand accounts of the formation ofsand blows, blisters (raised mounds by liquefied sand in-jected within the very near surface), and fissures and wereused to select sites for further investigation. The landownersat the Hardwick site photographed and measured many of thesurface features of liquefaction on their property.
Second, we produced a detailed geomorphic map and up-dated the existingmap of the occurrence of sand blows and othersurface effects of liquefaction (Townsend et al., 2016) for se-lected areas at both sites (Fig. 2). The mapping used pre-2010and modern aerial photos; analyzed DEMs derived from lidarsurveys acquired after each of the Christchurch earthquakes; andconsulted unpublished geomorphic maps (David Barrell, per-sonal comm., 2013) (for more information see Ⓔ Figs. S1and S2, available in the electronic supplement to this article).
Third, we excavated 11 paleoseismic trenches at selectedlocations, 7 at the Hardwick site (trenches HWK 1, 2, 3, 4a,4, 5, and 6; see full trench logs and unit descriptions in ⒺFigs. S3–S10 and Ⓔ Tables S1–S7), and 4 at the Marchandsite (trenches MAR 1, 2, 3, and 4; see full trench logs and unitdescriptions in Ⓔ Figs. S11–S14 and Ⓔ Tables S8–S10).
Nine trenches were excavated across the 2010–2011 liquefactionfeatures to document their subsurface geometry and the proper-ties of sediments hosting the liquefaction features. Two trencheswere excavated in an area with no surface effects of liquefaction,primarily to assess whether the sedimentary units are differentfrom the sites where sand blows formed at the surface (thosetrenches were not logged in detail, but relevant informationon sediments was collected). The trenches were excavated downto the water table (∼1:2–1:5 m deep). The walls and floors of 9of the 11 trenches were smoothed and cleaned, and a square gridwith a spacing of 1 mwas placed along the walls and on parts ofthe floor. In areas that required more detailed study, a 0.5 m gridwas used. After gridding, the walls and parts of the floors werephotographed and logged, and figures of the stratigraphic unitsand the liquefaction features were produced, including a descrip-tion of the sediments and locations of organic samples collectedfor radiocarbon dating. Liquefaction feature characteristics suchas size and azimuth of lineations were recorded (Ⓔ Tables S11and S12 and Ⓔ Figs. S16 and S17).
To complement the information on the sedimentary se-quence from the trenches and to obtain information on theliquefaction source layer, we extracted ∼18 m of intact core(in sections of 0.7–1 m length) with a 5-cm-diameter round-rodpiston corer, fitted with a core catcher that can retrieve water-saturated sands. The cores were obtained from the bottom ofseveral trenches. We visually inspected each core for liquefactionfeatures and described the sedimentary units (Ⓔ Figs. S18–S21).
Organic matter samples were collected and dated at theRafter Radiocarbon Laboratory, GNS Science. Radiocarbonages were calibrated (Ⓔ Table S13) and stratigraphic se-quences were analyzed with the Bayesian analysis tools ofOxCal v.4.2.4 (Bronk Ramsey, 2009), using the southernhemisphere calibration curve SHCal13 (Hogg et al., 2013;Ⓔ Figs. S22–S24). Uncertainties at 2σ are given throughoutthis report, and calibrated ages are provided in A.D./B.C. for-mat. Particle-size analysis was undertaken with a Micromet-rics Saturn DigiSizer II 5205 at the University of Canterbury.
Geomorphic Map
The study sites are on a late-Holocene low-lying (<10 mabove mean sea level) floodplain–delta complex about 6–8 kmnorth of Lake Ellesmere. The floodplain–delta complex wasformed by old distributary channels of the Waimakariri River,which now flows to the sea north of Christchurch. The Hals-well River currently follows one of the ancient Waimakaririchannels (Figs. 1 and 2).
The DEMs reveal subtle topography and define the differ-ent geomorphic elements of the landscape (Fig. 2 and ⒺFigs. S1 and S2). The low topographic features (dark blue tolight green colors) comprise flood basin and interchannel sur-faces of relatively flat alluvial surfaces in the Waimakariri/Halswell basin, channels associated with the most recentcourse of theWaimakariri River, an earlier generation of paleo-channels inferred to be relict meanders of the WaimakaririRiver, and swales of point bars associated with relict meanders.
Liquefaction Features by Canterbury Earthquake Sequence and Assessment of Paleoliquefaction Features 5
BSSA Early Edition

The highest topographic features (yellow to red colorsin Fig. 2b and Ⓔ Fig. S2) represent raised crevasse splays(also known as floodplain splays) and channels or levees. Theraised channels of the Halswell River and its levee system areat a distinctly higher topographic level than the surroundingfloodplain. This indicates that the Halswell River must havegone through a depositional phase at this location to buildsuch prominent levee architecture. The crevasse splays maybe associated with either the current Halswell River or theWaimakariri River, given that some of them are eroded by therelict meander channels and some are filling those channels.
The two sites selected for detailed study, the Hardwickand the Marchand sites (Figs. 1 and 2), exemplify slightly dif-ferent types of geomorphic settings, as described as describedin The Hardwick Site and The Marchand Site sections.
The Hardwick Site
Geomorphology
The Hardwick site occurs on a relict meander (Figs. 2and 3). The lidar imagery clearly illustrates a leftward bendset within a floodplain, identified by light green colors inFigures 2 and 3. The downstream, southern part of the nowabandoned and infilled meander is at a lower elevation (bluecolor) than the floodplain, as would be expected, but the up-stream part stands above the floodplain (yellow–orange colors).This elevated area corresponds to a levee–crevasse splay sys-tem of a later paleochannel or perhaps the Halswell River.
Surface Expression of the 2010–2011 Liquefaction
At the Hardwick site, the 2010–2011 sand blows appearto be spatially associated with levee and crevasse splay de-posits that overtopped the river channel (Figs. 2 and 3). Thelower part of the old alluvial plain outside the channel (blueand dark green colors, Fig. 3) was subject to only minorliquefaction. In addition, some sand blows formed on theinner side of the abandoned meander at its southernmostsection (south of the Hardwick’s site; Fig. 2b).
The liquefaction features located above or spatially asso-ciated with the crevasse splay consisted mainly of sand blowsthat are aligned and coalesce along fissures to form sandridges. Individual sand blows were up to 40 cm high and 5 mwide. Aligned and coalesced sand blows formed sand fissuresup to 10 m long (Figs. 3 and 4). Some of the sand fissuresoverlapped, creating composite sand fissures up to 30 m long(Ⓔ Fig. S2). Most of the fissures and composite fissuresformed lineaments that were 100+ m long. Many of the fis-sures were aligned subparallel to the shape of the outer edge ofthe abandoned meander. Other fissures also seem to be asso-ciated with elevated areas within the crevasse splay. Liquefac-tion did not occur in areas of lower elevation within thecrevasse splay. In some locations, sand of different colorsand grain sizes vented to the surface (Fig. 4) suggesting differ-ent source layers. Other sand blows that were not aligned butwere associated with ground deformation (location 4b inFig. 3) occurred at the edge of the crevasse splay and/or immedi-ately adjacent to, but not within, the crevasse splay. At theselocations, we identified blisters, which are liquefaction features
Figure 2. (a) Geomorphic map of the wider study area and (b) digital elevation model (DEM) from light detection and ranging (lidar) withthe locations of the 2010–2011 liquefaction sand blows (black polygons).
6 P. Villamor, et al.
BSSA Early Edition

resulting from intrusion of sand beneath near-surface soil hori-zons, raising the ground surface to form mounds up to 20 cmhigh and 2.5 m in diameter. Although most of the injected sandbeneath the blisters did not reach the surface, a small proportiondid so through ruptures at points of strong surface inflection.
2010–2011 Liquefaction and PaleoliquefactionFeatures Exposed in the Hardwick Trenches
In the Hardwick trenches, we observed several types ofliquefaction features in the vertical section that were associ-ated with the 2010–2011 events. These included sand blows,dikes, and blisters. We also identified paleoliquefaction fea-tures, including an eroded sand blow and several dikes. In thissection, we present exemplars of the liquefaction features re-vealed in the trenches in the context of the stratigraphy andgeomorphology. Ⓔ Full trench and core logs are availablein the electronic supplement (Figs. S3–S10, S18, and S19;Tables S1–S7).
Location of Trenches. Seven trenches were excavated at theHardwick site (Fig. 3). Trenches HWK 1, 3, and 6 were ex-cavated across liquefaction features that formed during the2010–2011 earthquakes and are located on higher topographywithin the crevasse splay of the Waimakariri–Halswell flood-plain in the area where the crevasse splay clearly overlays theinfilled meander channel. Trench HWK 5 is located in a similarsetting but closer to the edge of the crevasse splay and poten-tially above the older meander channel. All these trencheswere excavated across fissures with aligned sand blows. TrenchHWK 4b was excavated beyond or at the very northern edge ofthe crevasse splay in an area of low topography, where lique-
faction caused ground deformation in the form of subcircularmounds with small amounts of sand escaping to the surface(blisters; see detailed description in the MAR 4 trench section).
Trenches HWK 2 and 4a were excavated in areas that hadno surface expression of liquefaction. Trench HWK 2 corre-sponded with a low topographic point within the central partof the abandoned channel overlain by the crevasse splay amongtrenches HWK 1, 3, and 6. Trench HWK 4a was located on thelower topographic levels of the Waimakariri–Halswell flood-plain away from the old meander channel. The trench was in-tended to allow contrasts in sedimentology between areas ofpresence and absence of surface expression of liquefaction tobe identified. Unfortunately, a shallow perched water tablecaused the trench walls to collapse, so it could not be analyzedin detail. However, some samples for radiocarbon dating andparticle-size analysis were collected prior to collapse.
Core Samples. To further understand the sedimentary char-acteristics of this site, including potential identification of thesource layers of liquefied sand, we extracted (1) 4 m of corebelow the HWK 6 trench at vertical meter mark 7 along thetrench and starting from the trench floor (from 1.4 to 5 m depthbelow ground surface) (core HWK 6–1; see core log in HWK 6trench log in Ⓔ Figs. S9 and S10 and core description in ⒺFig. S19) and (2) 2 m of core from below the HWK 5 trench atvertical meter mark 3 (core HWK 5–1; see core log in HWK 5trench log in Ⓔ Fig. S8 and core description in Ⓔ Fig. S18).
Sedimentary Units at Hardwick Site. We grouped thesedimentary units of the trenches at Hardwick into three mac-rounits (e.g., see trench HWK 6 and core HWK 6-1 in Figs. 5and 6 andⒺ Figs. S9, S10, and S19). This grouping is based
Figure 3. (a) Orthophotograph and (b) DEM from the lidar data of the Hardwick site showing the location of the trenches. Liquefactionsand blows can be observed on the orthophotograph. The location of the blisters is also shown.
Liquefaction Features by Canterbury Earthquake Sequence and Assessment of Paleoliquefaction Features 7
BSSA Early Edition

mainly on textural similarities, and incorporates soil stratig-raphy. It aims to associate macrounits with sedimentary envi-ronments (although this association has not been possible forall macrounits within the scope of this study). Detaileddescriptions for individual layers within the macrounits areavailable in Ⓔ Tables S1–S7.
Macrounit 1, the uppermost unit, is characterized byalternating loamy silt and very fine sand layers and also theorganic-rich topsoil. The unit varies from yellowish brown togray and includes common redox segregations. Soil strati-graphic features, including truncated root pseudomorphs(redox features) and relict surface-horizon soil structure,indicate that this is a composite depositional unit.
Macrounit 2 underlies macrounit 1 and is characterizedby a gray, silty upper part with common redox segregations,which grade downward into very fine to fine sand. The upper20–30 cm, where intact, may be organic rich and includespeat layers and root remains. The underlying fine sand ismoderately sorted, and grains are subrounded.
Macrounit 3 is distinctly different from the upper units.It consists mainly of medium sand, a coarser texture than thatfound in macrounits 1 and 2. Macrounit 3 is massive, andgrains are very well sorted and rounded. Overall the unit hasa gray color in its upper part, grading downward to olive grayat the base. This macrounit is exposed only in the HWK 6deepest core sections (below the floor of the HWK 6 trench).
Along a transect between trenches HWK 3–HWK 6 andtrench HWK 4b (Fig. 3), the correlation of changes in thethickness of macrounit 1 with the changes in topography wasused to infer that macrounit 1 represents the deposits of thecrevasse splay lobe. A thinning of macrounit 1 (from 1.2to 0.8 m) to the north was obvious in the walls of trench
HWK 6 (seeⒺ Figs. S9 and S10). The surface elevation alsodecreased as the crevasse splay lobe terminates against astream channel. The contact between macrounits 1 (crevassesplay) and 2 (channel fill; see below) is erosional, althoughremnants of an organic-rich horizon (a paleosol) in the topof macrounit 2 are preserved (e.g., Fig. 6a–d). Detrital organ-ics occur as lenses above the contact (e.g., Fig. 6d); and, in thesouthern end of trench HWK 6, a subfossil tree was exposed inthe base of macrounit 1 (Ⓔ Fig. S9). The top of macrounit 2 isa gray silt with common, coarse, orange–brown, sphericalmottles. One sample from within 30 cm of the top of macro-unit 2 yielded the conventional radiocarbon age (calibratedages can be found in Ⓔ Table S13) of 2004� 18 yr B.P.(sample HWK T6-C5; Fig. 6 and Ⓔ Fig. S9). Two samplestoward the middle-to-lower section of macrounit 2 within thecores yield ages of 2939� 20 yr B.P. (sample HWK 6-C1-T2-S1, core HWK 6 C1; Ⓔ Fig. S10) and 398� 17 yr B.P.(sample HWK 6-C2-T2-S1, core HWK 6 C2; Ⓔ Fig. S10),the latter one being an obvious outlier. Part of a small treerooted in the very top of macrounit 2 and in growth positiongave an age of 721� 18 yr B.P. (HWK T6-C12; Fig. 5 andⒺ Fig. S10). Above the unconformity (at the base of macro-unit 1), detrital organics (undifferentiated plant material ex-tracted from the sediment) yielded ages of 668� 18 yr B.P.,641� 20 yr B.P., and 641� 19 yr B.P. (samples HWKT6-C7, HWK T6-C10, and HWK T6-C14, respectively; ⒺFig. S9). The contact between macrounits 2 and 3 was iden-tified in core samples at ∼4:7 m depth but had no age con-straints; the base of macrounit 3 extends beyond 5.1 m depth(Ⓔ Fig. S10).
At trench HWK 2, on the margin between the abandonedmeander and another lobe of the crevasse splay to the north,
Figure 4. Photographs of sand blows at Hardwick site taken on 4 September 2010 ∼12 hours after the Darfield earthquake. (a) Field offissures with coalescent sand blows. (b) Detail of individual fissure with coalescent sand blows (approximately 2 m long). (c) Detail of sandblows with two different types of ejected or vented sand (different colors). The two types of sand are well sorted and stratigraphically separatein profile, suggesting that there is little to no incorporation of sediment from layers through which the slurry of water and entrained sedimentflowed on its way to the surface. Therefore, the sand composing the two layers of the sand blow was derived from different source layers.(Photos courtesy of Caroline Hardwick).
8 P. Villamor, et al.
BSSA Early Edition

macrounit 1 had thickened again to 1.53 m (Ⓔ Table S2). Thetop of macrounit 2 (exposed at 1.53–1.85 m depth) was a dis-tinct, intensely reduced blue–gray, massive silt with no visibleorganics. Farther north, at trench HWK 1 (located in the centerof the crevasse splay lobe), the stratigraphy was similar totrenches HWK 3 and HWK 6. At trench HWK 5, the contactbetween macrounits 1 and 2 appeared to be nonerosive (at∼1.5 m depth). A peat was preserved below the contact at1.6 m depth. A radiocarbon sample from the top of the peatyielded 628� 18 yr B.P. (sample HWK 5–C1; Fig. 7 andⒺFig. S8), similar to the detrital organics in macrounit 1 attrench HWK 6. Coring to 3.7 m depth failed to reach the baseof macrounit 2. The most northerly trench (trench HWK 4b;Ⓔ Fig. S6), situated beyond the northern limit of the crevassesplay lobe, exposed only macrounit 2.
In summary, macrounit 1 contributes to the higher topog-raphy associated with the crevasse splay deposits. Depositionwas preceded by erosion, ripping up material from underlyingdeposits, and burying and killing trees. Macrounit 2 is asso-ciated with a pre-existing channel fill–floodplain sedimentassociation. Deposition of macrounit 2 had ceased around
3000 yr B.P., and soils were developing in it until the deposi-tion of macrounit 1 at ∼650 yr B.P. The coarser sands of mac-rounit 3 suggest a higher-energy fluvial environment, but thegeomorphic context is now obscured by the overlying materi-als. Further work on grain size, sedimentary fabric, and datingis currently being undertaken to better interpret this unit.
Representative Liquefaction Features from Three Trenches. Wepresent here exemplars of liquefaction and paleoliquefac-tion features observed in some sections of the trenches at theHardwick site.
HWK 6 Trench. Trench HWK 6 was 34 m long and1.5–1.8 m deep (Figs. 5 and 6; for full trench logs see ⒺFigs. S9 and S10). Both trench walls, HWK 6E and HWK 6W,were logged in detail between vertical lines 1 and 23. Someareas with liquefaction features were mapped at 1:10 scale,and other areas were mapped at 1:20 scale. Gradual collapseof the walls between vertical lines 23 and 32 precluded detailedlogging, and only the contacts of major units were mapped at2-m-spacing vertical lines.
The 2010–2011 liquefaction features exposed in thistrench were sand blows and dikes (Figs. 5 and 6). The trenchwas excavated at right angles to the sand fissures to expose thetrue cross-section dimensions and shape of individual sandblows and dikes. The spacing between sand blows ranged be-tween 4 and 14 m along the trench. At the surface, the sandblows exposed in this trench have widths between 0.5 and 2 mand heights between 5 and 10 cm (for data on sand-blow sizes,see also Ⓔ Table S11 and Ⓔ Fig. S15). These values areslightly modified from the original dimensions by erosion dueto rainfall, wind, and trampling by cattle. However, no plowingoccurred after the formation of the sand blows and, as a con-sequence, the measurements are closely representative of theoriginal sizes. Each sand blow was associated with dikes withaverage widths, typically ranging between 3 and 20 mm (maxi-mum of 100 mm; for data on dike widths and sand blow sizes,see also Ⓔ Table S11 and Ⓔ Fig. S15). The dikes could befollowed from the trench floor to the ground surface. The rootof the dikes was not observed in the trench.
Figures 5 and 6 show examples of the upper part of adike (close to the surface) and a sand blow. On the west wall,at vertical line 13.4 (Fig. 5b), we observed the upper part of adike that feeds into a sand blow 20 cm west of the trench.This dike changes in width along its length, a common fea-ture for most of the dikes exposed at this site. We assigned anaverage width and a range to each dike (Ⓔ Table S11 andⒺFig. S15). The dike also splays into two branches close to thetrench floor, where it follows the outside edges of an olddike (described below). In the east wall, at vertical line 18(Fig. 6a), a small sand blow shows the typical convex shape,slightly eroded from the original shape. The dike feeding thissand blow is very thin: 10 mm wide close to the floor of thetrench but only 3 mm wide for most of its length.
As measured from aerial photography, the trend of thelarger sand-blow fissures close to trench HWK 6 ranges from
Figure 5. HWK 6 trench west wall. (a) Section of trench log (ver-tical lines 10–15.5). For radiocarbon sample HWK T6-C12, only thecorrelative stratigraphic position is shown (for the full trench log, in-cluding location of sample HWK T6-C12, see Ⓔ Fig. S10). (b) Ex-ample of a 2010–2011 liquefaction dike and sand blow (see locationof photograph in a). (c) Paleoliquefaction dikes at the same locationexposed on the trench floor and wall. Note that the 2010–2011 dikeshave been reinjected along the paleoliquefaction dikes (see also a).See Figure 3 for trench location. SeeⒺ Figure S10 for exact locationof sample HWK T6-C12.
Liquefaction Features by Canterbury Earthquake Sequence and Assessment of Paleoliquefaction Features 9
BSSA Early Edition

N50°E to N75°E and other smaller fissures trend east–westand N20°E. The strike of individual dikes measured within thetrench walls and floor display two orientations: N20°E–N50°Eand N130°E–N150°E (Ⓔ Fig. S16 and Ⓔ Table S12).
Several paleoliquefaction features were also observed onboth walls of the HWK 6 trench. Between vertical lines 10 and14 on thewestern wall and continuing across the trench floor, atleast three paleoliquefaction dikes could be observed (Fig. 5a).The dikes are weathered and redox segregations (mottles) crossthe dike margins, indicating that they were formed well beforethe 2010–2011 earthquakes. In contrast, the 2010–2011 dikesare unweathered and are not mottled. The paleodikes areslightly wider than the 2010–2011 dikes (averagewidth of 4 cmcompared with 2 cm; Ⓔ Table S11). The paleodikes intrudeinto macrounit 2 but not macrounit 1, and so the age of macro-unit 1 establishes a minimum for the penultimate shaking eventthat formed the paleodikes. As can be seen at vertical line 13,the outer margins of the paleodikes were used by the 2010–2011 dikes as injection pathways (Fig. 5a).
On the eastern wall at vertical line 13, a paleosand blowappears eroded at the unconformity between macrounits1 and 2, so that only the lower part of it has been preserved(Fig. 6b,d). The preserved part has a very convoluted lowerboundary. It is likely that the slurry of water and sand intrudedalong the roots of a tree or into cavities left by rotting roots. Amodern analog to this feature was observed farther north alongthe same trench wall (at vertical line 23 on the eastern wall;Ⓔ Fig. S9) where the base of the sand blow had an irregularshape, filling root cavities within the topsoil. The paleosandblow is connected to a paleodike that was used as the injectionpathway during the 2010–2011 liquefaction events.
HWK 5 Trench. The HWK 5 trench was excavatedacross an N90°E-trending fissure with coalescent sand blows.The trench was 6.5 m long and 1.5 m deep (Fig. 7a). Anadditional pit was hand excavated at the bottom of the trenchto 2.5 m depth. Sediment cores were extracted from the bot-tom of the trench down to 5.5 m (for full trench and core logs
Figure 6. HWK 6 trench east wall. (a) Section of trench wall log (vertical lines 19–17; for the full trench log seeⒺ Fig. S9). (b) Trenchwall log (vertical lines 14–12). For radiocarbon sample HWK T6-C5, only the correlative stratigraphic position is shown (see full trench logfor sample location). (c) Photograph of a 2010–2011 liquefaction dike and sand volcano (see location of trench in Fig. 3). (d) Photograph ofpaleoliquefaction features at the same location. An old dike and a buried and eroded sand blow (filling tree root space) are displayed (seelocation in b). The dashed white line delineates parts of the paleosand-blow margin. The presence of an erosional unconformity between units6bA and 5Cg provides evidence that the upper part of the paleosand blow has been eroded. The sand-blow age is constrained by the ages oflayer 6bA (paleosol), the base of layer 5Cg, and by a radiocarbon sample taken from within the sand blow. Old and new dikes follow the samepath. See Figure 3 for trench location. Ⓔ See Figure S9 for exact location of sample HWK T6-C5 and HWK T6-C10.
10 P. Villamor, et al.
BSSA Early Edition

and the sedimentary unit description, see Ⓔ Figs. S7, S8,S18, and Ⓔ Table S6).
All liquefaction features exposed in the trench were pro-duced by the 2010–2011 earthquakes and consisted of (1) acompound sand blow that was 3.4 m wide and 20 cm thick(Fig. 7a), (2) two thin (2–10 mm) dikes feeding the sandblow, and (3) an ∼10-cm-thick sill at the base of the trench(Fig. 7a,b). The compound sand blow formed during severalof the earthquakes in the 2010–2011 sequence.
The subvertical-to-vertical dikes feeding the sand blowhad strikes of N114°E (dike at vertical line 5) and N90°E–N100°E (dike at vertical line 3). Those orientations corroboratethe trends of liquefaction lineaments observed in this area fromaerial photography (Fig. 3a), in which N90°E is a dominanttrend displayed by numerous lineaments that exceeded 100 min length (composed of aligned fissures with coalescent sandblows). Also in the aerial photo, shorter (<50 m) lineamentswith an ∼N120°E trend can be observed. The edge of the pa-leochannel at this location is oriented N90°E–N110°E. Thedikes were observed cutting all the way from the trench floorthrough macrounit 1 to the ground surface (Fig. 7a). The dikeseemed to be rooted in a sandy layer at the base of the trench,but further excavations and coring confirmed that the layer wasa sill and that the source sands that liquefied must have beendeeper than the trench floor (i.e., >1:5 m).
The sill at the base of the trench was injected into theupper part of macrounit 2 (inside the uppermost organic layers7bOh1–9bOh3; Fig. 7a). The sill was observed at the bottomof the hand-excavated pit on the western and northern trenchwalls. The corner of the western and northern walls of the smallpit is shown in Figure 7b, where two vertical dikes can be ob-served rooted into the sill (note that those dikes are on thenorthern wall of the small excavation and thus do not appearon the western wall log). The base of the sill was difficult toreach because of the presence of the water table in the bottom
of the small hand-dug pit, but core HWK5 confirmed that it wasa sill rather than the top of the source sand for the liquefactionfeatures. Units 7bOh2–9bOh3 are loose in nature, with largepieces of wood and remnants of sedge vegetation. Followingliquefaction, the pressurized slurry of water and sand could haveeasily injected horizontally along theweaker partings within thisprincipally organic unit, thereby locally forming sills.
HWK 3 Trench. The HWK 3 trench was excavatedacross one of the largest sand blows, with dimension of4.4+ m width and at least 0.35 m height. The most strikingfeature at this location was a small, 1-m-wide collapse crater(Fig. 8). This crater formed a few weeks after liquefactionoccurred (Caroline Hardwick, personal comm., 2012). Thewestern trench wall exposed a complex dike structure withthree thick dikes (up to 90 mm wide) connecting to a sill (upto 240 mm thick). Collapse occurred in the area occupied bythe sill. At this location, there is no connection between thesill and the sand blow; the connection was observed alongstrike, as can be seen on the eastern wall (Ⓔ Fig. S5).
The surface sand fissure has a trend of N45°E and is thesame fissure as the one exposed in trench HWK 6. The strike ofthe dike ranges from N72°E to N87°E (with dips between 55°and 90° toward both the northwest and southeast;ⒺTable S12)and is more east–west than the mean N45°E of the fissure atthis location.
The Marchand Site
Geomorphology
The Marchand site is located within a meander bend ofthe Halswell River (Figs. 2 and 9). The subtle topographydisplays high areas (1+ m; in yellow and orange; Fig. 9b) ad-jacent to low areas (green and blue), parallel and subparallelto the current river channel. The high-standing geomorphic
Figure 7. HWK 5 trench west wall. (a) Trench wall log (for the full trench log seeⒺ Fig. S8). (b) Photograph of liquefaction sill and dike(gray sands) from the 2010–2011 earthquakes. Photograph is from a small hole excavated at the trench floor. The photograph shows a wallperpendicular to the west wall at approximately vertical line 3. This exposure was not logged. See Figure 3 for trench location.
Liquefaction Features by Canterbury Earthquake Sequence and Assessment of Paleoliquefaction Features 11
BSSA Early Edition

features are a levee and two main scroll bars. The low areasare the swales between scroll bars.
Surface Expression of the 2010–2011 Liquefaction
Liquefaction features produced during the 2010–2011earthquakes—including sand blows, sand fissures, andblisters—formed along the higher elevation scroll bars andwere absent in the intervening low areas (Fig. 9a). The sandfissures and aligned sand blows were subparallel to the scrollbars and river channel. Some of the fissures were up to 50 m inlength and composed of coalescent sand blows up to 4 m wide.Mounds associated with blisters were up to 2 m in diameter,and some were associated with ejected sand or sand blows.
2010–2011 Liquefaction and PaleoliquefactionFeatures Exposed in the Marchand Trenches
In the Marchand trenches, several types of 2010–2011liquefaction features were exposed, including cross-sectional
views of sand blows, dikes, and blisters. We also found sev-eral paleoliquefaction dikes. In this section, we show the lo-cation of the trenches with respect to the geomorphic featuresdescribed above. In addition, we describe and estimate theages of sedimentary units found in the Marchand trenchesand present the best examples of liquefaction features.
Location of Trenches. Four trenches at the Marchand sitewere excavated across the 2010–2011 liquefaction features(Fig. 9). Trenches MAR 1 and MAR 4 were located on ascroll bar within 25–50 m of the inside of a meander bendof the Halswell River. Trenches MAR 2 and MAR 3 werelocated on a more distal and broader scroll bar on the insideof the meander bend about 90 m from the Halswell River.Substantial liquefaction occurred at the highest point of thisolder bar, but it could not be studied because of the presenceof buildings. Also trench MAR 2 collapsed during excava-tion and could not be studied. Two cores at the base oftrenches 1 and 4 reached depths of ∼4 and 3 m.
Sedimentary Units at Marchand Site. Sedimentary sequen-ces in the MAR 1 and MAR 4 trenches, located on the outerscroll bar closest to the current river channel, were similar.We recognized two macrounits in each, labeled 1a and 2a(Fig. 11; see full trench logs in Ⓔ Figs. S11, S12, and S14;see trench unit descriptions inⒺ Tables S8 and S10; see coredescriptions in Ⓔ Figs. S20 and S21). The use of similarnomenclature for macrounits at the Hardwick and Marchandsites does not imply a stratigraphic correlation between thetwo sites. Also, the “a” designation distinguishes macrounitson the outer scroll bar from those on the inner scroll bars(labeled “b”; see below) at the Marchand site. Macrounit1a was characterized by very fine sediments, comprising siltloams, loamy silts, and very fine sands. The upper boundaryof macrounit 2a at 1.5 or 1.8 m depth for trenches MAR 1and MAR 4, respectively, was defined by a woody peat up to70 cm thick within macrounit 2 found in the cores. Belowthis layer, sediments of macrounit 2a alternated between siltsand medium sands with some thin fine sand beds. The lower-most 60 cm of the unit, from 4.1 to 4.7 m depth (revealed attrench MAR 1) was a distinctive olive-brown to yellow-brown medium fine sand. This sand was the same color andgrain size as the sand in the sand blows observed on the outerscroll bar and within the blister that we excavated at trenchMAR 4
A charcoal sample from 1.3 m depth in macrounit 1ayielded a radiocarbon age of 861� 18 yr B.P. (sampleMART1-C6; see MAR 1 trench log inⒺ Fig. S12 and radio-carbon age data inⒺ Table S13), and a sample from near thebase of the peat marking the top of macrounit 2a at the samesite provided an age of 1009� 18 yr B.P. (sample MAR1-C1-T2-S1; Ⓔ Fig. S11 and Ⓔ Table S13). In MAR 4trench, a sample from the top of the same peat yielded anage of 709� 19 yr B.P. (sample MAR 4-C1-T1;Ⓔ Fig. S14andⒺ Table S13). A thinner peat layer (5 cm thick) at 3.06 m
Figure 8. HWK 3 trench west wall. (a) Trench wall log (forthe full trench log see Ⓔ Fig. S4). The middle section of the sedi-mentary package has subsided, forming a small collapse structure orgraben. At that location there is a thick (∼25 cm) liquefaction sill.(b) Photograph of the trench wall. See Figure 3 for trench location.
12 P. Villamor, et al.
BSSA Early Edition

depth gave an age of 1918� 20 yr B.P. (sample MAR 4-C1-T2-S1; Ⓔ Fig. S14 and Ⓔ Table S13).
Sedimentary units exposed in the MAR 3 trench, locatedon the inner scroll bar, were similar to macrounit 1a; however,the time-transgressive nature of sedimentation across meanderscroll sequences reduced our confidence in the strength of thisstratigraphic correlation. Consequently, we have provisionallylabeled this unit macrounit 1b until additional data becomeavailable. A relatively old age of 1038� 20 yr B.P. from only0.6 m depth (sampleMART3-C2 in Fig. 10a andⒺ Fig. S13;Ⓔ Table S13) affirms the need for a cautious approach tostratigraphic correlation. No deeper stratigraphic units weredefined during this study.
Representative Liquefaction Features from Two TrenchesMAR 3 Trench. MAR 3 trench was 4 m long and 1.2 m
deep and excavated across a sand blow of a N35°E-trendingfissure of coalescent sand blows. Three walls of the trench werelogged with 1 × 1 m2 and 0:5 × 0:5 m2 grids (Fig. 10a andⒺFig. S13). The walls perpendicular to the fissure (northeast andsouthwest) exposed a subvertical, 10–100-mm-wide dike run-ning from the trench floor and connecting with the sand blowat the surface. The north wall, parallel to the trend of the fissure,exposed a series of dikes (40–100 mmwide) with a subhorizon-tal apparent dip (true dip 28°–58° NW). These dikes had strikesof N30°E–N50°E and N160°E (Ⓔ Table S12 andⒺ Fig. S17).
Two generations of dikes were observed in the trench:2010–2011 dikes and paleodikes (Fig. 10c). The former re-cently injected sand dikes were unweathered and had sharpmargins and clear connections both to the sand blow exposedat the surface and to each other. The paleodikes were weath-
ered and had clear but irregular margins crosscut by redoxsegregations. The paleodikes were locally crosscut bythe 2010–2011 dikes. In some places, the 2010–2011 dikeswere intruded along the margins of the older dikes. The ex-posed sand blow was 4 m wide and 20 cm high. Depositionalfeatures, such as fine crossbedding, were observed. Twomain depositional units belonging to the 2010–2011 eventscould be distinguished by the presence of tree leaves depos-ited on the sand blow prior to the second event (Fig. 10b).
MAR 4 trench. MAR 4 trench was 1.4 m deep and 5 mlong and was excavated across one of the circular-to-subcircular mounds that were formed during the 2010–2011liquefaction events (Fig. 9). Some of these mounds, such asthe one studied in the MAR 4 trench, were also associatedwith sand vented on the surface. We describe these types offeatures as liquefaction blisters, and they seem to occur inareas of thick (>0:5 m) topsoil.
The liquefaction blister exposed in the MAR 4 trenchconsisted of two shallow dipping (0°–45° dip both northwestand southeast), N25°E–N70°E striking, thick (up to 25 cmwide) dikes injected into the topsoil (Fig. 11a–d), and sandblows formed where dikes reached the surface. The local thick-ening of the topsoil layer caused by sand injection created themound or blister on the surface. The sand dike beneath theblister was 7 cmwide and could be traced downsection throughthe alluvial sequence to the bottom of the trench (Fig. 11a,e).The liquefied sand layer that was the source of the sand dikeswas not observed in the trench. The dikes forming the blisterexhibited laminations (defined by subtle changes in grain size)in the connection between the blister dikes and the thin feeding
Figure 9. (a) Orthophotograph (provided by Canterbury Regional Council) and (b) DEM from lidar data of the Marchand site showing thelocation of the trenches. Liquefaction sand blows can be observed on the orthophotograph. Inset photograph with arrow shows the surfaceexpression of fissures and coalescent sand blows along fissures (photograph taken in March 2012).
Liquefaction Features by Canterbury Earthquake Sequence and Assessment of Paleoliquefaction Features 13
BSSA Early Edition

dike (Fig. 11c) that were parallel to the dike margins (Fig. 11d).The lamination suggests laminar flow during injection ofthe slurry. Trench HWK 4b at the Hardwick site was exca-vated across a blister that displayed similar characteristics(see Ⓔ Fig. S6).
A small graben-like structure associated with a subvert-ical sand dike below the blister was observed at the base ofthe MAR 4 trench wall (Fig. 11a,e). However, with the lim-ited exposure, it is difficult to know whether this structure isan elongated graben or a circular, or semicircular, collapsestructure. The trend of dikes in the collapse area is to be allsubparallel to the scroll bar, suggesting that the collapse islikely to be elongated. This structure occurs close to the riverbank, and thus it may be associated with lateral spreading. Itis also possible that the collapse is associated with consoli-dation and/or evacuation of an underlying liquefiable sandreservoir, and thus its shape would then be determined by thevolume of the evacuated sand. The geometric relationshipsbetween faulting, dike intrusion, and sedimentation suggest
that the small graben formed during the 2010–2011 earth-quake sequence. No prior liquefaction event(s) could beidentified in the MAR 4 trench.
Discussion
Liquefaction
Influence of the Sedimentary Environment in the Distributionof Liquefaction
Association between Meander Scroll Bars andLiquefaction. There is a strong spatial correlation betweenparticular environments within the alluvial system and theoccurrence of the 2010–2011 liquefaction. Therefore, de-tailed mapping of geologic deposits (assisted by geomorphicmapping with high-resolution topographic maps) may help toidentify sites that liquefied in the past and that may be prone toliquefaction in the future. Our results also corroborate previousfindings that liquefaction susceptibility is strongly linked to theenvironment of deposition (e.g., Youd and Hoose, 1977; Youd,
Figure 10. MAR 3 trench combined west–north–east walls (note that three different walls are displayed in the figure). (a) Trench log (forthe full trench log, see Ⓔ Fig. S13). The 2010–2011 liquefaction, as well as paleoliquefaction features, were observed in the MAR 3 trench.Note that dikes appear subhorizontal in the north trench wall because the wall is subparallel to the dike strikes (see dike azimuths inⒺ Fig. S17).Modern dikes cut through paleodikes, indicating a younger relative age. The maximum age of the paleoliquefaction is constrained by the age ofthe host sediment (unit C(g)). (b) Detail of the 2010–2011 sand blow on the west wall. Tree leaves were found at the contact between theSeptember 2010 and February 2011 events. (c) Detail of the 2010–2011 dike and paleodikes on the north wall. Note the weathering features inthe paleodikes. See Figure 9 for trench location.
14 P. Villamor, et al.
BSSA Early Edition

1984; Tuttle and Atkinson, 2010; Holzer et al., 2011; Tuttleand Hartleb, 2012; Civico et al., 2015). At Lincoln, we are inthe process of investigating the characteristics of the sedimentthat liquefied and its depositional environments to strengthenthese correlations. Here, we summarize our observations andpreliminary interpretations.
There is a very strong spatial correlation between lique-faction features and the ridges of scroll bars on the insidebends of meander loops. This correlation has been observedat the Marchand site (Figs. 2 and 9) and in several areas alongthe Halswell River channel. The Marchand site excavationsalso exposed paleoliquefaction dikes at the same location asthe 2010–2011 liquefaction features. The orientations of thesand fissures (Figs. 2 and 9) and the feeder dikes (Ⓔ Ta-ble S12 and Ⓔ Fig. S17) are subparallel to the scroll bartrends and the river channel.
Liquefaction associated with the inner side of meandershas been widely reported in New Zealand (Quigley et al.,
2013; Bastin et al., 2015) and elsewhere (e.g., Youd andHoose, 1977; Tuttle, 1999; Holzer et al., 2011). Liquefactionoccurs here because (1) the sediments are typically youngerand less consolidated in the inner meanders and (2) duringstrong horizontal ground motions, the inner banks of mean-ders are not confined (i.e., the arching geometry of the innermeanders allows for lateral spreading), whereas outer mean-ders are confined. These are characteristics specific to theMarchand site.
At the Marchand site, we also observe that surface ex-pressions of liquefaction are confined to meander scroll bars(ridges) and are not present in the swales. The source layer forthe liquefied sands was not exposed at this site, but liquefac-tion of the MAR 2 trench floor at <1 m depth during exca-vation (caused by the vibration of the digger) suggests that itcould be quite shallow. The water table at the time of exca-vations was ∼1:5 m deep at the Marchand site. In point-barsystems, sedimentary deposition processes, and thus the prop-erties of sediments such as grain-size distribution, void ratio,and permeability, and their depth below the surface, differ be-tween ridges (scroll bars) and swales (Pranter et al., 2007; Vande Lageweg et al., 2014). The ridges are underlain by sandypoint-bar deposits that are close to the surface, whereas sandydeposits are much deeper beneath swales and are overlain byrelatively thick fine-grained and organic-rich deposit. Theseobservations agree with the explanation that sand dikes andblows form along the crests of scroll bar deposits due to theliquefaction susceptibility of underlying point-bar depositsand the relatively thinness of the top stratum.
Association among Abandoned Meander Channels,Abandoned Point Bars, Crevasse Splays, and Liquefaction. Atthe Hardwick site, because the crevasse splay overtops anold, infilled meander channel and its scroll bars, the corre-lation between the spatial distribution of liquefaction and thegeomorphic elements of the alluvial system is less clear.Grain-size analysis, together with analysis of the liquefactionpattern, suggests that liquefaction at the Hardwick site couldbe associated with the channel and point-bar deposits. Prelimi-nary comparisons of particle-size distribution between thesand-blow material and deeper sections of the longest core(HWK 6–1) (Fig. 12) suggest that the sand blows could besourced from a layer at 4+ m depth (macrounit 2; e.g., sampleHWK 6 C1-T2-60 in tube 2 at 60 cm depth in Ⓔ Fig. S19b,which has a similar particle-size distribution as the liquefiedsands in Fig. 12, was located ∼4 m depth). Based on unit de-scriptions and the geomorphic setting, that layer is likely toconsist of channel bed or point-bar deposits (sand) overlain bychannel infill deposits (silt) (macrounit 2), which in turn areoverlain by crevasse splay deposits (macrounit 1). The liquefac-tion fissures show several trends (surface expression, Figs. 2, 3,and Ⓔ Fig. S1; dike trends, Ⓔ Fig. S16), with two predomi-nant orientations that are subparallel to the old meander channeland to the inferred orientation of its scroll bar complex.Liquefaction features often form along the margins of an aban-doned channel deposit where fine-grained deposits overlie
Figure 11. MAR 4 trench east wall. (a) Trench log (for the fulltrench log and core location, see Ⓔ Fig. S14). Note the downwarddrag of layers toward the center, under the blister, and the mechanicaloffsets (similar to faults) displayed in the lower part of the wall (col-lapse structure; ground failure). (b) Detail of flow structures in thedikes. (c) Photograph of upper meter of the trench wall where theblister was found. (d) Detail of the collapse structure (graben; seesubsidence of layer highlighted with a yellow dashed line and dikesintruding along the “faults”). (e) Generic sketch of blister in compari-son with a sand blow. In the blister, the sills and low-angle dikes splitthe soil layers in close proximity to the ground and uplift the groundsurface. On occasions, some of the sand can extrude to the surface.
Liquefaction Features by Canterbury Earthquake Sequence and Assessment of Paleoliquefaction Features 15
BSSA Early Edition

coarse-grained deposits (Tuttle and Barstow, 1996). However,at the Hardwick site, based on the surface expression of lique-faction, liquefaction features not only formed along the marginof the old channel, but they also formed within the abandonedchannel itself and its buried scroll bars.
The other peculiarity of the Hardwick site is that, whilethe meander channel and associated scroll bars extend farthersouth from the site (Fig. 2), the surface expression of lique-faction is prominent where the meander is covered by silt andvery fine sand of the crevasse splay (macrounit 1) but is al-most absent farther south. The reason for the presence of per-vasive liquefaction in the area of the crevasse splay and not tothe south remains unclear. The spatial association betweenliquefaction and the crevasse splay may be purely coinciden-tal, but further studies are being undertaken to understandwhy this area was so susceptible to liquefaction.
Association between the Floodplain and Liquefac-tion. Particle-size analysis suggests that the sands in thefloodplains are potentially liquefiable. However, no surfaceexpression of liquefaction occurred on the floodplain. Sandsamples obtained at 2.8 m depth from the HWK 4a trench(sample PAD in Fig. 12; trench location in Fig. 3) show a sim-ilar particle-size distribution to the liquefied sand in HWK 6(samples GS1–GS4 in Fig. 12; location of samples ontrench logs inⒺ Figs. S10 and S19), and the water table wasclose to the surface. This observation suggests that the flood-
plain could have potentially liquefied but that sand was notejected to the surface or that the floodplain did not liquefy.Further studies with exploration methods that allow retrievalof information in water logged areas are needed to betterunderstand the liquefaction process in the floodplain.
Inferences for Paleoseismology and Hazard Assessment fromObserved Liquefaction Features. In this section, we sum-marize the types of liquefaction features found in thetrenches and present some insights into how these observa-tions can be used for interpretation of similar paleoliquefac-tion features. We also discuss the sizes of the liquefactionfeatures in the context of earthquake magnitudes.
Types of Liquefaction Features Observed. Four maintypes of features have been found in the trenches in the Lin-coln area:
• Sand blows that formed single and multiple, coalescingsand blows along linear fissures (e.g., Fig. 4): Some sandblows contain different types of sand (Fig. 4c), which mayimply that they come from different sources during thesame shaking event.
• Blisters or injections of subhorizontal dikes into the topsoilthat have not fully ejected to the surface: These injectionsraise the ground surface, producing a subround mound,like a blister (trenches HWK 4b and MAR 4; e.g., Fig. 11).
Figure 12. Comparison of particle size with thresholds for liquefiable sands based on Tsuchida (1970): GS1, paleoliquefaction dike fromHWK 6 trench west wall; GS2, paleoliquefaction sand blow from HWK 6 trench east wall; GS3, modern dike from HWK 6 trench east wall;GS4 modern sand blow from HWK 6 trench east wall; PAD, nonliquefied sand from 2.8 m deep at HWK 4a trench; HWK 6 C1 T1 20, sandlayer located at 1.8 m depth (core; macrounit 2); HWK 6 C1 T2 60, sand layer located at 4.0 m depth (core; macrounit 2); HWK 6 C1 T3 20,sand layer located at 4.8 m depth (core; macrounit 2); HWK 6 C1 T4 60, sand layer located at 5.5 depth (core; macrounit 3). Particle-sizeanalysis was undertaken with a Micrometrics Saturn DigiSizer II 5205 at University of Canterbury.
16 P. Villamor, et al.
BSSA Early Edition

Occasionally, part of the injection reaches the surface viarupture of the blister.
• Dikes originating in the subsurface layers that liquefied,crosscutting overlying sediment: In some cases, theseare involved in the formation of blisters and sand blows(also in most trench logs; e.g., Fig. 10a,c).
• A collapse structure associated with dikes, where soft-sediment faults are intruded by dikes (e.g., Fig. 11a,e):This type of structure seems to form close to the river bankand thus may be associated with lateral spreading or withcollapse due to consolidation and/or evacuation of anunderlying liquefiable sand reservoir.
Insights into Paleoseismic Exploration Methods. Thesizes of liquefaction features described here have implica-tions for the methods that will be most useful for identifyingthe presence of paleoliquefaction in similar alluvial systems.For example, high-resolution geophysics may be required toimage thin dikes similar to those that formed during the2010–2011 Canterbury earthquakes, and paleoseismic exca-vations may be sited in crevasse splay deposits that havebeen shown to bury and preserve small sand blows thatwould not persist for long at the ground surface.
Insights into the Age of Paleoliquefaction Features. Animportant aspect of estimating the age of paleoliquefactionfeatures involves precise understanding of their temporal re-lationship with the host sediment (Tuttle, 2001; Tuttle et al.,2002; Tuttle and Hartleb, 2012; Bastin et al., 2015). For ex-ample, the age estimate of a buried sand blow is often based ondating the overlying and underlying sediment. A tightly con-strained age of the sand blow reduces the uncertainty of the ageestimate. In contrast, the age estimate of a sand dike is oftenbased on the maximum constraining date of the sedimentcrosscut by the dike. As a consequence, age estimates of sanddikes generally have larger uncertainties than those for sandblows. For the purpose of time assessment, blisters need tobe treated with care. In this study, blisters are found in severalplaces with thick, clay-rich topsoil or in soil with a high rootdensity, where it is difficult for the sand to extrude to the sur-face. As observed for the blisters that formed during the 2010–2011 Canterbury earthquakes, associated sand dikes do notalways extend to the ground surface. This is an important ob-servation for paleoliquefaction studies. In cases like this, thesediments above the blister would not provide a minimum age.The age of the sand dike is younger than the soil in which it isembedded. That is, blisters should be treated as dikes or sillswhen assessing their timing unless the dike extended to theground surface and vented onto the surface as a sand blow.Typical characteristics of paleoblisters (and sills) will be thatthey split a layer apart (usually a paleosol in the case of blis-ters), and thus sediments above and below are either the sameor have a natural vertical continuity (e.g., a buried soil A hori-zon over a soil B horizon may be split by a blister or sill). Thethick dikes and sills associated with the blister present flowstructures similar to dikes (e.g., thin fine-grained borders, flow
laminations subparallel to the walls) but will not have low-angle or cross-lamination structures that are typical of sandblows. If no erosion occurs before the blister is buried, themound formed by the blister may be recognizable as a convex-ity in the buried geomorphic surface.
Also in terms of analyzing the number of paleoseismicevents found in MAR 3 trench, our observations suggest that,once the 2010–2011 liquefaction dikes are weathered, theywill appear visually similar to the currently weathered paleo-liquefaction dikes. Degrees of weathering are used to differ-entiate dike generations in the central United States (Tuttle andHartleb, 2012). To constrain uncertainties associated with dif-ferent degrees of weathering, it is important to identify cross-cutting relationships so as to distinguish different generationsof dikes. However, it is important to note that, during the Can-terbury earthquakes, many dikes intruded along pre-existingdikes (both pre-2010 dikes and also those formed in the earlyparts of the Canterbury sequence), and thus paleoseismic re-sults based only on the dike presence could significantly un-derestimate the number of liquefaction events (Quigley et al.,2013; Bastin et al., 2015; and this study).
Insights into the Size of Paleoliquefaction Features. Wecompared the size of the sand blows, blisters, and dikes stud-ied in the trenches with other sites in Christchurch and withinternational examples.Ⓔ Figure S15 andⒺ Table S11 showthat sand-blow sizes range from 10 to 40 cm height and from>2 to 4 mwidth, and dikewidths range from 1 to 3 cm for bothour study sites. Sand-blow heights are likely to represent multi-ple layers resulting from the three to four events that causedliquefaction at our study sites. Although we have not been ableto quantify the sizes for each of the events at our studied sites,photographic evidence after the June 2011 event shows that thewidth of sand blows formed during the September earthquake(PGA7:5 � 0:38g) may represent the largest widths measuredhere, and that the June 2011 (PGA7:5 � 0:04g) sand blows areabout one-third to one-half of that width (e.g., Fig. 4b).
In eastern Christchurch, dikes that formed during strongshaking (PGA > 0:4g) in the 22 February 2011 Christchurchearthquake ranged up to 25 cm wide, both at sites underlain byhighly susceptible sediments and at sites that suffered severelateral spreading. Maximum sand-blow heights (thickness) lo-cally exceeded 30 cm in eastern Christchurch (Quigley et al.,2013). Sand-blow thicknesses and dike widths do not easilycorrelate because other factors such as liquefaction suscep-tibility of sediments, depth of the water table, material proper-ties, and the proximity of free faces that affect lateral spreadingare also important. Paleoliquefaction features identified byBastin et al. (2015) in eastern Christchurch and those recordedin this study have similar dimensions to modern liquefactionfeatures, suggesting that susceptibility of the sediment has notchanged substantially through time. Some dikes are widerwhen they are close to a free face, such as the edge of a riverchannel; for example, in Avonside (eastern Christchurch), wherelateral spreading was widespread, dikes decreased in widthaway from the Avon River (Bastin et al., 2015).
Liquefaction Features by Canterbury Earthquake Sequence and Assessment of Paleoliquefaction Features 17
BSSA Early Edition

Sand blows that formed during the 1988 Mw 5.9 Sague-nay, Quebec, earthquake are of a similar size to the ones de-scribed for the 2010–2011 Canterbury events (Tuttle et al.,1990, 1992). The Saguenay sand blows generally ranged from7.5 to 22 cm thick, 30 to 500 cmwide, and 30 to 1000 cm long,with associated feeder dikes ranging from 1 to 30 cm wide. Atthe liquefaction site closest to the Saguenay epicenter, the sandblow was 10 cm thick, 1000 cm wide, and 1500 cm long, inassociation with two sand dikes 2 and 50 cm wide. Sand dikesin the Charlevoix seismic zone, southeastern Canada, rangedfrom 0.5 to 15 cmwide (Tuttle and Atkinson, 2010). In contrast,sand blows in the New Madrid seismic zone, United States, arecommonly 1–2 m thick, tens of meters wide, tens to hundredsof meters long, and associated with sand dikes tens to hundredscm wide (Tuttle et al., 2006; Tuttle and Hartleb, 2012).
The difference in size and area of occurrence betweenthe 2010 and 2011 liquefaction features in the Christchurcharea and the New Madrid seismic zone is likely related to(1) the liquefaction susceptibility of the sediments; (2) thecharacteristics of the geomorphic elements (such as the sizeof the braided stream and meandering stream belts of the tworiver systems) and local topography; and (3) the characteristicsof ground shaking (PGA7:5, frequency content and shaking du-ration). In general, sediment is moderately dense and liquefiablein the New Madrid region (Saucier, 1994; Obermeier, 1996),whereas sediment is loose and highly liquefiable in the Christ-church region (Elder et al., 1991). The 1811–1812 NewMadridsequence included three mainshocks of Mw 6.8–8.0 and oneaftershock of Mw 6.3–7.2 that induced liquefaction (Tuttleand Hartleb, 2012), whereas the Canterbury earthquake se-quence included one earthquake of Mw 7.1 and at least seven(possibly up to 11) earthquakes of Mw 5.2–6.2 that inducedliquefaction (Quigley et al., 2013; Geotechnical ExtremeEvents Reconnaissance [GEER], 2010). Also, the geomorphicelements in the Mississippi alluvial system are larger thanthose of the Waimakariri–Halswell alluvial system. For exam-ple, some point bars in the Mississippi River are several kilo-meters long and hundreds of meters wide, whereas the scrollbars in the Waimakariri system area are less than 1 km longand only a few tens of meters wide.
We have not analyzed sand blows and dike sizes fromthe 2010–2011 earthquake sequence to the extent where ro-bust comparisons between the morphology of liquefactionfeatures can be compared with earthquake shaking intensity,epicentral distance, and/or sediment type. However, fromour preliminary observations, it seems that the liquefactionfeatures in similar alluvial sedimentary environments close tothe epicenters are of a similar size, or slightly larger than(Quigley et al., 2013; Bastin et al., 2015), those found at dis-tant areas (i.e., our study area, 17 km away from the 2011 Feb-ruary epicenter). This suggests that, in addition to earthquakeshaking intensity and epicentral distance, the morphology ofthe liquefaction features is influenced by geologic, hydrologic,and geomorphic site characteristics.
Quigley et al. (2013) showed power-law empirical rela-tionships between relative PGA7:5 and relative sand-blow
thicknesses and areal extents, indicating that surface lique-faction volumes (but not feeder-dike widths) correspondedto shaking intensity at a given site. This implied that preced-ing liquefaction and related effects (e.g., soil densification)did not significantly reduce the susceptibility of sediments tofuture liquefaction at the studied site. Furthermore, only twogenerations of liquefaction feeder dikes were recognized atthe site despite 10 or more observed liquefaction events, im-plying the number of distinguishable feeder-dike generationsmay significantly underrepresent the number of actual lique-faction episodes.
Paleoliquefaction
Age of Paleoliquefaction Features. At the Hardwick site,paleoliquefaction features formed between A.D. 908 andA.D. 1336, based on OxCal analysis of the age of sediments(older than layer 6bA, paleosol, and younger than the base oflayer 5Cg) and a piece of wood foundwithin the paleosand blow(maximum age; radiocarbon sample HWK T6-C6; Fig. 7b andⒺ Fig. S22). The paleoliquefaction event occurred after the for-mation of the soil in the top of macrounit 2 (unit 6bA, radio-carbon sample HWK T6-C5) and before deposition of thecrevasse splay deposits of macrounit 1 (unit 5Cg; e.g., HWK 6trench; Fig. 6b, Ⓔ Figs. S9 and S10; radiocarbon samplesHWK T6-C7, HWK T6-C10, and HWK T6-C14). The paleo-sand blow formed when unit 6bA (HWK 6 trench) was at theground surface. The upper portion of the sand blow was sub-sequently eroded. The trees rooted in the paleosol (radiocarbonsample HWK T6-C12) died when younger fluvial sands (cre-vasse splay sediments) were deposited over the erosional surface
At the Marchand site, paleoliquefaction features formedbetween A.D. 1017 and A.D. 1840. This date is based on theage of sediments and OxCal analysis (Fig. 10a and ⒺFig. S13; OxCal analysis in Ⓔ Fig. S23). The mottled andweathered sand dikes crosscut sediment deposited after A.D.995–1141 (calibrated age for sample MAR T3-C1; Fig. 10).The paleodikes extend to the base of the topsoil, but there isno related sand blow to indicate ground-surface exposure atthe time of the event. Therefore, we are unable to constrainthe minimum age of this event. No historical earthquake isknown to have induced liquefaction in this area; therefore,we assume the weathered liquefaction features probablyformed before European settlement (∼1840). However, it ispossible that sparse population hindered reporting of lique-faction associated with the 1870 Lake Ellesmere earthquake(see more discussion in the Correlation of PaleoliquefactionFeatures with Historic and Prehistoric Earthquakes section).
Number of Paleoseismic Events. The poorly constrainedage estimated for the Marchand paleoliquefaction featuresoverlap the age of the Hardwick features. Given the proxim-ity of the two sites, the simplest interpretation is that theyformed during the same event, but it is possible they formedin different events. It is also possible that the paleoliquefac-tion features found at the Marchand site were formed by two
18 P. Villamor, et al.
BSSA Early Edition

or more events, one of them being the same as that recordedat the Hardwick site. Although we do not observe any cross-cutting relationships among the paleodikes mapped in theMAR 3 trench (Fig. 10a) that could be indicative of morethan one event, it is still possible that several intrusions oc-curred along the same dike paths and removed evidence ofpreceding events. It is also possible that mottling hinders dis-crimination between events (Quigley et al., 2013, reportedseveral surface liquefaction extrusions associated with theCanterbury sequence with feeder dikes that contained evi-dence for only one intrusion event).
We do not have a clear stratigraphic link to confirm that thepaleoliquefaction at the Hardwick and Marchand sites repre-sents the same shaking event. Nor do we have any evidenceto support more than one paleoliquefaction event. If we assumethat the paleoliquefaction recorded at the two sites is from thesame event, which is plausible given the close proximity (2 km)and the similar responses during the 2010–2011 liquefactionevents, then the timing of the paleoevent would be the intersec-tion of the age estimates of paleoliquefaction features at eachsite (or A.D. 1019–1337; OxCal analysis in Ⓔ Fig. S24). Insummary, and with the data available, we conclude that at leastone liquefaction event occurred in the Lincoln area betweenA.D. 908 and A.D. 1336 (from Hardwick data) or A.D. 1019–1337 (assuming the Hardwick and Marchand events are thesame), although we cannot rule out the occurrence of anotherevent in the period A.D. 1017–1840 or even younger (i.e., the1870 Lake Ellesmere event, see discussion in the next section).
Correlation of Paleoliquefaction Features with Historic andPrehistoric Earthquakes. In Figure 13, we plot the timingof paleoliquefaction at our sites, along with the timing ofknown historic and prehistoric earthquakes in the wider re-gion, in relation to their epicentral distance to our sites. Wealso identify other active faults that are close to the site butfor which we do not have a seismic record (Forsyth et al.,2008; Stirling et al., 2012; see also Fig. 1 for fault locations).
As a first approximation to excluding some of theseseismic-source candidates, we used a PGA7:5 threshold ap-proach (e.g., Quigley et al., 2013; Santucci de Magistris et al.,2013) and the new magnitude-bound relations developed fromhistoric New Zealand liquefaction data (Maurer et al., 2015).For the PGA7:5 threshold approach, we used two differentground-motion prediction equations (GMPEs, McVerry et al.,2006; Bradley, 2013) to calculate the PGA7:5 (magnitudeweighted; Youd et al., 2001) at our site frommodeled rupturesof each fault (Table 1). Thresholds for inducing liquefactionhave been suggested from PGA7:5 � 0:09g from an interna-tional database (Santucci de Magistris et al., 2013) or aslow as PGA7:5 � 0:06g for a highly susceptible area of Christ-church (Quigley et al., 2013).
We note that using the PGA7:5 threshold concept does notinclude important information on the mechanics of liquefiablesoils. For example, we are not accounting for frequency effectsof the motions and changes in shear strength of the soil col-umn (e.g., Seed and Idriss, 1971; Idriss and Boulanger, 2008).
Therefore, results based on this approach are only preliminary.However, given that there is a rich set of recorded PGA dataclose to our site, we consider that using this approach in con-junction with Maurer et al. (2015) may bring some more in-sights into what earthquake sources could have producedpaleoliquefaction at Lincoln. To assess the threshold PGA7:5
at which liquefaction may occur at our study site, we usedthe Canterbury records at the nearby LINC seismic station(∼3 km away from the site), which is located on similar soil(type D soil of the New Zealand Standard NZS1170, 2004),and information on historic earthquakes. For these historicearthquakes, we either know or can calculate the PGA7:5 andhave records to determine whether they historically causedliquefaction or not. During the Canterbury earthquake sequence,the 4 September 2010 (Mw 7.1), the 22 February 2011(Mw 6.2), and the 13 June 2011 (Mw 6.0) liquefaction occurredat the two sites. Landowners of both properties reported a muchlarger degree of liquefaction during the September 2010 eventthan the June 2011 event. When asked to rate the proportions ofliquefaction for different events, the landowners rated them inthe following way: if September 2010 is considered 100%, Feb-ruary would be 80% and 60%, and June would be 15% and<1% for the Hardwick and Marchand sites, respectively. Thereare no historical reports of liquefaction in Lincoln during the1869 Christchurch earthquake (Mw 4.7–4.8), the 1870 LakeEllesmere earthquake (Mw 5.6–5.8) (Downes and Yetton,2012), or the 1888 Amuri earthquake (Hutton, 1888).
The magnitude-weighted PGAs recorded at LINC stationduring the Canterbury earthquake sequence are plotted againstMw in Figure 14 and events that produced liquefaction arehighlighted.We also highlighted one aftershock of 4 September2010 event, 20 min after the main event, that could have causedliquefaction (identified as “possible liquefaction” in Fig. 14),but this would not have been distinguishable from the main-shock because both events occurred during the night. The plotshows that the liquefaction triggering threshold for widespreadliquefaction is at least as low as PGA7:5 � 0:07g at this sitefrom the occurrence of liquefaction associated with the 22 Feb-ruary 2011 event. It is also possible that smaller events, suchas on 13 June 2011 (PGA7:5 � 0:04g), can also cause minorliquefaction, but there were several events with similarly lowPGA7:5 that did not produce liquefaction.
Comparisons of the threshold suggested here for trigger-ing widespread liquefaction (PGA7:5 � 0:07g) with the PGA7:5
calculated at the site from rupture of regional faults can be usedas a preliminary approach to help assess which faults couldproduce substantial liquefaction at Lincoln. Table 1 shows thatregional faults that are more than 100 km away from Lincolncould cause only minor liquefaction there (except for theAlpine fault). However, all regional faults within <60 km(Table 1) could cause widespread liquefaction.
The probabilities of liquefaction at Lincoln for variousseismic sources based on the magnitude-bound relationsdeveloped by Maurer et al. (2015) are shown in Table 1.These results suggest high probabilities (16%–93% and31%, respectively) that sources within a 60 km radius of
Liquefaction Features by Canterbury Earthquake Sequence and Assessment of Paleoliquefaction Features 19
BSSA Early Edition

Lincoln as well as the much more distant (135 km) Alpinefault can produce extensive liquefaction. Maurer et al.(2015) show similar results for a site in eastern Christchurch.
Although there is no historic record of liquefaction dur-ing the 1869 Christchurch and the 1870 Lake Ellesmereearthquakes at Lincoln, we interpret this as “absence of evi-dence” rather than “evidence of absence”: the sparse popu-lation and the likelihood of incomplete reporting dictate aconservative approach.
Figure 14 and Table 1 can also help to assess this ques-tion. We calculated the possible PGA7:5 and the probabilitiesof liquefaction (from Maurer et al., 2015) for these twoevents using the mean distance andMw values (there is greatuncertainty in these two parameters). Our calculations sug-
gest that it is highly likely that the 1870 Lake Ellesmereevent produced liquefaction at Lincoln. However, PGA7:5
values for the 1869 Christchurch earthquake suggest thatit could have triggered only minor liquefaction, if any.
Fault Sources Associated with Paleoliquefaction Features. Thesimplest interpretation of the paleoliquefaction features at theHardwick and Marchand sites is that they formed as the re-sult of the same event (A.D. 1019–1337). It is known fromother paleoseismic studies that several faults ruptured duringthe same period as the paleoliquefaction event. These faultsinclude the subduction zone (southern segment), the Alpinefault, the Hope fault (Conway, Hope River, and Hurunui seg-ments), and the Porters Pass fault (see the Fig. 13 caption for
Figure 13. Timing of major historic earthquakes, prehistoric fault ruptures, and large landslides in the wider region. Timing informationfrom subduction zone, Clark et al. (2015); Alpine fault, Berryman et al. (1992), Berryman, Cochran, et al. (2012), Berryman, Cooper, et al.(2012), and Howarth et al. (2012, 2014); Hope fault, Conway segment, Langridge et al. (2003); Hope fault, Hope River segment, Cowan andMcGlone (1991); Hope fault, Hurunui segment, Langridge et al. (2013) and Khajavi et al. (see Data and Resources); Poulter fault, Berrymanand Villamor (2004); Acheron rock avalanche, Smith et al. (2006); Porters Pass fault, Howard et al. (2005); Ashley fault, Sisson et al. (2001);Moncks Cave, Jacomb (2008, 2009). Location information for all faults from Litchfield et al. (2014) and references therein. Vertical blackdotted lines associated with individual faults indicate that there are no paleoearthquake data. Vertical gray dotted lines indicate that pale-oearthquake studies suggest that no ruptures occurred for that fault during that period.
20 P. Villamor, et al.
BSSA Early Edition

references). Using PGA7:5 ≥ 0:07g as a possible liquefactionthreshold and the magnitude-bound relations for paleolique-faction analysis from Maurer et al. (2015), we further limitthese sources to the Porters Pass fault about 70 km distance(penultimate event; 50% probability) and the Alpine fault at135 km distance (penultimate event; 35% probability). Rup-ture of the Porters Pass fault is known to have caused a largerock avalanche in the southern Alps (Smith et al., 2006). Otherfaults close to Lincoln (Hororata, Springbank, and Rakaia), forwhich there are no paleoearthquake data, also could have pro-duced liquefaction at our site (PGA7:5 at Lincoln >0:09g; and50%–84% probability based on Maurer et al., 2015).
Although the Hope fault produced paleoearthquakes dur-ing this time period, these have not been considered, becausethe potential median PGA7:5 at Lincoln from this fault is belowthe threshold and Maurer et al. (2015) suggest a <7% prob-ability. However, better constraints on shaking thresholds forthe area or a more in-depth analysis of the soil properties atLincoln and other sites could increase our confidence in thisinitial finding. The Greendale fault has also been excluded, be-cause its penultimate event is likely to have occurred >20;000years ago (Villamor et al., 2012; Hornblow et al., 2014). Inaddition, the Ashley fault has not ruptured in the last 1300years and has similarly been discounted (Sisson et al., 2001).
If the paleoliquefaction at the Marchand site occurredafter that at the Hardwick site, several fault sources that rup-tured during the period A.D. 1340–1840 could have beenresponsible (Table 1 and Fig. 13). The Porters Pass fault (mostrecent event), the Alpine fault (either of the last two events),the subduction zone (earthquake 1 of Clark et al., 2015, whichcould be a multiple segment rupture), or any of the faults withno earthquake record (Hororata, Springbank, Ashley, and
Rakaia) are potential candidates. The Porters Pass fault is astrong candidate because the timing of its most recent eventmay coincide with dates for the sealing of Moncks Cave inSumner, Christchurch, by a rock avalanche (Jacomb, 2008;2009). Although it is possible that this failure was not seismi-cally triggered, the location of the avalanche is only 22 kmaway from the Marchand site (and at a similar distance fromthe fault source as the Marchand site), which could indicatethat both sites experienced strong shaking simultaneously.
The age estimate of a major paleoearthquake(s) presentedhere is only preliminary. Dating of more paleoliquefaction fea-tures at additional sites across the Canterbury area wouldgreatly improve our determination of the timing and the likelyseismic source. Furthermore, several active faults, closer to thesite than those discussed above and for which there currentlyare no paleoearthquake data, could have been responsible forthe paleoliquefaction described herein. In addition, given that10 of the 11 liquefaction-inducing earthquakes in the Christ-church area during the 2010–2011 sequencewere produced byblind faults, there is a strong possibility that the paleoliquefac-tion events presented were also triggered by proximal blind-fault earthquakes. For example, Bastin et al. (2015) tentativelyattributed some of the pre-2010 liquefaction features in easternChristchurch to the 1869 Mw 4.9 Christchurch earthquake.Recently, identified offshore active faults (Barnes et al., 2011)provide additional seismic sources to consider. If paleolique-faction on the southeastern Canterbury Plains is related to lo-cal earthquakes, the timing of paleoliquefaction events can fillan important gap in the paleoearthquake record for the Christ-church region. It is also important to note that the lack of pa-leoliquefaction features in a particular trench does not indicatethat certain faults did not cause liquefaction in our study area;it may indicate that we have not exposed it in our trenches.However, the predilection for liquefaction sites to reliquefyduring subsequent events and for injections to reuse pre-existing dikes gives us more confidence that our record isnot strongly biased by lack of discovery. Importantly, iden-tification and dating of paleoliquefaction features in thewider area that can be influenced by shaking caused by rup-ture of the subduction zone could contribute to understand-ing the impacts and timing of this type of rupture.
Paleoliquefaction studies, along with analysis of PGAs re-corded during the Canterbury earthquake sequence (or anyother recent earthquakes that may or may not have caused lique-faction at a study site), can better constrain potential PGA7:5
thresholds and can be combined with additional fault paleoseis-mic studies (e.g., Hornblow et al., 2014) and other geologicindicators of strong shaking (e.g., Mackey and Quigley, 2014)to inform the paleoearthquake history for the region.
Conclusions
We documented liquefaction features at two sites(Hardwick and Marchand sites) in Lincoln (southwest ofChristchurch) that formed during the 2010–2011 Canterburyearthquake sequence. Paleoliquefaction features were also
Figure 14. Peak ground acceleration (PGA) normalized toMw 7.5 (PGA7:5) versusMw and approximate liquefaction-triggeringthreshold forMw ≥4:5 for widespread liquefaction (PGA7:5 ≥ 0:07g;dashed line). Minor liquefaction occurred during the 13 June 2011event with PGA7:5 ∼ 0:04g.
Liquefaction Features by Canterbury Earthquake Sequence and Assessment of Paleoliquefaction Features 21
BSSA Early Edition

identified at both sites. Comparison of detailed geomorphicmapping (assisted by high-resolution DEMs) with the spatialdistribution of liquefaction features, and with information onthe potential sand source for the liquefied sand from trenchesand cores, suggests a strong correlation between liquefactionand alluvial channel and point-bar deposits. This is clearlydisplayed at the Marchand site, located at the inner meanderbend of the Halswell River, and at other similar sites alongthis river course. At the Hardwick site, located at an abandonedmeander channel close to the Halswell River, this association isto some extent obscured by the burial of the meander channeland its scroll bar complex by a crevasse splay. Nevertheless,preliminary analysis of trenched sediments and surface lique-faction patterns suggests an association between surface ex-pression of liquefaction and the margins and the inner part ofthe meander bend of the abandoned channel and with its as-sociated scroll bar complex. In addition, this study shows howdetailed geomorphic studies can be used to identify areas ofpotential paleoliquefaction for further investigation.
Documentation of the type and size of the 2010–2011liquefaction features and their relationship with the hostingsediment provides insights into analysis of paleoliquefactionfeatures in areas with sedimentary environments similar to theCanterbury Plains. The modern features include single andmultiple coalescing sand blows along linear fissures; blisters,which are mounded soils above injections of sills, and shal-lowly dipping dikes into the topsoil; dikes, some of which arerelated to the blows and blisters; and collapse structures relatedto ground failure. The sizes of the preserved features (e.g.,dikes tend to be around 2–5 cm thick) may not only be asso-ciated with the specific strong-ground-shaking level at the site,but can also be limited by the size of the features with the sedi-mentary environment (e.g., size of a scroll bar). Because smallsand blows may not persist for long at the ground surface, it iscritical to site paleoseismic trenches in settings of sediment ac-cumulation where sand blows may be buried and preserved bysubsequent deposits (e.g., crevasse splay covering the aban-doned meander deposit). Our results also show that, when an-alyzing paleoliquefaction features, it is important to recognizethe thick sills and dikes below blisters as intrusions (in contrastto sand blows or extrusions) so that interpretation of the age ofthe intrusions is accurate (i.e., the age of the layer above a silldoes not constrain the youngest age of the sill).
Finally, we estimated the age of the paleoliquefaction fea-tures at both sites and compared them with the ages of docu-mented paleoearthquakes from known fault sources. We alsoanalyzed the potential of other sources (with no paleoseismicdata) to induce liquefaction at our sites using the New ZealandGMPEs and assessed a preliminary liquefaction-triggeringPGA7:5 at our sites using the seismic records of the Canterburyearthquake sequence. We obtain a threshold PGA7:5 of ∼0:07g,similar to other sites in Christchurch. We used that thresholdand existing magnitude-bound relations to identify potentialfault sources for the paleoliquefaction features found at Lin-coln. Although this preliminary study has not provided suffi-cient data to confirm the earthquake source, a number of po-
tential candidates have been proposed that could form the basisof further investigation. One interpretation is that paleoliquefac-tion at both sites resulted from the same strong-ground-shakingevent with an age of A.D. 1019–1337, based on dating of hostsediments. It seems that most of the known regional sourceswithin a radius of 100 km, and perhaps marginally distant largefaults such as the Alpine fault and the subduction zone, couldproduce liquefaction in Lincoln, based on PGA7:5 estimates andmagnitude-bound relations. Known paleoearthquakes that couldbe responsible for the strong ground shaking at the time of thepaleoliquefaction event in Lincoln include the penultimate eventon the Porter Pass fault or the Alpine fault. The Greendale andAshley faults were unlikely sources because they did not ruptureat that time. A second interpretation is that there is an additional,more recent, paleoliquefaction event at A.D. 1340–1840(or −1870) that is represented at the Marchand site. Such anevent could have been caused by ruptures of the Porters Passfault, Alpine fault, and subduction zone (large rupture).
The Canterbury earthquake sequence has providedinvaluable information to gain further insights into the lique-faction process and seismic hazard in regions of low-to-moderate seismicity. Results from two sites, such as thisstudy, are preliminary in terms of estimating the timing andidentifying sources of prehistoric earthquakes. However, wepresented a powerful approach that will provide conclusiveresults with the study of additional sites across the region,through the combined analysis of recorded PGAs; magnitude-bound relations for paleoliquefaction analysis; presence orabsence of liquefaction for different PGA thresholds; andthe identification and dating of paleoliquefaction events atthe same site. Moreover, understanding local liquefaction-triggering thresholds over a wider area will greatly improveknowledge of the impacts of earthquakes produced by largeinterplate faults (e.g., Alpine fault and the subduction zone inNew Zealand) and could greatly improve the understandingof the potential magnitudes of these events.
Data and Resources
The peak ground acceleration records used in this studyare from Geonet, New Zealand (info.geonet.org.nz/display/appdata/Strong‑Motion+Data, last accessed January 2015).Active fault data are from the GNS Science Active Fault da-tabase (http://data.gns.cri.nz/af/, last accessed August 2014).Pre-2010 aerial photos stereo pairs with a 1:16,000 scale andwere taken in the 1940s and 1960s; GNS collection, alsoaccessible at http://photosales.opus.co.nz/about/history.htm(last accessed February 2015). Modern orthophotos are fromLand Information New Zealand (LINZ) (http://www.linz.govt.nz/land/maps/aerial-imagery-and-orthography, last ac-cessed January 2014). Google Earth Maps are online athttps://www.google.com/earth (last accessed January 2014).The digital elevation model from light detection and ranging(lidar) survey fromCanterbury Geotechnical Database, suppliedby Canterbury Regional Council (https://www.nzgd.org.nz/,last accessed January 2013). N. Khajavi, R. M. Langridge,
22 P. Villamor, et al.
BSSA Early Edition

M. C. Quigley, C. Smart, A. Rezanejad, and F. Martin-Gon-zalez, Late Holocene rupture overlap and earthquake clusteringon the Hope fault, New Zealand, is under review with theGeo-logical Society of America Bulletin. All other data used in thisarticle came from the published sources listed in the references.
Acknowledgments
We thank the Hardwick and Marchand families for land access. Car-oline Hardwick provided invaluable information, including an extensivephotographic record of the liquefaction events. Canterbury Regional Council(ECAN) acquired light detection and ranging (lidar) and aerial photographyand made it available for research purposes. Numerous colleagues from theUniversity of Canterbury, Lincoln University, and University of Madridassisted with fieldwork and discussions. Bella Ansell and Kathleen Turnerassisted with GIS work. Mark Stirling, Graeme McVerry, and Chris VanHoutte helped with peak ground acceleration calculations. Radiocarbon ageswere provided by Rafter Radiocarbon Laboratory, GNS Science. DougalTownsend and Jon Carey provided GNS Science internal reviews. Twoanonymous reviewers and Associate Editor Yann Klinger provided construc-tive reviews that greatly improved this article. This study is funded by theNew Zealand Earthquake Commission, the New Zealand National HazardsPlatform, and GNS Development and Core funds.
References
Almond, P., P. Villamor, M. Tuttle, R. Langridge, K. Clark, A. Eger, S.Bastin, M. Quigley, P. Barker, and M. Vandergoes (2012). Liquefac-tion induced by the 2010–2011 Canterbury earthquake sequence andimplications of recently discovered paleoliquefaction features, Geol.Soc. Am. Abstr. Progr. 44, no. 7, 414.
Bannister, S., and K. Gledhill (2012). Evolution of the 2010–2012 Canterburyearthquake sequence, New Zeal. J. Geol. Geophys. 55, no. 3, 295–304.
Barnes, P. M., C. Castellazzi, A. Gorman, and S. Wilcox (2011). Submarinefaulting beneath Pegasus Bay, offshore Christchurch. Short-term Canter-bury Earthquake Recovery Project 2: Offshore faults, National Instituteof Water & Atmosphere (NIWA) Client Report WLG2011–28, 46 pp.
Bastin, S., M. Quigley, K. Bassett, and R. A. Green (2013). Modern andpaleo-liquefaction features in eastern Christchurch and strategies forlocating pre-historic liquefaction, C. Y. Chin (Editor), Proc. 19thNZGS Geotechnical Symposium, Queenstown, New Zealand, 9–12November 2013, 8 pp.
Bastin, S. H., K. Bassett, M. Quigley, B. Maurer, R. A. Green, B. Bradley, andD. Jacobson (2016). Late Holocene liquefaction at sites of contemporaryliquefaction during the 2010–2011 Canterbury earthquake sequence, NewZealand, Bull. Seismol. Soc. Am. 106, no. 3, doi: 10.1785/0120150166.
Bastin, S. H., M. Quigley, and K. Bassett (2015). Paleoliquefaction in Christ-church, New Zealand,Geol. Soc. Am. Bull. 127, nos. 9/10, 1348–1365,doi: 10.1130/B31174.1.
Beavan, J., S. Ellis, L. Wallace, and P. Denys (2007). Kinematic constraintsfrom GPS on oblique convergence of the Pacific and Australian plates,central South Island, New Zealand, in A Continental Plate Boundary:Tectonics at South Island, New Zealand, D. Okaya, T. Stern, and F.Davey (Editors), American Geophysical Union, Washington, D. C.,75–94, doi: 10.1029/175GM05.
Beavan, J., M. Motagh, E. J. Fielding, N. Donnelly, and D. Collett (2012).Fault slip models of the 2010–2011 Canterbury, New Zealand, earth-quakes from geodetic data and observations of postseismic grounddeformation, New Zeal. J. Geol. Geophys. 55, no. 3, 207–221.
Berrill, J. B., P. C. Mulqueen, and E. T. C. Ooi (1994). Liquefaction atKaiapoi in the 1901 Cheviot, New Zealand, earthquake, Bull. New Zeal.Natl. Soc. Earthq. Eng. 27, no. 3, 178–190.
Berryman, K. (2012). Geoscience as a component of response and recoveryfrom the Canterbury earthquake sequence of 2010–2011, New Zeal. J.Geol. Geophys. 55, no. 3, 313–319.
Berryman, K., and P. Villamor (2004). Surface rupture of the Poulter fault in the1929 March 9 Arthur’s Pass earthquake, and redefinition of the Kakapofault, New Zealand, New Zeal. J. Geol. Geophys. 47, no. 2, 341–351.
Berryman, K., U. Cochran, K. Clark, G. Biasi, R. Langridge, and P. Villamor(2012). Major earthquakes occur regularly on an isolated plate boun-dary fault, Science 336, 1690–1693, doi: 10.1126/science.1218959.
Berryman, K., A. Cooper, R. Norris, P. Villamor, R. Sutherland, T. Wright,E. Schermer, R. Langridge, and G. Biasi (2012). Late Holocene rup-ture history of the Alpine fault in south Westland, New Zealand, Bull.Seismol. Soc. Am. 102, no. 2, 620–638.
Berryman, K. R., S. Beanland, A. F. Cooper, H. N. Cutten, R. J. Norris, and P.R.Wood (1992). The Alpine fault, New Zealand: Variation in Quaternarystructural style and geomorphic expression, Ann. Tecton. 6, 126–163.
Brackley, H. (compiler) (2012). Review of liquefaction hazard information ineastern Canterbury, including Christchurch City and parts of Selwyn,Waimakariri and Hurunui Districts, 2012 ECA Report, R12/83, 99 pp.
Bradley, B. A. (2013). A New Zealand-specific pseudo-spectral accelerationground-motion prediction equation for active shallow crustal earthquakesbased on foreign models, Bull. Seismol. Soc. Am. 103, no. 3, 1801–1822.
Bronk Ramsey, C. (2009). Bayesian analysis of radiocarbon dates,Radiocarbon 51, no. 1, 337–360.
Brown, L. J., and J. H. Weeber (1992). Geology of the Christchurch urbanarea: Institute of Geological and Nuclear Sciences Geological Map 1,Institute of Geological and Nuclear Sciences Limited, Lower Hutt,New Zealand, scale 1:25,000.
Brown, L. J., D. D. Wilson, N. T. Moar, and D. C. Mildenhall (1988). Stra-tigraphy of late Quaternary deposits of the northern Canterbury Plains,New Zealand, New Zeal. J. Geol. Geophys. 31, no. 3, 305–335.
Browne, G. H., and T. R. Naish (2003). Facies development and sequencearchitecture of a late Quaternary fluvial-marine transition, CanterburyPlains and shelf, New Zealand: Implications for forced regressivedeposits, Sediment. Geol. no. 158, 57–86.
Campbell, J. K., J. R. Pettinga, and R. Jongnes (2012). The tectonic andstructural setting of the 4 September 2010 Darfield (Canterbury)earthquake sequence, New Zealand, New Zeal. J. Geol. Geophys.55, no. 3, 155–168.
Civico, R., C. A. Brunori, P. M. De Martini, S. Pucci, F. R. Cinti, and D.Pantosti (2015). Liquefaction susceptibility assessment in fluvialplains using airborne lidar: The case of the 2012 Emilia earthquakesequence area (Italy), Nat. Haz. Earth Syst. Sci. no. 15, 2473–2483,doi: 10.5194/nhess-15-2473-2015.
Clark, K. J., B. W. Hayward, U. A. Cochran, L. M. Wallace, W. L. Power,and A. T. Sabaa (2015). Evidence for past subduction earthquakes at aplate boundary with widespread upper plate faulting: Southern Hikur-angi margin, New Zealand, Bull. Seismol. Soc. Am. 105, no. 3, doi:10.1785/0120140291.
Cowan, H. A., andM. S. McGlone (1991). Late Holocene displacements andcharacteristic earthquakes on the Hope River segment of the Hopefault, New Zealand, J. Roy. Soc. New Zeal. 21, no. 4, 373–384.
Cox, S. C., H. K. Rutter, A. Sims, M. Manga, J. J. Weir, T. Ezzy, P. A. White,T. W. Horton, and D. Scott (2012). Hydrological effects of theMw 7.1Darfield (Canterbury) earthquake, 4 September 2010, New Zealand,New Zeal. J. Geol. Geophys. 55, no. 3, 231–247.
Cubrinovski, M., and R. A. Green (Editors) (2010). Geotechnical reconnais-sance of the 2010 Darfield (Canterbury) earthquake (contributingauthors: Allen, J., S. Ashford, E. Bowman, B. Bradley, B. Cox, M.Cubrinovski, R. Green, T. Hutchinson, E. Kavazanjian, R. Orense,M. Pender, M. Quigley, and L. Wotherspoon) (Special Issue), Bull.New Zeal. Soc. Earthq. Eng. 43, no. 4, 243–320.
Cubrinovski, M., J. D. Bray, M. Taylor, S. Giorgini, B. Bradley, L. Wother-spoon, and J. Zupan (2011). Soil liquefaction effects in the centralbusiness district during the February 2011 Christchurch Earthquake,Seismol. Res. Lett. 82, no. 6, 893–904.
Downes, G., and M. Yetton (2012). Pre-2010 historical seismicity nearChristchurch, New Zealand: The 1869 Mw 4.7–4.9 Christchurchand 1870Mw 5.6–5.8 Lake Ellesmere earthquakes, New Zeal. J. Geol.Geophys. 55, no. 3, 199–205.
Liquefaction Features by Canterbury Earthquake Sequence and Assessment of Paleoliquefaction Features 23
BSSA Early Edition

Elder, D. M., I. F. McCahon, and M. D. Yetton (1991). The Earthquake Haz-ard in Christchurch: A Detailed Evaluation, Research Report to theEQC, Soils and Foundations Ltd., Christchurch, New Zealand, 80 pp.
Field, B. D., G. H. Brown, B. W. Davy, R. H. Herzer, R. H. Hoskins, J. I.Raine, G. J. Wilson, R. J. Sewell, D. Smale, and W. A. Watters (1989).Cretaceous and Cenozoic sedimentary basins and geological evolutionof the Canterbury region, South Island, New Zealand, New ZealandGeological Survey Basin Studies 2, Department of Scientific and In-dustrial Research, Wellington, New Zealand, 94 pp. + enclosures.
Forsyth, P. J., R. Jongens, and D. J. A. Barrell (2008). Geology of the Christ-church area. GeologicalMap 16,GNS Science, Lower Hutt, New Zealand,scale 1:250,000, 1 sheet + 67 pp.
Geotechnical Extreme Events Reconnaissance (GEER) (2010). Geotechnicalreconnaissance of the 2010 Darfield (New Zealand) Earthquake, version1: November 14, 2010, Report of the National Science Foundation-Spon-sored Geotechnical Extreme Events Reconnaissance (GEER) Team.GEER Association Report No. GEER-024, http://www.geerassociation.org/administrator/components/com_geer_reports/geerfiles/GEER_Darfield_2010_11‑14‑2010.pdf (last accessed August 2015).
Hogg, A. G., Q. Hua, P. G. Blackwell, M. Niu, C. E. Buck, T. P. Guilderson,T. J. Heaton, J. G. Palmer, P. J. Reimer, R. W. Reimer, et al. (2013).SHCal13 southern hemisphere calibration, 0–50, 000 cal yr BP, Radio-carbon 55, no. 4, doi: 10.2458/azu_js_rc.55.16783.
Holden, C. (2011). Kinematic source model of the 22 February 2011Mw 6.2Christchurch earthquake using strong motion data, Seismol. Res. Lett.82, no. 6, 783–788.
Holzer, T. L., T. E. Noce, and M. J. Bennett (2011). Liquefaction probabilitycurves for surficial geologic deposits, Environ. Eng. Geosci. 17, no. 1,1–21.
Hornblow, S., M. Quigley, A. Nicol, R. Van Dissen, and N. Wang (2014)Paleoseismology of the 2010 Mw 7.1 Darfield (Canterbury) earth-quake source, Greendale fault, New Zealand, Tectonophysics 637,178–190.
Howard, M., A. Nicol, J. Campbell, and J. R. Pettinga (2005). Holocenepaleoearthquakes on the strike-slip Porters Pass fault, Canterbury,New Zealand, New Zeal. J. Geol. Geophys. 48, no. 1, 59–74.
Howarth, J. D., S. J. Fitzsimons, R. J. Norris, and G. E. Jacobsen (2012). Lakesediments record cycles of sediment flux driven by large earthquakes onthe Alpine fault, New Zealand, Geology 40, no. 12, 1091–1094.
Howarth, J. D., S. J. Fitzsimons, R. J. Norris, and G. E. Jacobsen (2014).Lake sediments record high intensity shaking that provides insight intothe location and rupture length of large earthquakes on the Alpinefault, New Zealand, Earth Planet. Sci. Lett. 403, 340–351.
Hughes, M., M. Quigley, S. van Ballegooy, B. Deam, B. Bradley, D. Hart, andR. Measures (2015). The sinking city: Earthquakes increase floodhazard in Christchurch, New Zealand, GSA Today 25, no. 3, 4–10.
Hutton, F. W. (1988). The earthquake in the Amuri, Trans. New Zeal. Inst.21, 269–293.
Idriss, I. M., and R. W. Boulanger (2008). Soil liquefaction during earth-quakes, Monograph MNO-12, Earthquake Engineering ResearchInstitute, Oakland, California, 261 pp.
Jacomb, C. (2008). The chronology ofMoncks cave, Canterbury, New Zealand,Records Canterbury Museum 22, 45–56.
Jacomb, C. (2009). Excavations and chronology at the Redcliffs Flat site,Canterbury, New Zealand, Records Canterbury Museum 23, 15–30.
Kaiser, A., J. Beavan, D. Beetham, R. Benites, A. Celentano, D. Collett, J.Cousins, M. Cubrinovski, G. Dellow, P. Denys, et al. (2012). TheMw 6.2 Christchurch earthquake of February 2011: Preliminary report,New Zeal. J. Geol. Geophys. 55, no. 1, 67–90.
Langridge, R., J. Campbell, N. Hill, V. Pere, J. Pope, J. Pettinga, B. Estrada,and K. Berryman (2003). Paleoseismology and slip rate of the Conwaysegment of the Hope fault at Greenburn Stream, South Island, NewZealand, Ann. Geophys. 46, no. 5, 1119–1139.
Langridge, R. M., P. C. Almond, and R. P. Duncan (2013). Timing of lateHolocene paleoearthquakes on the Hurunui segment of the Hope fault:Implications for plate boundary strain release through South Island, NewZealand, Geol. Soc. Am. Bull. 125, 765–775, doi: 10.1130/B30674.1.
Litchfield, N. J., R. J. Van Dissen, R. Sutherland, P. M. Barnes, S. C. Cox, R.Norris, R. J. Beavan, R.M. Langridge, P. Villamor, K. R. Berryman, et al.(2014). A model of active faulting in New Zealand, New Zeal. J. Geol.Geophys. 57, no. 1, 32–56, doi: 10.1080/00288306.2013.854256.
Mackey, B., and M. Quigley (2014). Strong proximal earthquakes revealedby cosmogenic 3He dating of prehistoric rockfalls, Christchurch,New Zealand, Geology 42, doi: 10.1130/G36149.1.
Maurer, B. W., R. A. Green, M. Quigley, and S. Bastin (2015). Development ofmagnitude-bound relations for paleoliquefaction analyses: New Zealandcase study, Eng. Geol. 197, 253–266.
McVerry, G. H., J. X. Zhao, N. A. Abrahamson, and P. G. Somerville (2006).New Zealand acceleration response spectrum attenuation relations forcrustal and subduction zone earthquakes, Bull. New Zeal. Soc. Earthq.Eng. 39, no. 1, 1–58.
NZS 1170.5 (2004). Structural Design Actions Part 5: Earthquake Actions—New Zealand, Standards New Zealand, Wellington, New Zealand, 82 pp.
Obermeier, S. F. (1996). Use of liquefaction-induced features for paleoseismicanalysis: An overview of how seismic liquefaction features can be distin-guished from other features and how their regional distribution and prop-erties of source sediment can be used to infer the location and strength ofHolocene paleo-earthquakes, Eng. Geol. 44, no. 1, 1–76.
Pranter, M. J., A. I. Ellison, R. D. Cole, and P. E. Patterson (2007). Analysisand modeling of intermediate-scale reservoir heterogeneity based on afluvial point-bar outcrop analog, Williams Fork Formation, Piceancebasin, Colorado, AAPG Bull. 91, no. 7, 1025–1051.
Quigley, M. C., S. Bastin, and B. A. Bradley (2013). Recurrent liquefactionin Christchurch, New Zealand, during the Canterbury earthquakesequence, Geology 41, no. 4, 419–422.
Quigley, M. C., R. Van Dissen, N. Litchfield, P. Villamor, B. Duffy, D. Bar-rell, K. Furlong, T. Stahl, E. Bilderback, and D. Noble (2012). Surfacerupture during the 2010 Mw 7.1 Darfield (Canterbury) earthquake:Implications for fault rupture dynamics and seismic-hazard analysis,Geology 40, no. 1, 55–58.
Reid, C. M., N. K. Thompson, J. R. M. Irvine, and T. E. Laird (2012). Sandvolcanoes in the Avon–Heathcote estuary produced by the 2010–2011Christchurch earthquakes: Implications for geological preservation andexpression, New Zeal. J. Geol. Geophys. 55, no. 3, 249–254.
Santucci de Magistris, F., G. Lanzano, G. Forte, and G. Fabbrocino (2013).A database for PGA threshold in liquefaction occurrence, Soil Dynam.Earthq. Eng. 54, 17–19.
Saucier, R. T. (1994). Geomorphology and Quaternary geologic history ofthe lower Mississippi, U.S. Army Corps of Engineers WaterwaysExperiment Station, Vols. I/II, 364 pp. and 28 plates.
Seed, H. B., and I. M. Idriss (1971). Simplified procedure for evaluating soilliquefaction potential, J. GED, ASCE 97, no. 9, 1249–1273.
Sibson, R., F. Ghisetti, and J. Ristau (2011). Stress control of an evolvingstrike-slip fault system during the 2010–2011 Canterbury, New Zealand,earthquake sequence, Seismol. Res. Lett. 82, no. 6, 824–832.
Sisson, R., J. Campbell, J. Pettinga, and D. Miler (2001). Paleoseismicity ofthe Ashley and Loburn faults, North Canterbury, New Zealand, ProjectNumber, 97/237, Natural Hazards Research Centre, 47 pp.
Smith, G. M., T. R. Davies, M. J. McSaveney, and D. H. Bell (2006). TheAcheron rock avalanche, Canterbury, New Zealand: Morphology anddynamics, Landslides 3, no. 1, 62–72.
Stirling, M., G. McVerry, M. Gerstenberger, N. Litchfield, R. Van Dissen, K.R. Berryman, R. M. Langridge, A. Nicol, W. D. Smith, P. Villamor,et al. (2012). National seismic hazard model for New Zealand: 2010update, Bull. Seismol. Soc. Am. 102, no. 4, 1514–1542.
Sutherland, R., D. Eberhart-Phillips, R. A. Harris, T. A. Stern, R. J. Beavan,S. M. Ellis, S. A. Henrys, S. C. Cox, R. J. Norris, K. R. Berryman,et al. (2007). Do great earthquakes occur on the Alpine fault in centralSouth Island, New Zealand? in AContinental Plate Boundary: Tectonicsat South Island, New Zealand, D. A. Okaya, T. A. Stern, and F. J. Davey(Editors), American Geophysical Monograph, Vol. 175, 235–251.
Townsend, D., J. Lee, D. Strong, R. Jongens, Smith-Lyttle, S. Ashraf, B.Rosser, N. Perrin, K. Lyttle, M. Cubrinovski, et al. (2016). Mappingsurface liquefaction caused by the September 2010 and February 2011
24 P. Villamor, et al.
BSSA Early Edition

Canterbury earthquakes: A digital dataset, New Zeal. J. Geol. Geo-phys., doi: 10.1080/00288306.2016.1182929 (in press).
Tsuchida, H. (1970). Prediction and countermeasure against the liquefactionin sand deposits, Abstract of the Seminar in the Port and Harbor, Re-search Institute, Yokohama, Japan, 3-1 p.
Tuttle, M., and N. Barstow (1996). Liquefaction-related ground failure: Acase study in the NewMadrid seismic zone, central United States, Bull.Seismol. Soc. Am. 86, no. 3, 636–645.
Tuttle, M., T. Law, L. Seeber, and K. Jacob (1990). Liquefaction and groundfailure in Ferland, Quebec, triggered by the 1988 Saguenay earth-quake, Can. Geotech. J. 27, 580–589.
Tuttle, M. P. (1999). Late Holocene earthquakes and their implications for earth-quake potential of the New Madrid seismic zone, central United States,Ph.D. Dissertation, University of Maryland, College Park, 250 pp.
Tuttle, M. P. (2001). The use of liquefaction features in paleoseismology:Lessons learned in the New Madrid seismic zone, central UnitedStates, J. Seismol. 5, 361–380.
Tuttle, M. P., and G. M. Atkinson (2010). Localization of large earthquakesin the Charlevoix seismic zone, Quebec, Canada, during the past10,000 years, Seismol. Res. Lett. 81, no. 1, 140–147.
Tuttle, M. P., and R. Hartleb (2012). Appendix E. Central and Eastern U.S.paleoliquefaction database, uncertainties associated with paleolique-faction data, and guidance for seismic source characterization, in TheCentral and Eastern U.S. Seismic Source Characterization for NuclearFacilities, Technical Report, Electric Power Research Institute, PaloAlto, California, U.S. Department of Energy, and U.S. Nuclear Regu-latory Commission, 135 pp. plus database.
Tuttle, M. P., H. Al-Shukri, and H. Mahdi (2006). Very large earthquakescentered southwest of the NewMadrid seismic zone 5,000–7,000 yearsago, Seismol. Res. Lett. 77, no. 6, 664–678.
Tuttle, M. P., P. Cowie, and L. Wolf (1992). Liquefaction induced by modernearthquakes as a key to paleoseismicity: A case study of the 1988Saguenay earthquake, A. Weiss (Editor), Proceedings of the NineteenthInternational Water Reactor Safety Information Meeting, NUREG/CP-0119, Vol. 3, 437–462.
Tuttle, M. P., E. S. Schweig, J. D. Sims, R. H. Lafferty, L. W.Wolf, andM. L.Haynes (2002). The earthquake potential of the New Madrid seismiczone, Bull. Seismol. Soc. Am. 92, no. 6, 2080–2089.
Van de Lageweg, W. I., W. M. van Dijk, A. W. Baar, J. Rutten, and M. G.Kleinhans (2014). Bank pull or bar push: What drives scroll-bar for-mation in meandering rivers? Geology 42, no. 4, 319–322.
Villamor, P., M. Giona-Bucci, P. Almond, M. Tuttle, R. Langridge, K. Clark,W. Ries, M. Vandergoes, P. Barker, F. Martin, et al. (2014). Exploringmethods to assess paleoliquefaction in the Canterbury area, GNS Sci-ence Consultancy Report Number 2014/183, 142 pp.
Villamor, P., N. Litchfield, D. Barrell, R. VanDissen, S. Hornblow,M. Quigley,S. Levick, W. Ries, B. Duffy, J. Begg, et al. (2012). Map of the 2010Greendale fault surface rupture, Canterbury, New Zealand: Applicationto land use planning, New Zeal. J. Geol. Geophys. 55, no. 3, 223–230.
Wallace, L. M., J. Beavan, R. McCaffrey, K. Berryman, and P. Denys (2007).Balancing the plate motion budget in the South Island, New Zealandusing GPS, geological and seismological data, Geophys. J. Int. 168,no. 1, 332–352.
Ward, S. D., M. K. H. Brown, I. R. Brown, and T. J. Larkin (2011). Geologicalengineering study of liquefaction after the 2010 Darfield earthquake in anarea of complex fluvial geology, Proc. of the Ninth Pacific Conference onEarthquake Engineering Building an Earthquake-Resilient Society,Auckland, New Zealand, 14–16 April, 2011, Paper Number 053.
Youd, T. L. (1984). Geologic effects: Liquefaction and associated groundfailure, U.S. Geol. Surv. Open-File Rept. 84–760, 210–232.
Youd, T. L., and S. N. Hoose (1977). Liquefaction susceptibility and geologicsetting, Proc. of 6th World Conference on Earthquake Engineering,New Delhi, India, Vol. 6, 37–42.
Youd, T. L., I. Idriss, R. Andrus, I. Arango, G. Castro, J. Christian, R. Dobry,W. Finn, L. Harder Jr., M. Hynes, et al. (2001). Liquefaction resistanceof soils: Summary report from the 1996 NCEER and 1998 NCEER/NSF workshops on evaluation of liquefaction resistance of soils, J.
Geotech. Geoenviron. Eng. 127, 817–833, doi: 10.1061/(ASCE)1090-0241(2001)127:10(817).
GNS ScienceP.O. Box 30368Lower Hutt 5040New [email protected]@[email protected]@[email protected]@[email protected]
(P.V., R.M.L., K.C., W.R., M.V., P.B., J.H.)
Department of Soil and Physical SciencesFaculty of Agriculture and Life SciencesLincoln UniversityP.O. Box 85084Lincoln 7647, CanterburyNew [email protected]@lincolnuni.ac.nz
(P.A., M.G.-B.)
M. Tuttle & Associates128 Tibbetts LaneGeorgetown, Maine [email protected]
(M.P.T.)
Department of Geological SciencesUniversity of CanterburyPrivate Bag 4800Christchurch 8140, New [email protected]
(S.H.B.)
Department of Soils and LandscapesLandcare ResearchP.O. Box 69040Lincoln 7640, New [email protected]
(A.E.)
School of Earth SciencesThe University of MelbourneVictoria 3010, [email protected]
(M.C.Q.)
Departamento de Biología y GeologíaESCET- Departamental 2Universidad Rey Juan CarlosC/ Tulipán s/n28933 MostolesMadrid, [email protected]
(F.M.)
Manuscript received 21 August 2015;Published Online 12 July 2016
Liquefaction Features by Canterbury Earthquake Sequence and Assessment of Paleoliquefaction Features 25
BSSA Early Edition