Embed Size (px)
Citation preview
AUTUMN 2020, Vol 6, No 4, JOURNAL OF HYDRAULIC STRUCTURES
Shahid Chamran University of Ahvaz
Journal of Hydraulic Structures
J. Hydraul. Struct., 2020; 6(4): 33-46 DOI: 10.22055/jhs.2021.36007.1155
Liquefaction Behavior of Stabilized Sand using Clay - A Case
Study: Dorood Liquefied Sand Investigation
Ahmad Reza Mazaheri 1
Masoud Nasiri2
Abstract The phenomenon of liquefaction in loose and saturated sandy soils is one of the most important
hazards for engineering structures during an earthquake. In this phenomenon, the sand changes
its behavior rapidly from solid to viscous fluid, resulting in the instability of the ground. In this
research, at first, sand samples with liquefaction history collected from a site in Dorood,
Lorestan, Iran. Samples obtained from depth of 1.8-2.7 and 2.7-3.5 m and in the laboratory, the
parameters of maximum density, moisture content, friction angle and cohesion were determined.
Then, in order to evaluate the effect of additive on the liquefaction potential, different
percentages of clay from Dorood region added to the samples and tested. Finally, three-
dimensional finite difference software (FLAC3D) used with inducing Dorood earthquake, to
investigate liquefaction potential of stabilized samples by analyzing the u/σ ratio for models. The
results showed that adding clay to the soil of this area reduce the friction angle, increase
cohesion, and has a favorable effect on the liquefaction potential. Results of this investigation
indicated that adding 3% clay to the liquefied Dorood sand, would lead to decrease the
liquefaction potential up to 39%.
Keywords: Liquefaction, Case Study, Dorood Sand, Clay, FLAC3D.
Received: 17 December 2020; Accepted: 8 February 2021
1. Introduction One of the most important issues in geotechnical engineering is the liquefaction phenomenon.
In liquefaction, soil exhibits a special behavior, so that the sand rapidly changes its behavior
from solid to viscous fluid. The predisposing factor for liquefaction is the tendency to volume
change. Characteristics that play role in this matter are particle size and shape, and grain size
distribution [1]. Soil liquefaction is one of the most important hazards for engineering structures
1 Department of Civil Engineering, Engineering Faculty, Ayatollah Borujerdi University, Borujerd, Iran.
Email: [email protected] (Corresponding Author) 2 Department of Civil Engineering, Engineering Faculty, Ayatollah Borujerdi University, Borujerd, Iran.

A. R. Mazaheri, M. Nasiri
AUTUMN 2020, Vol 6, No 4, JOURNAL OF HYDRAULIC STRUCTURES
Shahid Chamran University of Ahvaz
34
constructed on loose sandy fields during an earthquake. Failure of the ground due to liquefaction
can cause many structural damages, such as building breakdown, underground facilities
breakage, lateral spreading, and even landslide. In general, soil liquefaction can be divided into
two types, which include cyclic mobility and flow liquefaction. Cyclic mobility occurs when the
static shear stress is less than shear strength of liquefied soil. Flow liquefaction can occur when
the shear stress required for static equilibrium of a soil mass is greater than the shear strength of
the soil in its liquefied state [2].
In fine sandy soils, there is a stable contact between the soil particles prior to the earthquake.
This contact ensures that due to the shear strength of the soil mass, the stability of the structure
on the soil is well maintained. When soil is deformed by stresses due to dynamic loads, the
contact between the particles disappears. As a result, forces that were previously carried by
stable contact between soil particles are transferred to the pore water. In such case, the shear
strength of the soil reaches zero and the soil mass behaves similarly to viscous fluid. After
liquefaction, when water drained from fine sandy soil, the soil particles settle and the connection
between the particles will restored. The amount of soil deformation caused by liquefaction
depends on the looseness of the material, depth, thickness, and the width of the liquefied layer,
and the distribution of loads applied by other buildings and structures. Liquefaction does not
occur by chance, but is limited to environments that are geologically and hydrologically fresh,
made up of sand and silt (in areas with high water table level). In general, the sediments, which
are fresh and weak with high water table level, are more prone to liquefaction.
So far, several case studies have been conducted on the liquefaction conditions in geotechnical
fields [3, 4]. Ishihara and Koseki [5] stated that despite the lack of a clear relationship between
the percentage of clay and the potential for liquefaction, increasing the plasticity index increases
the resistance to liquefaction. Koester [6] also presented evidence that soil plasticity was not a
controlling factor in liquefaction potential for soil with plastic particles, so that if the void ratio
keep constant, the type and plasticity condition of fine-grains play the least role in the
liquefaction potential. Tianqiang, and Prakash [7] investigated the effect of clay on the cyclic
strength and pore water pressure of silt, stating that the nature of pore pressure in non-plastic silt
is almost similar to that of sand. Polito and Martin [8] found that up to a certain percentage of
fine-grain, liquefaction resistance reduce and with further increase in fine-grains, the liquefaction
resistance will enhance.
The results of Arabani and Pirouz [9] study demonstrate that using rough set theory can be
helpful for liquefaction prediction and can reduce unnecessary costs in the site investigation
process. Lentini and Castelli [1] showed that the cyclic resistance increases with the decrease in
the initial confining stress and decreases as the silt content increases and confirmed that the
coarsest material has a lower tendency to liquefy. At constant relative density, the liquefaction
resistance of fine sand decreases with the addition of non-plastic fines up to 40%. It is also noted
that the liquefaction resistance of sand is increased substantially with an increase in cycles of
preloading and over-consolidation pressures [10]. The results of sand-tire mixture experiments
indicate that the required energy for liquefaction occurrence decreases with the increase in the
rubber content. The minimum amount of required energy is determined for mixtures with 10%
rubber content. As the result, the inclusion of crumb rubber decreases the liquefaction resistance
of sand. However, when the rubber content increases from 10 to 25%, the resistance to
liquefaction improves [11].
The settlement and lateral spreading for the liquefied sand are respectively 2.60 and 2.50 times
than those of the sand in the dry state. The volumetric strain of the liquefied sand is found to be

Liquefaction Behavior of Stabilized Sand using C …
AUTUMN 2020, Vol 6, No 4, JOURNAL OF HYDRAULIC STRUCTURES
Shahid Chamran University of Ahvaz
35
around 4%, which is significantly higher than that of 1.53% observed in the dry sand [12]. Stone
columns, in the case of sand bed reinforcement, behaved in a combined shear and flexure mode
and with their high permeability, can dramatically decrease the liquefaction hazard [13].
Reinforcing soil with tire powders and tire shreds reduces the deformations caused by
liquefaction [14]. Results of Wang et al. [15] indicated that the liquefaction resistance for
undisturbed specimens decreases with an increase in the plasticity index and then increases with
a further increase in plasticity index. It is observed that critical silt content to generate maximum
pore water pressure, in the case of liquefaction, is varied for different accelerations. Further,
effect of silt content is very much dependent on relative density [16]. Other methods, besides
using additives, for soil improvement in order to prevent liquefaction are using dynamic
compaction [17], stone columns [18, 19], and piles [20]. Liquefaction have been the topic of
various researches [21-30].
Sand stabilization methods are among important issues in civil engineering, which has a great
impact on the stability of structures and their optimal usage. Previous researches has shown that
this is an important topic. In this research, at first, sand samples with liquefaction history
collected from a site in Dorood, Lorestan, Iran. Samples obtained from depth of 1.8-2.7 and 2.7-
3.5 m and tested in the laboratory. Then, stabilization operations were performed by adding clay
to sand and the results were analyzed. Finally, with the help of three-dimensional finite
difference software (FLAC3D), the potential of liquefaction for clay-stabilized Dorood sand was
investigated.
2. Site Characteristics The investigated area, which contain liquefied sand, is Dorood city in Lorestan province,
Iran. The region experienced an earthquake measuring 6.2 on the Richter scale in 2006, which
caused great loss of lives and properties, including soil liquefaction. Geographically, as well as
in terms of geological zones, with the exception of the eastern margin, most of Lorestan
province is located in the Zagros highlands. Dorood city is located in Lorestan province with the
center of points with coordinates of 49:03 and 33:28. This region is located in the east of
Lorestan province and a wide area called Silakhor plain. The studied site is geologically diverse.
Due to the divisions of the western and southern parts, it is located in the folded area of the
Zagros. The middle part, which is more extensive, is located in the High Zagros zone. The
easternmost areas gradually reach the Sanandaj-Sirjan zone. One of the main reasons for the
importance of this region is that it is located on the border of three very important zones of
Sanandaj-Sirjan, and the folded and driven parts of the Zagros. The Seismotectonics map of the
area is shown in Figure 1.
3. Materials and Experimental Procedure Laboratory tests performed on studied soil are grain size distribution test (ASTM D6913M-
17), Hydrometer test (ASTM D442-63), Atterberg Limits test (ASTM D4318-17), and direct
shear test (ASTM D3080M-11). Based on the results of the experiments, it can be concluded that
the identified layers are categorized SM, according to USCS approach. Table 1 and 2 show sand
and clay characteristics used in this paper. It is worth mentioning that the clay used was the local
type of clay in studied area. It is noteworthy that the construction of direct shear samples were
performed with unit weight equal to 90% compaction.

A. R. Mazaheri, M. Nasiri
AUTUMN 2020, Vol 6, No 4, JOURNAL OF HYDRAULIC STRUCTURES
Shahid Chamran University of Ahvaz
36
Figure 1. Dorood Seismotectonics map
Table 1. Sand characteristics derived from the site
Gs emax emin γ γd C φ Soil
Type
(USCS)
φ
(gr/cm3) (gr/cm3) (kg/cm2) (°) (°)
Sand 2.66 0.9 0.3 1.84 1.75 0 32 SM 32
Table 2. Clay characteristics as additive
Permeability ωopt γd max
LL PL PI
(cm2/s) (%) (gr/cm3)
Clay 7.34×10⁻⁷ 14.41 1.818 31.8 18 13.8
3.1. Examine the clay effect In order to investigate the effect of clay addition on the liquefaction properties of the soil in
the area, sand was mixed with different percentages of clay and tested using direct shear test in
saturated state. Then parameters of density, optimal moisture, friction angle, and cohesion of
samples obtained. Investigated specimens include non-additive (pure) sand and sand with 1%,
3%, 6%, and 8% clay. Table 3 shows the results obtained from laboratory experiments.
Figures 2 to 5 show the effect of adding clay on soil density, moisture content, cohesion, and
internal friction angle. As can be seen in these figures, the addition of clay reduces the maximum
density and internal friction angle, as well as increases the moisture content and cohesion of the
soil mass.

Liquefaction Behavior of Stabilized Sand using C …
AUTUMN 2020, Vol 6, No 4, JOURNAL OF HYDRAULIC STRUCTURES
Shahid Chamran University of Ahvaz
37
Table 3. Sample characteristics and test results in saturated condition
Material
Optimum
Moisture
Content (%)
Dry Density (gr/cm2) Direct Shear Test (slow)
90%
Compaction Maximum
Friction
Angle (°)
Cohesion
(kg/cm2)
Pure Sand 5.2 1.56 1.73 34 0.00
Sand with 1% Clay 5.4 1.54 1.71 33 0.00
Sand with 3% Clay 5.9 1.50 1.67 32 0.03
Sand with 6% Clay 6.6 1.44 1.60 29 0.07
Sand with 8% Clay 7.4 1.36 1.51 27 0.12
Figure 2. Effect of clay on dry density
Figure 3. Effect of clay on optimum moisture content
1.73
1.71
1.67
1.6
1.51
1.45
1.5
1.55
1.6
1.65
1.7
1.75
0 1 2 3 4 5 6 7 8 9
Max
imu
m D
ensi
ty (
gr/
cm3)
Clay Percentage
5.25.4
5.9
6.6
7.4
0
1
2
3
4
5
6
7
8
0 1 2 3 4 5 6 7 8 9
Op
tim
um
Mo
ust
ire
Co
nte
nt
(%)
Clay Percentage

A. R. Mazaheri, M. Nasiri
AUTUMN 2020, Vol 6, No 4, JOURNAL OF HYDRAULIC STRUCTURES
Shahid Chamran University of Ahvaz
38
Figure 4. Effect of clay on cohesion
Figure 5. Effect of clay on friction angle
1. Dynamic Modeling
In this study, dynamic numerical analysis was performed to investigate the dynamic behavior
of soil in the studied area (as previously mentioned, investigated site containing regions with
potential of liquefaction). In order to investigate liquefaction potential, a model was developed in
FLAC3D software, with dimensions of 7×7×10 meters in length, width, and height. It is worth
mentioning that, in this 10 meter height (according to the site investigation in the region) there
are two layers. The first layer is from the ground surface to the depth of 2.5 meters and is made
0 0
0.03
0.07
0.12
-0.02
0
0.02
0.04
0.06
0.08
0.1
0.12
0.14
0 1 2 3 4 5 6 7 8 9
Co
hes
ion
(kg/c
m2)
Clay Percentage
3433
32
29
27
0
5
10
15
20
25
30
35
40
0 1 2 3 4 5 6 7 8 9
Fri
ctio
n A
ngle
(°)
Clay Percentage
Liquefaction Behavior of Stabilized Sand using C …
AUTUMN 2020, Vol 6, No 4, JOURNAL OF HYDRAULIC STRUCTURES
Shahid Chamran University of Ahvaz
39
of silt and clay, and the second one is silty sand layer from 2.5-10 meters. The first layer, i.e.
from the surface of the earth to a depth of 2.5 meters, considered without water table, and the
rest modeled in saturated state. In order to find the optimal number of meshes, at first, the
sensitivity analysis was performed for this model and finally 21296 elements was selected (as
optimum mesh numbers). The boundaries used in the models were chosen according to the
dynamic condition. Free-field boundaries are used at the vertical sides of the model to prevent
wave reflection. Finn's behavioral model, which simulates the increase in pore pressure during
dynamic loading, has been used to calculate the potential of soil liquefaction. In the modeled
samples, the motion of the sides follow that of the base, and vertical loading is by gravity only
(i.e. the motion is that of simple shear). Equilibrium stresses and pore pressures installed in the
soil sample, and pore pressure and effective stress monitored in the zone within the soil.
The basic mechanism of liquefaction in saturated and loose sand layers is the gradual increase
in pore pressure due to the inducing of cyclic stresses resulting from the propagation of the
earthquake shear waves. When applying cyclic stresses to a loose sand mass, there is a tendency
for compaction and consequently a decrease in volume. If the loading time is much shorter than
the time required for water drainage, it is not possible to reduce the volume in a short time and as
a result, changes will be made in the stress state of the soil mass. These changes include
reducing the effective stress between the particles and increasing the pore pressure. Therefore,
the amount of pore pressure depend on the compression situation, the strength properties of the
element due to the load, the intensity, and durability of the applied stresses. If the sand is
sufficiently loose and the loading intensity is large enough, the pore pressure may be equivalent
to the initial stress between the particles. At this point, the forces between the particles are lost
and the particles will be suspended and immersed (i.e., the effective stress becomes zero), which
is called the state of liquefaction. In effective stress relation (𝜎′ = 𝜎 − 𝑢) if 𝑢 = 𝜎 then 𝜎′will
be equal to zero. By drawing u ratio versus depth, soil liquefaction can be calculated. If the
u ratio reaches 1, complete liquefaction has occurred. Figure 2 shows the pore pressure
contours in the model after inducing the Dorood earthquake.

A. R. Mazaheri, M. Nasiri
AUTUMN 2020, Vol 6, No 4, JOURNAL OF HYDRAULIC STRUCTURES
Shahid Chamran University of Ahvaz
40
Figure 6. Pore pressure contour after inducing Dorood earthquake in FLAC3D
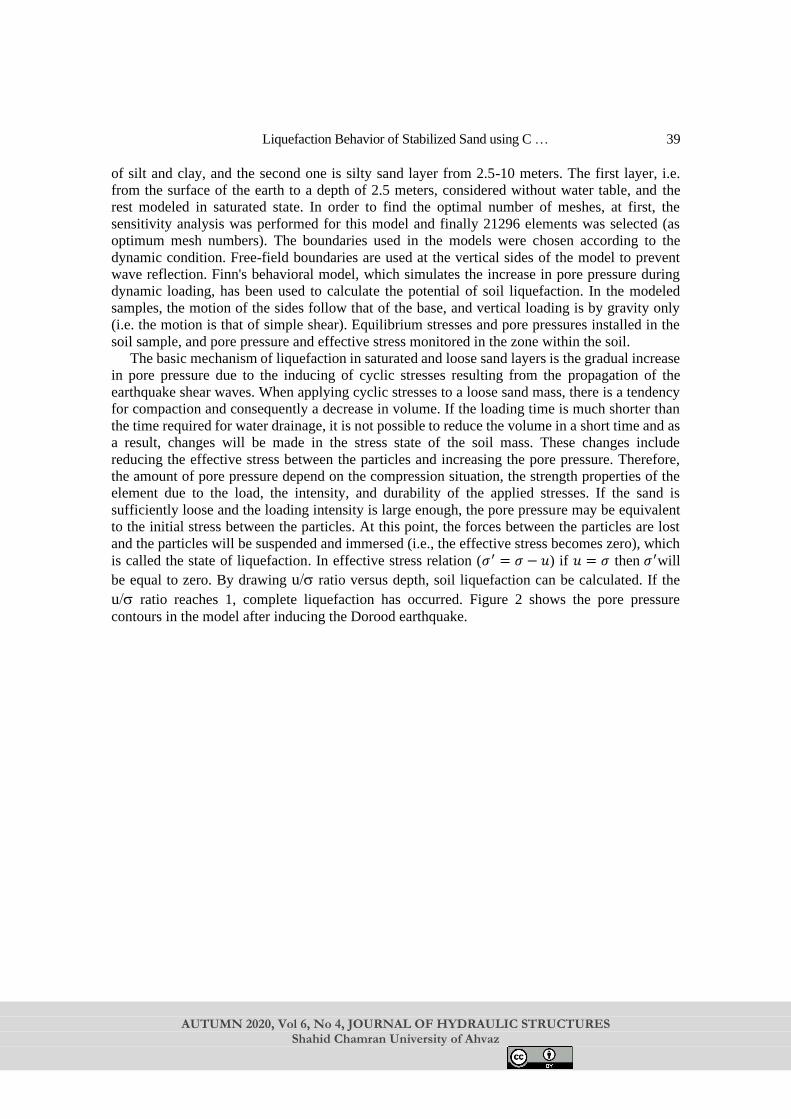
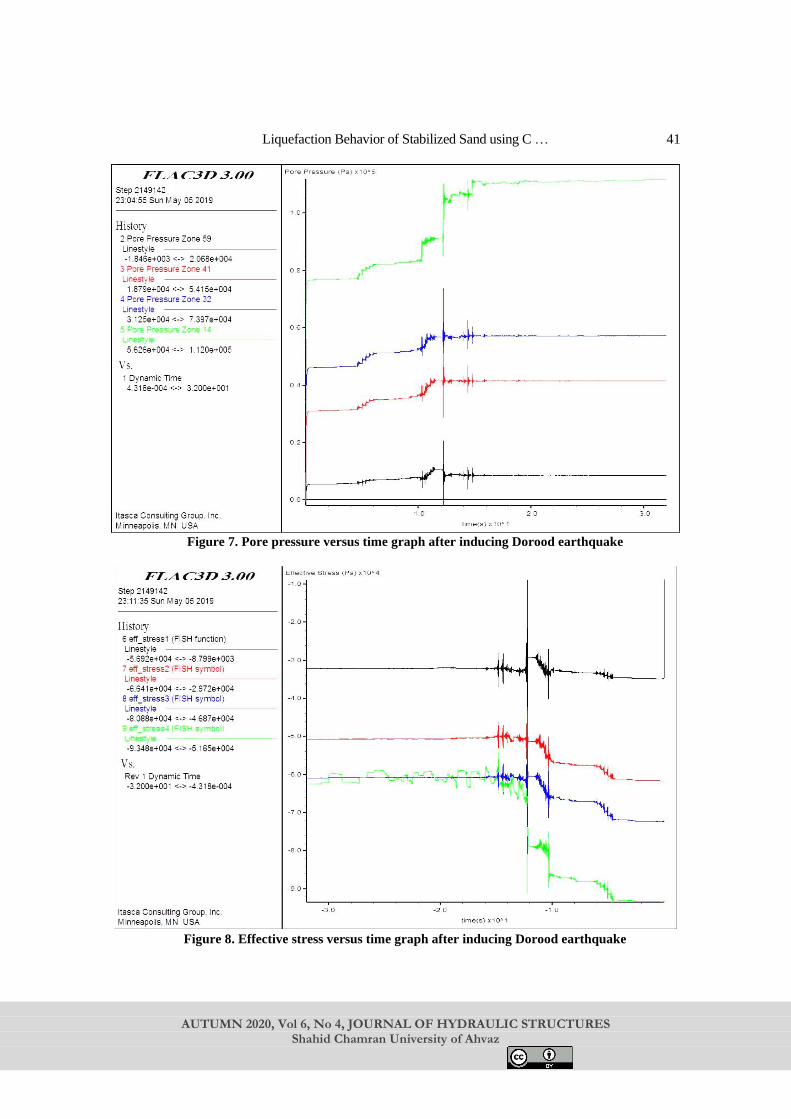
Figures 7 and 8 indicate the process of increasing the pore pressure and reducing the effective
stress in the Dorood earthquake at depths of 2, 4, 6, and 8 meters. Black, red, blue, and green
lines in these figures are representing the depths of 2, 4, 6, and 8 meters, respectively. At depth
of 8 m, the pore pressure has an abrupt increase and the effective stress has a sudden decrease,
which indicates the possibility of liquefaction in the soil. As mentioned earlier, liquefaction has
been reported in the Dorood earthquake, which confirms the accuracy of the 3D numerical
modeling in this study. Given that the behavior of pore pressure and effective stress at a depth of
8 meters has changed abruptly, it can be concluded that increase in the pore pressure at this
depth has led to a sudden decrease in effective stress, which consequently resulted in
liquefaction.
Liquefaction Behavior of Stabilized Sand using C …
AUTUMN 2020, Vol 6, No 4, JOURNAL OF HYDRAULIC STRUCTURES
Shahid Chamran University of Ahvaz
41
Figure 7. Pore pressure versus time graph after inducing Dorood earthquake
Figure 8. Effective stress versus time graph after inducing Dorood earthquake

A. R. Mazaheri, M. Nasiri
AUTUMN 2020, Vol 6, No 4, JOURNAL OF HYDRAULIC STRUCTURES
Shahid Chamran University of Ahvaz
42
By drawing u versus depth, soil liquefaction can be examined. Figure 9 shows the changes
in u based on depth for sand without additives (i.e. pure sand). The closer the u to 1, the
more likely that liquefaction will occur. Based on the above-mentioned relation, at the depth of 8
meters this phenomenon is more probable.
Figure 9. Variations of u with depth for pure sand sample
4.1. Study the effect of clay additive
In order to investigate the effect of clay addition on the liquefaction properties of Dorood
sand, the cohesion and friction angle properties measured in the laboratory (in terms of
percentage of clay addition) were applied to the samples and analysis were performed. This
means that the characteristics of the layer of sand in the model (i.e. the depth of 2.5 to 10 meters)
were replaced by the strength parameters of the sands with additives. Figure 10 shows the
changes in u based on depth for soil without additives (pure sand) and sands containing 1, 3, 6,
and 8% clay. As can be seen in this figure, the presence of clay reduces the u ratio, which
indicates a decrease in the liquefaction potential. Therefore, it can be concluded that using clay,
with the mentioned characteristics, since increases the resistance to liquefaction, is very effective
approach.
0
1
2
3
4
5
6
7
8
9
10
00.10.20.30.40.50.60.7
Dep
th (
m)
U/

Liquefaction Behavior of Stabilized Sand using C …
AUTUMN 2020, Vol 6, No 4, JOURNAL OF HYDRAULIC STRUCTURES
Shahid Chamran University of Ahvaz
43
Figure 10. Variations of u with depth for samples with different percentage of clay additive
5. Results and Discussion In this section, the laboratory results and numerical analyzes performed on Dorood liquefied
sand will discussed. In this study, after determining the strength parameters of Dorood liquefied
sand with the help of direct shear experiments, different percentages of clay were added to
samples, in order to evaluate the effect of local clay, in different ranges, on the liquefaction
potential of studied sand. As shown in Figure 2, adding clay to sand reduces the maximum dry
density. By adding 8% clay to the sample, the unit weight is reduced by 13%, while adding 1%
clay is almost ineffective (decreased about 1%). Regarding the percentage of optimal moisture
content (Figure 3), it can be stated that adding clay will increase the percentage of optimal
moisture for the samples (up to 42% increase). As expected, increasing the amount of clay in the
samples will reduce the angle of friction and increase soil cohesion. Based on Figures 4 and 5, it
can be seen that 8% clay reduces the friction angle by 20% and increases the cohesion by 12%.
In the case of adding 3% clay to the samples, a 13% increase in the optimal moisture content
achieved, a decrease of 3% in the maximum density, a 3% increase in cohesion and about 6%
reduction in the internal friction angle are also confirmed. Briefly, it can stated that the addition
of clay to Dorood liquefied sand reduces the density and internal friction angle. While the
percentage of optimum moisture content and cohesion will increase.
The results of numerical modeling in the three-dimensional finite difference software
(FLAC3D) showed that liquefaction occurred at the depth of 8 m. As can be seen in Figures 7
and 8, at a depth of 8 m, the pore water pressure and the effective stress fluctuate, indicating the
occurrence of a liquefaction phenomenon in the soil. Based on figure 7, the depth of 8 m
indicates a sudden increase in the pore water pressure, and the same depth in figure 8 shows a
sharp decrease in the effective stress. This proves the liquefiable condition of Dorood sand.
0
1
2
3
4
5
6
7
8
9
10
00.10.20.30.40.50.60.7
Dep
th (
m)
U/
0%
1%
3%
6%
8%
Clay
percentage

A. R. Mazaheri, M. Nasiri
AUTUMN 2020, Vol 6, No 4, JOURNAL OF HYDRAULIC STRUCTURES
Shahid Chamran University of Ahvaz
44
Adding clay to the liquefied sand of the studied region reduces the potential for liquefaction.
Although the addition of clay to the soil mass generally behaves in the same way, it does not
follow a specific incremental pattern. Among all the percentages tested, 3% clay performed the
best, reducing the u ratio by 39%. While 1% clay has a weaker function in reducing the
potential for liquefaction (37% reduction). In addition, adding more than 3% clay to this sand,
i.e. 6% and 8%, will still have weaker performance, in which there were 36% and 34% decrease
in the potential for liquefaction, respectively. However, as shown in Figure 10, the addition of
clay to Dorood sand at any rate will increase the resistance to liquefaction comparing to pure
sand.
6. Conclusion One way to reduce the potential for sand liquefaction is to stabilize it with additives, and clay
is among the most successful ones in this regard. In this study, Dorood local clay was used as an
additive in different percentages and its optimal percentage was determined to increase the
resistance to liquefaction. In this research, Dorood sand, which previously experienced
liquefaction, has been used. Initially, different percentages of clay were added to the sand, and
the samples were tested with direct shear box. Afterward, the strength parameters results
obtained from stabilized samples were used in the analysis of liquefaction potential with the help
of three-dimensional finite difference software (FLAC3D). The results of liquefaction analysis
(study of the status of pore water pressure and effective stress) and calculation of u ratio for
non-additive (pure) sand showed that the depth of 8 m (with u ratio equal to 0.642) was
liquefied. In the next step, the parameters of the stabilized sands were used in the modeling, and
the results were examined. The results indicated that adding clay to the samples reduced the
potential of liquefaction. Same as any additive to the soil mass, the clay used has the optimal
percentage to achieve the best results. Three-dimensional analyzes revealed that 3% clay, as the
most optimal percentage of additive in this soil, increased the liquefaction resistance well
enough and reduced the u ratio by 39%. The results of this research made it clear that clay can
be used to protect Dorood sand against liquefaction, to increase its strength, and to achieve the
favorable results in this region.
References
1. Lentini V, and Castelli F, (2019) Liquefaction Resistance of Sandy Soils from Undrained
Cyclic Triaxial TestsGeotechnical and Geological Engineering, 37, pp201-216.
2. Kramer S, (1996) Geotechnical Earthquake Engineering1st edition, Pearson Publication
3. Yilmaz D, Babuccu F, Batmaz S, and Kavruk F, (2008) Liquefaction analysis and soil
improvement in Beydag damGeotechnical and Geological Engineering, 26, pp211-224
4. Sharma B, and Hazarika PJ, (2013) Assessment of Liquefaction Potential of Guwahati City:
A Case StudyGeotechnical and Geological Engineering, 31, pp1437-1452.
5. Ishihara K, and Koseki J, (1989) Discussion on the cyclic shear strength of fines-containing
sandsEarthquakes Geotechnical Engineering, Proceedings of the Eleventh International
Conference on Soil Mechanics and Foundation Engineering, Rio De Janiero, Brazil, pp101-
106.

Liquefaction Behavior of Stabilized Sand using C …
AUTUMN 2020, Vol 6, No 4, JOURNAL OF HYDRAULIC STRUCTURES
Shahid Chamran University of Ahvaz
45
6. Koester JP, (1994) The influence of fine type and content on cyclic strengthGround Failures
under Seismic Conditions, Conditions, Geotechnical Special Publication, ASCE, 44, pp330-
345.
7. Tianqiang G, and Prakash S, (1999) Liquefaction of silts and silt-clay mixturesJournal of
Geotechnical and Geoenvironmental Engineering, 125(8), pp706-710.
8. Polito CP, and Martin JR, (2001) Effects of non-plastic fines on the liquefaction resistance
of sandsJournal of Geotechnical and Geoenvironmental Engineering, ASCE, 127(5), pp408-
415.
9. Arabani M, and Pirouz M, (2019) Liquefaction prediction using rough set theoryScientia
Iranica, 26(2), pp779-788.
10. Akhila M, Rangaswamy K, and Sankar N, (2018) Undrained Response and Liquefaction
Resistance of Sand–Silt MixturesGeotechnical and Geological Engineering, 37, pp2729-
2745.
11. Shariatmadari N, Karimpour Fard M, and Shargh A, (2019) Evaluation of Liquefaction
Potential in Sand–Tire Crumb Mixtures Using the Energy ApproachInternational Journal of
Civil Engineering, 17, pp181-191
12. Banerjee R, Konai S, Sengupta A, and Deb K, (2017) Shake Table Tests and Numerical
Modeling of Liquefaction of Kasai River SandGeotechnical and Geological Engineering, 35,
pp1327-1340.
13. Tang L, Zhang X, and Ling X, (2016) Numerical Simulation of Centrifuge Experiments on
Liquefaction Mitigation of Silty Soils using Stone ColumnsKSCE Journal of Civil
Engineering, 20, pp631-638
14. Bahadori H, and Farzalizadeh R, (2018) Dynamic Properties of Saturated Sands Mixed with
Tyre Powders and Tyre ShredsInternational Journal of Civil Engineering, 16, pp395-408.
15. Wang S, Luna R, and Yang J, (2016) Reexamination of effect of plasticity on liquefaction
resistance of low-plasticity fine-grained soils and its potential applicationActa Geotechnica,
11, pp1209-1216.
16. Maheshwari BK, and Patel AK, (2010) Effects of Non-Plastic Silts on Liquefaction Potential
of Solani SandGeotechnical and Geological Engineering, 28, pp559-566.
17. Kumar S, (2001) Reducing liquefaction potential using dynamic compaction and
construction of stone columnGeotechnical and Geological Engineering, 19, pp169-182.
18. Al Mahmoud A, and Degen WS, (2006) Marine stone columns to prevent earthquake
induced soil liquefactionGeotechnical and Geological Engineering, 24, pp775-790.
19. Hajiazizi M, and Nasiri M, (2019) Experimental and numerical investigation of reinforced
sand slope using geogrid encased stone columnCivil Engineering Infrastructures Journal,
52(1), pp85-100.
20. Asadi A, Sharifipour M, and Ghorbani k, (2017) Numerical Simulation of Piles Subjected to
Lateral Spreading and Comparison with Shaking Table ResultsCivil Engineering
Infrastructures Journal, 50(2), pp277-292.

A. R. Mazaheri, M. Nasiri
AUTUMN 2020, Vol 6, No 4, JOURNAL OF HYDRAULIC STRUCTURES
Shahid Chamran University of Ahvaz
46
21. Kumar SS, Dey A, and Krishna AM, (2020) Liquefaction Potential Assessment of
Brahmaputra Sand Based on Regular and Irregular Excitations Using Stress-Controlled
Cyclic Triaxial TestKSCE J Civ Eng 24, 1070–1082
22. Do J, Heo SB, Yoon YWet al (2017) Evaluating the liquefaction potential of gravel soils
with static experiments and steady state approachesKSCE J Civ Eng 21, 642–651.
23. Naik SP, Patra NR (2018) Generation of Liquefaction Potential Map for Kanpur City and
Allahabad City of Northern India: An Attempt for Liquefaction Hazard AssessmentGeotech
Geol Eng 36, 293–305.
24. Ghani S, Kumari S (2021) Insight into the Effect of Fine Content on Liquefaction Behavior
of SoilGeotech Geol Eng 39, 1–12.
25. Liu, J (2020) Influence of Fines Contents on Soil Liquefaction Resistance in Cyclic Triaxial
TestGeotech Geol Eng 38, 4735–4751.
26. Jha SK, Karki B & Bhattarai A (2020) Deterministic and Probabilistic Evaluation of
Liquefaction Potential: A Case Study from 2015 Gorkha (Nepal) EarthquakeGeotech Geol
Eng 38, 4369–4384.
27. Khashila M, Hussien MN, Karray M et al (2020) Liquefaction resistance from cyclic simple
and triaxial shearing: a comparative studyActa Geotech.
28. Tsai CC, Hwang YW & Lu CC (2020) Liquefaction, building settlement, and residual
strength of two residential areas during the 2016 southern Taiwan earthquakeActa
Geotech15, 1363–1379.
29. Yilmaz C, Silva Vand Weatherill (2020) Probabilistic framework for regional loss
assessment due to earthquake-induced liquefaction including epistemic uncertaintySoil
Dynamic and Earthquake Engineering, 141, 106493.
30. He S, Wang X, Fan, Het al (2020) The study on loess liquefaction in China: a systematic
reviewNat Hazards 103, 1639–1669
© 2021 by the authors. Licensee SCU, Ahvaz, Iran. This article is an open access article distributed
under the terms and conditions of the Creative Commons Attribution 4.0 International (CC BY 4.0
license) (http://creativecommons.org/licenses/by/4.0/).