Embed Size (px)
DESCRIPTION
pH
Citation preview

Theory and Practice of pH Measurement
PN 44-6033/rev. D
December 2010


THEORY AND PRACTICE OF pH MEASUREMENT TABLE OF CONTENTS
THEORY AND PRACTICEOF pH MEASUREMENT
TABLE OF CONTENTS
Section Title Page
1.0 OVERVIEW.............................................................................................................. 11.1 Introduction .............................................................................................................. 11.2 Operational Definition of pH..................................................................................... 21.3 pH Measurements in Industry .................................................................................. 3
2.0 CELLS FOR MEASURING pH................................................................................ 42.1 General .................................................................................................................... 42.2 Measuring Electrode ................................................................................................ 52.3 Reference Electrode ................................................................................................ 62.4 Liquid Junction Potential .......................................................................................... 62.5 Double Junction Reference Electrodes.................................................................... 8
3.0 MAKING THE pH MEASUREMENT ....................................................................... 93.1 Converting Voltage to pH ......................................................................................... 93.2 Glass Electrode Slope ............................................................................................. 93.3 Buffers and Calibration............................................................................................. 103.4 Precautions Using Buffers........................................................................................ 123.5 Isopotential pH ......................................................................................................... 133.6 Solution Temperature Compensation....................................................................... 143.7 Shields, Insulation, and Preamplifiers...................................................................... 143.8 Sensor Diagnostics .................................................................................................. 14
4.0 FUNDAMENTAL LIMITATIONS .............................................................................. 154.1 Junction Potential Mismatch .................................................................................... 154.2 Sodium Error ............................................................................................................ 16
5.0 ORP MEASUREMENTS.......................................................................................... 175.1 Introduction .............................................................................................................. 175.2 Measuring Electrode ................................................................................................ 185.3 Interpreting ORP Measurements ............................................................................. 185.4 Calibration................................................................................................................ 20
6.0 INSTALLING THE SENSOR ................................................................................... 216.1 General .................................................................................................................... 216.2 Safety....................................................................................................................... 216.3 Immersion and Insertion Applications ...................................................................... 216.4 Electrical Connections ............................................................................................. 22
7.0 MAINTENANCE ...................................................................................................... 237.1 General .................................................................................................................... 237.2 Cleaning pH Sensors ............................................................................................... 237.3 Calibrating pH Sensors ............................................................................................ 257.4 Storing pH Sensors .................................................................................................. 25
8.0 TROUBLESHOOTING ............................................................................................ 268.1 Introduction .............................................................................................................. 268.2 Installation ................................................................................................................ 268.3 Wiring....................................................................................................................... 268.4 Problems with Calibrations ...................................................................................... 268.5 Noisy Readings........................................................................................................ 288.6 Drift........................................................................................................................... 288.7 Ground Loops .......................................................................................................... 29
i
THEORY AND PRACTICE OF pH MEASUREMENT TABLE OF CONTENTS
THEORY AND PRACTICEOF pH MEASUREMENT
LIST OF APPENDICES
Section Title Page
A Silver/Silver Chloride Electrode Potentials............................................................... 30B Isopotential pH ......................................................................................................... 31C Glossary................................................................................................................... 32
LIST OF FIGURES
Figure # Title Page
1-1 Operational Definition of pH..................................................................................... 22-1 pH Measurement Cell .............................................................................................. 42-2 Measuring Electrode ................................................................................................ 52-3 Cross-Section through the pH Glass ....................................................................... 52-4 Reference Electrode ................................................................................................ 62-5 The Origin of Liquid Junction Potentials .................................................................. 72-6 Comparison of Large Pore and Small Pore Liquid Junctions .................................. 72-7 Junction Plugging Caused by Silver Chloride .......................................................... 82-8 Double Junction Reference Electrode ..................................................................... 83-1 Glass Electrode Slope ............................................................................................. 103-2 Two-Point Buffer Calibration .................................................................................... 113-3 Isopotential pH ......................................................................................................... 134-1 Liquid Junction Potential Mismatch.......................................................................... 154-2 Sodium Error ............................................................................................................ 165-1 Oxidation-Reduction Potential ................................................................................. 175-2 ORP Measurement Cell ........................................................................................... 185-3 Measuring Electrode ................................................................................................ 185-4 ORP Measurement Interpretation ............................................................................ 196-1 pH Sensor Installation in Flow-Through Piping........................................................ 227-1 Checking the Potential of the Reference Electrode ................................................. 24A-1 Silver/Silver Chloride Electrode ............................................................................... 30B-1 Cell Voltage as a Function of pH.............................................................................. 31
LIST OF TABLES
Table No. Title Page
3-1 NIST Standard Buffers ............................................................................................. 117-1 Cleaning Procedures ............................................................................................... 238-1 RTD Resistance Values ........................................................................................... 278-2 Input Signals for Simulated Buffer Calibration ......................................................... 27
ii
1.0 OVERVIEW
The determination of pH is one of the most common process chemical measurements made today. This bookletexplains the principles behind the measurement and discusses ways of avoiding common pitfalls. The booklet alsodiscusses industrial ORP (oxidation-reduction potential) measurements. Although the determination of ORP is notnearly as common as pH, certain industries make valuable use of the measurement.
1.1 INTRODUCTION
pH is a measure of the relative amount of hydrogen and hydroxide ions in an aqueous solution. In any collectionof water molecules a very small number will have dissociated to form hydrogen (H+) and hydroxide (OH-) ions:
H2O = H+ + OH-
The number of ions formed is small. At 25°C fewer than 2 x 10⁻⁷ % of the water molecules have dissociated. Interms of molar concentrations, water at 25°C contains 1 x10⁻⁷ moles per liter of hydrogen ions and the same con-centration of hydroxide ions.
In any aqueous solution, the concentration of hydrogen ions multiplied by the concentration of hydroxide ions isconstant. Stated in equation form:
Kw = [H+] [OH-] (1)
where the brackets signify molar concentrations and Kw is the dissociation constant for water. The value of Kwdepends on temperature. For example, at 25°C Kw = 1.00 x 10⁻¹⁴ and at 35°C Kw = 1.47 x 10⁻¹⁴.
Acids and bases, when dissolved in water, simply alter the relative amounts of H+ and OH- in solution. Acidsincrease the hydrogen ion concentration, and, because the product [H+] [OH-] must remain constant, acidsdecrease the hydroxide ion concentration. Bases have the opposite effect. They increase hydroxide ion concen-tration and decrease hydrogen ion concentration. For example, suppose an acid is added to water at 25°C and theacid raises the H+ concentration to 1.0 x 10⁻⁴ moles/liter. Because [H+] [OH-] must always equal 1.00 x 10⁻¹⁴,[OH-] will be 1.0 x 10⁻¹⁰ moles/liter.
pH is another way of expressing the hydrogen ion concentration. pH is defined as follows:
pH = -log [H+] (2)
Therefore, if the hydrogen ion concentration is 1.0 x 10⁻⁴ moles/liter, the pH is 4.00.
The term neutral is often used in discussions about acids, bases, and pH. A neutral solution is one in which thehydrogen ion concentration exactly equals the hydroxide ion concentration. At 25°C, a neutral solution has pH7.00. At 35°C, a neutral solution has pH 6.92. The common assertion that neutral solutions have pH 7 is not true.The statement is true only if the temperature is 25°C.
THEORY AND PRACTICE OF pH MEASUREMENT SECTION 1.0
OVERVIEW
SECTION 1.0
OVERVIEW
1.1 INTRODUCTION
1.2 OPERATIONAL DEFINITION OF pH
1.3 pH MEASUREMENTS IN INDUSTRY
1
1.2 OPERATIONAL DEFINITION OF pH
Although equation 2 is often given as the definition of pH, it is not a good one. No one determines pH by first meas-uring the hydrogen ion concentration and then calculating pH. pH is best defined by describing how it is measured.
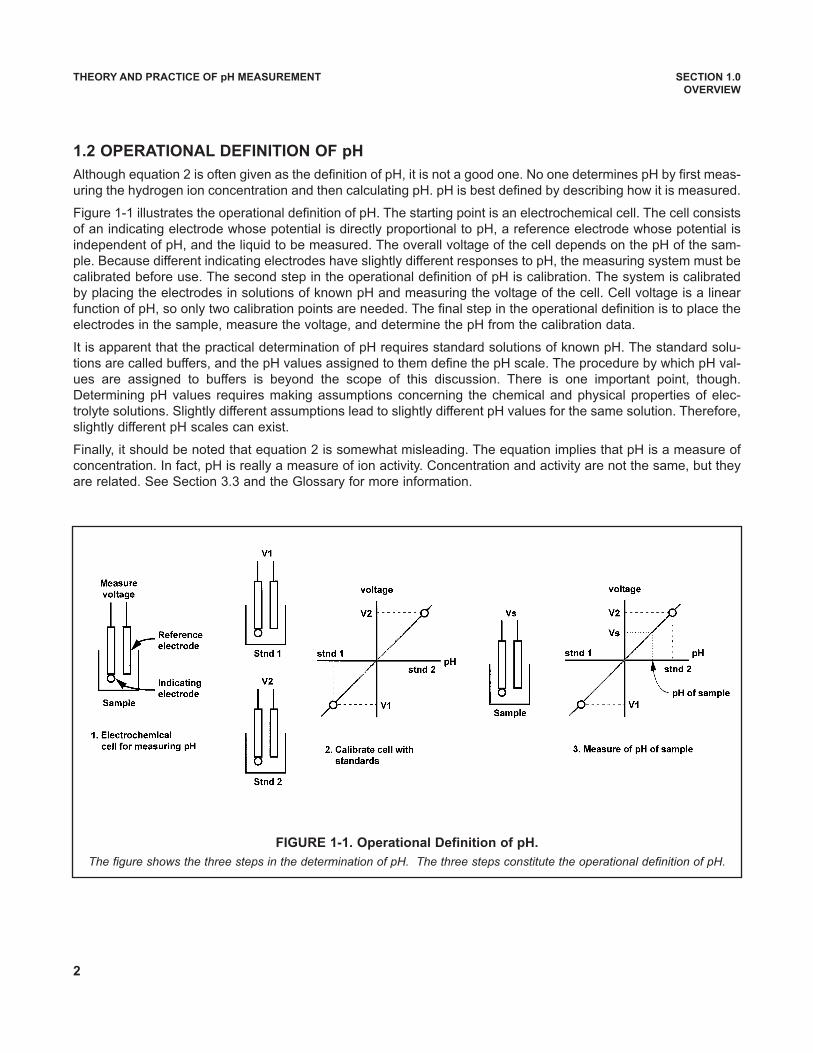
Figure 1-1 illustrates the operational definition of pH. The starting point is an electrochemical cell. The cell consistsof an indicating electrode whose potential is directly proportional to pH, a reference electrode whose potential isindependent of pH, and the liquid to be measured. The overall voltage of the cell depends on the pH of the sam-ple. Because different indicating electrodes have slightly different responses to pH, the measuring system must becalibrated before use. The second step in the operational definition of pH is calibration. The system is calibratedby placing the electrodes in solutions of known pH and measuring the voltage of the cell. Cell voltage is a linearfunction of pH, so only two calibration points are needed. The final step in the operational definition is to place theelectrodes in the sample, measure the voltage, and determine the pH from the calibration data.
It is apparent that the practical determination of pH requires standard solutions of known pH. The standard solu-tions are called buffers, and the pH values assigned to them define the pH scale. The procedure by which pH val-ues are assigned to buffers is beyond the scope of this discussion. There is one important point, though.Determining pH values requires making assumptions concerning the chemical and physical properties of elec-trolyte solutions. Slightly different assumptions lead to slightly different pH values for the same solution. Therefore,slightly different pH scales can exist.
Finally, it should be noted that equation 2 is somewhat misleading. The equation implies that pH is a measure ofconcentration. In fact, pH is really a measure of ion activity. Concentration and activity are not the same, but theyare related. See Section 3.3 and the Glossary for more information.
THEORY AND PRACTICE OF pH MEASUREMENT SECTION 1.0
OVERVIEW
FIGURE 1-1. Operational Definition of pH.
The figure shows the three steps in the determination of pH. The three steps constitute the operational definition of pH.
2
1.3 pH MEASUREMENTS IN INDUSTRY
Although pH is a measure of hydrogen ion activity, the fact is of little interest to anyone but a physical chemist. Itis certainly of scant importance in industrial pH measurements. The major use of pH in industry is process control.Controlling pH helps ensure product quality, reduces corrosion and scaling in plant equipment, and protects theenvironment by helping wastewater dischargers meet regulatory limits.
Process pH control limits are often empirical. It is less important to know why a given pH range works than to keepthe pH in the desired range. It is, therefore, important that the person making and using pH measurements under-stand how the measurement is made, how to calibrate the measuring instrument, and how to recognize and avoidcommon problems.
This booklet has five major sections. The first section discusses the construction and features of the electro-chemical cell used for measuring pH. The second section discusses how the pH analyzer converts the measuredcell voltage into pH. The third section discusses some fundamental limitations to pH measurements. The fourthsection discusses industrial ORP measurements. Because ORP measurement cells have much in common withpH cells, much of the information in the pH cell section applies to ORP measurements. The fifth section deals withinstallation, maintenance, and troubleshooting of pH systems.
THEORY AND PRACTICE OF pH MEASUREMENT SECTION 1.0
OVERVIEW
3
2.1 GENERAL
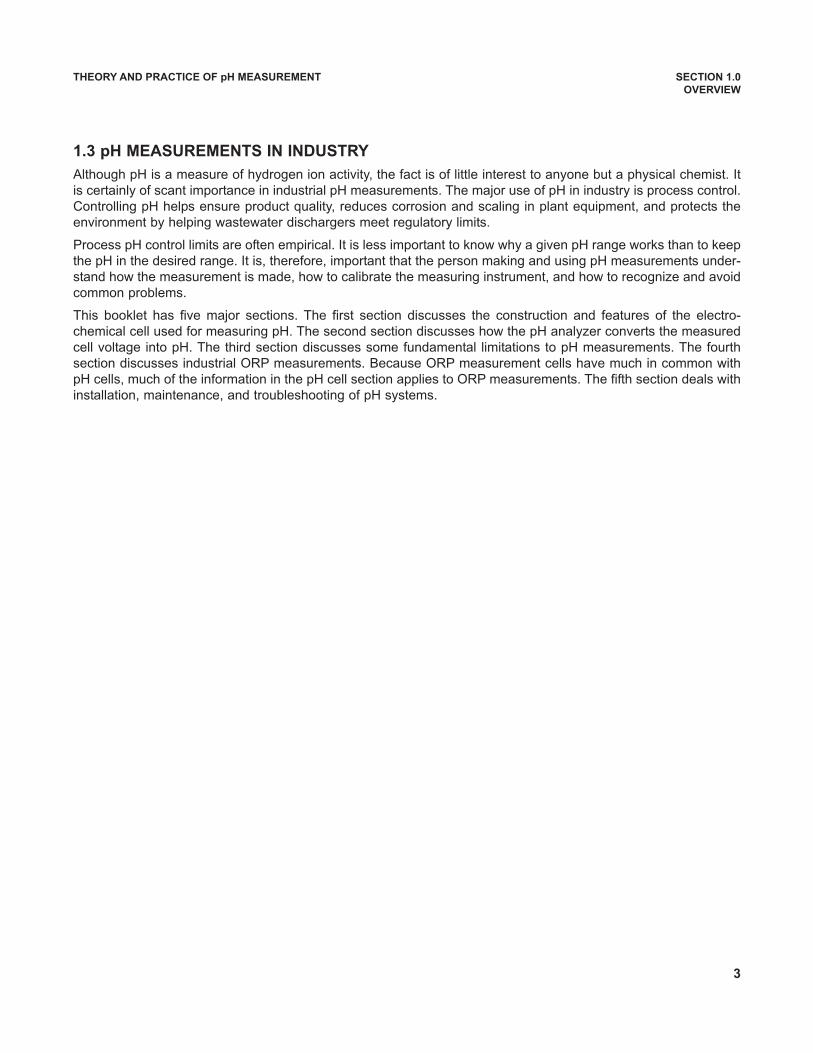
In nearly every industrial and scientific application, pH is determined by measuring the voltage of an electrochem-ical cell. Figure 2-1 shows a simplified diagram of a pH cell. The cell consists of a measuring electrode, a refer-ence electrode, a temperature sensing element, and the liquid being measured. The voltage of the cell is directlyproportional to the pH of the liquid. The pH meter measures the voltage and uses a temperature-dependent fac-tor to convert the voltage to pH. Because the cell has high internal resistance, the pH meter must have a very highinput impedance.
Figure 2-1 shows separate measuring and reference electrodes. In most process sensors, the electrodes and thetemperature element are combined into a single body. Such sensors are often called combination electrodes.
The cell voltage is the algebraic sum of the potentials of the measuring electrode, the reference electrode, and theliquid junction. The potential of the measuring electrode depends only on the pH of the solution. The potential of thereference electrode is unaffected by pH, so it provides a stable reference voltage. The liquid junction potentialdepends in a complex way on the identity and concentration of the ions in the sample. It is always present, but if thesensor is properly designed, the liquid junction potential is usually small and relatively constant. All three potentialsdepend on temperature.
The construction of the electrodes and the electrical potentials associated with them are discussed in Sections 2.2and 2.3.
THEORY AND PRACTICE OF pH MEASUREMENT SECTION 2.0
CELLS FOR MEASURING pH
SECTION 2.0
CELLS FOR MEASURING pH
2.1 GENERAL
2.2 MEASURING ELECTRODE
2.3 REFERENCE ELECTRODE
2.4 LIQUID JUNCTION POTENTIAL
2.5 DOUBLE JUNCTION REFERENCE ELECTRODES
FIGURE 2-1. pH Measurement Cell.
The cell consists of a measuring and reference electrode. The voltage between the electrodes is directly proportional to thepH of the test solution. The proportionality constant depends on temperature, so a temperature sensor is also necessary. A100 Ω platinum RTD is commonly used, although 1000 Ω platinum RTDs, 3 kΩ Balco RTDs, and thermistors are also used.
4
2.2 MEASURING ELECTRODE
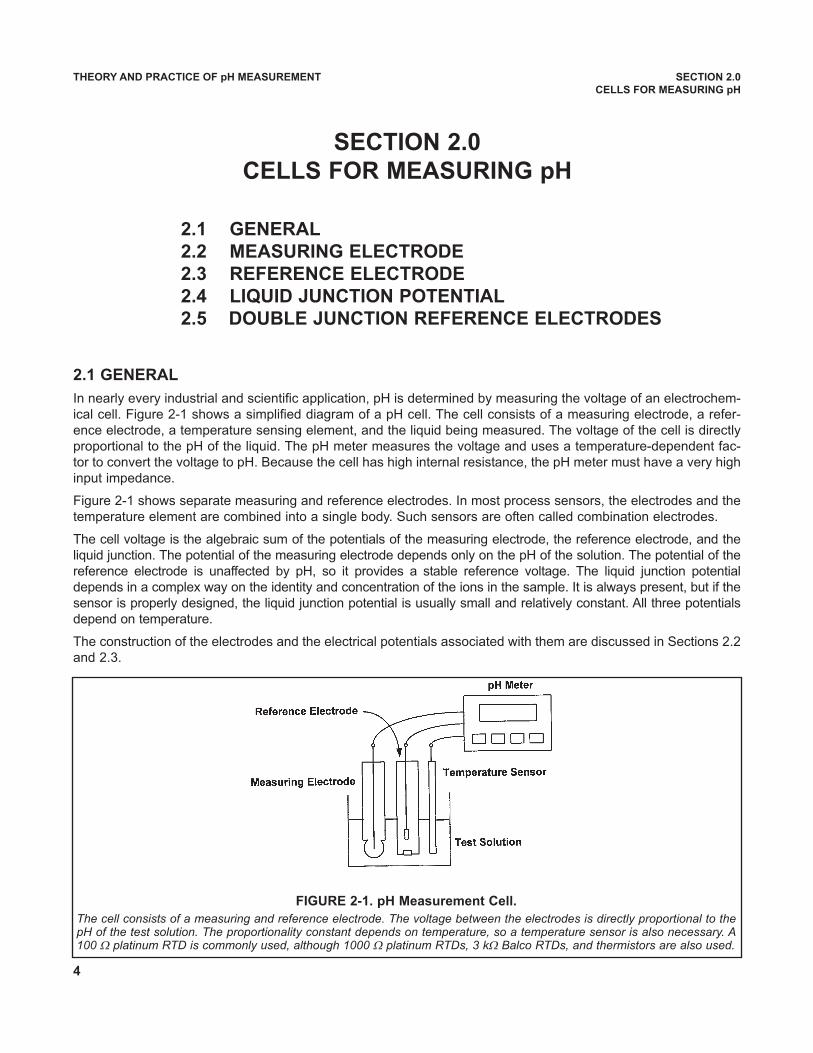
Figure 2-2 shows the internals of the measuring electrode. The heart of the electrode is a thin piece of pH-sensi-tive glass, which is blown onto the end of a length of glass tubing. The pH-sensitive glass, usually called a glassmembrane, gives the electrode its common name: glass electrode. Sealed inside the electrode is a solution ofpotassium chloride buffered at pH 7. A piece of silver wire plated with silver chloride contacts the solution.
The silver wire-silver chloride combination in contact with the filling solution constitutes an internal reference elec-trode. Its potential depends solely on the chloride concentration in the filling solution. Because the chloride con-centration is fixed, the electrode potential is constant. See Appendix A for a more detailed discussion of how thechloride concentration determines the electrode potential.
As Figure 2-2 shows, the outside surface of the glass membrane contacts the liquid being measured, and the insidesurface contacts the filling solution. Through a complex mechanism, an electrical potential directly proportional topH develops at each glass-liquid interface. Because the pH of the filling solution is fixed, the potential at the insidesurface is constant. The potential at the outside surface, however, depends on the pH of the test solution.
The overall potential of the measuring electrode equals the potential of the internal reference electrode plus thepotentials at the glass membrane surfaces. Because the potentials inside the electrode are constant, the overallelectrode potential depends solely on the pH of the test solution. The potential of the measuring electrode alsodepends on temperature. If the pH of the sample remains constant but the temperature changes, the electrodepotential will change. Compensating for changes in glass electrode potential with temperature is an important partof the pH measurement.
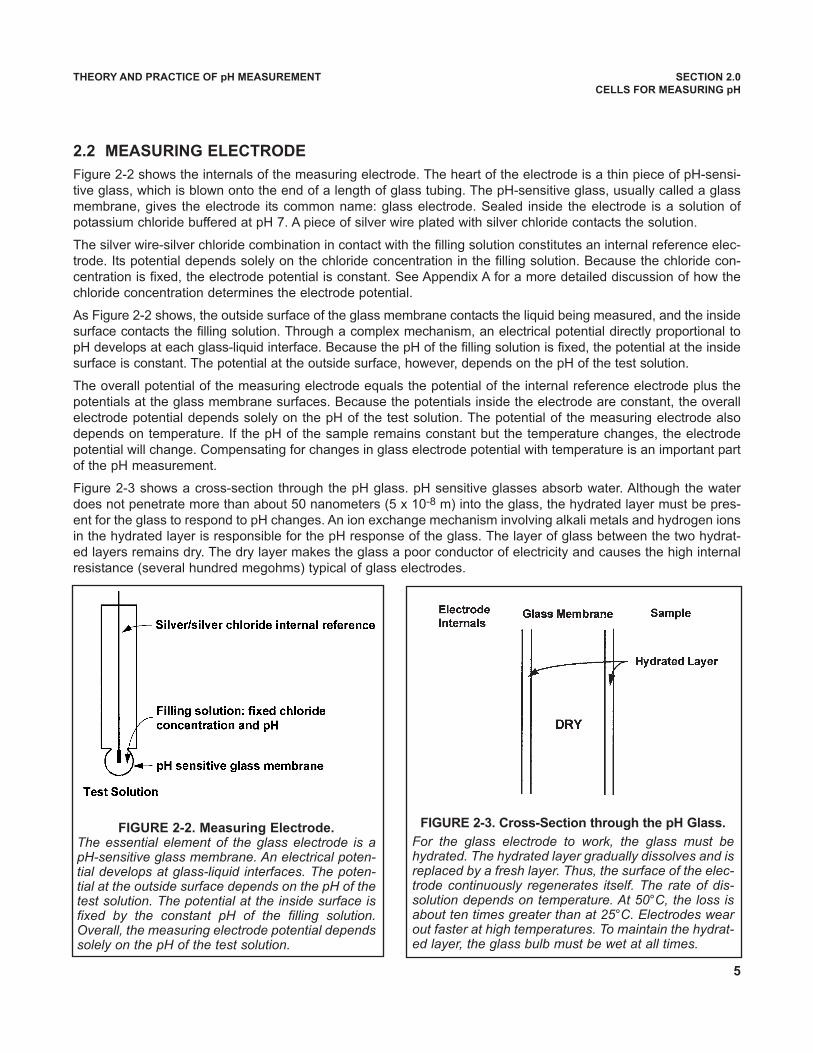
Figure 2-3 shows a cross-section through the pH glass. pH sensitive glasses absorb water. Although the waterdoes not penetrate more than about 50 nanometers (5 x 10⁻⁸ m) into the glass, the hydrated layer must be pres-ent for the glass to respond to pH changes. An ion exchange mechanism involving alkali metals and hydrogen ionsin the hydrated layer is responsible for the pH response of the glass. The layer of glass between the two hydrat-ed layers remains dry. The dry layer makes the glass a poor conductor of electricity and causes the high internalresistance (several hundred megohms) typical of glass electrodes.
THEORY AND PRACTICE OF pH MEASUREMENT SECTION 2.0
CELLS FOR MEASURING pH
FIGURE 2-2. Measuring Electrode. The essential element of the glass electrode is apH-sensitive glass membrane. An electrical poten-tial develops at glass-liquid interfaces. The poten-tial at the outside surface depends on the pH of thetest solution. The potential at the inside surface isfixed by the constant pH of the filling solution.Overall, the measuring electrode potential dependssolely on the pH of the test solution.
FIGURE 2-3. Cross-Section through the pH Glass.
For the glass electrode to work, the glass must behydrated. The hydrated layer gradually dissolves and isreplaced by a fresh layer. Thus, the surface of the elec-trode continuously regenerates itself. The rate of dis-solution depends on temperature. At 50°C, the loss isabout ten times greater than at 25°C. Electrodes wearout faster at high temperatures. To maintain the hydrat-ed layer, the glass bulb must be wet at all times.
5
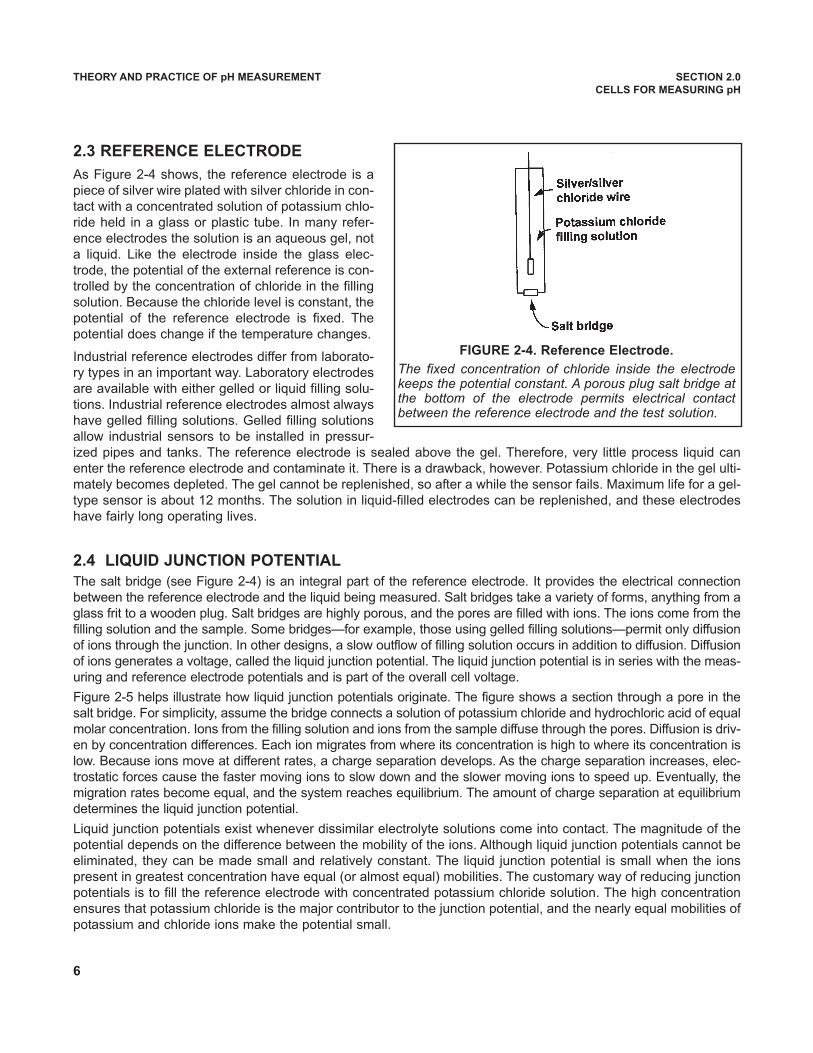
2.3 REFERENCE ELECTRODE
As Figure 2-4 shows, the reference electrode is apiece of silver wire plated with silver chloride in con-tact with a concentrated solution of potassium chlo-ride held in a glass or plastic tube. In many refer-ence electrodes the solution is an aqueous gel, nota liquid. Like the electrode inside the glass elec-trode, the potential of the external reference is con-trolled by the concentration of chloride in the fillingsolution. Because the chloride level is constant, thepotential of the reference electrode is fixed. Thepotential does change if the temperature changes.
Industrial reference electrodes differ from laborato-ry types in an important way. Laboratory electrodesare available with either gelled or liquid filling solu-tions. Industrial reference electrodes almost alwayshave gelled filling solutions. Gelled filling solutionsallow industrial sensors to be installed in pressur-ized pipes and tanks. The reference electrode is sealed above the gel. Therefore, very little process liquid canenter the reference electrode and contaminate it. There is a drawback, however. Potassium chloride in the gel ulti-mately becomes depleted. The gel cannot be replenished, so after a while the sensor fails. Maximum life for a gel-type sensor is about 12 months. The solution in liquid-filled electrodes can be replenished, and these electrodeshave fairly long operating lives.
2.4 LIQUID JUNCTION POTENTIAL
The salt bridge (see Figure 2-4) is an integral part of the reference electrode. It provides the electrical connectionbetween the reference electrode and the liquid being measured. Salt bridges take a variety of forms, anything from aglass frit to a wooden plug. Salt bridges are highly porous, and the pores are filled with ions. The ions come from thefilling solution and the sample. Some bridges—for example, those using gelled filling solutions—permit only diffusionof ions through the junction. In other designs, a slow outflow of filling solution occurs in addition to diffusion. Diffusionof ions generates a voltage, called the liquid junction potential. The liquid junction potential is in series with the meas-uring and reference electrode potentials and is part of the overall cell voltage.
Figure 2-5 helps illustrate how liquid junction potentials originate. The figure shows a section through a pore in thesalt bridge. For simplicity, assume the bridge connects a solution of potassium chloride and hydrochloric acid of equalmolar concentration. Ions from the filling solution and ions from the sample diffuse through the pores. Diffusion is driv-en by concentration differences. Each ion migrates from where its concentration is high to where its concentration islow. Because ions move at different rates, a charge separation develops. As the charge separation increases, elec-trostatic forces cause the faster moving ions to slow down and the slower moving ions to speed up. Eventually, themigration rates become equal, and the system reaches equilibrium. The amount of charge separation at equilibriumdetermines the liquid junction potential.
Liquid junction potentials exist whenever dissimilar electrolyte solutions come into contact. The magnitude of thepotential depends on the difference between the mobility of the ions. Although liquid junction potentials cannot beeliminated, they can be made small and relatively constant. The liquid junction potential is small when the ionspresent in greatest concentration have equal (or almost equal) mobilities. The customary way of reducing junctionpotentials is to fill the reference electrode with concentrated potassium chloride solution. The high concentrationensures that potassium chloride is the major contributor to the junction potential, and the nearly equal mobilities ofpotassium and chloride ions make the potential small.
THEORY AND PRACTICE OF pH MEASUREMENT SECTION 2.0
CELLS FOR MEASURING pH
FIGURE 2-4. Reference Electrode.
The fixed concentration of chloride inside the electrodekeeps the potential constant. A porous plug salt bridge atthe bottom of the electrode permits electrical contactbetween the reference electrode and the test solution.
6
One of the major problems associated with the deter-mination of pH is plugging of the liquid junction. Forthe junction to work properly, ions must be free tomigrate through the junction pores. If the poresbecome blocked, ions cannot diffuse. The electricalresistance of the junction increases. The pH readingsdrift and become noisy. Severe fouling can even com-pletely block the junction, breaking the electrical con-nection between the electrode and the sample, andmaking the electrode unusable. Plugging can comefrom two sources: suspended solids in the sample orsolids resulting from a chemical reaction involving theelectrolyte fill solution. Plugged junctions are difficultto clean.
If the sample contains suspended solids, the refer-ence junction is always in danger of plugging. Thegreater the amount of suspended solids, the greaterthe tendency toward fouling. Generally, the smaller thesurface area of the junction, the more rapidly foulingoccurs. Therefore, one way to combat fouling is to usea junction with a large surface area. Another approachis to make a junction having pores much smaller thanthe smallest particles likely to be present. As Figure2-6 shows, if the junction pores are small, the particles cannot get into the pores and instead accumulate on thesurface. The pores remain open. Ions can diffuse easily and the junction resistance stays low.
Reactions between the process liquid and the filling solution can also produce solids that plug the reference junc-tion. Potassium, chloride, and silver ions from the filling solution are always present in the junction. The origin ofpotassium and chloride is obvious; the source of the silver is discussed later. If the sample contains ions that forminsoluble compounds with the filling solution, a precipitate will form in the junction pores. The precipitate ultimate-ly plugs the junction. Examples of ions that foul the junction are lead, silver, and mercury (II), which form insolublechloride salts, and sulfide, which forms an insoluble silver salt.
THEORY AND PRACTICE OF pH MEASUREMENT SECTION 2.0
CELLS FOR MEASURING pH
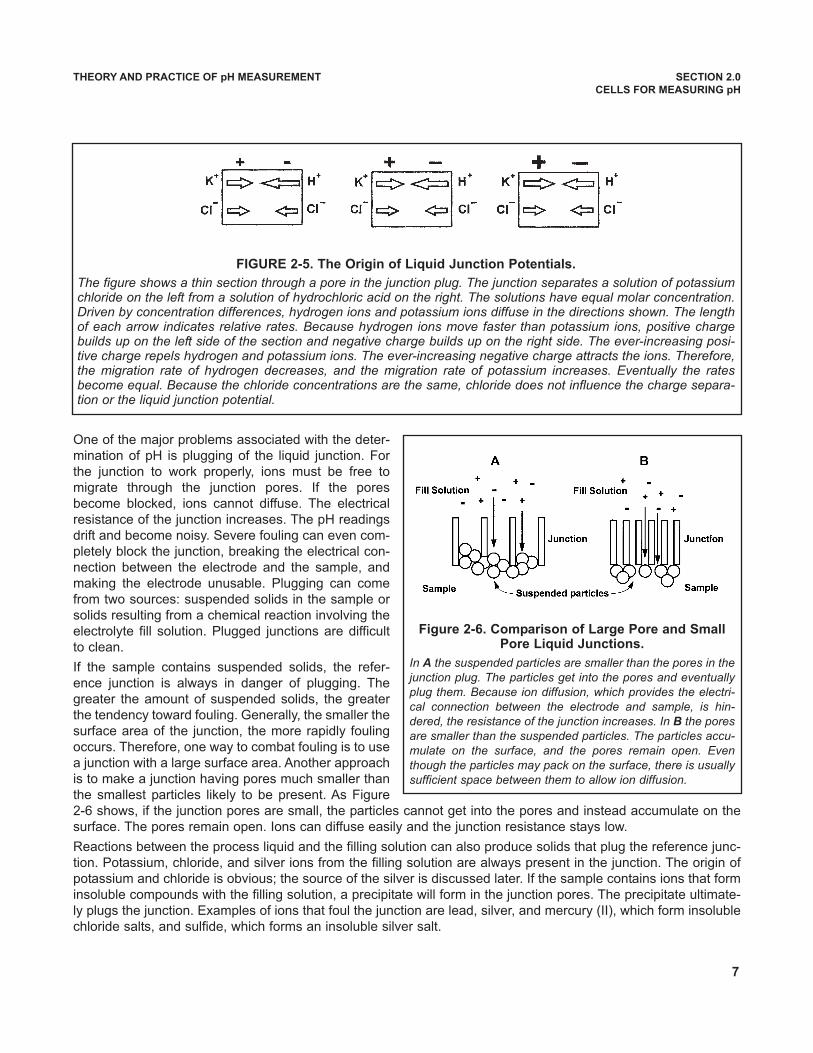
FIGURE 2-5. The Origin of Liquid Junction Potentials.
The figure shows a thin section through a pore in the junction plug. The junction separates a solution of potassiumchloride on the left from a solution of hydrochloric acid on the right. The solutions have equal molar concentration.Driven by concentration differences, hydrogen ions and potassium ions diffuse in the directions shown. The lengthof each arrow indicates relative rates. Because hydrogen ions move faster than potassium ions, positive chargebuilds up on the left side of the section and negative charge builds up on the right side. The ever-increasing posi-tive charge repels hydrogen and potassium ions. The ever-increasing negative charge attracts the ions. Therefore,the migration rate of hydrogen decreases, and the migration rate of potassium increases. Eventually the ratesbecome equal. Because the chloride concentrations are the same, chloride does not influence the charge separa-tion or the liquid junction potential.
Figure 2-6. Comparison of Large Pore and SmallPore Liquid Junctions.
In A the suspended particles are smaller than the pores in thejunction plug. The particles get into the pores and eventuallyplug them. Because ion diffusion, which provides the electri-cal connection between the electrode and sample, is hin-dered, the resistance of the junction increases. In B the poresare smaller than the suspended particles. The particles accu-mulate on the surface, and the pores remain open. Eventhough the particles may pack on the surface, there is usuallysufficient space between them to allow ion diffusion.
7
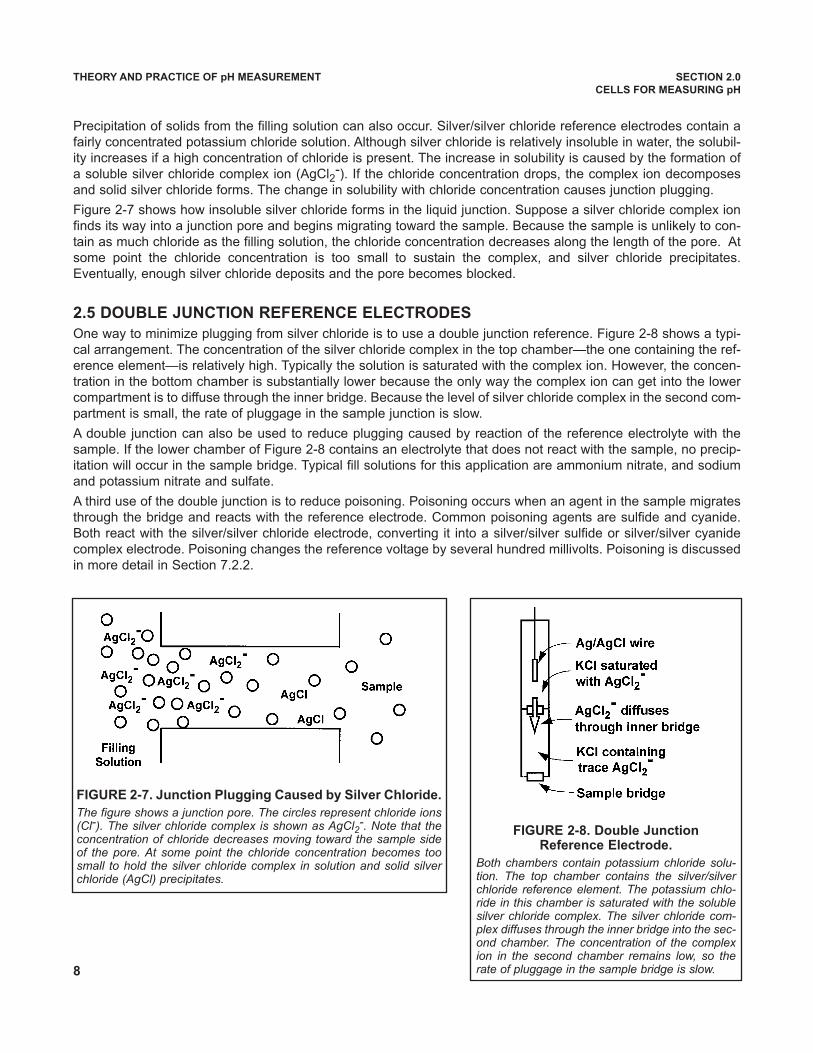
Precipitation of solids from the filling solution can also occur. Silver/silver chloride reference electrodes contain afairly concentrated potassium chloride solution. Although silver chloride is relatively insoluble in water, the solubil-ity increases if a high concentration of chloride is present. The increase in solubility is caused by the formation ofa soluble silver chloride complex ion (AgCl2
-). If the chloride concentration drops, the complex ion decomposesand solid silver chloride forms. The change in solubility with chloride concentration causes junction plugging.
Figure 2-7 shows how insoluble silver chloride forms in the liquid junction. Suppose a silver chloride complex ionfinds its way into a junction pore and begins migrating toward the sample. Because the sample is unlikely to con-tain as much chloride as the filling solution, the chloride concentration decreases along the length of the pore. Atsome point the chloride concentration is too small to sustain the complex, and silver chloride precipitates.Eventually, enough silver chloride deposits and the pore becomes blocked.
2.5 DOUBLE JUNCTION REFERENCE ELECTRODES
One way to minimize plugging from silver chloride is to use a double junction reference. Figure 2-8 shows a typi-cal arrangement. The concentration of the silver chloride complex in the top chamber—the one containing the ref-erence element—is relatively high. Typically the solution is saturated with the complex ion. However, the concen-tration in the bottom chamber is substantially lower because the only way the complex ion can get into the lowercompartment is to diffuse through the inner bridge. Because the level of silver chloride complex in the second com-partment is small, the rate of pluggage in the sample junction is slow.
A double junction can also be used to reduce plugging caused by reaction of the reference electrolyte with thesample. If the lower chamber of Figure 2-8 contains an electrolyte that does not react with the sample, no precip-itation will occur in the sample bridge. Typical fill solutions for this application are ammonium nitrate, and sodiumand potassium nitrate and sulfate.
A third use of the double junction is to reduce poisoning. Poisoning occurs when an agent in the sample migratesthrough the bridge and reacts with the reference electrode. Common poisoning agents are sulfide and cyanide.Both react with the silver/silver chloride electrode, converting it into a silver/silver sulfide or silver/silver cyanidecomplex electrode. Poisoning changes the reference voltage by several hundred millivolts. Poisoning is discussedin more detail in Section 7.2.2.
THEORY AND PRACTICE OF pH MEASUREMENT SECTION 2.0
CELLS FOR MEASURING pH
FIGURE 2-7. Junction Plugging Caused by Silver Chloride.
The figure shows a junction pore. The circles represent chloride ions(Cl-). The silver chloride complex is shown as AgCl2-. Note that theconcentration of chloride decreases moving toward the sample sideof the pore. At some point the chloride concentration becomes toosmall to hold the silver chloride complex in solution and solid silverchloride (AgCl) precipitates.
FIGURE 2-8. Double JunctionReference Electrode.
Both chambers contain potassium chloride solu-tion. The top chamber contains the silver/silverchloride reference element. The potassium chlo-ride in this chamber is saturated with the solublesilver chloride complex. The silver chloride com-plex diffuses through the inner bridge into the sec-ond chamber. The concentration of the complexion in the second chamber remains low, so therate of pluggage in the sample bridge is slow.8
3.1 CONVERTING VOLTAGE TO pH
Equation 1 summarizes the relationship between measured cell voltage (in mV), pH, and temperature (in Kelvin):
E(T) = E°(T) - 0.1984 T pH (1)
The cell voltage, E(T)—the notation emphasizes the dependence of cell voltage on temperature—is the sum of fiveelectrical potentials. Four are independent of the pH of the test solution and are combined in the first term, E°(T).E°(T) is the sum of the following:
1. the potential of the reference electrode inside the glass electrode
2. the potential at the inside surface of the glass membrane
3. the potential of the external reference electrode
4. the liquid junction potential.
The second term, -0.1984TpH, is the potential (in mV) at the outside surface of the pH glass. This potentialdepends on temperature and on the pH of the sample. Assuming temperature remains constant, any change incell voltage is caused solely by a change in the pH of the sample. Therefore, the cell voltage is a measure of thesample pH.
Note that a graph of equation 1, E(T) plotted against pH, is a straight line having a y-intercept of E°(T) and a slopeof -0.1984T.
3.2 GLASS ELECTRODE SLOPE
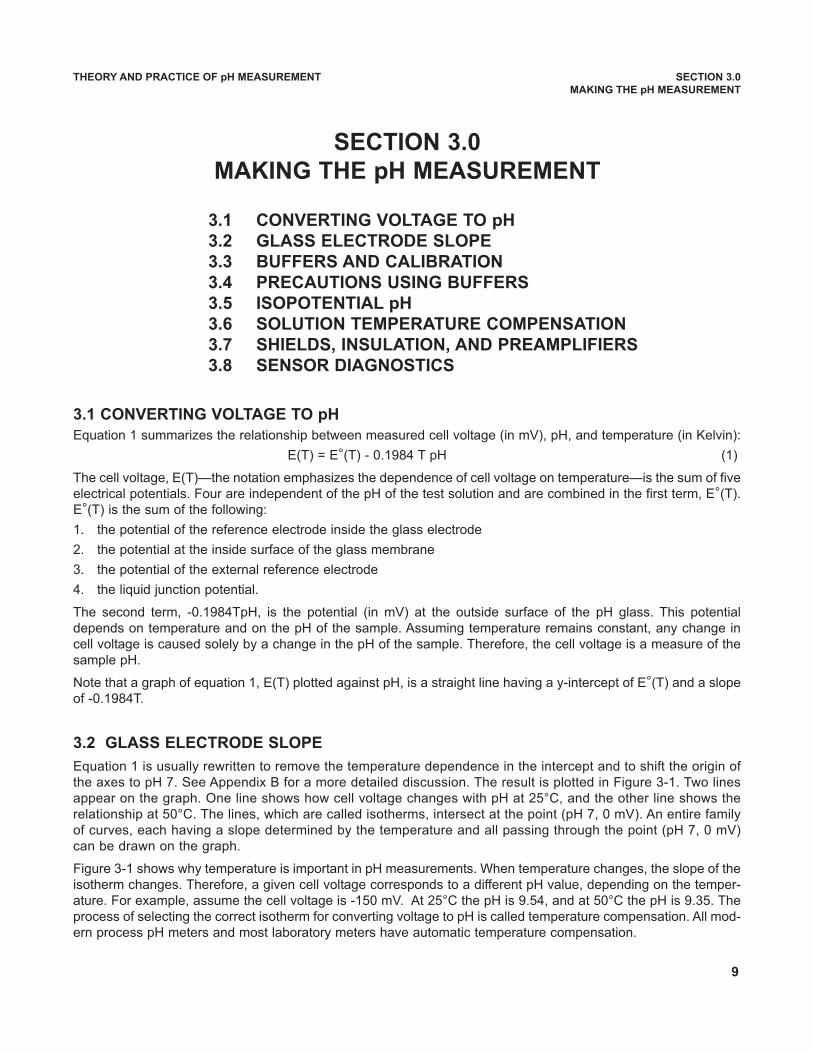
Equation 1 is usually rewritten to remove the temperature dependence in the intercept and to shift the origin ofthe axes to pH 7. See Appendix B for a more detailed discussion. The result is plotted in Figure 3-1. Two linesappear on the graph. One line shows how cell voltage changes with pH at 25°C, and the other line shows therelationship at 50°C. The lines, which are called isotherms, intersect at the point (pH 7, 0 mV). An entire familyof curves, each having a slope determined by the temperature and all passing through the point (pH 7, 0 mV)can be drawn on the graph.
Figure 3-1 shows why temperature is important in pH measurements. When temperature changes, the slope of theisotherm changes. Therefore, a given cell voltage corresponds to a different pH value, depending on the temper-ature. For example, assume the cell voltage is -150 mV. At 25°C the pH is 9.54, and at 50°C the pH is 9.35. Theprocess of selecting the correct isotherm for converting voltage to pH is called temperature compensation. All mod-ern process pH meters and most laboratory meters have automatic temperature compensation.
THEORY AND PRACTICE OF pH MEASUREMENT SECTION 3.0
MAKING THE pH MEASUREMENT
SECTION 3.0
MAKING THE pH MEASUREMENT
3.1 CONVERTING VOLTAGE TO pH
3.2 GLASS ELECTRODE SLOPE
3.3 BUFFERS AND CALIBRATION
3.4 PRECAUTIONS USING BUFFERS
3.5 ISOPOTENTIAL pH
3.6 SOLUTION TEMPERATURE COMPENSATION
3.7 SHIELDS, INSULATION, AND PREAMPLIFIERS
3.8 SENSOR DIAGNOSTICS
9
The slope of the isotherm is often called the glass electrode or sensor slope. The slope can be calculated from theequation: slope = -0.1984 (T), or converting from Kelvin to Celsius, as slope = -0.1984 (t + 273.15), where t is tem-perature in °C. The slope has units of mV per unit change in pH. The table lists slopes for different temperatures.
Temp (°C) Slope (mV/unit pH)
15 -57.2
20 -58.2
25 -59.2
30 -60.1
35 -61.1
The negative slope means that as pH increases, thevoltage reading decreases.
As the graph in Figure 3-1 suggests, the closer thepH is to 7, the less important is temperature com-pensation. For example, if the pH is 8 and the tem-perature is 30°C, a 10°C error in temperature intro-duces a pH error of ±0.03. At pH 10, the error in themeasured pH is ±0.10.
3.3 BUFFERS AND CALIBRATION
Figure 3-1 shows the performance of an ideal cell: one in which the voltage is zero when the pH is 7, and theslope is -0.1984T over the entire pH range. In a real cell the voltage at pH 7 is rarely zero, but it is usually between-30 mV and +30 mV. The slope is also seldom -0.1984T over the entire range of pH. However, over a range oftwo or three pH units, the slope is usually close to ideal.
Because pH cells are not ideal, they must be calibrated before use. pH cells are calibrated with solutions havingexactly known pH, called buffers. Assigning a pH value to a calibration buffer is not a simple process. The labo-ratory work is demanding, and extensive theoretical work is needed to support certain assumptions that must bemade. The need for assumptions when defining pH values can be traced to the fact that pH depends on hydrogenion activity, not concentration. Activity is related to concentration and is a way of accounting for the differencebetween observed and predicted behavior in chemical systems. When physical or chemical measurements aremade on real solutions, the results are usually different from the values predicted from the behavior of ideal solu-tions. The ratio of the true value to the ideal value at a given concentration is called the activity coefficient. Theproduct of the activity coefficient and the concentration is the activity. For reasons well beyond the scope of thisdiscussion, activity coefficients for single ions, for example, the hydrogen ion, cannot be measured. They can becalculated, but the calculation involves making certain assumptions—these are the assumptions that must bemade when assigning pH values to buffers.
Normally, establishing pH scales is a task best left to national standards laboratories. pH scales developed by theUnited States National Institute of Standards and Technology (NIST), the British Standards Institute (BSI), theJapan Standards Institute (JSI), and the German Deutsche Institute für Normung (DIN) are in common use.Although there are some minor differences, for practical purposes the scales are identical. Commercial buffers areusually traceable to a recognized standard scale. Generally, commercial buffers are less accurate than standardbuffers. Typical accuracy for commercial buffers is ±0.01 pH units. Commercial buffers, sometimes called techni-cal buffers, do have greater buffer capacity. They are less susceptible to accidental contamination and dilution thanstandard buffers.
THEORY AND PRACTICE OF pH MEASUREMENT SECTION 3.0
MAKING THE pH MEASUREMENT
FIGURE 3-1. Glass Electrode Slope.
The voltage of a pH measurement cell depends on pH andtemperature. The further from pH 7, the greater the influ-ence of temperature on the relationship between pH andcell voltage.
10
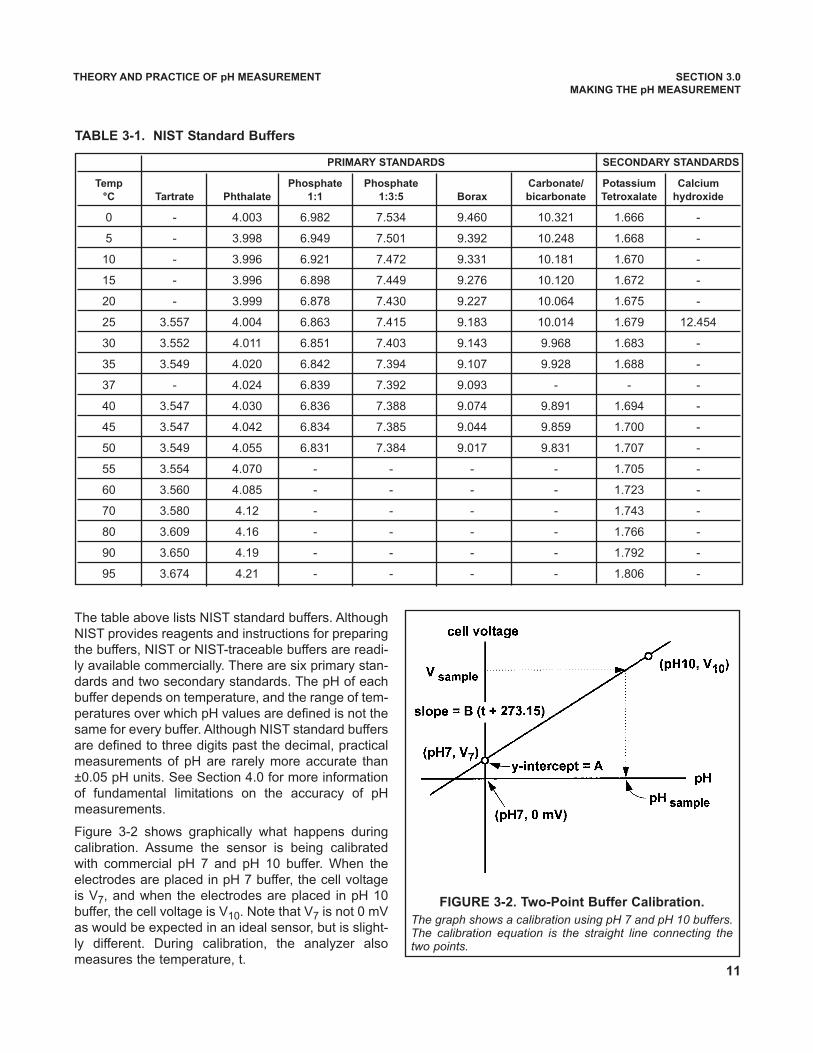
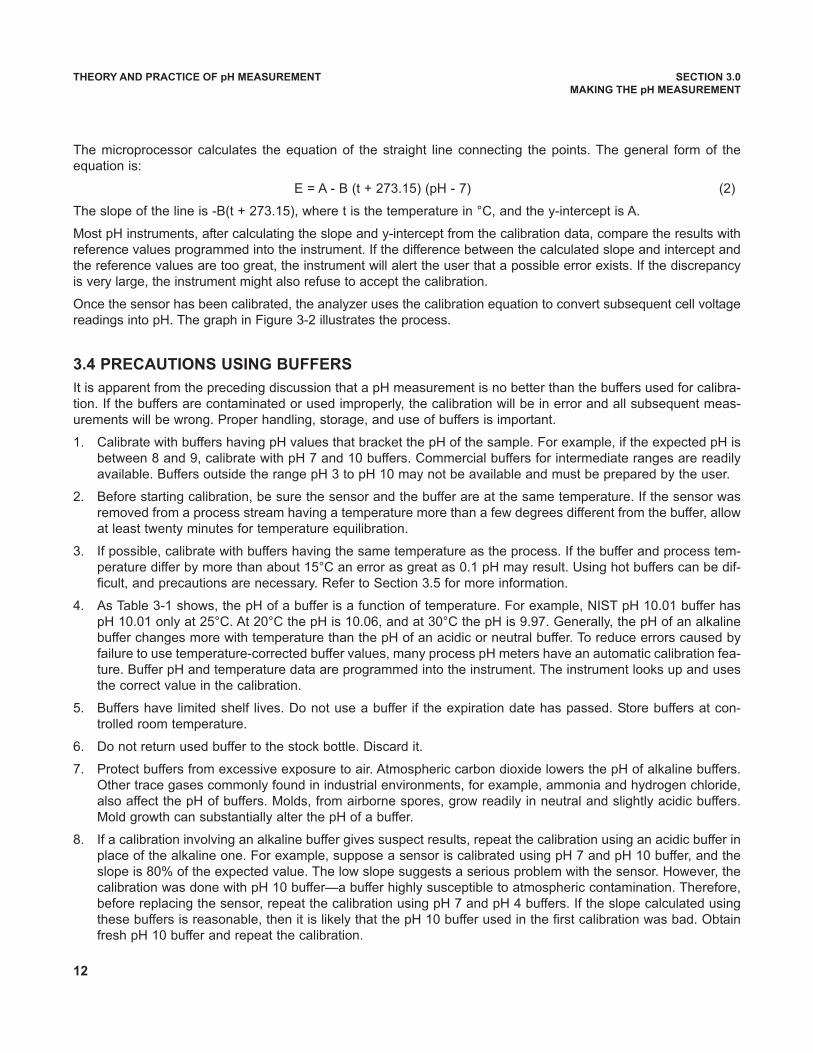
The table above lists NIST standard buffers. AlthoughNIST provides reagents and instructions for preparingthe buffers, NIST or NIST-traceable buffers are readi-ly available commercially. There are six primary stan-dards and two secondary standards. The pH of eachbuffer depends on temperature, and the range of tem-peratures over which pH values are defined is not thesame for every buffer. Although NIST standard buffersare defined to three digits past the decimal, practicalmeasurements of pH are rarely more accurate than±0.05 pH units. See Section 4.0 for more informationof fundamental limitations on the accuracy of pHmeasurements.
Figure 3-2 shows graphically what happens duringcalibration. Assume the sensor is being calibratedwith commercial pH 7 and pH 10 buffer. When theelectrodes are placed in pH 7 buffer, the cell voltageis V7, and when the electrodes are placed in pH 10buffer, the cell voltage is V10. Note that V7 is not 0 mVas would be expected in an ideal sensor, but is slight-ly different. During calibration, the analyzer alsomeasures the temperature, t.
THEORY AND PRACTICE OF pH MEASUREMENT SECTION 3.0
MAKING THE pH MEASUREMENT
FIGURE 3-2. Two-Point Buffer Calibration.
The graph shows a calibration using pH 7 and pH 10 buffers.The calibration equation is the straight line connecting thetwo points.
PRIMARY STANDARDS SECONDARY STANDARDS
Temp Phosphate Phosphate Carbonate/ Potassium Calcium
°C Tartrate Phthalate 1:1 1:3:5 Borax bicarbonate Tetroxalate hydroxide
0 - 4.003 6.982 7.534 9.460 10.321 1.666 -
5 - 3.998 6.949 7.501 9.392 10.248 1.668 -
10 - 3.996 6.921 7.472 9.331 10.181 1.670 -
15 - 3.996 6.898 7.449 9.276 10.120 1.672 -
20 - 3.999 6.878 7.430 9.227 10.064 1.675 -
25 3.557 4.004 6.863 7.415 9.183 10.014 1.679 12.454
30 3.552 4.011 6.851 7.403 9.143 9.968 1.683 -
35 3.549 4.020 6.842 7.394 9.107 9.928 1.688 -
37 - 4.024 6.839 7.392 9.093 - - -
40 3.547 4.030 6.836 7.388 9.074 9.891 1.694 -
45 3.547 4.042 6.834 7.385 9.044 9.859 1.700 -
50 3.549 4.055 6.831 7.384 9.017 9.831 1.707 -
55 3.554 4.070 - - - - 1.705 -
60 3.560 4.085 - - - - 1.723 -
70 3.580 4.12 - - - - 1.743 -
80 3.609 4.16 - - - - 1.766 -
90 3.650 4.19 - - - - 1.792 -
95 3.674 4.21 - - - - 1.806 -
TABLE 3-1. NIST Standard Buffers
11
The microprocessor calculates the equation of the straight line connecting the points. The general form of theequation is:
E = A - B (t + 273.15) (pH - 7) (2)
The slope of the line is -B(t + 273.15), where t is the temperature in °C, and the y-intercept is A.
Most pH instruments, after calculating the slope and y-intercept from the calibration data, compare the results withreference values programmed into the instrument. If the difference between the calculated slope and intercept andthe reference values are too great, the instrument will alert the user that a possible error exists. If the discrepancyis very large, the instrument might also refuse to accept the calibration.
Once the sensor has been calibrated, the analyzer uses the calibration equation to convert subsequent cell voltagereadings into pH. The graph in Figure 3-2 illustrates the process.
3.4 PRECAUTIONS USING BUFFERS
It is apparent from the preceding discussion that a pH measurement is no better than the buffers used for calibra-tion. If the buffers are contaminated or used improperly, the calibration will be in error and all subsequent meas-urements will be wrong. Proper handling, storage, and use of buffers is important.
1. Calibrate with buffers having pH values that bracket the pH of the sample. For example, if the expected pH isbetween 8 and 9, calibrate with pH 7 and 10 buffers. Commercial buffers for intermediate ranges are readilyavailable. Buffers outside the range pH 3 to pH 10 may not be available and must be prepared by the user.
2. Before starting calibration, be sure the sensor and the buffer are at the same temperature. If the sensor wasremoved from a process stream having a temperature more than a few degrees different from the buffer, allowat least twenty minutes for temperature equilibration.
3. If possible, calibrate with buffers having the same temperature as the process. If the buffer and process tem-perature differ by more than about 15°C an error as great as 0.1 pH may result. Using hot buffers can be dif-ficult, and precautions are necessary. Refer to Section 3.5 for more information.
4. As Table 3-1 shows, the pH of a buffer is a function of temperature. For example, NIST pH 10.01 buffer haspH 10.01 only at 25°C. At 20°C the pH is 10.06, and at 30°C the pH is 9.97. Generally, the pH of an alkalinebuffer changes more with temperature than the pH of an acidic or neutral buffer. To reduce errors caused byfailure to use temperature-corrected buffer values, many process pH meters have an automatic calibration fea-ture. Buffer pH and temperature data are programmed into the instrument. The instrument looks up and usesthe correct value in the calibration.
5. Buffers have limited shelf lives. Do not use a buffer if the expiration date has passed. Store buffers at con-trolled room temperature.
6. Do not return used buffer to the stock bottle. Discard it.
7. Protect buffers from excessive exposure to air. Atmospheric carbon dioxide lowers the pH of alkaline buffers.Other trace gases commonly found in industrial environments, for example, ammonia and hydrogen chloride,also affect the pH of buffers. Molds, from airborne spores, grow readily in neutral and slightly acidic buffers.Mold growth can substantially alter the pH of a buffer.
8. If a calibration involving an alkaline buffer gives suspect results, repeat the calibration using an acidic buffer inplace of the alkaline one. For example, suppose a sensor is calibrated using pH 7 and pH 10 buffer, and theslope is 80% of the expected value. The low slope suggests a serious problem with the sensor. However, thecalibration was done with pH 10 buffer—a buffer highly susceptible to atmospheric contamination. Therefore,before replacing the sensor, repeat the calibration using pH 7 and pH 4 buffers. If the slope calculated usingthese buffers is reasonable, then it is likely that the pH 10 buffer used in the first calibration was bad. Obtainfresh pH 10 buffer and repeat the calibration.
THEORY AND PRACTICE OF pH MEASUREMENT SECTION 3.0
MAKING THE pH MEASUREMENT
12

9. Rinse the sensor with deionized water before placing it in the buffer. Remove excess water from the sensorby gently daubing it with a clean tissue. Do not wipe the sensor. Wiping may generate a static charge, lead-ing to noisy readings. The static charge may take hours to dissipate. The few drops of deionized water carriedwith the sensor into the buffer will not appreciably alter the pH.
3.5 ISOPOTENTIAL pH
Frequently, the calibration temperature and the process tem-perature are different. Therefore, the calibration slope, whichdepends on temperature, is not appropriate for the sample.Figure 3-3 shows what the microprocessor does when bufferand sample temperatures are different. Assume the sensorwas calibrated at temperature t1 and the process temperatureis t2. To measure the pH of the process, the microprocessorrotates the calibration line about the point (pH 7, A) until theslope equals B(t2 + 273.15). The microprocessor then uses thenew isotherm to convert voltage to pH. The point (pH 7, A) iscalled the isopotential pH. As Figure 3-3 shows, the isopoten-tial pH is the pH at which the cell voltage does not changewhen the temperature changes. All modern pH meters assumethe cell isopotential pH is 7.00. Some pH meters permit theuser to change the isopotential setting. Generally, the isopo-tential pH should not be changed unless the sensor manufac-turer specifically states what the isopotential pH should be.
The microprocessor makes assumptions when the measure-ment and calibration temperatures are different. It assumes theactual pH cell isotherms rotate about the point (pH 7, A). Theassumption may not be correct, causing the measurement tobe in error. The size of the error depends on two things: the dif-ference between pH 7 and the cell isopotential pH and the dif-ference between the calibration and measurement tempera-tures. For a 10°C temperature difference and a difference in isopotential pH of 2, the error is about ±0.07 pH units.The factors that cause the isopotential pH of a real cell to differ from 7 are beyond the scope of this discussion andto a great extent are out of the control of the user as well. See Appendix B for a more detailed discussion of isopo-tential pH.
Most pH cells do not have an isopotential pH point. Instead, the cell isopotential pH changes with temperature, andthe cell isotherms rotate about a general area. Most process pH sensors have an isopotential area centered rea-sonably close to pH 7.0.
One way to reduce the error caused by disagreement between the sensor and meter isopotential pH is to calibratethe sensor at the same temperature as the process. However, great care must be exercised when the buffer tem-perature is significantly greater than ambient temperature. First, the buffer solution must be protected from evap-oration. Evaporation changes the concentration of the buffer and its pH. Above 50°C, a reflux condenser may benecessary. Second, the pH of buffers is defined over a limited temperature range. For example, if the buffer pH isdefined only to 60°C, the buffer cannot be used for calibration at 70°C. Finally, no matter what the temperature, itis important that the entire measurement cell, sensor and solution, be at constant temperature. This requirementis critical because lack of temperature uniformity in the cell is one reason the cell isopotential point changes whenthe temperature changes.
THEORY AND PRACTICE OF pH MEASUREMENT SECTION 3.0
MAKING THE pH MEASUREMENT
13
FIGURE 3-3. Isopotential pH.
The graph shows two calibration lines. The originalcalibration was done with pH 4 and pH 10 buffers attemperature t1. Suppose the temperature changesto t2 . The pH analyzer automatically changes theslope by the ratio (t2 + 273.15)/(t1 + 273.115). Thecalibration equations rotate about the point (pH 7, A).
3.6 SOLUTION TEMPERATURE COMPENSATION
The pH of a solution, particularly an alkaline one, is a function of temperature. If the temperature changes, so doesthe pH, even though the concentration of the acid or base causing the pH remains constant. Solution temperaturecompensation is a way of converting the pH at the measurement temperature to the pH at a reference tempera-ture. The reference temperature is almost always 25°C. Solution temperature compensation is not the sameas temperature compensation. Temperature compensation is the automatic calculation of pH from the measuredcell voltage and temperature. Solution temperature compensation is the calculation of pH at a reference tempera-ture from the measured pH.
The change in pH with temperature is called the solution temperature coefficient. It has units of ΔpH/°C. For exam-ple, ammonia solutions having concentration between 0.1 and 20 ppm have a temperature coefficient of -0.032 pHunits/°C. The pH decreases 0.032 units for every °C increase in temperature. Therefore, if the pH at 30°C is 9.32,the pH at 25°C is 9.32 + (25 - 30)(-0.032) or 9.48. The size of the temperature coefficient depends on the identityof the acid or base and its concentration. Usually the temperature coefficient must be determined empirically. Mostindustrial pH analyzers have a solution temperature compensation feature.
3.7 SHIELDS, INSULATION, AND PREAMPLIFIERS
pH measurement systems, cell and meter, have high impedance. The high impedance circuit imposes importantrestrictions on how the systems are designed.
The pH glass membrane causes the internal resistance of the pH cell to be several hundred MΩ. For the pH meterto make an accurate voltage measurement, its input impedance must be substantially greater than the cell resist-ance. Typical pH meters have an input impedance of about 1,000,000 MΩ. The high input impedance of the meterrequires that the insulation between the glass and reference electrode terminals be of high quality. If the insulationis inadequate, the signal may bypass the meter input impedance. The resulting pH measurement will be serious-ly in error.
Because the lead wire from the glass electrode connects two high resistances, electrostatic charges, which accu-mulate on the wire from environmental influences, cannot readily drain away. Buildup of charge results in degrad-ed, noisy readings. Shielding the wire with metal braid connected to ground at the instrument is one way to improvethe signal. It is also helpful to keep the sensor cable as far away as possible from AC power cables. To providefurther protection from environmental interference, the entire sensor cable can be enclosed in conduit.
To avoid the need for expensive cable and cable installations, a preamplifier built into the sensor or installed in ajunction box near the sensor can be used. The preamplifier converts the high impedance signal into a low imped-ance one that can be sent as far as 2000 feet without special cable.
3.8 SENSOR DIAGNOSTICS
Sensor diagnostics alert the user to problems with the sensor or to actual sensor failures. The two sensor diag-nostics are reference impedance and glass impedance.
The major contributor to reference impedance is the resistance across the liquid junction plug. In a properly func-tioning electrode, the resistance of the liquid junction should be less than about 40 kΩ. If the junction is pluggedor if the filling solution or gel is depleted, the resistance increases. A high reference impedance may also mean thesensor is not immersed in the process stream.
Glass impedance refers to the impedance of the pH-sensitive glass membrane. The impedance of the glass mem-brane is a strong function of temperature. As temperature increases, the impedance decreases. For a change inglass impedance to have any meaning, the impedance measurement must be corrected to a reference tempera-ture. The impedance of a typical glass electrode at 25°C is about 100 MΩ. A sharp decrease in the temperature-corrected impedance implies that the glass is cracked. A cracked glass electrode produces erroneous pH read-ings. The electrode should be replaced immediately. A high (temperature-corrected) glass impedance implies thesensor is nearing the end of its life and should be replaced as soon as possible.
THEORY AND PRACTICE OF pH MEASUREMENT SECTION 3.0
MAKING THE pH MEASUREMENT
14
4.1 JUNCTION POTENTIAL MISMATCH
All process and most laboratory pH sensors have a liquid junction. The presence of the liquid junction and the needto calibrate pH sensors with buffers causes a fundamental error in the measurement.
When the glass and reference electrodes are placed in a buffer, a liquid junction potential, Elj, develops at theinterface between the buffer and the salt bridge. The liquid junction potential is part of the overall cell voltage andis included in A in equation 2. Equation 2 on page 12 can be modified to show Elj, as a separate term:
E = A’ + Elj - B (t + 273.15) (pH - 7) (3)
or
E = E’ (pH, t) + Elj (4)
where E’ (pH, t) = A’ - B (t + 273.15) (pH - 7).
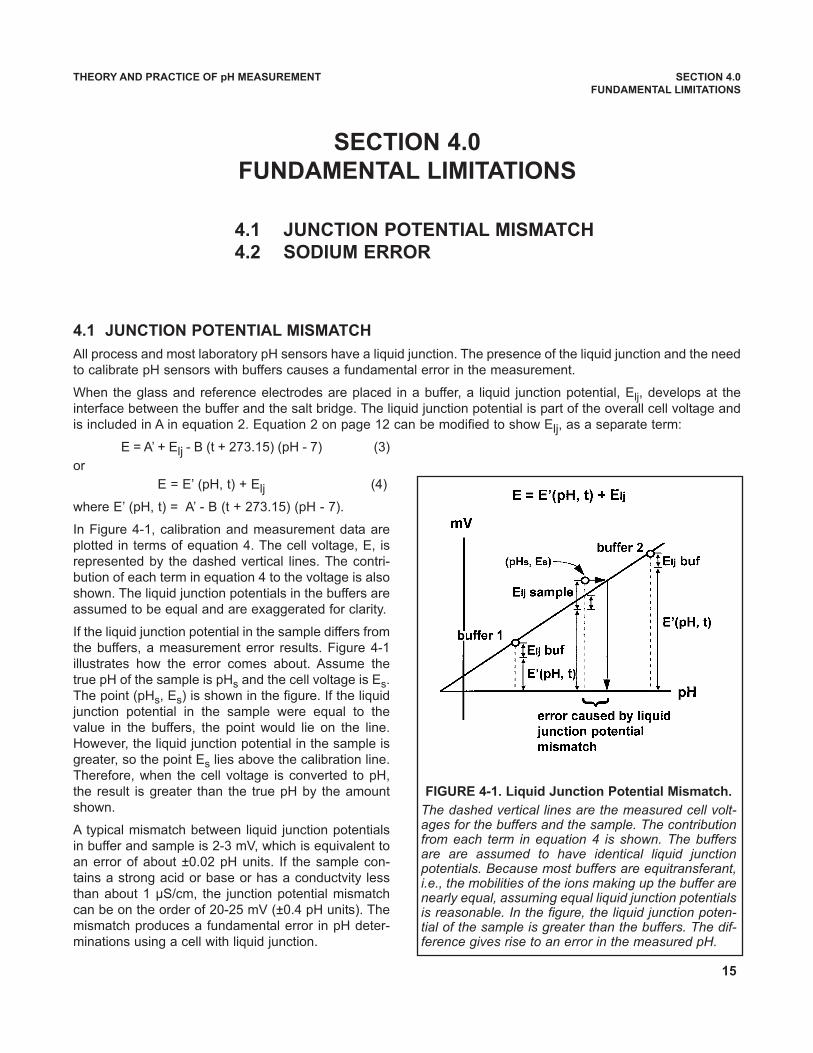
In Figure 4-1, calibration and measurement data areplotted in terms of equation 4. The cell voltage, E, isrepresented by the dashed vertical lines. The contri-bution of each term in equation 4 to the voltage is alsoshown. The liquid junction potentials in the buffers areassumed to be equal and are exaggerated for clarity.
If the liquid junction potential in the sample differs fromthe buffers, a measurement error results. Figure 4-1illustrates how the error comes about. Assume thetrue pH of the sample is pHs and the cell voltage is Es.The point (pHs, Es) is shown in the figure. If the liquidjunction potential in the sample were equal to thevalue in the buffers, the point would lie on the line.However, the liquid junction potential in the sample isgreater, so the point Es lies above the calibration line.Therefore, when the cell voltage is converted to pH,the result is greater than the true pH by the amountshown.
A typical mismatch between liquid junction potentialsin buffer and sample is 2-3 mV, which is equivalent toan error of about ±0.02 pH units. If the sample con-tains a strong acid or base or has a conductvity lessthan about 1 µS/cm, the junction potential mismatchcan be on the order of 20-25 mV (±0.4 pH units). Themismatch produces a fundamental error in pH deter-minations using a cell with liquid junction.
THEORY AND PRACTICE OF pH MEASUREMENT SECTION 4.0
FUNDAMENTAL LIMITATIONS
SECTION 4.0
FUNDAMENTAL LIMITATIONS
4.1 JUNCTION POTENTIAL MISMATCH
4.2 SODIUM ERROR
FIGURE 4-1. Liquid Junction Potential Mismatch.
The dashed vertical lines are the measured cell volt-ages for the buffers and the sample. The contributionfrom each term in equation 4 is shown. The buffersare are assumed to have identical liquid junctionpotentials. Because most buffers are equitransferant,i.e., the mobilities of the ions making up the buffer arenearly equal, assuming equal liquid junction potentialsis reasonable. In the figure, the liquid junction poten-tial of the sample is greater than the buffers. The dif-ference gives rise to an error in the measured pH.
15
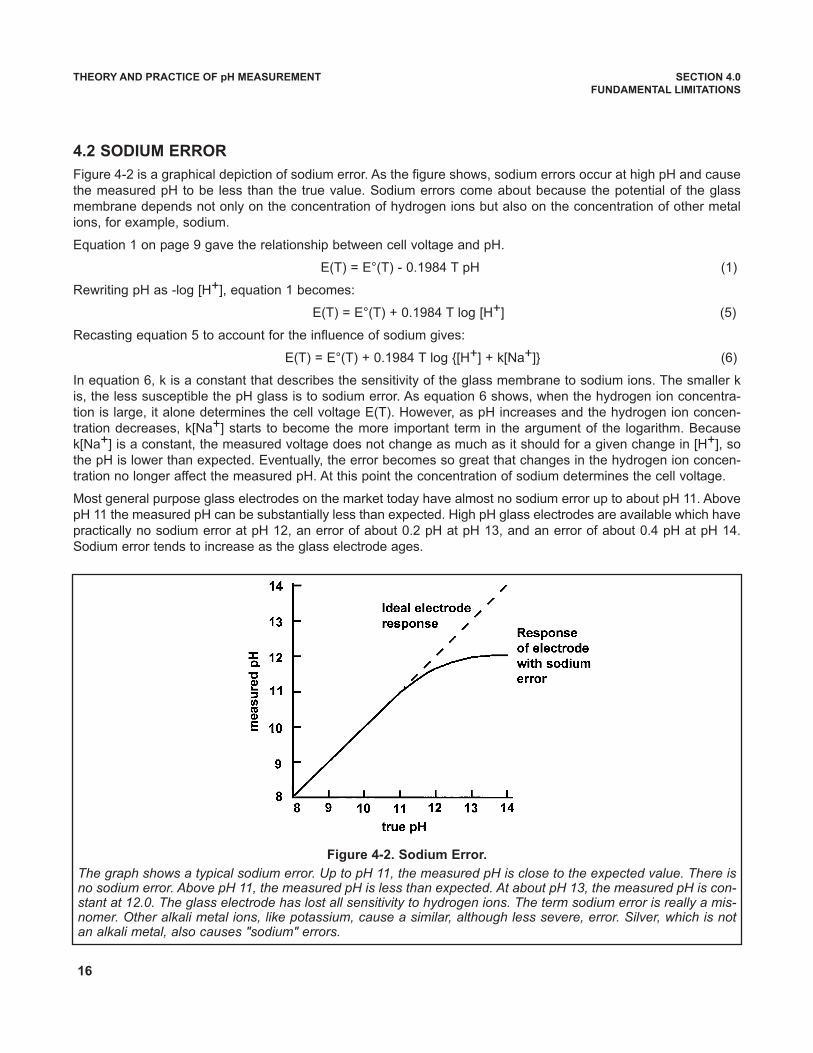
4.2 SODIUM ERROR
Figure 4-2 is a graphical depiction of sodium error. As the figure shows, sodium errors occur at high pH and causethe measured pH to be less than the true value. Sodium errors come about because the potential of the glassmembrane depends not only on the concentration of hydrogen ions but also on the concentration of other metalions, for example, sodium.
Equation 1 on page 9 gave the relationship between cell voltage and pH.
E(T) = E°(T) - 0.1984 T pH (1)
Rewriting pH as -log [H+], equation 1 becomes:
E(T) = E°(T) + 0.1984 T log [H+] (5)
Recasting equation 5 to account for the influence of sodium gives:
E(T) = E°(T) + 0.1984 T log {[H+] + k[Na+]} (6)
In equation 6, k is a constant that describes the sensitivity of the glass membrane to sodium ions. The smaller kis, the less susceptible the pH glass is to sodium error. As equation 6 shows, when the hydrogen ion concentra-tion is large, it alone determines the cell voltage E(T). However, as pH increases and the hydrogen ion concen-tration decreases, k[Na+] starts to become the more important term in the argument of the logarithm. Becausek[Na+] is a constant, the measured voltage does not change as much as it should for a given change in [H+], sothe pH is lower than expected. Eventually, the error becomes so great that changes in the hydrogen ion concen-tration no longer affect the measured pH. At this point the concentration of sodium determines the cell voltage.
Most general purpose glass electrodes on the market today have almost no sodium error up to about pH 11. AbovepH 11 the measured pH can be substantially less than expected. High pH glass electrodes are available which havepractically no sodium error at pH 12, an error of about 0.2 pH at pH 13, and an error of about 0.4 pH at pH 14.Sodium error tends to increase as the glass electrode ages.
THEORY AND PRACTICE OF pH MEASUREMENT SECTION 4.0
FUNDAMENTAL LIMITATIONS
16
Figure 4-2. Sodium Error.
The graph shows a typical sodium error. Up to pH 11, the measured pH is close to the expected value. There isno sodium error. Above pH 11, the measured pH is less than expected. At about pH 13, the measured pH is con-stant at 12.0. The glass electrode has lost all sensitivity to hydrogen ions. The term sodium error is really a mis-nomer. Other alkali metal ions, like potassium, cause a similar, although less severe, error. Silver, which is notan alkali metal, also causes "sodium" errors.
THEORY AND PRACTICE OF pH MEASUREMENT SECTION 5.0
ORP MEASUREMENTS
5.1 INTRODUCTION
5.2 MEASURING ELECTRODE
5.3 INTERPRETING ORP MEASUREMENTS
5.4 CALIBRATION
SECTION 5.0
ORP MEASUREMENTS
5.1 INTRODUCTION
ORP is oxidation-reduction potential. ORP depends on the ratio of the concentrations of oxidized and reduced sub-stances in the sample. In a typical system, the measuring electrode is an inert metal such as gold or platinum, andthe reference electrode is the usual silver/silver chloride electrode.
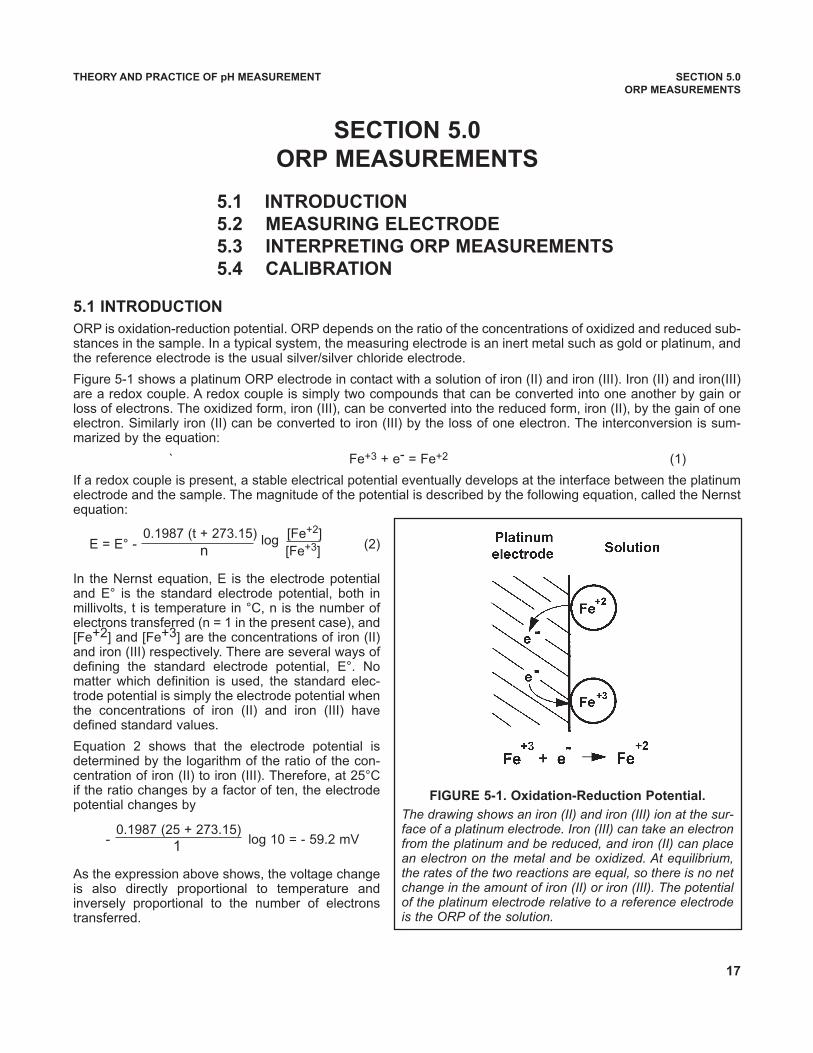
Figure 5-1 shows a platinum ORP electrode in contact with a solution of iron (II) and iron (III). Iron (II) and iron(III)are a redox couple. A redox couple is simply two compounds that can be converted into one another by gain orloss of electrons. The oxidized form, iron (III), can be converted into the reduced form, iron (II), by the gain of oneelectron. Similarly iron (II) can be converted to iron (III) by the loss of one electron. The interconversion is sum-marized by the equation:
` Fe+3 + e- = Fe+2 (1)
If a redox couple is present, a stable electrical potential eventually develops at the interface between the platinumelectrode and the sample. The magnitude of the potential is described by the following equation, called the Nernstequation:
E = E° - (2)
In the Nernst equation, E is the electrode potentialand E° is the standard electrode potential, both inmillivolts, t is temperature in °C, n is the number ofelectrons transferred (n = 1 in the present case), and[Fe+2] and [Fe+3] are the concentrations of iron (II)and iron (III) respectively. There are several ways ofdefining the standard electrode potential, E°. Nomatter which definition is used, the standard elec-trode potential is simply the electrode potential whenthe concentrations of iron (II) and iron (III) havedefined standard values.
Equation 2 shows that the electrode potential isdetermined by the logarithm of the ratio of the con-centration of iron (II) to iron (III). Therefore, at 25°Cif the ratio changes by a factor of ten, the electrodepotential changes by
- log 10 = - 59.2 mV
As the expression above shows, the voltage changeis also directly proportional to temperature andinversely proportional to the number of electronstransferred.
0.1987 (t + 273.15) log [Fe+2]
n [Fe+3]
0.1987 (25 + 273.15)1
FIGURE 5-1. Oxidation-Reduction Potential.
The drawing shows an iron (II) and iron (III) ion at the sur-face of a platinum electrode. Iron (III) can take an electronfrom the platinum and be reduced, and iron (II) can placean electron on the metal and be oxidized. At equilibrium,the rates of the two reactions are equal, so there is no netchange in the amount of iron (II) or iron (III). The potentialof the platinum electrode relative to a reference electrodeis the ORP of the solution.
17
THEORY AND PRACTICE OF pH MEASUREMENT SECTION 5.0
ORP MEASUREMENTS
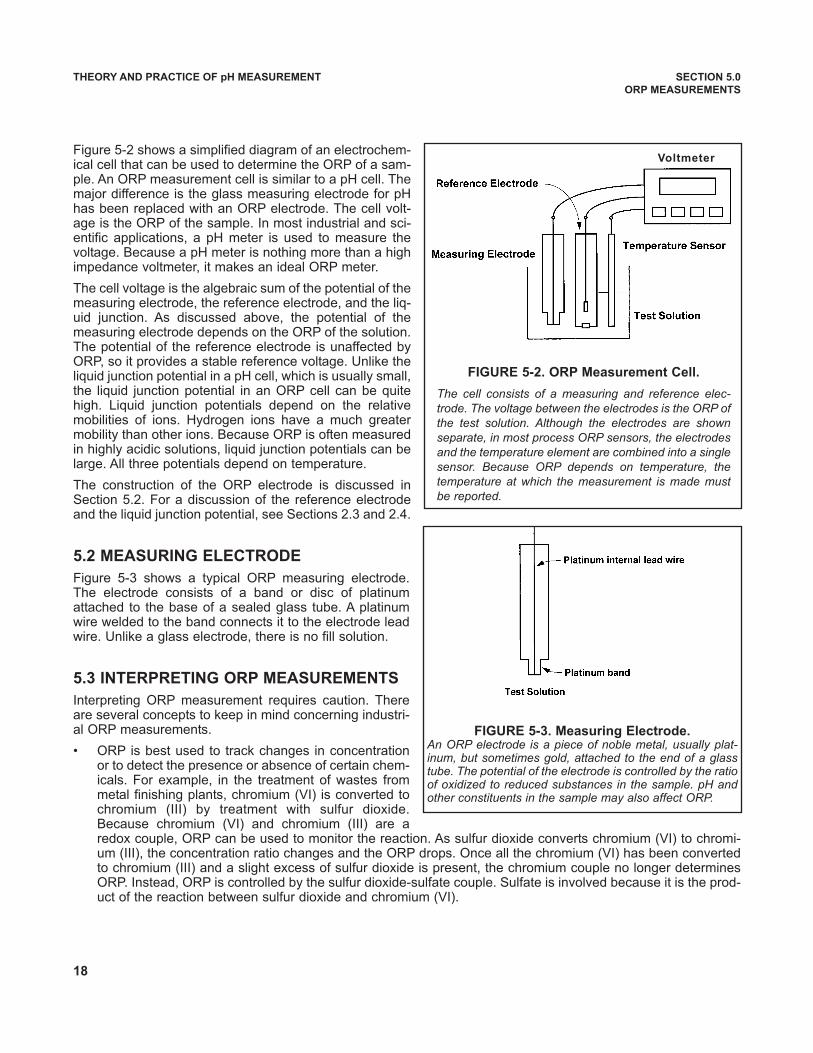
Figure 5-2 shows a simplified diagram of an electrochem-ical cell that can be used to determine the ORP of a sam-ple. An ORP measurement cell is similar to a pH cell. Themajor difference is the glass measuring electrode for pHhas been replaced with an ORP electrode. The cell volt-age is the ORP of the sample. In most industrial and sci-entific applications, a pH meter is used to measure thevoltage. Because a pH meter is nothing more than a highimpedance voltmeter, it makes an ideal ORP meter.
The cell voltage is the algebraic sum of the potential of themeasuring electrode, the reference electrode, and the liq-uid junction. As discussed above, the potential of themeasuring electrode depends on the ORP of the solution.The potential of the reference electrode is unaffected byORP, so it provides a stable reference voltage. Unlike theliquid junction potential in a pH cell, which is usually small,the liquid junction potential in an ORP cell can be quitehigh. Liquid junction potentials depend on the relativemobilities of ions. Hydrogen ions have a much greatermobility than other ions. Because ORP is often measuredin highly acidic solutions, liquid junction potentials can belarge. All three potentials depend on temperature.
The construction of the ORP electrode is discussed inSection 5.2. For a discussion of the reference electrodeand the liquid junction potential, see Sections 2.3 and 2.4.
5.2 MEASURING ELECTRODE
Figure 5-3 shows a typical ORP measuring electrode.The electrode consists of a band or disc of platinumattached to the base of a sealed glass tube. A platinumwire welded to the band connects it to the electrode leadwire. Unlike a glass electrode, there is no fill solution.
5.3 INTERPRETING ORP MEASUREMENTS
Interpreting ORP measurement requires caution. Thereare several concepts to keep in mind concerning industri-al ORP measurements.
• ORP is best used to track changes in concentrationor to detect the presence or absence of certain chem-icals. For example, in the treatment of wastes frommetal finishing plants, chromium (VI) is converted tochromium (III) by treatment with sulfur dioxide.Because chromium (VI) and chromium (III) are aredox couple, ORP can be used to monitor the reaction. As sulfur dioxide converts chromium (VI) to chromi-um (III), the concentration ratio changes and the ORP drops. Once all the chromium (VI) has been convertedto chromium (III) and a slight excess of sulfur dioxide is present, the chromium couple no longer determinesORP. Instead, ORP is controlled by the sulfur dioxide-sulfate couple. Sulfate is involved because it is the prod-uct of the reaction between sulfur dioxide and chromium (VI).
FIGURE 5-3. Measuring Electrode. An ORP electrode is a piece of noble metal, usually plat-inum, but sometimes gold, attached to the end of a glasstube. The potential of the electrode is controlled by the ratioof oxidized to reduced substances in the sample. pH andother constituents in the sample may also affect ORP.
18
FIGURE 5-2. ORP Measurement Cell.
The cell consists of a measuring and reference elec-trode. The voltage between the electrodes is the ORP ofthe test solution. Although the electrodes are shownseparate, in most process ORP sensors, the electrodesand the temperature element are combined into a singlesensor. Because ORP depends on temperature, thetemperature at which the measurement is made mustbe reported.
Voltmeter
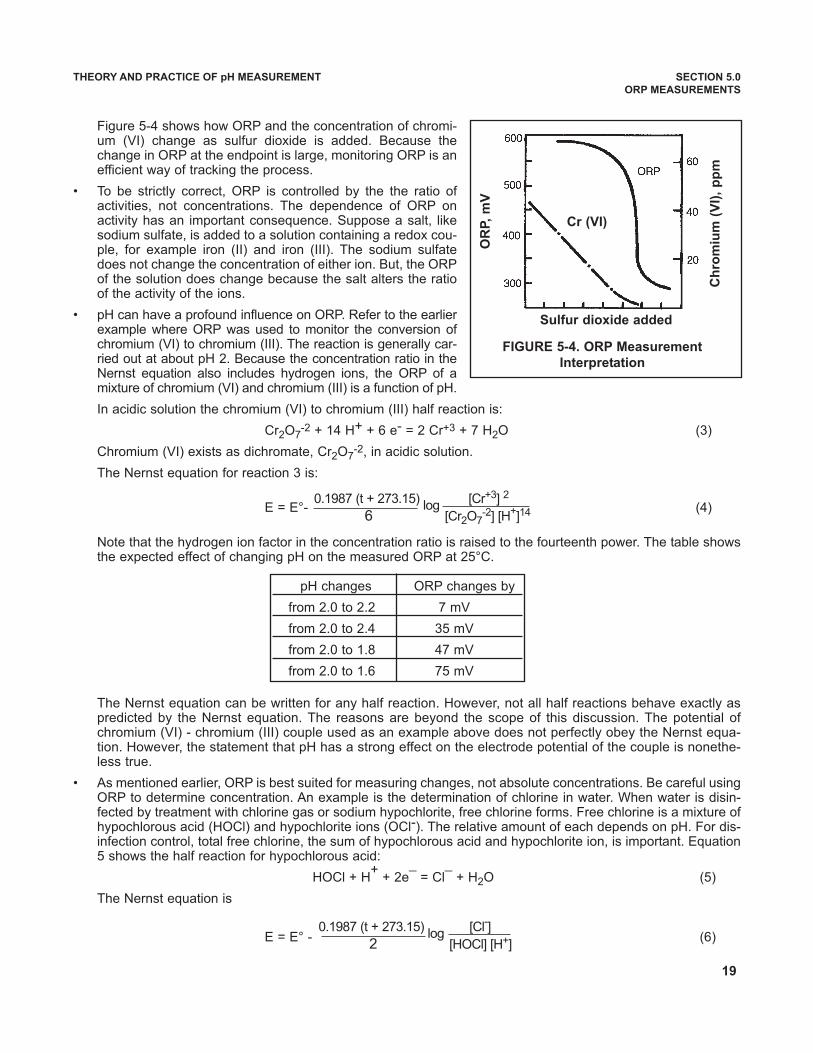
Figure 5-4 shows how ORP and the concentration of chromi-um (VI) change as sulfur dioxide is added. Because thechange in ORP at the endpoint is large, monitoring ORP is anefficient way of tracking the process.
• To be strictly correct, ORP is controlled by the the ratio ofactivities, not concentrations. The dependence of ORP onactivity has an important consequence. Suppose a salt, likesodium sulfate, is added to a solution containing a redox cou-ple, for example iron (II) and iron (III). The sodium sulfatedoes not change the concentration of either ion. But, the ORPof the solution does change because the salt alters the ratioof the activity of the ions.
• pH can have a profound influence on ORP. Refer to the earlierexample where ORP was used to monitor the conversion ofchromium (VI) to chromium (III). The reaction is generally car-ried out at about pH 2. Because the concentration ratio in theNernst equation also includes hydrogen ions, the ORP of amixture of chromium (VI) and chromium (III) is a function of pH.
In acidic solution the chromium (VI) to chromium (III) half reaction is:
Cr2O7-2 + 14 H+ + 6 e- = 2 Cr+3 + 7 H2O (3)
Chromium (VI) exists as dichromate, Cr2O7-2, in acidic solution.
The Nernst equation for reaction 3 is:
E = E°- (4)
Note that the hydrogen ion factor in the concentration ratio is raised to the fourteenth power. The table showsthe expected effect of changing pH on the measured ORP at 25°C.
The Nernst equation can be written for any half reaction. However, not all half reactions behave exactly aspredicted by the Nernst equation. The reasons are beyond the scope of this discussion. The potential ofchromium (VI) - chromium (III) couple used as an example above does not perfectly obey the Nernst equa-tion. However, the statement that pH has a strong effect on the electrode potential of the couple is nonethe-less true.
• As mentioned earlier, ORP is best suited for measuring changes, not absolute concentrations. Be careful usingORP to determine concentration. An example is the determination of chlorine in water. When water is disin-fected by treatment with chlorine gas or sodium hypochlorite, free chlorine forms. Free chlorine is a mixture ofhypochlorous acid (HOCl) and hypochlorite ions (OCl-). The relative amount of each depends on pH. For dis-infection control, total free chlorine, the sum of hypochlorous acid and hypochlorite ion, is important. Equation5 shows the half reaction for hypochlorous acid:
HOCl + H+
+ 2e¯ = Cl¯ + H2O (5)
The Nernst equation is
E = E° - (6)
THEORY AND PRACTICE OF pH MEASUREMENT SECTION 5.0
ORP MEASUREMENTS
0.1987 (t + 273.15) log [Cr+3] 2
6 [Cr2O7-2] [H+]14
0.1987 (t + 273.15) log [Cl-]
2 [HOCl] [H+]
FIGURE 5-4. ORP Measurement
Interpretation
Sulfur dioxide added
Cr (VI)
OR
P,
mV
Ch
rom
ium
(V
I),
pp
m
pH changes ORP changes by
from 2.0 to 2.2 7 mV
from 2.0 to 2.4 35 mV
from 2.0 to 1.8 47 mV
from 2.0 to 1.6 75 mV
19
THEORY AND PRACTICE OF pH MEASUREMENT SECTION 5.0
ORP MEASUREMENTS
Only the concentration of hypochlorous acid appears in the Nernst equation. To use ORP to determine totalfree chlorine, equation 6 must be rewritten in terms of free chlorine. The result is shown in equation 7:
E = E° - (7)
where K is the acid dissociation constant for hypochlorous acid (2.3 x 10⁻⁸) and Ca is the total free chlorineconcentration. As equation 7 shows the measured ORP depends on the hydrogen ion concentration (i.e., pH),the chloride concentration, the free chlorine concentration, and temperature. Therefore, for ORP to be a reli-able measurement of free chlorine, pH, chloride, and temperature must be reasonably constant.
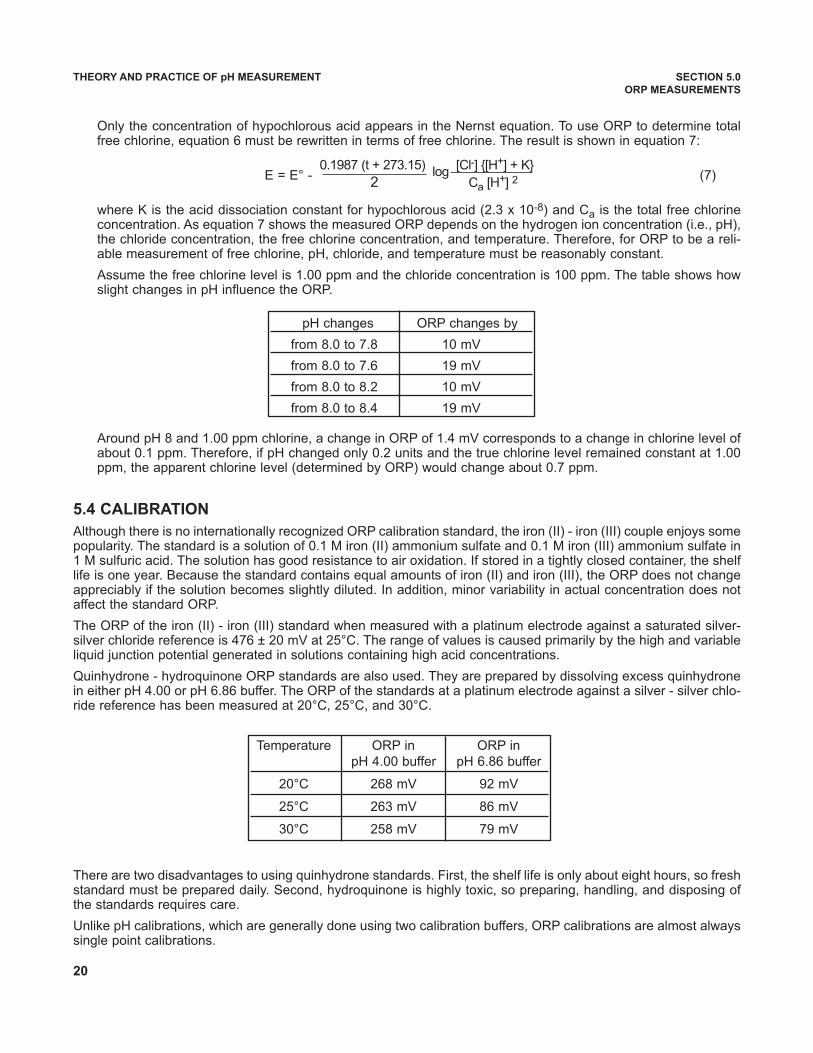
Assume the free chlorine level is 1.00 ppm and the chloride concentration is 100 ppm. The table shows howslight changes in pH influence the ORP.
Around pH 8 and 1.00 ppm chlorine, a change in ORP of 1.4 mV corresponds to a change in chlorine level ofabout 0.1 ppm. Therefore, if pH changed only 0.2 units and the true chlorine level remained constant at 1.00ppm, the apparent chlorine level (determined by ORP) would change about 0.7 ppm.
5.4 CALIBRATION
Although there is no internationally recognized ORP calibration standard, the iron (II) - iron (III) couple enjoys somepopularity. The standard is a solution of 0.1 M iron (II) ammonium sulfate and 0.1 M iron (III) ammonium sulfate in1 M sulfuric acid. The solution has good resistance to air oxidation. If stored in a tightly closed container, the shelflife is one year. Because the standard contains equal amounts of iron (II) and iron (III), the ORP does not changeappreciably if the solution becomes slightly diluted. In addition, minor variability in actual concentration does notaffect the standard ORP.
The ORP of the iron (II) - iron (III) standard when measured with a platinum electrode against a saturated silver-silver chloride reference is 476 ± 20 mV at 25°C. The range of values is caused primarily by the high and variableliquid junction potential generated in solutions containing high acid concentrations.
Quinhydrone - hydroquinone ORP standards are also used. They are prepared by dissolving excess quinhydronein either pH 4.00 or pH 6.86 buffer. The ORP of the standards at a platinum electrode against a silver - silver chlo-ride reference has been measured at 20°C, 25°C, and 30°C.
There are two disadvantages to using quinhydrone standards. First, the shelf life is only about eight hours, so freshstandard must be prepared daily. Second, hydroquinone is highly toxic, so preparing, handling, and disposing ofthe standards requires care.
Unlike pH calibrations, which are generally done using two calibration buffers, ORP calibrations are almost alwayssingle point calibrations.
0.1987 (t + 273.15) log [Cl-] {[H+] + K}
2 Ca [H+] 2
Temperature ORP in ORP in pH 4.00 buffer pH 6.86 buffer
20°C 268 mV 92 mV
25°C 263 mV 86 mV
30°C 258 mV 79 mV
pH changes ORP changes by
from 8.0 to 7.8 10 mV
from 8.0 to 7.6 19 mV
from 8.0 to 8.2 10 mV
from 8.0 to 8.4 19 mV
20
6.1 GENERAL
Industrial pH sensors can be installed in the process piping, immersed in a tank or basin, or placed in a sidestreamsample. In a sidestream, a portion of the process liquid is continuously removed from the main process and direct-ed to the pH sensor. Sidestream systems are necessary when the temperature and pressure of the process liquidexceed the sensor rating. The sample is cooled and the pressure reduced before the liquid reaches the sensor. Ina sidestream, the sample can either be returned to the process or drained to waste. Retractable sensors, whichcan be removed from the process piping without shutting down the system, are also popular.
6.2 SAFETY
There are safety hazards associated with pH sensors installed in process streams. If the temperature or pressureof the liquid exceeds the rating of the sensor, the sensor may fail, allowing the process liquid to leak out fromaround the sensor. There are special hazards associated with retractable sensors. To avoid accidents, always fol-low the manufacturer's instructions for inserting and removing the sensor. Never attempt to remove a retractablesensor unless the process conditions meet the manufacturer’s requirements. Also, install retractable sensors onlyin places where access is easy and the person retracting the sensor has good footing.
6.3 IMMERSION AND INSERTION APPLICATIONS
A bit of thought when designing an in-line pH measurement system can save a lot of headaches later on.
1. If a pH sensor is to be inserted directly into a pipe, choose a location that is always flooded. If that is not pos-sible, pay attention to how far the sensor extends into the pipe. If the liquid level varies, the sensor maybecome uncovered. It may be not immediately obvious that the sensor is no longer submerged. Most indus-trial pH electrodes are combination sensors. So long as a liquid film provides a conductive path between theglass membrane and the reference junction, the sensor will produce a reading. The reading, however, is thepH of the film, not the process liquid. If the film dries out, the sensor will appear to have failed. pH analyzerswith sensor diagnostic features will indicate a high reference and glass impedance at this point. The highimpedance could be caused by either a dry sensor or an actual failure.
2. Always consider the velocity and density of the liquid flowing past the sensor. A dense liquid moving at a highflow rate can deform the sensor, particularly if it extends some distance into the stream. If a retractable sen-sor becomes bent or distorted, it might no longer be possible to safely remove it. In fact, it might be impossi-ble to retract the sensor at all.
3. Install pH sensors with the bulb down, within 80° from vertical. The potassium chloride and buffer solutioninside the glass electrode must completely wet the inside surface of the glass bulb, and there must be a con-ductive path between the internal reference electrode and the inside glass surface. Installing the electrode bulbpointed up or at an angle too close to horizontal will break the connection.
THEORY AND PRACTICE OF pH MEASUREMENT SECTION 6.0
SENSOR INSTALLATIONS
6.1 GENERAL
6.2 SAFETY
6.3 IMMERSION AND INSERTION APPLICATIONS
6.4 ELECTRICAL CONNECTIONS
SECTION 6.0
SENSOR INSTALLATIONS
21
4. pH sensors need regular calibration and, in some applica-tions, regular cleaning. The ease with which the sensor canbe removed from the piping should always be considered.
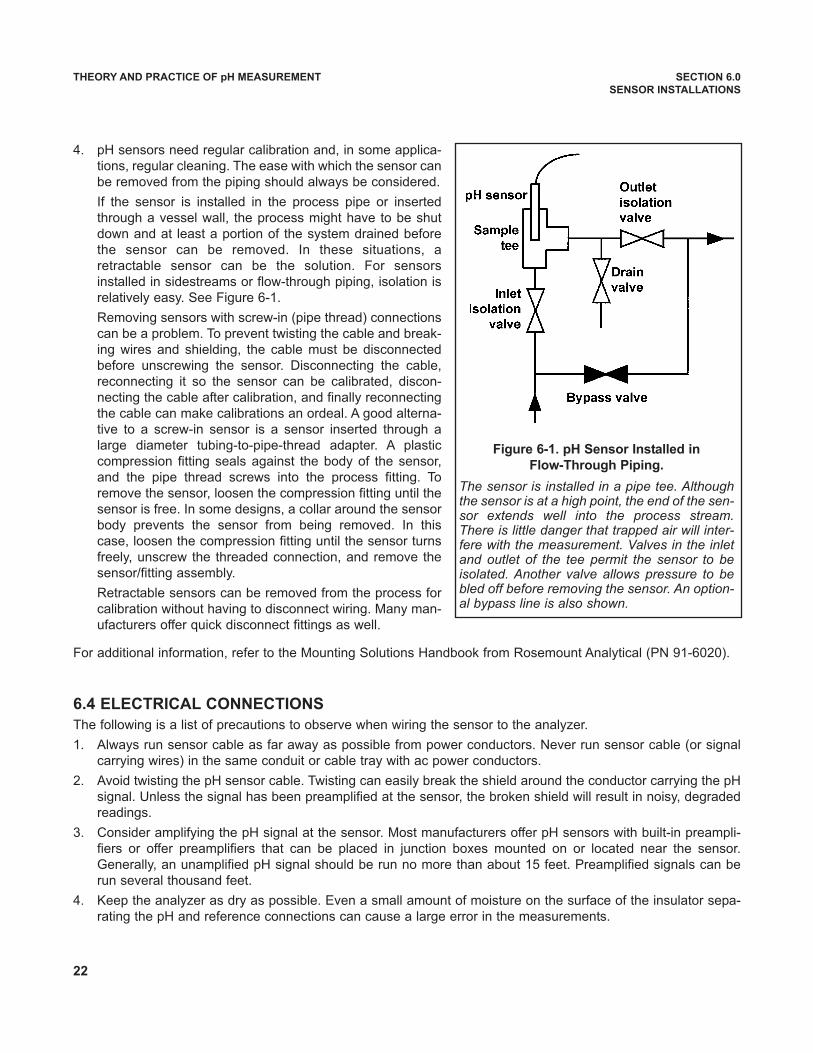
If the sensor is installed in the process pipe or insertedthrough a vessel wall, the process might have to be shutdown and at least a portion of the system drained beforethe sensor can be removed. In these situations, aretractable sensor can be the solution. For sensorsinstalled in sidestreams or flow-through piping, isolation isrelatively easy. See Figure 6-1.
Removing sensors with screw-in (pipe thread) connectionscan be a problem. To prevent twisting the cable and break-ing wires and shielding, the cable must be disconnectedbefore unscrewing the sensor. Disconnecting the cable,reconnecting it so the sensor can be calibrated, discon-necting the cable after calibration, and finally reconnectingthe cable can make calibrations an ordeal. A good alterna-tive to a screw-in sensor is a sensor inserted through alarge diameter tubing-to-pipe-thread adapter. A plasticcompression fitting seals against the body of the sensor,and the pipe thread screws into the process fitting. Toremove the sensor, loosen the compression fitting until thesensor is free. In some designs, a collar around the sensorbody prevents the sensor from being removed. In thiscase, loosen the compression fitting until the sensor turnsfreely, unscrew the threaded connection, and remove thesensor/fitting assembly.
Retractable sensors can be removed from the process forcalibration without having to disconnect wiring. Many man-ufacturers offer quick disconnect fittings as well.
For additional information, refer to the Mounting Solutions Handbook from Rosemount Analytical (PN 91-6020).
6.4 ELECTRICAL CONNECTIONS
The following is a list of precautions to observe when wiring the sensor to the analyzer.
1. Always run sensor cable as far away as possible from power conductors. Never run sensor cable (or signalcarrying wires) in the same conduit or cable tray with ac power conductors.
2. Avoid twisting the pH sensor cable. Twisting can easily break the shield around the conductor carrying the pHsignal. Unless the signal has been preamplified at the sensor, the broken shield will result in noisy, degradedreadings.
3. Consider amplifying the pH signal at the sensor. Most manufacturers offer pH sensors with built-in preampli-fiers or offer preamplifiers that can be placed in junction boxes mounted on or located near the sensor.Generally, an unamplified pH signal should be run no more than about 15 feet. Preamplified signals can berun several thousand feet.
4. Keep the analyzer as dry as possible. Even a small amount of moisture on the surface of the insulator sepa-rating the pH and reference connections can cause a large error in the measurements.
THEORY AND PRACTICE OF pH MEASUREMENT SECTION 6.0
SENSOR INSTALLATIONS
Figure 6-1. pH Sensor Installed in
Flow-Through Piping.
The sensor is installed in a pipe tee. Althoughthe sensor is at a high point, the end of the sen-sor extends well into the process stream.There is little danger that trapped air will inter-fere with the measurement. Valves in the inletand outlet of the tee permit the sensor to beisolated. Another valve allows pressure to bebled off before removing the sensor. An option-al bypass line is also shown.
22
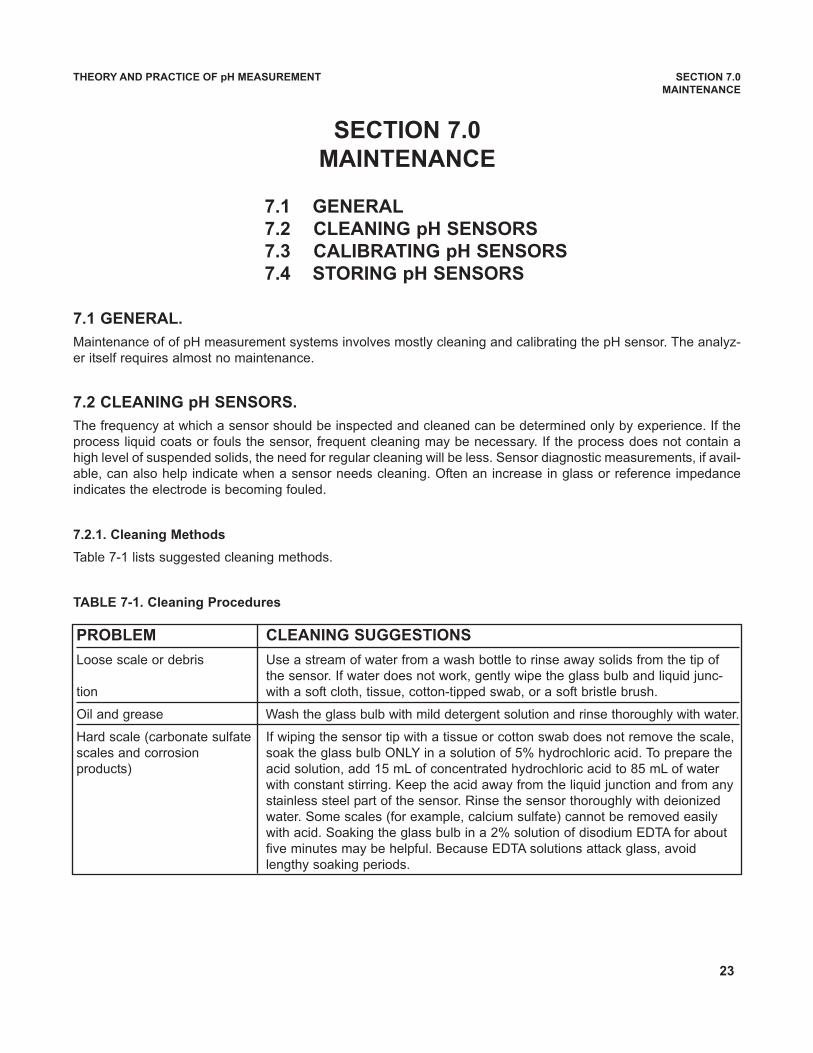
THEORY AND PRACTICE OF pH MEASUREMENT SECTION 7.0
MAINTENANCE
7.1 GENERAL.
Maintenance of of pH measurement systems involves mostly cleaning and calibrating the pH sensor. The analyz-er itself requires almost no maintenance.
7.2 CLEANING pH SENSORS.
The frequency at which a sensor should be inspected and cleaned can be determined only by experience. If theprocess liquid coats or fouls the sensor, frequent cleaning may be necessary. If the process does not contain ahigh level of suspended solids, the need for regular cleaning will be less. Sensor diagnostic measurements, if avail-able, can also help indicate when a sensor needs cleaning. Often an increase in glass or reference impedanceindicates the electrode is becoming fouled.
7.2.1. Cleaning Methods
Table 7-1 lists suggested cleaning methods.
TABLE 7-1. Cleaning Procedures
7.1 GENERAL
7.2 CLEANING pH SENSORS
7.3 CALIBRATING pH SENSORS
7.4 STORING pH SENSORS
SECTION 7.0
MAINTENANCE
PROBLEM CLEANING SUGGESTIONS
Loose scale or debris Use a stream of water from a wash bottle to rinse away solids from the tip of the sensor. If water does not work, gently wipe the glass bulb and liquid junc-
tion with a soft cloth, tissue, cotton-tipped swab, or a soft bristle brush.
Oil and grease Wash the glass bulb with mild detergent solution and rinse thoroughly with water.
Hard scale (carbonate sulfate If wiping the sensor tip with a tissue or cotton swab does not remove the scale,scales and corrosion soak the glass bulb ONLY in a solution of 5% hydrochloric acid. To prepare theproducts) acid solution, add 15 mL of concentrated hydrochloric acid to 85 mL of water
with constant stirring. Keep the acid away from the liquid junction and from any stainless steel part of the sensor. Rinse the sensor thoroughly with deionized water. Some scales (for example, calcium sulfate) cannot be removed easily with acid. Soaking the glass bulb in a 2% solution of disodium EDTA for about five minutes may be helpful. Because EDTA solutions attack glass, avoid lengthy soaking periods.
23
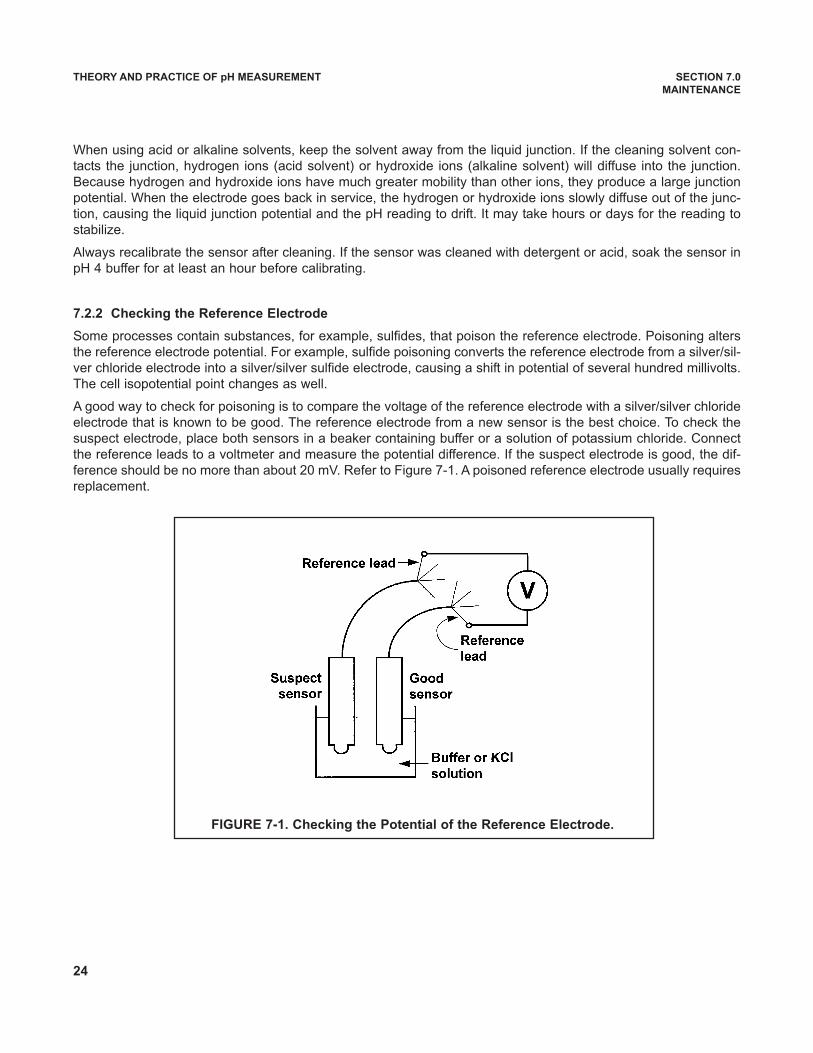
THEORY AND PRACTICE OF pH MEASUREMENT SECTION 7.0
MAINTENANCE
When using acid or alkaline solvents, keep the solvent away from the liquid junction. If the cleaning solvent con-tacts the junction, hydrogen ions (acid solvent) or hydroxide ions (alkaline solvent) will diffuse into the junction.Because hydrogen and hydroxide ions have much greater mobility than other ions, they produce a large junctionpotential. When the electrode goes back in service, the hydrogen or hydroxide ions slowly diffuse out of the junc-tion, causing the liquid junction potential and the pH reading to drift. It may take hours or days for the reading tostabilize.
Always recalibrate the sensor after cleaning. If the sensor was cleaned with detergent or acid, soak the sensor inpH 4 buffer for at least an hour before calibrating.
7.2.2 Checking the Reference Electrode
Some processes contain substances, for example, sulfides, that poison the reference electrode. Poisoning altersthe reference electrode potential. For example, sulfide poisoning converts the reference electrode from a silver/sil-ver chloride electrode into a silver/silver sulfide electrode, causing a shift in potential of several hundred millivolts.The cell isopotential point changes as well.
A good way to check for poisoning is to compare the voltage of the reference electrode with a silver/silver chlorideelectrode that is known to be good. The reference electrode from a new sensor is the best choice. To check thesuspect electrode, place both sensors in a beaker containing buffer or a solution of potassium chloride. Connectthe reference leads to a voltmeter and measure the potential difference. If the suspect electrode is good, the dif-ference should be no more than about 20 mV. Refer to Figure 7-1. A poisoned reference electrode usually requiresreplacement.
FIGURE 7-1. Checking the Potential of the Reference Electrode.
24
THEORY AND PRACTICE OF pH MEASUREMENT SECTION 7.0
MAINTENANCE
7.3 CALIBRATING pH SENSORS.
Many users regard calibration as part of routine maintenance. The question that arises is how often should sen-sors be calibrated.
Like cleaning, the frequency at which sensors should be calibrated can be determined only by experience. Manyfactors influence calibration frequency. Sensors installed in dirty or corrosive process streams usually require morefrequent calibration than sensors used in clean water. Sensors measuring extreme pH values, particularly high pH,also require more frequent calibration than sensors measuring mid-range pH. The width of the pH or ORP controlrange and the consequences of an out-of-limits condition has a major influence on calibration frequency. The nar-rower the control range and the greater the sensitivity of the process to control excursions, the more often the sen-sor should be checked. Finally, if monitoring data are reported to regulatory agencies, the agency itself may dic-tate the calibration frequency.
Use the following procedure to determine how often a pH sensor should be calibrated.
1. Calibrate the sensor. Record the date of calibration and the sensor response in buffers. That is, after calibrat-ing, place the sensor back in the buffers and record the pH and temperature reading in each buffer. Also notethe value of the reference offset and slope.
2. Install the sensor in the process stream.
3. After the appropriate period—two weeks for a clean process, several days for a dirty or aggressive process—remove the sensor and check its performance in buffers. Record the pH and temperature readings. The per-formance of the sensor in buffer after it has been in service is called the as-found condition. Keeping a goodrecord of as-found data is an important step in determining the calibration frequency.
4. If the as-found data are acceptable, do not recalibrate the sensor. Return it to the process. Continue checkingthe calibration at the same or slightly longer interval.
5. If the as-found data are not acceptable, recalibrate the sensor. After calibration, check the sensor response ineach buffer and record the results. Also note the reference offset and the slope. Return the sensor to service.Check the sensor again after a period shorter than the one originally selected. For example, if the first intervalwas two weeks, repeat the check after one week.
6. After a while it will become apparent how long the sensor holds calibration. The minimum calibration frequen-cy can then be determined.
7. Check the calibration of the sensor at least several times during the regular calibration interval. Interim checksverify the sensor is still in calibration and validate the process measurements made since the last calibrationor calibration check.
7.4 STORING pH SENSORS.
Out of service pH sensors should be stored wet. pH 4 buffer to which a small amount of potassium chloride hasbeen added is the best storage solution. Do not store sensors in deionized water or alkaline buffers. If a sensordries out during storage, soaking it overnight in pH 4 buffer will usually restore the hydrated glass layer and thereference junction.
25
THEORY AND PRACTICE OF pH MEASUREMENT SECTION 8.0
TROUBLESHOOTING
8.1 INTRODUCTION
8.2 INSTALLATION
8.3 WIRING
8.4 PROBLEMS WITH CALIBRATIONS
8.5 NOISE
8.6 DRIFT
8.7 GROUND LOOPS
SECTION 8.0
TROUBLESHOOTING
8.1 INTRODUCTION
The first step in troubleshooting a pH system is to determine whether the problem lies with the instrument, the sen-sor, or the installation. The majority of pH measurement problems can be traced to the sensor or the installation.Comparatively few problems arise from the analyzer.
8.2 INSTALLATION
Section 6.0 gives general information about installation and some of the symptoms of an improperly installed sen-sor. A sensor may appear to have failed when in fact it has merely been installed incorrectly.
8.3 WIRING
Section 6.4 gives some general information about wiring sensors. Improperly wired sensors usually give noisy ordrifting readings or no reading at all. Occasionally, the output signal cable or alarm connections may be the causeof erroneous pH readings. Therefore, when troubleshooting, it is always a good idea to disconnect output signalwires and alarm wires one at a time to see if they are the problem.
8.4 PROBLEMS WITH CALIBRATIONS
At room temperature, the slope of a properly operating pH measurement cell is about 59 mV per unit pH. In otherwords, a unit change in pH causes the cell voltage to change 59 mV. Many industrial pH analyzers automaticallycompare the slope calculated during calibration with reference values. If the slope is too high or too low, the instru-ment displays a warning message, or possibly refuses to accept the calibration. If the analyzer does not have sucha feature, the user should check the raw voltage readings in buffer and calculate the slope manually.
8.4.1 Slope too low.
1. Inaccurate buffers can cause a low slope. Alkaline buffers, pH 10 or greater, are the major problem. Thesebuffers absorb carbon dioxide from the air, which depresses the pH. Thus, the true pH is less than the expect-ed value, and the calibration slope is low. If the calibration slope is low, repeat the calibration using freshbuffers. If using a high pH buffer continues to give a low slope, repeat the calibration using a lower pH buffer.For example, use pH 4 and 7 buffer instead of pH 7 and 10 buffer.
2. Allow adequate time for readings in the buffer to become constant. If the sensor was in a process appreciablycolder or hotter than the buffer, allow at least 20 minutes for stabilization. Alternatively, place the sensor in acontainer of tap water at ambient temperature for 20 minutes before starting the calibration.
26
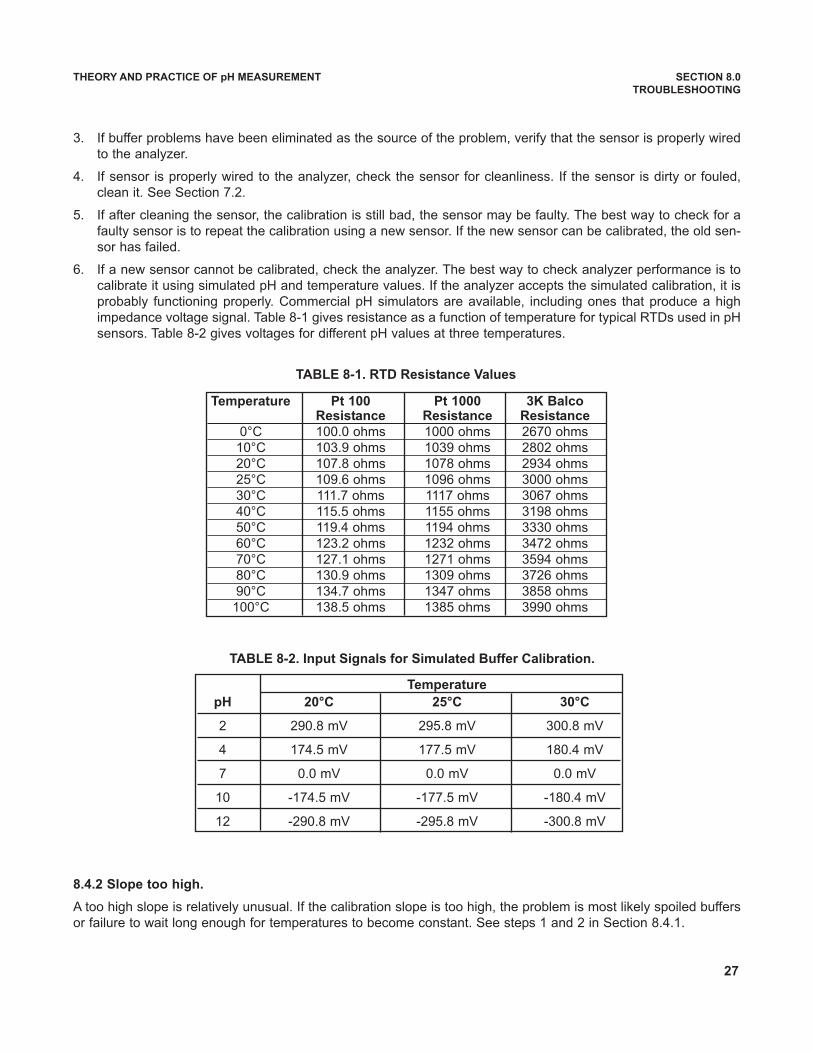
THEORY AND PRACTICE OF pH MEASUREMENT SECTION 8.0
TROUBLESHOOTING
3. If buffer problems have been eliminated as the source of the problem, verify that the sensor is properly wiredto the analyzer.
4. If sensor is properly wired to the analyzer, check the sensor for cleanliness. If the sensor is dirty or fouled,clean it. See Section 7.2.
5. If after cleaning the sensor, the calibration is still bad, the sensor may be faulty. The best way to check for afaulty sensor is to repeat the calibration using a new sensor. If the new sensor can be calibrated, the old sen-sor has failed.
6. If a new sensor cannot be calibrated, check the analyzer. The best way to check analyzer performance is tocalibrate it using simulated pH and temperature values. If the analyzer accepts the simulated calibration, it isprobably functioning properly. Commercial pH simulators are available, including ones that produce a highimpedance voltage signal. Table 8-1 gives resistance as a function of temperature for typical RTDs used in pHsensors. Table 8-2 gives voltages for different pH values at three temperatures.
8.4.2 Slope too high.
A too high slope is relatively unusual. If the calibration slope is too high, the problem is most likely spoiled buffersor failure to wait long enough for temperatures to become constant. See steps 1 and 2 in Section 8.4.1.
Temperature Pt 100 Pt 1000 3K BalcoResistance Resistance Resistance
0°C 100.0 ohms 1000 ohms 2670 ohms10°C 103.9 ohms 1039 ohms 2802 ohms20°C 107.8 ohms 1078 ohms 2934 ohms25°C 109.6 ohms 1096 ohms 3000 ohms30°C 111.7 ohms 1117 ohms 3067 ohms40°C 115.5 ohms 1155 ohms 3198 ohms50°C 119.4 ohms 1194 ohms 3330 ohms60°C 123.2 ohms 1232 ohms 3472 ohms70°C 127.1 ohms 1271 ohms 3594 ohms80°C 130.9 ohms 1309 ohms 3726 ohms90°C 134.7 ohms 1347 ohms 3858 ohms
100°C 138.5 ohms 1385 ohms 3990 ohms
TABLE 8-1. RTD Resistance Values
Temperature
pH 20°C 25°C 30°C
2 290.8 mV 295.8 mV 300.8 mV
4 174.5 mV 177.5 mV 180.4 mV
7 0.0 mV 0.0 mV 0.0 mV
10 -174.5 mV -177.5 mV -180.4 mV
12 -290.8 mV -295.8 mV -300.8 mV
TABLE 8-2. Input Signals for Simulated Buffer Calibration.
27
8.5 NOISE.
Noise is a rapid, random fluctuation in a signal. Noisy pH readings can have many causes.
1. The pH signal is high impedance, so it is susceptible to environmental noise. See Section 3.6 for additionalinformation. Problems with environmental noise can also be minimized by preamplifying the signal at the sen-sor.
2. The impedance of the glass electrode increases as temperature decreases. An increase in impedance causedby a cold sample might be contributing to noise.
3. A plugged or depleted liquid junction can also be a source of noise.
4. Noisy readings, particularly if accompanied by offsets that disappear when the sample is electrically isolatedfrom the process piping, can be a symptom of ground loops. See Section 8.7.
5. Noise can be a severe problem when measuring the pH of high purity water. pH readings in high purity waterare also flow sensitive. High flow can produce very noisy readings as well as offsets as great as 0.5 pH units.The problem is likely caused by variations in the electrical potential at the surface of the junction plug. The fluc-tuating potentials are related to the flow of filling solution through the junction pores. Several manufacturersoffer pH electrodes specifically designed for measuring high purity water.
8.6 DRIFT.
Drift is a gradual increase or decrease in a signal not caused by an actual change in the process liquid. Drift, likenoise, has many causes.
1. Temperature changes can cause drift. The problem is often seen following calibration. If the temperature of thebuffers was significantly different from the process liquid, the pH reading, once the sensor is returned to theprocess, will drift as the temperature of the sensor approaches the temperature of the process. Because indus-trial pH sensors often have plastic bodies, which are poor heat conductors, it may take 10 to 20 minutes forthe sensor to equilibrate. While equilibration is occurring, the pH reading will drift.
2. Dirty sensors often produce pH readings that drift. The sensor voltage depends on the pH of the liquid at thesurface of the pH sensitive glass. If the bulb is dirty or fouled, it may take some time for the liquid to diffusethrough the coating and reach the membrane. The response of the sensor to step changes will be slow, andreadings will drift to the final values.
3. Memory of past junction potentials can also lead to drift. When a pH sensor is transferred from one sample toanother, liquid that has diffused into the reference junction is carried with the sensor. When the sensor is firstplaced in the new solution, both the old and new solutions determine the junction potential. As the new solu-tion diffuses into the junction and the old solution diffuses out, the liquid junction potential gradually changes.The changing junction potential causes the pH reading to drift. The effect is most severe when the ionsinvolved have substantially different mobilities. If the solutions are more or less equitransferent, the memoryeffect will be relatively small. The type of junction also influences the amount of drift. In flowing junctions, thefilling solution washes out the previous sample, so the time for the memory to disappear is a few minutes toan hour. In gel type sensors, diffusion alone is responsible for movement of ions through the junction.Therefore, the time required for the memory to dissipate can be quite long.
THEORY AND PRACTICE OF pH MEASUREMENT SECTION 8.0
TROUBLESHOOTING
28
8.7 GROUND LOOPS
A ground loop exists when a circuit is connected to earth ground at two or more points. Because the potential ofthe earth varies from point to point, two or more connections to ground cause currents to flow. If the current flowsthrough a signal carrying wire, the result is a noisy, offset signal. The classic symptom of a ground loop is a sen-sor that reads correctly in buffers, but gives a reading grossly in error when placed in the process liquid.
In a typical process measurement, the pH sensor is connected through the process liquid and piping to earthground. If the circuitry in the pH analyzer becomes connected to a second earth ground, current will flow throughthe reference electrode. A voltage proportional to the current and the electrode resistance develops across the ref-erence electrode. Because the voltage is in series with the other cell voltages, the ground loop current causes thepH reading to be substantially different from the expected value. The currents created by ground loops are oftenunstable, so pH readings affected by ground loops are often noisy.
Use the following procedure to check for ground loops.
1. Remove the pH sensor from the process liquid.
2. Calibrate the sensor in buffers. Be sure there is no direct electrical connection between the container holdingthe buffer and the process liquid or piping.
3. Strip back the ends of a heavy gauge wire. Connect one end of the wire to the process piping or, better, placeit in the process liquid. Place the other end of the wire in the container with the buffer and sensor. The wiremakes an electrical connection between the process and sensor.
4. If the pH reading changes or becomes noisy after making the connection, a ground loop exists. If no symp-toms develop a ground loop probably does not exist.
THEORY AND PRACTICE OF pH MEASUREMENT SECTION 8.0
TROUBLESHOOTING
29
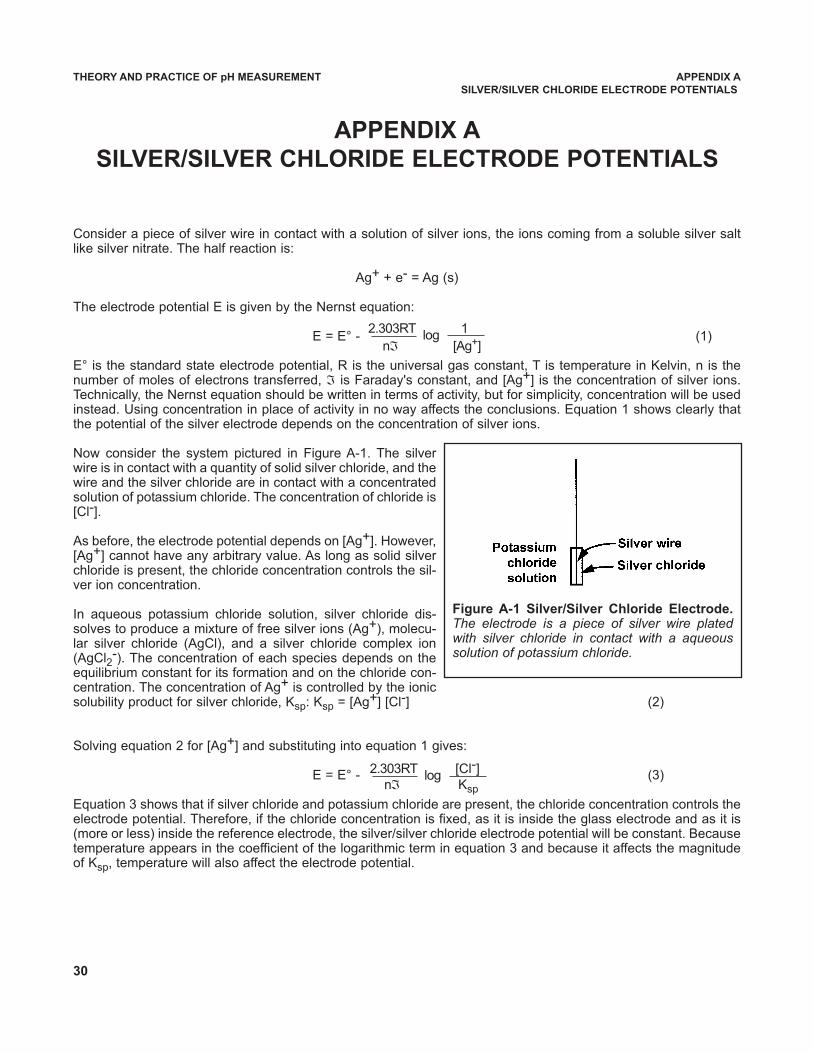
Consider a piece of silver wire in contact with a solution of silver ions, the ions coming from a soluble silver saltlike silver nitrate. The half reaction is:
Ag+ + e- = Ag (s)
The electrode potential E is given by the Nernst equation:
E = E° - (1)
E° is the standard state electrode potential, R is the universal gas constant, T is temperature in Kelvin, n is thenumber of moles of electrons transferred, ℑ is Faraday's constant, and [Ag+] is the concentration of silver ions.Technically, the Nernst equation should be written in terms of activity, but for simplicity, concentration will be usedinstead. Using concentration in place of activity in no way affects the conclusions. Equation 1 shows clearly thatthe potential of the silver electrode depends on the concentration of silver ions.
Now consider the system pictured in Figure A-1. The silverwire is in contact with a quantity of solid silver chloride, and thewire and the silver chloride are in contact with a concentratedsolution of potassium chloride. The concentration of chloride is[Cl-].
As before, the electrode potential depends on [Ag+]. However,[Ag+] cannot have any arbitrary value. As long as solid silverchloride is present, the chloride concentration controls the sil-ver ion concentration.
In aqueous potassium chloride solution, silver chloride dis-solves to produce a mixture of free silver ions (Ag+), molecu-lar silver chloride (AgCl), and a silver chloride complex ion(AgCl2
-). The concentration of each species depends on theequilibrium constant for its formation and on the chloride con-centration. The concentration of Ag+ is controlled by the ionicsolubility product for silver chloride, Ksp: Ksp = [Ag+] [Cl-] (2)
Solving equation 2 for [Ag+] and substituting into equation 1 gives:
E = E° - (3)
Equation 3 shows that if silver chloride and potassium chloride are present, the chloride concentration controls theelectrode potential. Therefore, if the chloride concentration is fixed, as it is inside the glass electrode and as it is(more or less) inside the reference electrode, the silver/silver chloride electrode potential will be constant. Becausetemperature appears in the coefficient of the logarithmic term in equation 3 and because it affects the magnitudeof Ksp, temperature will also affect the electrode potential.
THEORY AND PRACTICE OF pH MEASUREMENT APPENDIX A
SILVER/SILVER CHLORIDE ELECTRODE POTENTIALS
APPENDIX A
SILVER/SILVER CHLORIDE ELECTRODE POTENTIALS
2.303RT log 1
nℑ [Ag+]
2.303RT log [Cl-]nℑ Ksp
30
Figure A-1 Silver/Silver Chloride Electrode.The electrode is a piece of silver wire platedwith silver chloride in contact with a aqueoussolution of potassium chloride.
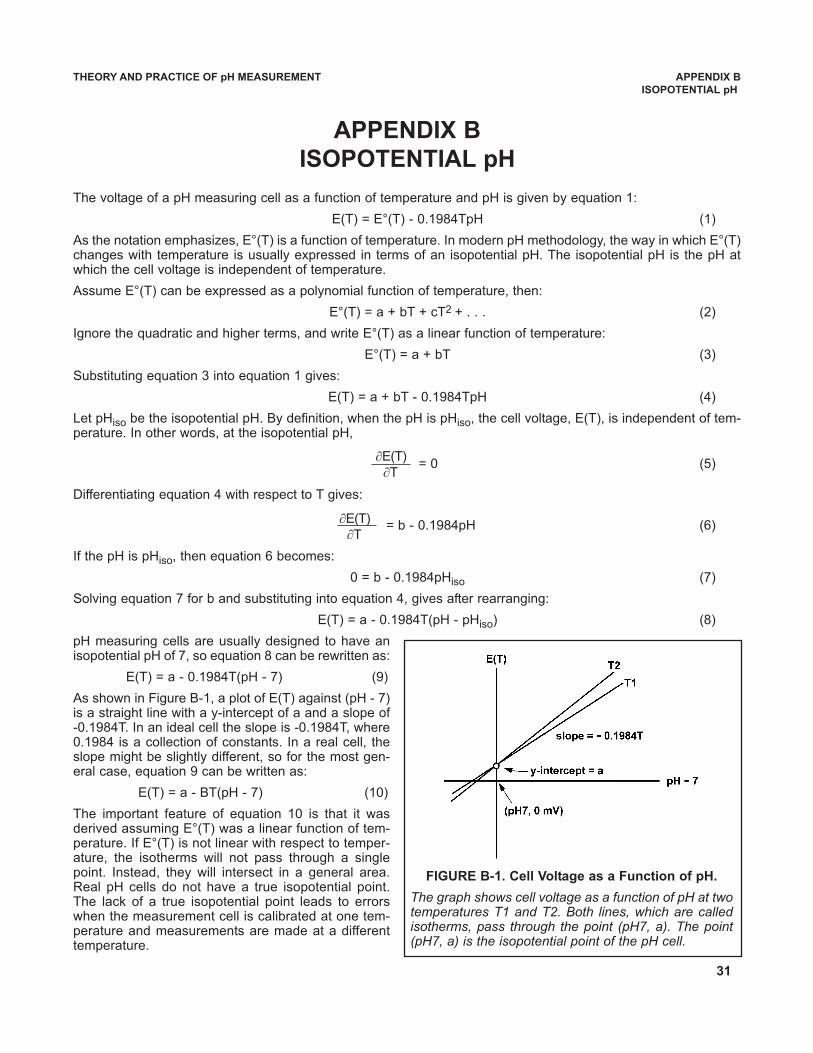
31
THEORY AND PRACTICE OF pH MEASUREMENT APPENDIX B
ISOPOTENTIAL pH
APPENDIX B
ISOPOTENTIAL pH
The voltage of a pH measuring cell as a function of temperature and pH is given by equation 1:
E(T) = E°(T) - 0.1984TpH (1)
As the notation emphasizes, E°(T) is a function of temperature. In modern pH methodology, the way in which E°(T)changes with temperature is usually expressed in terms of an isopotential pH. The isopotential pH is the pH atwhich the cell voltage is independent of temperature.
Assume E°(T) can be expressed as a polynomial function of temperature, then:
E°(T) = a + bT + cT2 + . . . (2)
Ignore the quadratic and higher terms, and write E°(T) as a linear function of temperature:
E°(T) = a + bT (3)
Substituting equation 3 into equation 1 gives:
E(T) = a + bT - 0.1984TpH (4)
Let pHiso be the isopotential pH. By definition, when the pH is pHiso, the cell voltage, E(T), is independent of tem-perature. In other words, at the isopotential pH,
= 0 (5)
Differentiating equation 4 with respect to T gives:
= b - 0.1984pH (6)
If the pH is pHiso, then equation 6 becomes:
0 = b - 0.1984pHiso (7)
Solving equation 7 for b and substituting into equation 4, gives after rearranging:
E(T) = a - 0.1984T(pH - pHiso) (8)
pH measuring cells are usually designed to have anisopotential pH of 7, so equation 8 can be rewritten as:
E(T) = a - 0.1984T(pH - 7) (9)
As shown in Figure B-1, a plot of E(T) against (pH - 7)is a straight line with a y-intercept of a and a slope of-0.1984T. In an ideal cell the slope is -0.1984T, where0.1984 is a collection of constants. In a real cell, theslope might be slightly different, so for the most gen-eral case, equation 9 can be written as:
E(T) = a - BT(pH - 7) (10)
The important feature of equation 10 is that it wasderived assuming E°(T) was a linear function of tem-perature. If E°(T) is not linear with respect to temper-ature, the isotherms will not pass through a singlepoint. Instead, they will intersect in a general area.Real pH cells do not have a true isopotential point.The lack of a true isopotential point leads to errorswhen the measurement cell is calibrated at one tem-perature and measurements are made at a differenttemperature.
FIGURE B-1. Cell Voltage as a Function of pH.
The graph shows cell voltage as a function of pH at twotemperatures T1 and T2. Both lines, which are calledisotherms, pass through the point (pH7, a). The point(pH7, a) is the isopotential point of the pH cell.
∂E(T) ∂T
∂E(T) ∂T
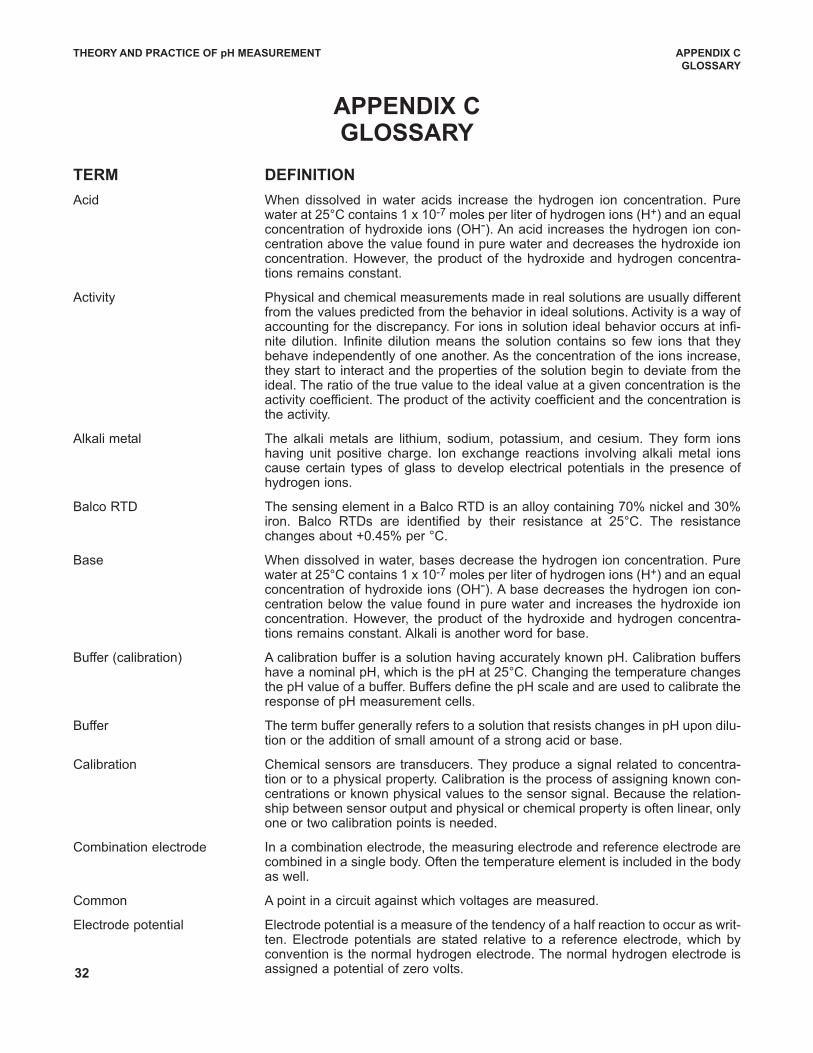
TERM DEFINITION
Acid When dissolved in water acids increase the hydrogen ion concentration. Purewater at 25°C contains 1 x 10⁻⁷ moles per liter of hydrogen ions (H+) and an equalconcentration of hydroxide ions (OH-). An acid increases the hydrogen ion con-centration above the value found in pure water and decreases the hydroxide ionconcentration. However, the product of the hydroxide and hydrogen concentra-tions remains constant.
Activity Physical and chemical measurements made in real solutions are usually differentfrom the values predicted from the behavior in ideal solutions. Activity is a way ofaccounting for the discrepancy. For ions in solution ideal behavior occurs at infi-nite dilution. Infinite dilution means the solution contains so few ions that theybehave independently of one another. As the concentration of the ions increase,they start to interact and the properties of the solution begin to deviate from theideal. The ratio of the true value to the ideal value at a given concentration is theactivity coefficient. The product of the activity coefficient and the concentration isthe activity.
Alkali metal The alkali metals are lithium, sodium, potassium, and cesium. They form ionshaving unit positive charge. Ion exchange reactions involving alkali metal ionscause certain types of glass to develop electrical potentials in the presence ofhydrogen ions.
Balco RTD The sensing element in a Balco RTD is an alloy containing 70% nickel and 30%iron. Balco RTDs are identified by their resistance at 25°C. The resistancechanges about +0.45% per °C.
Base When dissolved in water, bases decrease the hydrogen ion concentration. Purewater at 25°C contains 1 x 10⁻⁷ moles per liter of hydrogen ions (H+) and an equalconcentration of hydroxide ions (OH-). A base decreases the hydrogen ion con-centration below the value found in pure water and increases the hydroxide ionconcentration. However, the product of the hydroxide and hydrogen concentra-tions remains constant. Alkali is another word for base.
Buffer (calibration) A calibration buffer is a solution having accurately known pH. Calibration buffershave a nominal pH, which is the pH at 25°C. Changing the temperature changesthe pH value of a buffer. Buffers define the pH scale and are used to calibrate theresponse of pH measurement cells.
Buffer The term buffer generally refers to a solution that resists changes in pH upon dilu-tion or the addition of small amount of a strong acid or base.
Calibration Chemical sensors are transducers. They produce a signal related to concentra-tion or to a physical property. Calibration is the process of assigning known con-centrations or known physical values to the sensor signal. Because the relation-ship between sensor output and physical or chemical property is often linear, onlyone or two calibration points is needed.
Combination electrode In a combination electrode, the measuring electrode and reference electrode arecombined in a single body. Often the temperature element is included in the bodyas well.
Common A point in a circuit against which voltages are measured.
Electrode potential Electrode potential is a measure of the tendency of a half reaction to occur as writ-ten. Electrode potentials are stated relative to a reference electrode, which byconvention is the normal hydrogen electrode. The normal hydrogen electrode isassigned a potential of zero volts.
THEORY AND PRACTICE OF pH MEASUREMENT APPENDIX C
GLOSSARY
APPENDIX CGLOSSARY
32
33
THEORY AND PRACTICE OF pH MEASUREMENT APPENDIX C
GLOSSARY
Electrochemical cell An electrochemical cell consists of two half reactions occurring in separate con-tainers connected electrically by a salt bridge. The electrons produced by the oxi-dation half reaction are consumed by the reduction half reaction. Because theelectrons must pass through an external circuit, they can be made to do usefulwork. The drawing below shows a simple electrochemical cell.
The voltage of the electrochemical cell (measured without drawing current fromthe cell) is the algebraic sum of the potentials of the two electrodes.
Electrode Electrochemistry is the study of charge transfer across boundaries. The chargebeing transferred can be ions or electrons. An electrode is a two-phase systemwhere the charge transfer across the interface involves electrons. A real physicalelectrode may incorporate several boundaries.
Electrolyte An electrolyte is a substance that when dissolved in water produces an apprecia-ble concentration of ions. Most salts, mineral acids (sulfuric acid, hydrochloricacid, phosphoric acid, and nitric acid), and most bases are electrolytes.
Equitransferent A solution is equitransferent if the ions have the same mobilities. Potassium chlo-ride is almost equitransferent. The mobility of potassium and chloride differ byonly 2%.
Filling solution The electrolyte solution inside an electrode is called the filling solution. Thebuffered electrolyte solution inside a glass electrode is usually called the internalfilling solution. The solution inside the reference electrode is usually called theexternal filling solution, or, simply, the filling solution. In many industrial referenceelectrodes, the filling solution is not a liquid but is a semi-solid gel.
Glass impedance The overall resistance of the glass membrane to the flow of current. Glass imped-ance is a strong function of temperature. Impedance increases as temperaturedecreases. Temperature corrected glass impedance is a valuable diagnostic tool.Abnormally low impedance implies a cracked or broken glass membrane. Highimpedance suggests that the electrode is nearing the end of its life.
Glass electrode pH measuring electrodes are often called glass electrodes. The electrode is apiece of glass tubing that has a pH-sensitive glass membrane blown onto the end.The tube is filled with a buffered solution of potassium chloride. A silver wire coat-ed with silver chloride contacts the fill solution, and the silver wire is connected tothe electrode lead wire. The entire electrode is sealed."Glass" refers to the pH-sensitive glass membrane in the sensor.
Glass membrane The glass membrane is the pH-sensitive glass piece blown onto the bottom of theglass tube that forms the body of the glass electrode. The pH sensitive glass isusually a bulb, but it can be flat.
Ground Ground usually refers to either earth ground or a common. Earth ground is theearth or a conducting body serving in place of the earth. A common is a point ina circuit to which other voltages are compared. The meaning intended is usuallyclear from the context.
THEORY AND PRACTICE OF pH MEASUREMENT APPENDIX C
GLOSSARY
Ground loop A ground loop exists when a circuit is connected to earth ground at two or morepoints. The potential of the earth varies from point to point, so multiple connec-tions to ground cause currents to flow. If the current flows through a signal carry-ing wire, the result is a noisy, offset signal. In a typical process measurement, thepH sensor is connected through the process liquid to earth ground. If the circuit-ry in the pH transmitter becomes connected to a second earth ground, current willflow through the reference electrode. A voltage, proportional to the current and theelectrode resistance, develops across the reference electrode. Because the volt-age is in series with the other potentials in the cell, the ground loop current caus-es the pH reading to be substantially different from the expected value. pH read-ings affected by ground loops are often noisy as well.
Half reaction A half reaction shows the gain or loss of electrons by a chemical species. The halfreaction for a silver-silver chloride reference electrode is
AgCl (s) + e- = Ag (s) + Cl-
In the half reaction, a silver ion in the silver chloride crystal gains an electron andbecomes a silver atom. The electron consumed by the silver ion comes from asecond half reaction occurring elsewhere in the system.
Isopotential pH The isopotential pH is the pH at which voltage is independent of temperature. Thetransmitter isopotential pH is 7.00. The isopotential pH of the measuring cell maybe different from 7.00. The greater the difference between the transmitter and cellisopotential pH, the greater the error when the calibration and measurement tem-peratures are different.
Isotherm A plot of cell voltage against pH is a straight line. The line is called an isotherm.When temperature changes, the slope of the isotherm changes. Therefore, thepH to which a given cell voltage corresponds depends on temperature. Meterisotherms intersect at the meter isopotential point. Isotherms for pH measurementcells rarely intersect at a single point, but they usually cross in a fairly small area.
Junction box Signal carrying wires are conveniently joined together in a junction box. Usuallythe box contains two terminal strips connected internally point to point. The wiresin one cable are terminated on one strip, and the wires in the other cable are ter-minated on the second strip. The point to point connection between the terminalstrips produces a point to point connection between the wires.
Liquid junction potential A liquid junction potential exists when two dissimilar electrolyte solutions comeinto contact but are not allowed to mix. The potential arises from the differentmobilities of the ions in the contacting solutions. Generally the solution of great-est concentration has the greatest influence on the size of the liquid junctionpotential. Although liquid junction potentials cannot be eliminated, they can bemade small and relatively constant if the concentrated solution contains ions ofequal or nearly equal mobilities.
Measuring electrode A measuring electrode is an electrode for which the potential is proportional to theconcentration or activity of the substance of interest.
Molar concentration Molar concentration is the number of moles of substance dissolved in one liter ofsolution. A mole is a measure of the quantity of ions, molecules, or atoms in a sub-stance.
Nernst equation The Nernst equation relates the potential of an electrode to the concentration oractivity of the chemical substances that appear in the half reaction occurring atthe electrode.
ORP ORP is oxidation-reduction potential. It is the tendency of a chemical species togain or lose electrons at a noble metal electrode. ORP is usually measured in mil-livolts. The type of measuring electrode, the type of reference electrode and thetemperature must be identified when stating the ORP of a sample.
Oxidation Oxidation is the loss of electrons. For example, when an iron (II) ion becomes aniron (III) ion, it is loses an electron: Fe+2 = Fe+3 + e-.
34
THEORY AND PRACTICE OF pH MEASUREMENT APPENDIX C
GLOSSARY
pH Although pH is often defined as the negative common logarithm of the hydrogenion activity, pH is best defined by describing how it is measured. The measure-ment requires three steps. Assemble an electrochemical cell consisting of a glasselectrode, a reference electrode, and the solution. Calibrate the cell by measur-ing the voltage of two standard buffer solutions. Finally, measure the cell voltagewith sample present. Because voltage is directly proportional to pH, the pH of thesample can be calculated from the calibration data. The operational definitionplaces the pH of the sample on the pH scale defined by the buffers.
Platinum electrode A platinum electrode is a noble metal electrode commonly used for measuringORP. The potential developed at the electrode is directly proportional to the ratioof the concentrations of oxidized and reduced substances present in the sample.pH influences the ORP.
Platinum RTD As the name implies, platinum is the sensing element in a platinum RTD. PlatinumRTDs are usually identified in terms of their resistance at 0°C. The resistance ofa platinum RTD changes +0.39% per °C.
Preamplifier (remote) A remote preamplifier, located in either the sensor or in a nearby junction box,boosts the sensor voltage and converts it from high impedance to low impedancebefore sending it to the analyzer. Generally, if the pH signal is to be sent morethan about 15 feet, it should be preamplified.
Reduction Reduction is the gain of electrons. For example, when an iron (III) ion becomesan iron (II) ion, it gains an electron: Fe+3 + e- = Fe+2.
Reference electrode A reference electrode maintains a stable potential independent of the pH or ORPof the sample. The reference electrode also contains a reference junction thatelectrically connects the electrode with the sample. The silver-silver chloride elec-trode is the most common reference electrode in industrial and laboratory appli-cations. The electrode consists of a piece of silver wire plated with silver chloridein contact with a solution of concentrated potassium chloride.
Reference impedance The reference impedance is the overall resistance of the reference electrode tothe flow of current through it. Generally, as the reference junction becomes coat-ed and plugged, the reference impedance increases.
Reference offset When the transmitter reading is forced to match the reading from a second pHmeter, the transmitter calculates the difference between its reading and the sec-ond meter and converts the difference to voltage. The difference is the referenceoffset. If the reference offset exceeds the programmed limit, the transmitter willnot adjust the pH reading.
RTD RTD is an acronym for resistance temperature detector.
Salt bridge A salt bridge provides an electrical connection between two electrolyte solutionswithout permitting the solutions to mix. The classic salt bridge is a U-shaped tubefilled with gelled potassium chloride and plugged at both ends with a porous mate-rial. When the ends are inserted in separate beakers an electrical connection isformed between the beakers. See also Electrochemical Cell.
Shield A shield is a metal braid that encloses the insulated signal carrying wire. Theshield protects the signal wire from extraneous signals.
Solution temperature The pH of many solutions, particularly alkaline ones, is a function of temperature.Therefore, although the concentration of the chemical causing the pH remainsconstant, pH will change if the temperature changes. Solution temperature com-pensation is a technique for converting pH measured at any temperature to thepH at a reference temperature. The almost universal reference temperature is25°C. Different solutions require different solution temperature compensation.
Temperature compensation A plot of voltage against pH is a straight line, called an isotherm. The slope of theisotherm is a function of temperature, so a measured cell voltage corresponds toa different pH, depending on temperature. Temperature compensation is theprocess of selecting the correct isotherm.
35
compensation
Credit Cards for U.S. Purchases Only.
The right people,the right answers,right now.
ON-LINE ORDERING NOW AVAILABLE ON OUR WEB SITEhttp://www.raihome.com
Emerson Process Management
2400 Barranca ParkwayIrvine, CA 92606 USATel: (949) 757-8500Fax: (949) 474-7250
http://www.raihome.com
© Rosemount Analytical Inc. 2010
8