Embed Size (px)
Citation preview

This article was downloaded by: [Tulane University]On: 15 October 2014, At: 06:03Publisher: Taylor & FrancisInforma Ltd Registered in England and Wales Registered Number: 1072954 Registered office: Mortimer House,37-41 Mortimer Street, London W1T 3JH, UK
Separation Science and TechnologyPublication details, including instructions for authors and subscription information:http://www.tandfonline.com/loi/lsst20
Lipophilicity of Flavonoids Estimated by Reversed-Phase High Performance Thin-Layer Chromatography:Chemically Bonded Plates vs. Impregnated Plates withOils, Animal, and Human FatsRodica Domnica Briciu a & Costel Sârbu aa Faculty of Chemistry and Chemical Engineering, Babeş-Bolyai University , Cluj Napoca,RomaniaPublished online: 02 Jun 2010.
To cite this article: Rodica Domnica Briciu & Costel Sârbu (2010) Lipophilicity of Flavonoids Estimated by Reversed-Phase HighPerformance Thin-Layer Chromatography: Chemically Bonded Plates vs. Impregnated Plates with Oils, Animal, and HumanFats, Separation Science and Technology, 45:9, 1275-1285, DOI: 10.1080/01496391003775907
To link to this article: http://dx.doi.org/10.1080/01496391003775907
PLEASE SCROLL DOWN FOR ARTICLE
Taylor & Francis makes every effort to ensure the accuracy of all the information (the “Content”) containedin the publications on our platform. However, Taylor & Francis, our agents, and our licensors make norepresentations or warranties whatsoever as to the accuracy, completeness, or suitability for any purpose of theContent. Any opinions and views expressed in this publication are the opinions and views of the authors, andare not the views of or endorsed by Taylor & Francis. The accuracy of the Content should not be relied upon andshould be independently verified with primary sources of information. Taylor and Francis shall not be liable forany losses, actions, claims, proceedings, demands, costs, expenses, damages, and other liabilities whatsoeveror howsoever caused arising directly or indirectly in connection with, in relation to or arising out of the use ofthe Content.
This article may be used for research, teaching, and private study purposes. Any substantial or systematicreproduction, redistribution, reselling, loan, sub-licensing, systematic supply, or distribution in anyform to anyone is expressly forbidden. Terms & Conditions of access and use can be found at http://www.tandfonline.com/page/terms-and-conditions

Lipophilicity of Flavonoids Estimated by Reversed-PhaseHigh Performance Thin-Layer Chromatography: ChemicallyBonded Plates vs. Impregnated Plates with Oils, Animal, andHuman Fats
Rodica Domnica Briciu and Costel SarbuFaculty of Chemistry and Chemical Engineering, Babes-Bolyai University, Cluj Napoca, Romania
Silica gel plates impregnated with a variety of oils (olive oil,sunflower oil, corn oil, trioctylamine, and paraffin oil) and fats(margarine, butter, cod liver fat, pig fat, sheep fat, pullet fat, andhuman fat) were evaluated and compared with the commerciallyavailable reversed-phases TLC plates (RP-18, RP-18W, andCN). A representative series of flavonoids is employed to evaluatethe suitability of oils and fats as reversed-phases for TLC and toprovide different lipophilicity indices: RM0, scores correspondingto first principal component of RF and/or RM, arithmetic mean ofRF and RM values obtained with solvent mixture containing variousconcentrations of methanol in water. The retention results wereexcellent (r> 0.96) and allowed for accurate estimation of lipophili-city of selected flavonoids and to ranking the lipophilicity of oils andfats when comparing with chemically bonded phases. The humanfat-impregnated plates provided lipophilicity values closely associa-ted with those obtained for margarine and butter. Moreover, thehuman fat lipophilic character seems to be placed between pulletand cod fats. Concerning the lipophilicity scale of vegetable oils,it is worth noting that the corn oil presents the highest lipophilicity,closely followed by the sunflower and olive oils.
Keywords animal fats; human fat; lipophilicity; PCA; RP-TLC;vegetable oils
INTRODUCTION
Each year an increasing number of bioactive compoundswith different therapeutic effects are synthesized andintroduced on the market. In many cases the biologicaland biochemical effects are based on their physicochemicalproperties such as lipophilicity or solubility. The lipo-philicity has been defined by IUPAC as the affinity of amolecule for a lipophilic environment and it is measuredby its distribution behavior in a biphasic system eitherliquid-liquid or solid-liquid (1). This particular property
is usually associated with an increased biological activity,poorer aqueous solubility, faster metabolization andelimination, increased plasma protein binding, sometimesshorter duration of action. It plays also an important rolein the pharmacodynamic and toxicological profile of drugs(2,3). Lipophilicity is usually expressed by the partitioncoefficient, denoted in few different ways, frequentlydepending on the determination method (Log P, Logkw, Log Kow). However, the real importance of thelipophilicity has been defined within the Quantitative Struc-ture-Activity Relationship (QSAR), Quantitative Structure-Retention Relationship (QSRR), or QuantitativeStructure-Property Relationship (QSPR) approaches (4).Over Hansch (5), the lipophilic character and at the sametime the biological activity of compounds are strongly influ-enced by the molecular substituents. A similar effect may becaused by the environment in which the molecule is actuallyplaced. For predicting a given physicochemical or biologicalproperty the relationship between the chemical structure ofthe investigated compounds and the desired property mustbe identified. Furthermore, the goals of the QSAR testsare to create a realistic insight into the ability of a com-pound to cross the fat biological barriers formed by thecellular membrane.
Determination of the partition coefficient by theequilibration method using the classical shake-flask tech-nique has a series of disadvantages (is very tedious, requiresrelatively large amounts of pure solutes to be examined,and it is limited to log Kow values between �2 and þ4)and has been successfully replaced by chromatographicmethods. The advantages of Reversed-Phase High Per-formance Thin-Layer Chromatography (RP-HPTLC)methods consist of the very small amounts of samplesneeded for the estimation and the less strict requirementof purity because the impurities separate during the chro-matographic process. They are rapid and relatively simple,low cost, and easy to perform. In addition, we have tostress the dynamic aspect of the chromatographic process
Received 12 June 2009; accepted 4 February 2010.Address correspondence to Costel Sarbu, Faculty of Chemis-
try and Chemical Engineering, Babes-Bolyai University, AranyJanos Str. No. 11, Cluj Napoca, RO-400028, Romania. Tel.:þ40-264-593833; Fax: þ40-264-590818. E-mail: [email protected]
Separation Science and Technology, 45: 1275–1285, 2010
Copyright # Taylor & Francis Group, LLC
ISSN: 0149-6395 print=1520-5754 online
DOI: 10.1080/01496391003775907
1275
Dow
nloa
ded
by [
Tul
ane
Uni
vers
ity]
at 0
6:03
15
Oct
ober
201
4

and the wide choice of stationary phases and developingsolvents. A lot of lipophilicity studies were based onRP-18 stationary phases and good correlation betweenlog Kow and RM0 or isocratic RM values were related (6,7). Furthermore, the possibility of impregnation of theHPTLC plates with a series of natural or synthetic materi-als including oils and fats (more or less similar with the lipi-dic biological membranes) might be one of the mostrealistic alternatives. Over the years, the paraffin oil (8–12) nearby silicon oil (13,14) and ethyl oleate (15) wereoften used for silica gel plates impregnation in order tochange the stationary phase characteristics. The chemicalcomposition of the vegetable oils and derived productsindicates a high amount of triglycerides, free fatty acids(especially oleic and linoleic acid), phytosterols, lipophilicvitamins, and traces of minerals (16,17). On the other side,the animal fats present a high concentration of saturatedfatty acids and cholesterol (18).
The purpose of this work is to investigate the feasibilityof silica gel plates impregnated with a variety of oils andfats and to compare them with the commercially availablereversed-phases HPTLC plates. In this order, the lipophili-city of some flavonoids has been determined using mobilephases containing various concentrations of methanol inwater and estimated by different indices. In addition, thescores obtained applying the Principal Component Analy-sis (PCA) offer the possibility to get a new lipophilcity scaleand the lipophilcity chart of compounds and thereversed-phases investigated; eigenvalues and eigenvectors(loadings) giving new insights about the chromatographicmechanism and the behavior of compounds.
THEORY
RP-HPTLC provides a variety of indices (descriptors)that can be used as lipophilicity estimators (19,20). Themost popular lipophilicity indices measured by RP-HPTLC are derived by the retention RF values accordingto the linear relationship described by the Soczewinski-Wachtmeister equation:
RM ¼ RM0 þ bC; ð1Þ
where RM is defined by Bate-Smith and Westall (21)through the following formula
RM ¼ log1
RF� 1
� �: ð2Þ
The RM0 indicates the extrapolated value to the pure wateras mobile phase and it is the HPTLC descriptor most fre-quently used into QSAR=QSPR=QSRR analysis. b repre-sents the slope and it is directly related to the specificsurface area of the stationary phase, while C representsthe volume fraction of the organic solvent in the mobile
phase. The slope of the linear regression equation is alsoconsidered an alternative descriptor of lipophilicity. Thearithmetic mean of RM (mRM) and=or RF (mRF) valuesobtained for all values of C may be used as well as thelipophilicity indices (22). It is also possible to obtain anew lipophilicity scale applying PCA directly to the matrixof retention data resulted for all compounds and combina-tions of methanol-water (RF and=or RM values obtainedfor all values of C). Usually, the first few componentsaccount for all information in raw data. The characteristicsof each principal component are the scores (in our case,linear combinations of retention indices) relating to theinvestigated compounds and loadings (contribution of theraw variable or measurement to each component). Inaddition, a careful investigation of eigenvalues and eigen-vectors (loadings) can offer useful information concerningthe chromatographic behavior of the compounds and theretention mechanism (23–27). All these lipophilicitydescriptors and graphs are computed through the Statistica7.0 program (28).
EXPERIMENTAL
All the compounds and solvents were obtained from acommercial source (Merck, Fluka, and Sigma) in analyticaldegree purity. The oils (paraffin, trioctylamine-TOA, olive,sunflower, corn, cod liver) and fats (margarine, butter, pig,sheep, pullet) used for the impregnation were from thelocal market; woman fat was obtained from liposuctionsurgery. The standard solutions of flavonoids (1: flavone;2: 20-methoxyflavone; 3: 3-methoxyflavone; 4: 5-methoxy-flavone; 5: 6-methoxyflavone; 6: 7-methoxyflavone; 7:7,8-dimethoxyflavone; 8: 3-hydroxy-7-methoxyflavone; 9:3-hydroxyflavone; 10: 5-hydroxyflavone; 11: 6-hydroxyfla-vone; 12: 7-hydroxyflavone; 13: 3,6-dihydroxyflavone; 14:3,7-dihydroxyflavone; 15: chrysine; 16: apigenin; 17: baica-lein; 18: galangin; 19: kaempferol; 20: luteolin; 21: quer-cetin; 22: fisetin; 23: geraldol; 24: 6-methylflavone; 25:6-chloro-7-methylflavone; 26: daidzein) were prepared inmethanol (1mg mL�1). The spots (1 mL) were applied at1.5 cm from bottom edge and at 0.7 cm from lateral edgesusing a Hamilton microsyringe of 10 mL. The distancebetween the spots was by 0.7 cm. The elution was per-formed by ascendant development into a chromatographicchamber previously saturated for 10 minutes. Three typesof chemically bonded stationary phases were used nearby other twelve types of fat-impregnated plates. The chemi-cally bonded plates were by RP-18 silica gel 60 modifiedwith aliphatic hydrocarbons of increasing hydrocarbonchain length resulting in increased hydrophobic, the specialHPTLC RP-18W with a defined lower degree of surfacemodification can be wetted and developed even with purewater and the CN-modified plate which are based on a sil-ica gel 60 modified with cyanopropyl groups. The silica gel60 F254 plates (10� 20 cm) were impregnated with 10%
1276 R. D. BRICIU AND C. SARBU
Dow
nloa
ded
by [
Tul
ane
Uni
vers
ity]
at 0
6:03
15
Oct
ober
201
4

TABLE
1Thelipophilicityindices
obtained
onchem
icallybonded
(RP-18,RP-18W,CN)andparaffin-impregnatedplates
RP-18
RP-18W
CN
Paraffin
Compound
mR
FmR
MR
M0
PC1R
FPC1R
MmR
FmR
MR
M0
PC1R
FPC1R
MmR
FmR
MR
M0
PC1R
FPC1R
MmR
FmR
MR
M0
PC1R
FPC1R
M
Flavone
0.215
0.616
3.667
0.226
�0.450
0.271
0.454
2.400
0.013
0.020
0.334
0.313
1.873
�0.059
0.161
0.347
0.297
2.381
0.247
�0.432
20 -methoxyflavone
0.187
0.706
3.991
0.290
�0.654
0.237
0.541
2.650
0.089
�0.178
0.314
0.357
2.053
�0.014
0.061
0.324
0.363
2.969
0.304
�0.609
3-m
ethoxyflavone
0.199
0.664
3.799
0.262
�0.559
0.248
0.513
2.607
0.065
�0.117
0.324
0.335
2.007
�0.037
0.111
0.305
0.395
2.804
0.341
�0.666
5-m
ethoxyflavone
0.194
0.670
3.576
0.274
�0.571
0.235
0.542
2.559
0.092
�0.179
0.370
0.241
1.757
�0.141
0.324
0.414
0.181
3.356
0.122
�0.241
6-m
ethoxyflavone
0.143
0.858
4.228
0.390
�0.996
0.209
0.613
2.697
0.151
�0.338
0.313
0.367
2.449
�0.013
0.033
0.349
0.334
3.950
0.269
�0.600
7-m
ethoxyflavone
0.175
0.736
3.855
0.317
�0.719
0.214
0.598
2.608
0.140
�0.302
0.296
0.396
2.151
0.025
�0.028
0.370
0.275
3.511
0.218
�0.451
7,8-dim
ethoxyflavone0.209
0.629
3.593
0.240
�0.480
0.236
0.537
2.401
0.091
�0.162
0.332
0.320
2.064
�0.055
0.142
0.410
0.190
3.339
0.129
�0.259
3-hydroxy-7-
methoxyflavone
0.144
0.850
4.141
0.387
�0.978
0.159
0.777
3.165
0.262
�0.711
0.192
0.641
1.963
0.260
�0.568
0.274
0.482
3.315
0.413
�0.879
3-hydroxyflavone
0.164
0.771
3.812
0.343
�0.796
0.204
0.633
2.945
0.161
�0.391
0.258
0.486
2.331
0.112
�0.231
0.306
0.399
3.076
0.347
�0.685
5-hydroxyflavone
0.122
0.941
4.313
0.437
�1.180
0.194
0.666
3.035
0.184
�0.464
0.207
0.605
2.116
0.226
�0.489
0.241
0.562
3.408
0.486
�1.049
6-hydroxyflavone
0.327
0.338
2.957
�0.026
0.176
0.315
0.349
1.850
�0.087
0.265
0.388
0.209
1.955
�0.181
0.390
0.513
�0.030
2.734
�0.103
0.247
7-hydroxyflavone
0.353
0.284
2.789
�0.083
0.298
0.311
0.360
2.002
�0.078
0.235
0.391
0.206
2.198
�0.189
0.393
0.718
�0.416
0.798
�0.591
1.175
3,6-dihydroxyflavone
0.294
0.419
3.461
0.047
�0.011
0.287
0.413
2.167
�0.025
0.116
0.324
0.341
2.273
�0.038
0.093
0.443
0.113
3.108
0.056
�0.080
3,7-dihydroxyflavone
0.292
0.417
3.168
0.054
�0.004
0.263
0.478
2.579
0.031
�0.039
0.299
0.399
2.478
0.018
�0.039
0.585
�0.158
1.613
�0.281
0.581
Chrysine
0.273
0.462
3.178
0.096
�0.104
0.271
0.472
3.087
0.014
�0.042
0.219
0.566
1.820
0.200
�0.399
0.644
�0.266
1.110
�0.423
0.839
Apigenin
0.463
0.070
2.481
�0.332
0.776
0.320
0.353
2.576
�0.095
0.235
0.268
0.461
2.243
0.088
�0.174
0.740
�0.463
0.605
�0.644
1.286
Baicalein
0.315
0.354
2.447
0.002
0.147
0.282
0.427
2.282
�0.012
0.082
0.319
0.346
2.003
�0.025
0.086
0.540
�0.071
0.834
�0.199
0.440
Galangin
0.255
0.507
3.386
0.135
�0.205
0.239
0.545
2.970
0.085
�0.198
0.171
0.714
2.341
0.307
�0.736
0.555
�0.105
1.881
�0.210
0.455
Kaem
pferol
0.442
0.107
2.321
�0.282
0.695
0.296
0.396
2.253
�0.044
0.150
0.252
0.502
2.436
0.124
�0.268
0.719
�0.434
1.464
�0.583
1.177
Luteolin
0.559
�0.108
1.870
�0.544
1.178
0.286
0.416
2.237
�0.022
0.106
0.312
0.361
2.067
�0.010
0.051
0.346
0.278
0.645
0.218
�0.290
Quercetin
0.493
0.014
2.273
�0.396
0.903
0.277
0.427
1.677
�0.003
0.100
0.277
0.431
1.786
0.070
�0.100
0.351
0.267
0.537
0.204
�0.261
Fisetin
0.553
�0.097
1.667
�0.530
1.158
0.287
0.405
1.668
�0.025
0.147
0.312
0.350
1.403
�0.009
0.086
0.598
�0.176
0.824
�0.327
0.666
Geraldol
0.438
0.119
2.951
�0.277
0.661
0.210
0.589
1.931
0.145
�0.263
0.219
0.565
1.802
0.199
�0.397
0.584
�0.160
1.866
�0.273
0.574
6-m
ethylflavone
0.140
0.875
4.408
0.395
�1.036
0.197
0.660
3.134
0.178
�0.455
0.249
0.503
2.190
0.131
�0.265
0.296
0.444
3.711
0.375
�0.819
6-chloro-7-
methylflavone
0.081
1.171
4.926
0.530
�1.698
0.139
0.867
3.680
0.306
�0.923
0.165
0.747
2.769
0.320
�0.816
0.192
0.753
4.471
0.597
�1.518
Daidzein
0.639
�0.263
2.051
�0.723
1.521
0.487
0.024
2.000
�0.469
0.971
0.479
0.039
1.540
�0.384
0.774
0.761
�0.509
0.400
�0.693
1.398
1277
Dow
nloa
ded
by [
Tul
ane
Uni
vers
ity]
at 0
6:03
15
Oct
ober
201
4

TABLE
2Thelipophilicityindices
obtained
onTOA,olive,
sunflower
andcorn-impregnatedplates
TOA
Olive
Sunflower
Corn
Compound
mR
FmR
MR
M0
PC1/
RF
PC1/
RM
mR
FmR
MR
M0
PC1/
RF
PC1/
RM
mR
FmR
MR
M0
PC1/
RF
PC1/
RM
mR
FmR
MR
M0
PC1/
RF
PC1/
RM
Flavone
0.579
�0.142
1.023
�0.360
0.833
0.322
0.349
2.391
0.209
�0.374
0.234
0.530
1.838
0.106
�0.126
0.307
0.377
2.360
0.192
�0.319
20 -methoxyflavone
0.596
�0.172
0.743
�0.405
0.922
0.330
0.334
2.501
0.194
�0.347
0.212
0.587
1.938
0.156
�0.255
0.317
0.365
2.649
0.171
�0.298
3-m
ethoxyflavone
0.470
0.053
1.428
�0.114
0.416
0.287
0.424
2.559
0.286
�0.544
0.191
0.641
1.840
0.205
�0.375
0.277
0.451
2.619
0.259
�0.487
5-m
ethoxyflavone
0.761
�0.508
0.374
�0.772
1.624
0.400
0.193
2.489
0.041
�0.041
0.307
0.375
2.205
�0.064
0.214
0.405
0.180
2.262
�0.027
0.118
6-m
ethoxyflavone
0.567
�0.120
0.928
�0.337
0.797
0.274
0.457
2.674
0.315
�0.621
0.158
0.740
1.858
0.280
�0.596
0.258
0.497
2.728
0.301
�0.591
7-m
ethoxyflavone
0.655
�0.282
0.562
�0.539
1.152
0.320
0.352
2.442
0.214
�0.382
0.185
0.671
2.295
0.215
�0.446
0.332
0.317
1.935
0.135
�0.177
7,8-dim
ethoxyflavone
0.750
�0.480
0.137
�0.754
1.590
0.364
0.258
2.167
0.117
�0.167
0.248
0.510
2.414
0.068
�0.091
0.357
0.269
2.031
0.080
�0.074
3-hydroxy-7-
methoxyflavone
0.248
0.558
3.615
0.397
�0.792
0.173
0.732
2.996
0.534
�1.230
0.109
0.955
2.811
0.388
�1.082
0.126
0.867
2.351
0.596
�1.400
3-hydroxyflavone
0.250
0.535
3.233
0.383
�0.720
0.210
0.617
2.756
0.452
�0.970
0.116
0.914
2.586
0.372
�0.990
0.148
0.779
2.062
0.546
�1.199
5-hydroxyflavone
0.259
0.507
3.037
0.360
�0.649
0.144
0.819
2.801
0.595
�1.410
0.079
1.095
2.518
0.459
�1.391
0.098
0.987
2.317
0.658
�1.663
6-hydroxyflavone
0.572
�0.127
0.278
�0.369
0.876
0.490
0.019
1.957
�0.163
0.359
0.307
0.368
1.840
�0.060
0.233
0.418
0.146
1.218
�0.057
0.215
7-hydroxyflavone
0.675
�0.323
0.687
�0.577
1.223
0.715
�0.401
0.242
�0.682
1.341
0.454
0.082
1.207
�0.386
0.877
0.748
�0.475
0.185
�0.795
1.610
3,6-dihydroxyflavone
0.275
0.519
4.074
0.340
�0.785
0.353
0.282
2.263
0.139
�0.224
0.211
0.593
2.084
0.157
�0.270
0.291
0.395
1.514
0.226
�0.339
3,7-dihydroxyflavone
0.325
0.335
2.042
0.206
�0.209
0.435
0.117
1.428
�0.049
0.170
0.290
0.395
1.456
�0.019
0.177
0.512
�0.021
1.232
�0.268
0.584
Chrysine
0.404
0.208
3.110
0.064
�0.078
0.572
�0.127
0.560
�0.363
0.734
0.309
0.358
1.479
�0.060
0.259
0.549
�0.088
1.241
�0.351
0.733
Apigenin
0.331
0.479
5.869
0.257
�0.886
0.727
�0.436
0.813
�0.702
1.391
0.447
0.095
1.364
�0.372
0.844
0.700
�0.375
0.675
�0.688
1.378
Baicalein
0.346
0.286
1.662
0.152
�0.076
0.578
�0.140
0.865
�0.372
0.748
0.450
0.090
1.426
�0.379
0.856
0.482
0.031
0.858
�0.201
0.476
Galangin
0.169
0.911
5.779
0.560
�1.734
0.379
0.221
1.586
0.076
�0.063
0.196
0.628
1.856
0.194
�0.346
0.382
0.217
1.760
0.023
0.047
Kaem
pferol
0.302
0.489
5.076
0.314
�0.804
0.591
�0.161
0.727
�0.401
0.800
0.356
0.265
1.645
�0.171
0.463
0.660
�0.325
2.211
�0.596
1.234
Luteolin
0.226
0.691
4.916
0.446
�1.211
0.304
0.364
1.240
0.234
�0.358
0.359
0.270
2.288
�0.185
0.446
0.324
0.321
0.884
0.153
�0.164
Quercetin
0.212
0.615
2.838
0.450
�0.838
0.394
0.191
1.242
0.038
0.017
0.353
0.281
2.190
�0.170
0.424
0.352
0.268
0.996
0.091
�0.048
Fisetin
0.264
0.587
4.897
0.373
�1.004
0.616
�0.205
0.188
�0.464
0.917
0.492
0.015
1.266
�0.473
1.024
0.636
�0.244
0.367
�0.545
1.096
Geraldol
0.375
0.324
4.697
0.150
�0.469
0.577
�0.135
0.610
�0.372
0.749
0.393
0.195
1.562
�0.253
0.620
0.514
�0.026
1.820
�0.270
0.583
6-m
ethylflavone
0.532
�0.059
1.553
�0.243
0.618
0.267
0.474
2.608
0.329
�0.655
0.179
0.687
2.259
0.229
�0.481
0.193
0.662
2.690
0.447
�0.955
6-chloro-7-
methylflavone
0.310
0.388
2.859
0.254
�0.398
0.141
0.841
3.089
0.602
�1.470
0.077
1.115
2.729
0.463
�1.437
0.097
1.059
3.682
0.662
�1.852
Daidzein
0.531
�0.058
1.731
�0.235
0.602
0.772
�0.534
0.287
�0.808
1.628
0.597
�0.173
0.549
�0.698
1.449
0.724
�0.420
�0.138
�0.742
1.494
1278
Dow
nloa
ded
by [
Tul
ane
Uni
vers
ity]
at 0
6:03
15
Oct
ober
201
4

TABLE
3Thelipophilicityindices
obtained
onmargarine,
butter
andcodliver-impregnatedplates
Margarine
Butter
CodLiver
Compound
mR
FmR
MR
M0
PC1=R
FPC1=R
MmR
FmR
MR
M0
PC1=R
FPC1=R
MmR
FmR
MR
M0
PC1=R
FPC1=R
M
Flavone
0.391
0.207
2.319
�0.095
0.271
0.390
0.219
2.680
�0.113
0.291
0.320
0.361
2.690
�0.012
0.068
20 -methoxyflavone
0.381
0.234
2.748
�0.074
0.199
0.384
0.234
2.897
�0.102
0.257
0.299
0.409
2.795
0.036
�0.040
3-m
ethoxyflavone
0.363
0.268
2.720
�0.034
0.126
0.357
0.281
2.624
�0.038
0.156
0.272
0.464
2.643
0.098
�0.159
5-m
ethoxyflavone
0.427
0.139
2.479
�0.177
0.414
0.453
0.091
2.558
�0.256
0.580
0.344
0.306
2.404
�0.065
0.194
6-m
ethoxyflavone
0.334
0.337
3.042
0.030
�0.036
0.335
0.332
2.893
0.009
0.042
0.240
0.543
2.757
0.169
�0.337
7-m
ethoxyflavone
0.380
0.235
2.759
�0.073
0.198
0.387
0.224
2.798
�0.108
0.282
0.285
0.425
2.295
0.069
�0.067
7,8-dim
ethoxyflavone
0.434
0.124
2.386
�0.192
0.449
0.430
0.143
2.903
�0.209
0.462
0.336
0.318
2.241
�0.046
0.171
3-hydroxy-7-m
ethoxyflavone
0.190
0.685
3.055
0.359
�0.801
0.171
0.753
3.338
0.388
�0.903
0.139
0.844
3.012
0.396
�1.008
3-hydroxyflavone
0.209
0.622
2.783
0.317
�0.654
0.209
0.640
3.240
0.299
�0.646
0.163
0.747
2.583
0.344
�0.786
5-hydroxyflavone
0.233
0.588
3.451
0.259
�0.601
0.198
0.671
3.236
0.327
�0.719
0.137
0.841
2.712
0.403
�0.996
6-hydroxyflavone
0.520
�0.039
2.103
�0.382
0.814
0.534
�0.066
2.316
�0.434
0.934
0.412
0.166
2.007
�0.217
0.512
7-hydroxyflavone
0.589
�0.164
1.456
�0.531
1.107
0.629
�0.237
1.138
�0.628
1.318
0.554
�0.095
0.468
�0.530
1.112
3,6-dihydroxyflavone
0.334
0.323
2.468
0.034
0.011
0.343
0.319
2.950
�0.009
0.068
0.282
0.438
2.506
0.075
�0.100
3,7-dihydroxyflavone
0.341
0.294
1.491
0.026
0.102
0.313
0.367
2.429
0.066
�0.035
0.338
0.308
1.934
�0.050
0.197
Chrysine
0.488
0.023
1.813
�0.308
0.686
0.437
0.117
1.825
�0.207
0.526
0.403
0.181
1.890
�0.196
0.479
Apigenin
0.588
�0.159
1.044
�0.527
1.108
0.602
�0.192
1.701
�0.577
1.215
0.523
�0.041
1.424
�0.464
0.981
Baicalein
0.144
0.967
5.235
0.460
�1.483
0.115
0.953
3.298
0.523
�1.350
0.234
0.610
3.903
0.180
�0.502
Galangin
0.338
0.310
2.156
0.028
0.048
0.315
0.366
2.512
0.060
�0.034
0.272
0.451
2.221
0.097
�0.125
Kaem
pferol
0.498
0.004
1.580
�0.328
0.736
0.443
0.107
2.235
�0.227
0.546
0.261
0.466
1.830
0.123
�0.150
Luteolin
0.103
0.984
2.825
0.562
�1.454
0.092
1.020
2.496
0.578
�1.492
0.100
0.959
1.543
0.487
�1.240
Quercetin
0.163
0.726
1.859
0.428
�0.857
0.133
0.857
2.815
0.481
�1.133
0.262
0.513
3.384
0.117
�0.280
Fisetin
0.232
0.540
2.038
0.270
�0.455
0.192
0.646
2.125
0.350
�0.657
0.223
0.549
1.354
0.212
�0.331
Geraldol
0.272
0.446
1.974
0.179
�0.249
0.246
0.535
2.999
0.215
�0.413
0.319
0.338
1.515
�0.006
0.138
6-m
ethylflavone
0.297
0.417
3.038
0.114
�0.210
0.309
0.400
3.206
0.068
�0.113
0.231
0.578
�0.020
0.187
�0.421
6-chloro-7-m
ethylflavone
0.185
0.742
3.879
0.369
�0.948
0.177
0.768
3.967
0.370
�0.940
0.130
0.899
3.360
0.417
�1.135
Daidzein
0.673
�0.329
1.206
�0.717
1.478
0.717
�0.436
1.739
�0.828
1.761
0.637
�0.255
1.378
�0.718
1.457
1279
Dow
nloa
ded
by [
Tul
ane
Uni
vers
ity]
at 0
6:03
15
Oct
ober
201
4

TABLE
4Thelipophilicityindices
obtained
onhuman,pig,sheepandpullet
fat-im
pregnatedplates
Human
Pig
Sheep
Pullet
Compound
mR
FmR
MR
M0PC1R
FPC1R
MmR
FmR
MR
M0PC1R
FPC1R
MmR
FmR
MR
M0PC1R
FPC1R
MmR
FmR
MR
M0PC1R
FPC1R
M
Flavone
0.370
0.2552.485�0.009
0.111
0.498
0.0062.037�0.150
0.311
0.497
0.0071.976�0.201
0.453
0.480
0.0382.173�0.110
0.217
20 -methoxyflavone
0.392
0.1910.581�0.076
0.385
0.471
0.0542.271�0.092
0.205
0.489
0.0232.241�0.185
0.413
0.454
0.0902.572�0.052
0.104
3-m
ethoxyflavone
0.344
0.3062.440
0.046
0.001
0.449
0.0962.249�0.041
0.112
0.476
0.0462.137�0.155
0.363
0.434
0.1262.509�0.007
0.024
5-m
ethoxyflavone
0.448
0.1042.699�0.179
0.406
0.502�0.0041.972�0.159
0.334
0.539�0.0701.798�0.295
0.624
0.486
0.0272.328�0.123
0.245
6-m
ethoxyflavone
0.328
0.3492.910
0.085
�0.118
0.416
0.1602.515
0.032
�0.030
0.435
0.1232.298�0.064
0.192
0.400
0.1942.760
0.068
�0.127
7-m
ethoxyflavone
0.387
0.2292.881�0.042
0.135
0.465
0.0652.265�0.078
0.181
0.480
0.0371.986�0.164
0.386
0.445
0.1052.515�0.032
0.072
7,8-dim
ethoxyflavone
0.429
0.1412.724�0.137
0.327
0.500
0.0012.156�0.155
0.323
0.532�0.0591.816�0.280
0.598
0.490
0.0192.209�0.132
0.262
3-hydroxy-7-
methoxyflavone
0.177
0.7233.032
0.413
�0.904
0.239
0.5372.708
0.430
�0.875
0.157
0.7552.417
0.565
�1.216
0.273
0.4662.988
0.354
�0.737
3-hydroxyflavone
0.214
0.6082.754
0.331
�0.645
0.262
0.4832.769
0.377
�0.754
0.231
0.5381.954
0.400
�0.730
0.290
0.4262.929
0.315
�0.649
5-hydroxyflavone
0.207
0.6493.280
0.350
�0.767
0.296
0.4153.150
0.299
�0.600
0.329
0.3392.766
0.175
�0.299
0.279
0.4452.805
0.340
�0.690
6-hydroxyflavone
0.532�0.0612.550�0.365
0.763
0.599�0.1882.095�0.377
0.745
0.625�0.2301.373�0.484
0.985
0.574�0.1371.892�0.319
0.610
7-hydroxyflavone
0.605�0.1891.024�0.541
1.143
0.700�0.3700.274�0.596
1.149
0.717�0.4060.272�0.683
1.388
0.696�0.3660.759�0.590
1.114
3,6-dihydroxyflavone
0.359
0.2812.694
0.017
0.037
0.459
0.0782.366�0.066
0.151
0.361
0.2541.386
0.110
�0.091
0.449
0.0952.237�0.040
0.092
3,7-dihydroxyflavone
0.323
0.3492.493
0.093
�0.082
0.436
0.1161.437�0.010
0.065
0.344
0.2820.905
0.149
�0.147
0.436
0.1181.892�0.009
0.039
Chrysine
0.449
0.0911.386�0.194
0.534
0.568�0.1211.120�0.304
0.594
0.598�0.1740.610�0.419
0.870
0.559�0.1051.169�0.284
0.534
Apigenin
0.565�0.1160.787�0.456
1.005
0.672�0.3221.112�0.538
1.043
0.710�0.3950.690�0.669
1.359
0.638�0.2480.575�0.460
0.851
Baicalein
0.261
0.7326.490
0.161
�0.948
0.123
0.8561.354
0.694
�1.591
0.060
1.2523.436
0.785
�2.335
0.151
0.7511.247
0.628
�1.386
Galangin
0.346
0.2962.241
0.042
0.046
0.435
0.1211.926�0.009
0.054
0.404
0.1700.665
0.016
0.105
0.431
0.1251.534
0.001
0.017
Kaem
pferol
0.478
0.0411.912�0.252
0.601
0.419
0.1501.911
0.025
�0.011
0.442
0.1031.052�0.070
0.247
0.407
0.1640.739
0.055
�0.072
Luteolin
0.186
0.7564.187
0.400
�1.059
0.134
0.8161.588
0.669
�1.502
0.098
1.0133.084
0.698
�1.797
0.130
0.8271.259
0.675
�1.554
Quercetin
0.268
0.4853.092
0.218
�0.406
0.180
0.6762.054
0.565
�1.187
0.143
0.7841.537
0.600
�1.270
0.174
0.6871.795
0.577
�1.239
Fisetin
0.254
0.5924.524
0.254
�0.759
0.184
0.6561.657
0.556
�1.142
0.240
0.5232.284
0.378
�0.700
0.226
0.5411.515
0.460
�0.912
Geraldol
0.267
0.4923.150
0.220
�0.426
0.366
0.2411.245
0.147
�0.216
0.262
0.4722.269
0.329
�0.585
0.369
0.2462.100
0.140
�0.249
6-m
ethylflavone
0.337
0.3453.385
0.068
�0.147
0.417
0.1632.843
0.029
�0.038
0.441
0.1092.223�0.076
0.221
0.396
0.1962.191
0.079
�0.136
6-chloro-7-
methylflavone
0.213
0.6603.832
0.339
�0.837
0.247
0.5383.291
0.411
�0.878
0.301
0.4073.172
0.236
�0.451
0.254
0.5233.379
0.396
�0.862
Daidzein
0.714�0.4060.733�0.787
1.604
0.742�0.4690.749�0.692
1.372
0.721�0.4200.656�0.695
1.416
0.835�0.7902.322�0.902
2.082
1280
Dow
nloa
ded
by [
Tul
ane
Uni
vers
ity]
at 0
6:03
15
Oct
ober
201
4
diethyl ether solution of fats, except for pig, sheep andpullet fats, which were prepared as 5% solution. The waterpresence in the margarine and butter led to the necessity ofits elimination from the etheric solutions by using a separ-ation funnel previously of impregnation. The pig, pullet,and sheep fats used as raw material were extracted fromthe natural membranes by heating to melting point fol-lowed by a filtration. The obtained fats were used for theimpregnation as 5% diethyl ether solution. The humanfat was simply dissolved in the diethyl ether by using a por-celain mortar. The impregnation was performed by ascend-ant development.
The mobile phases containing different mixtures ofmethanol and water were optimized for each stationaryphase’s type in order to obtain a significant increase ofmigration of the compounds while the elution step waschanged. In each case were performed 5 steps at differentfraction of methanol between 65% and 85% for RP-18,between 55% and 75% for RP-18W, pig, sheep, pulletand between 50% and 70% for CN, paraffin, TOA, olive,sunflower, corn, margarine, butter, cod liver, and humanfat in 5% increments.
RESULTS AND DISCUSSION
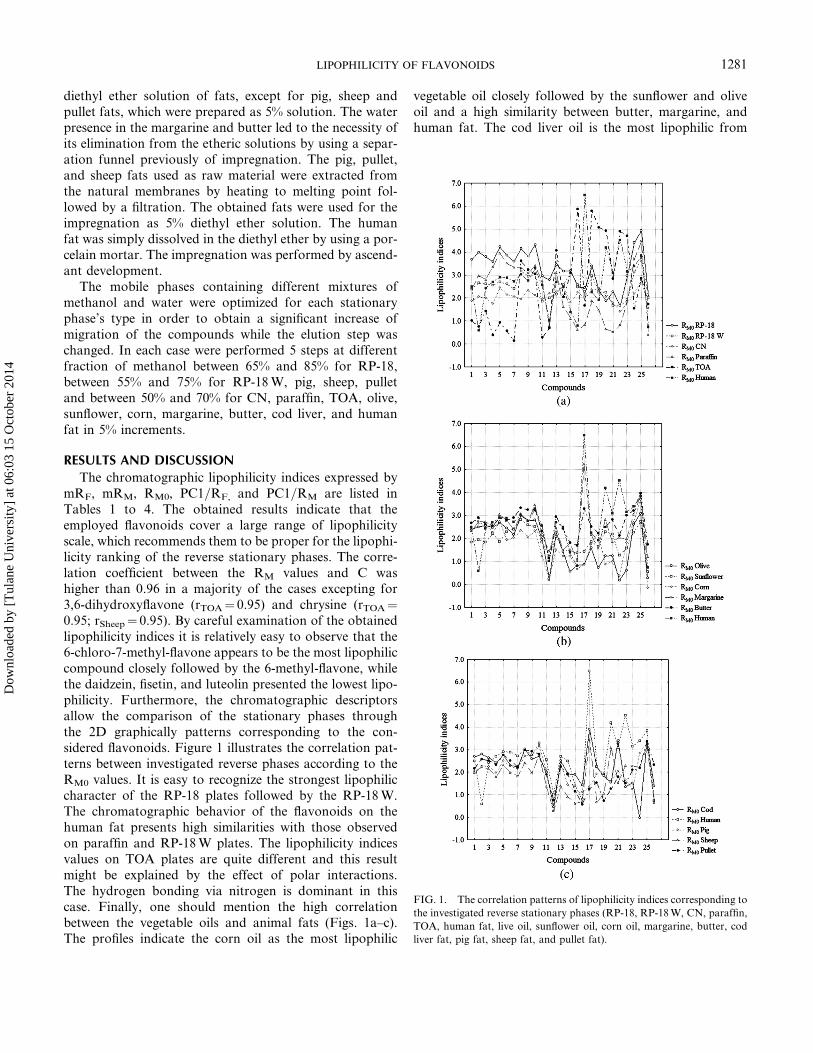
The chromatographic lipophilicity indices expressed bymRF, mRM, RM0, PC1=RF, and PC1=RM are listed inTables 1 to 4. The obtained results indicate that theemployed flavonoids cover a large range of lipophilicityscale, which recommends them to be proper for the lipophi-licity ranking of the reverse stationary phases. The corre-lation coefficient between the RM values and C washigher than 0.96 in a majority of the cases excepting for3,6-dihydroxyflavone (rTOA¼ 0.95) and chrysine (rTOA¼0.95; rSheep¼ 0.95). By careful examination of the obtainedlipophilicity indices it is relatively easy to observe that the6-chloro-7-methyl-flavone appears to be the most lipophiliccompound closely followed by the 6-methyl-flavone, whilethe daidzein, fisetin, and luteolin presented the lowest lipo-philicity. Furthermore, the chromatographic descriptorsallow the comparison of the stationary phases throughthe 2D graphically patterns corresponding to the con-sidered flavonoids. Figure 1 illustrates the correlation pat-terns between investigated reverse phases according to theRM0 values. It is easy to recognize the strongest lipophiliccharacter of the RP-18 plates followed by the RP-18W.The chromatographic behavior of the flavonoids on thehuman fat presents high similarities with those observedon paraffin and RP-18W plates. The lipophilicity indicesvalues on TOA plates are quite different and this resultmight be explained by the effect of polar interactions.The hydrogen bonding via nitrogen is dominant in thiscase. Finally, one should mention the high correlationbetween the vegetable oils and animal fats (Figs. 1a–c).The profiles indicate the corn oil as the most lipophilic
vegetable oil closely followed by the sunflower and oliveoil and a high similarity between butter, margarine, andhuman fat. The cod liver oil is the most lipophilic from
FIG. 1. The correlation patterns of lipophilicity indices corresponding to
the investigated reverse stationary phases (RP-18, RP-18W, CN, paraffin,
TOA, human fat, live oil, sunflower oil, corn oil, margarine, butter, cod
liver fat, pig fat, sheep fat, and pullet fat).
LIPOPHILICITY OF FLAVONOIDS 1281
Dow
nloa
ded
by [
Tul
ane
Uni
vers
ity]
at 0
6:03
15
Oct
ober
201
4

the animal fats series, while the rest of them are highlycorrelated.
By applying PCA to the data matrices corresponding toall investigated reverse phases it was found that the firstprincipal component of RF and RM accounts in each casemore than 90% from the total variation (information),while the first two principal components account evenmore than 99% in all cases. As a direct consequence, thescores corresponding to the first principal component canbe used as a new lipophilcity scale. The reliability of thescores values as lipophilic indices are shown by their signifi-cant correlation with the classical RM0 values and otherlipophilicity indices. In addition, the ‘‘lipophilicity chart’’described by the first two principal components has the
effect of separating compounds from each other mostlyeffectively from the congeneric (similarity) point of view(22–27). This approach can be extended also to the matrixof RM0 values corresponding to all investigated phases. Thelipophilicity charts obtained by PC1-PC2 score plot corre-sponding to different lipophilicity indices estimated on allinvestigated reverse stationary phases are shown inFigs. 2a–e. It appears clearly that the reverse phases studiedin this paper form practically linear clusters. Once more,the human fat results are highly correlated with thoseobtained on margarine and butter impregnated plates.Using as lipophilicity indices the PC1=RF or PC1=RM ahigh analytical level linearization of the results can beobserved. Moreover, these aspects sustain the wide
FIG. 2. The lipophilicity charts obtained by PC1-PC2 score plot corresponding to different lipophilicity indices estimated on all investigated reverse
stationary phases: mRF (a); PC1=RF (b); mRM (c); PC1=RM (d); RM0 (e).
1282 R. D. BRICIU AND C. SARBU
Dow
nloa
ded
by [
Tul
ane
Uni
vers
ity]
at 0
6:03
15
Oct
ober
201
4

capacity of the PCA to create an acceptable hierarchy. Thegraphical arrangements place the human fats as intermedi-ary between cod liver and pullet, which may sustain thesupposition that the human diet has to be concentratedon white meat. Much more, the PCA might be used forinvestigating the retention mechanism involved in thedevelopment process by examination of the profile ofloadings=eigenvectors corresponding to the first principalcomponent. The quadratic profile of loadings presentedin Figs. 3a–b (RF values) and linear profiles Figs. 3c–d(RM values) illustrate once again the differences and simi-larity between the investigated reversed-phases; a high reg-ular (linear) retention behavior (Fig. 3a) can be easilyobserved in the case of CN and sunflower oil-impregnatedplates by comparing with all others.
All the statements above are well supported by thecorrelation matrices of the chromatographic lipophilicity
FIG. 3. Profiles of loadings corresponding to the first principal compo-
nent obtained by applying PCA to RF values (a, b) and RM values (c, d).
TABLE 5The correlation concerning results obtained on humanfat-impregnated plates vs. the chemically bonded plates
and synthetic oils-impregnated plates
Human
Reversephase
Lipophilicityindex mRF mRM RM0
PC1=RF
PC1=RM
RP-18 mRF 0.34 �0.27 �0.08 �0.34 0.26mRM �0.38 0.31 0.10 0.38 �0.30RM0 �0.30 0.22 �0.03 0.31 �0.21PC1=RF �0.34 0.27 0.08 0.34 �0.26PC1=RM 0.38 �0.31 �0.10 �0.38 0.30
RP-18W mRF 0.73 �0.66 �0.36 �0.74 0.66mRM �0.71 0.64 0.33 0.71 �0.64RM0 �0.32 0.28 �0.02 0.33 �0.26PC1=RF �0.73 0.66 0.36 0.74 �0.65PC1=RM 0.70 �0.64 �0.32 �0.71 0.63
CN mRF 0.64 �0.59 �0.22 �0.64 0.57mRM �0.61 0.56 0.20 0.61 �0.54RM0 �0.18 0.14 �0.03 0.18 �0.12PC1=RF �0.64 0.59 0.22 0.64 �0.57PC1=RM 0.60 �0.56 �0.20 �0.61 0.54
Paraffin mRF 0.69 �0.63 �0.37 �0.70 0.63mRM �0.68 0.63 0.37 0.69 �0.63RM0 �0.32 0.24 0.10 0.33 �0.24PC1=RF �0.68 0.62 0.36 0.69 �0.62PC1=RM 0.66 �0.61 �0.35 �0.67 0.61
TOA mRF 0.55 �0.57 �0.31 �0.55 0.55mRM �0.52 0.53 0.27 0.51 �0.51RM0 �0.28 0.29 0.07 0.28 �0.28PC1=RF �0.54 0.55 0.29 0.53 �0.54PC1=RM 0.48 �0.49 �0.24 �0.48 0.48
LIPOPHILICITY OF FLAVONOIDS 1283
Dow
nloa
ded
by [
Tul
ane
Uni
vers
ity]
at 0
6:03
15
Oct
ober
201
4

indices obtained on the investigated stationary phases(Tables 5 to 7). The best correlations (r¼ 0.98) werefound between the mRM, Human with mRF, Margarine, PC1=RF, Margarine, mRF, Butter, mRM, Butter, PC1=RF, Butter,PC1=RM, Butter, and PC1=RM, Human with mRF, Margarine,PC1=RF, Margarine, mRF, Butter and, respectively PC1=RF, Butter. High correlation coefficients were found as wellbetween the human fat lipophilicity indices with all theanimal and vegetable fats. The lowest correlations werefound for the RP-18, followed by TOA. The RP-18Wand paraffin oil plates provided values closer by thoseobtained on the rest of the plates (r> 0.70).
CONCLUSIONS
The chromatographic lipophilicity indices obtained fora series of related flavonoids are a valuable source of
information which may be used for an objective character-ization of TLC plates impregnated with fats. The humanfat-impregnated plates provided lipophilicity values closelyassociated with those obtained for margarine and butter.Moreover, the human fat lipophilic character seems to beplaced between pullet and cod fats. Even if there are someunknown aspects which define the chromatographic mech-anism, especially because of the variable chemical compo-sition of the fats, the PCA offers useful informationconcerning classification and ranking aspects by thecharacteristic lipophilicity charts and by graphically rep-resentation of the loadings. Once more the PCA showsits high capacity within the analytical characterization ofdifferent chemical processes including the chromatographicmechanism.
ACKNOWLEDGEMENTS
The financial support of the Ministry of Education,Research and Innovation of Romania (ID 560=2007–2010) is gratefully acknowledged.
TABLE 6The correlation concerning results obtained on human
fat-impregnated plates vs. the vegetable oils, margarine andbutter-impregnated plates
Human
ReversePhase
Lipophilicityindex mRF mRM RM0
PC1=RF
PC1=RM
Olive mRF 0.70 �0.63 �0.30 �0.72 0.62mRM �0.71 0.64 0.31 0.72 �0.64RM0 �0.43 0.35 0.12 0.44 �0.35PC1=RF �0.70 0.62 0.30 0.71 �0.62PC1=RM0 0.70 �0.63 �0.30 �0.71 0.63
Sunflower mRF 0.55 �0.45 �0.10 �0.56 0.44mRM �0.57 0.48 0.13 0.58 �0.47RM0 �0.65 0.59 0.31 0.67 �0.59PC1=RF �0.54 0.45 0.09 0.56 �0.43PC1=RM 0.57 �0.49 �0.13 �0.58 0.47
Corn mRF 0.70 �0.64 �0.35 �0.71 0.63mRM �0.70 0.64 0.34 0.70 �0.64RM0 �0.44 0.35 0.10 0.45 �0.35PC1=RF �0.70 0.64 0.35 0.71 �0.63PC1=RM 0.69 �0.64 �0.34 �0.70 0.63
Margarine mRF 0.97 �0.98 �0.79 �0.96 0.98
mRM �0.93 0.97 0.82 0.92 �0.97RM0 �0.62 0.69 0.74 0.60 �0.69PC1=RF �0.97 0.98 0.79 0.96 �0.98
PC1=RM 0.93 �0.97 �0.82 �0.92 0.97
Butter mRF 0.97 �0.98 �0.78 �0.96 0.98
mRM �0.95 0.98 0.80 0.94 �0.97
RM0 �0.76 0.74 0.58 0.75 �0.73PC1=RF �0.97 0.98 0.78 0.96 �0.98
PC1=RM 0.95 �0.98 �0.80 �0.94 0.97
TABLE 7The of correlation concerning results obtained on humanfat-impregnated plates vs. the vegetable oils, margarine and
butter-impregnated plates
Human
Reversephase
Lipophilicityindex mRF mRM RM0
PC1=RF
PC1=RM
Cod mRF 0.93 �0.91 �0.67 �0.93 0.91mRM �0.92 0.92 0.67 0.92 �0.92
RM0 �0.46 0.46 0.36 0.44 �0.44PC1=RF �0.93 0.91 0.66 0.93 �0.91
PC1=RM 0.92 �0.92 �0.67 �0.92 0.92
Pig mRF 0.91 �0.95 �0.82 �0.90 0.95
mRM �0.89 0.94 0.83 0.88 �0.94
RM0 �0.60 0.53 0.30 0.61 �0.54PC1=RF �0.91 0.95 0.82 0.90 �0.95PC1=RM 0.89 �0.94 �0.83 �0.88 0.94
Sheep mRF 0.90 �0.93 �0.79 �0.89 0.93
mRM �0.84 0.90 0.82 0.83 �0.90
RM0 �0.75 0.80 0.77 0.74 �0.80
PC1=RF �0.90 0.93 0.79 0.88 �0.93
PC1=RM 0.85 �0.90 �0.82 �0.83 0.90
Pullet mRF 0.93 �0.95 �0.80 �0.92 0.95
mRM �0.92 0.94 0.80 0.91 �0.94RM0 �0.42 0.36 0.13 0.43 �0.36PC1=RF �0.93 0.95 0.80 0.92 �0.95
PC1=RM 0.92 �0.94 �0.80 �0.91 0.94
1284 R. D. BRICIU AND C. SARBU
Dow
nloa
ded
by [
Tul
ane
Uni
vers
ity]
at 0
6:03
15
Oct
ober
201
4

REFERENCES
1. http://goldbook.iupac.org/LT06965.html
2. Kaliszan, R. (2007) QSRR: Quantitative structure-(chromatographic)
retention relationships. Chemical Reviews, 107: 3212–3246.
3. Testa, B.; Crivori, P.; Reist, M.; Carrupt, P.A. (2000) The influence of
lipophilicity on the pharmacokinetic behavior of drugs: Concepts and
exemples. Perspectives in Drug Discovery and Design, 1: 179–211.
4. Kaliszan, R. (1997) Structure and Retention in Chromatography: A
Chemometric Approach; Harwood Academic Publishers: Amsterdam.
5. Hansch, H.; Leo, A. (1995) Exploring QSAR. Fundamentals and Appli-
cations in Chemistry and Biology; ACS: Washington, DC.
6. Huber, J.F.K.; Meijers, C.A.H.; Hulsman, J.A.R.J. (1972) Prediction
of coefficients in liquid-liquid systems and its experimental verification
for steroids by statistic and chromatographic measurements. Analyti-
cal Chemistry, 44: 111–116.
7. Kaune, A.; Knorrenschild, M.; Kettrup, A. (1995) Predicting
1-octanol-water partition coefficients by high performance liquid
chromatography gradient elution. Fresenius Journal of Analytical
Chemistry, 352: 303–312.
8. Djakovic-Sekulic, T.L.; Sarbu, C.; Peri�ssic-Janjic, N.U. (2005) A
comparative study of the lipophilicity of benzimidazole and benztria-
zole derivatives by RPTLC. Journal of Planar Chromatography, 18:
432–436.
9. Peri�ssic-Janjic, N.U.; Djakovic-Sekulic, T.L. (2006) Study of the char-
acteristics and separation properties of unconventional TLC supports.
Part I. Journal of Planar Chromatography, 19: 438–442.
10. Pyka, A.; Babuska, M.; Sliwiok, J. (2006) Use of liquid chromato-
graphy and theoretical computational methods to compare the lipo-
philicity of selected cortisone derivatives. Journal of Planar
Chromatography, 19: 432–437.
11. Djakovic-Sekulic, T.L.; Peri�ssic-Janjic, N.U. (2007) Study of the char-
acteristics and separating power of unconventional TLC supports. II.
Principal-components analysis. Journal of Planar Chromatography,
20: 7–11.
12. Csermely, T.; Petroianu, G.; Kuca, K.; Furesz, J.; Darvas, F.; Gulyas,
Z.; Laufer, R.; Kalasz, H. (2007) TLC of quaternary pyridinium
aldoximes, antidotes of organophosphorus esterase inhibitors. Journal
of Planar Chromatography, 20: 39–42.
13. Kresta, J.; Kastner, P.; Klime�ss, J.; Klime�ssova, V. (2005) Reversed-
phase thin-layer chromatographic determination of the lipophilicity
of potential antituberculotic compounds. Journal of Planar Chromato-
graphy, 18: 450–454.
14. Mrkvickova, Z.; Kovarıkova, P.; Klime�ss, J.; Dolezal, M. (2006)
Determination of the lipophilicity of potential antituberculotic com-
pounds by RP-TLC. Journal of Planar Chromatography, 19: 422–426.
15. Pyka, A. (2004) New method of calculation of the partition coeffi-
cients of selected alkoxyphenols investigated by RPTLC. Journal of
Planar Chromatography, 17: 58–60.
16. http://www.sunflowernsa.com/uploads/NuSun_FactSheet_vol_1.3.pdf
17. http://www.corn.org/CornOil.pdf
18. Lascu, D. (2008) Food Encyclopedia; All: Bucharest.
19. Kowalska, T.; Kaczmarski, K.; Prus, W. (2003) In: Handbook of Thin
Layer Chromatography, Sherma, J.; Fried, B., eds.; Marcel Dekker:
New York, 47–80.
20. Sangster, J. (1997)Octanol-Water Partition Coefficients: Fundamentals
and Physical Chemistry; Wiley: West Sussex.
21. Bate-Smith, E.C.; Westall, R.G. (1950) Chromatographic behaviour
and chemical structure I. Some naturally occuring phenolic sub-
stances. Biochimica et Biophysica Acta, 4: 427–440.
22. Casoni, D.; Kot-Wasik, A.; Namiesnik, J.; Sarbu, C. (2009) Lipophi-
licity data for some preservatives estimated by reversed-phase liquid
chromatography and different computation methods. Journal of
Chromatography A, 1216: 2456–2465.
23. Sarbu, C.; Tudor, S. (1998) Determination of lipophilicity of some
non-steroidal anti-inflammatory agents and their relationships by
using principal component analysis based on thin-layer chromato-
graphic retention data. Journal of Chromatography A, 822: 263–269.
24. Sarbu, C.; Casoni, D.; Darabantu, M.; Maiereanu, C. (2004) Quanti-
tative structure—retention and retention—activity relationships of
some 1,3-oxazolidine systems by RP-HPTLC and PCA. Journal of
Pharmaceutical and Biomedical Analysis, 35: 213–219.
25. Sarbu, C.; Djakovic-Sekulic, T.L.; Peri�ssic-Janjic, N.U. (2002) Evalu-
ation of lipophilicity of some benzimidazole and benztriazole deriva-
tives by RP HPTLC and PCA. Journal of Pharmaceutical and
Biomedical Analysis, 30: 739–745.
26. Briciu, R.D.; Kot-Wasik, A.; Namiesnik, J.; Sarbu, C. (2009) A com-
parative study of the molecular lipophilicity indices of vitamins A and
E, and of some precursors of vitamin A, estimated by HPLC and by
different computation methods. Acta Chromatographica, 21: 237–250.
27. Briciu, R.D.; Kot-Wasik, A.; Namiesnik, J.; Sarbu, C. (2009) The
lipophilicity indices of flavonoids estimated by reverse phase liquid
chromatography using different computation methods. Journal of
Separation Science, 32: 2066–2074.
28. http://www.statistica.com
LIPOPHILICITY OF FLAVONOIDS 1285
Dow
nloa
ded
by [
Tul
ane
Uni
vers
ity]
at 0
6:03
15
Oct
ober
201
4