Embed Size (px)
Citation preview
Review
s�P
OSTSCREEN
REVIEWS Drug Discovery Today �Volume 19, Number 2 � February 2014
Lipidomics in drug discovery
Terhi Vihervaara, Matti Suoniemi and Reijo Laaksonen
Zora Biosciences Oy, Biologinkuja 1, 02150 Espoo, Finland
Lipidomics is a rapidly growing technology that can be used in biomedical research to study disease
mechanisms, identify novel disease biomarkers and drug efficacy biomarkers, and reveal off-target
effects. Lipidomics can also be used to elucidate the mechanism of action of different drug compounds or
as readouts in Mendelian randomization approaches. Furthermore, lipidomics can be utilized to identify
deviations in metabolic and/or signaling pathways in different stages of disease. Therefore, as we discuss
here, this emerging technology also has a substantial potential in various drug discovery programs.
Definition of lipidomicsLipid molecules within the human body are enormously complex.
They are subject to active metabolism, where molecular lipids have
essential roles that are only now beginning be to understand. Mass
spectrometry (MS)-driven lipidomics has enabled the resolving of
complex lipidomes at the level of molecular lipid species in a high-
throughput mode, fulfilling the quality requirements of large
clinical cohorts [1–3]. Owing to the selectivity and high sensitivity
of the methods used, lipidomics analysis of minute sample
amounts can be executed. Lipids have essential roles in membrane
dynamics, energy metabolism, and signaling, where lipid structure
is a key determinant of the biological effects. Therefore, lipidomics
is an essential tool for increasing current biological understanding
of molecular lipids in basic research and pharmaceutical drug
discovery and development.
Sphingolipids and glycosphingolipids are among the key
players in many pathophysiological states. The level of complexity
of these lipid molecules is substantial, resulting from different
structural backbone moieties, amide-linked fatty acids, and var-
ious head group structures [4,5]. Although, there is little biological
information about such molecules available, imbalances in sphin-
golipid metabolism have been implicated in many diseases,
including cancer, metabolic syndrome, diabetes, atherosclerosis
and immunity, emphasizing the importance of understanding
lipid biochemistry in disease [6]. Sphingolipids are known to be
involved in apoptosis, proliferation, cellular growth and signaling
Corresponding author: Laaksonen, R. ([email protected])
164 www.drugdiscoverytoday.com 1359-6446/06/$ - see front matt
[7]. However, their molecular structure determines the biological
outcome. For example, ceramides with different chain-length fatty
acids have been shown to have opposing effects on proliferation
[8]. Whereas sphingosine and ceramide lipids promote growth
inhibition and apoptosis, their phosphorylated forms (sphingo-
sine-1-phosphate and ceramide-1-phosphate) support cell survi-
val, differentiation and migration [7].
Lipidomics technologyA lipidomic approach is applicable to all therapeutic areas, including
cardiovascular diseases, diabetes, cancer, neurological diseases and
autoimmune, as well as inflammatory diseases [9]. The currently
used technologies enable studies to be done in all biological materi-
als, including cultured cells, biofluids (blood, serum, plasma, cere-
brospinal fluid, urine, etc.) and all types of tissue from clinical or
animal models. A basic requirement of a successful lipidomic study
is adequate preanalytical sample handling and short storage times,
because some lipids can be unstable. As a common principle,
samples should always be collected using the exact same protocol
across all study sites. Samples should be drawn rapidly and, for
instance, plasma separation should be carried out in cold tempera-
tures. Biological samples should be kept at �808C or in liquid
nitrogen at all times during storage. Samples can be shipped to
the analytical laboratory on dry ice, and it is this step that can be the
most crucial of these expensive and laborious studies; therefore,
careful planning is needed to ensure safe sample transportation.
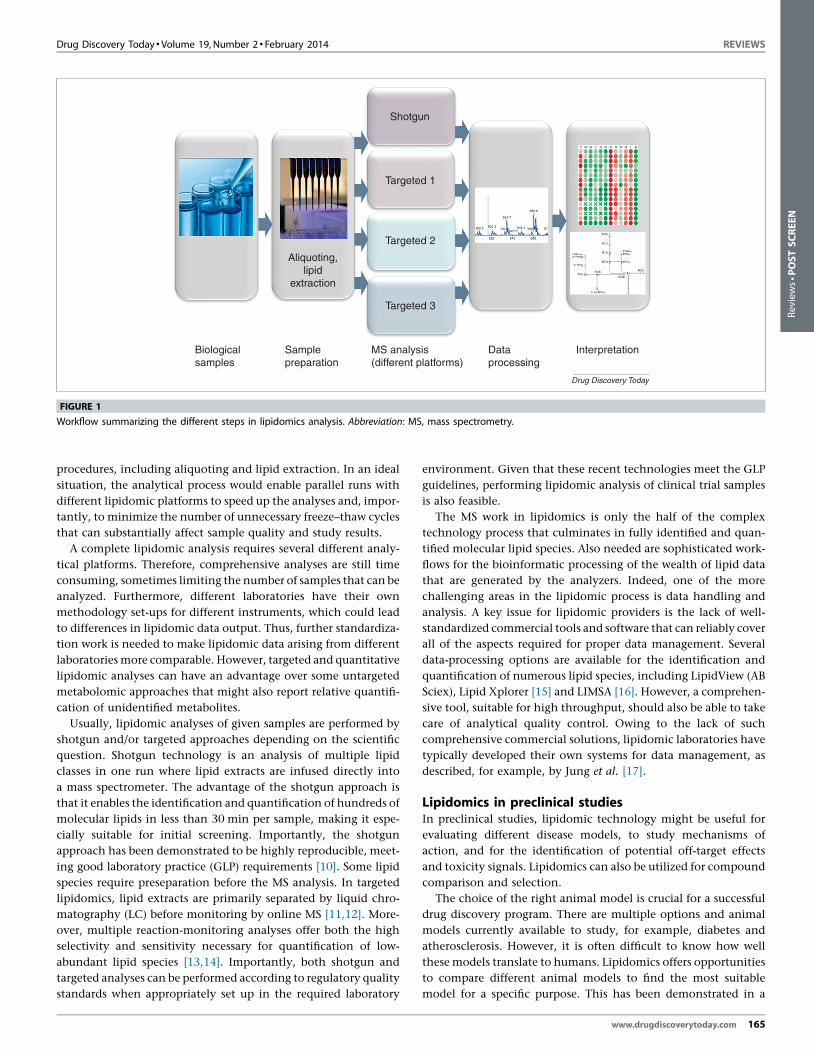
Fig. 1 summarizes the lipidomic workflow. In analytical labora-
tories, samples undergo preferably automated sample preparation
er � 2013 Elsevier Ltd. All rights reserved. http://dx.doi.org/10.1016/j.drudis.2013.09.008
Drug Discovery Today � Volume 19, Number 2 � February 2014 REVIEWS
Biologicalsamples
Samplepreparation
MS analysis(different platforms)
Dataprocessing
Targeted 3
Targeted 2
Targeted 1
Shotgun
Aliquoting,lipid
extraction
Interpretation
Drug Discovery Today
FIGURE 1
Workflow summarizing the different steps in lipidomics analysis. Abbreviation: MS, mass spectrometry.
Reviews�POSTSCREEN
procedures, including aliquoting and lipid extraction. In an ideal
situation, the analytical process would enable parallel runs with
different lipidomic platforms to speed up the analyses and, impor-
tantly, to minimize the number of unnecessary freeze–thaw cycles
that can substantially affect sample quality and study results.
A complete lipidomic analysis requires several different analy-
tical platforms. Therefore, comprehensive analyses are still time
consuming, sometimes limiting the number of samples that can be
analyzed. Furthermore, different laboratories have their own
methodology set-ups for different instruments, which could lead
to differences in lipidomic data output. Thus, further standardiza-
tion work is needed to make lipidomic data arising from different
laboratories more comparable. However, targeted and quantitative
lipidomic analyses can have an advantage over some untargeted
metabolomic approaches that might also report relative quantifi-
cation of unidentified metabolites.
Usually, lipidomic analyses of given samples are performed by
shotgun and/or targeted approaches depending on the scientific
question. Shotgun technology is an analysis of multiple lipid
classes in one run where lipid extracts are infused directly into
a mass spectrometer. The advantage of the shotgun approach is
that it enables the identification and quantification of hundreds of
molecular lipids in less than 30 min per sample, making it espe-
cially suitable for initial screening. Importantly, the shotgun
approach has been demonstrated to be highly reproducible, meet-
ing good laboratory practice (GLP) requirements [10]. Some lipid
species require preseparation before the MS analysis. In targeted
lipidomics, lipid extracts are primarily separated by liquid chro-
matography (LC) before monitoring by online MS [11,12]. More-
over, multiple reaction-monitoring analyses offer both the high
selectivity and sensitivity necessary for quantification of low-
abundant lipid species [13,14]. Importantly, both shotgun and
targeted analyses can be performed according to regulatory quality
standards when appropriately set up in the required laboratory
environment. Given that these recent technologies meet the GLP
guidelines, performing lipidomic analysis of clinical trial samples
is also feasible.
The MS work in lipidomics is only the half of the complex
technology process that culminates in fully identified and quan-
tified molecular lipid species. Also needed are sophisticated work-
flows for the bioinformatic processing of the wealth of lipid data
that are generated by the analyzers. Indeed, one of the more
challenging areas in the lipidomic process is data handling and
analysis. A key issue for lipidomic providers is the lack of well-
standardized commercial tools and software that can reliably cover
all of the aspects required for proper data management. Several
data-processing options are available for the identification and
quantification of numerous lipid species, including LipidView (AB
Sciex), Lipid Xplorer [15] and LIMSA [16]. However, a comprehen-
sive tool, suitable for high throughput, should also be able to take
care of analytical quality control. Owing to the lack of such
comprehensive commercial solutions, lipidomic laboratories have
typically developed their own systems for data management, as
described, for example, by Jung et al. [17].
Lipidomics in preclinical studiesIn preclinical studies, lipidomic technology might be useful for
evaluating different disease models, to study mechanisms of
action, and for the identification of potential off-target effects
and toxicity signals. Lipidomics can also be utilized for compound
comparison and selection.
The choice of the right animal model is crucial for a successful
drug discovery program. There are multiple options and animal
models currently available to study, for example, diabetes and
atherosclerosis. However, it is often difficult to know how well
these models translate to humans. Lipidomics offers opportunities
to compare different animal models to find the most suitable
model for a specific purpose. This has been demonstrated in a
www.drugdiscoverytoday.com 165
REVIEWS Drug Discovery Today �Volume 19, Number 2 � February 2014
Review
s�P
OSTSCREEN
recent study by Boue et al. [18], where plasma, liver and aorta
samples obtained from apolipoprotein E (ApoE) (�/�) mice
exposed to cigarette smoke or fresh air for 6 months were studied.
These data demonstrated that smoking led to increased concen-
trations of many lipid classes and molecular lipid species. Plasma
concentrations of free cholesterol, ceramides, cerebrosides and
several different phospholipids increased as a result of exposure
to cigarette smoke. Similarly, free and esterified cholesterol, tri-
acylglycerols, phospholipids, sphingomyelins and ceramides were
elevated in liver. Intriguingly, more than twofold higher levels of
cholesteryl ester, lysophosphatidylcholine and glucosyl- and/or
galactosylceramide were seen in the aorta specimens, which were
related in their molecular pattern to the accelerated development
of atherosclerosis in ApoE(�/�) mice on a standard chow diet.
These lipids have been detected in human plaques [19], suggesting
that the plaques of ApoE(�/�) mice resemble those of humans.
Based on these data, the authors concluded that the effect of
smoking on different tissues can be successfully observed using
the ApoE(�/�) mouse model, even in the absence of any addi-
tional factors, such as a high-fat diet. Another recent study com-
pared the use of the lipid profiling of 24 animal models with the
dyslipidemic human plasma in the absence and presence of sim-
vastatin treatment [20]. Not surprisingly, the closest overall
matches were non-human primates, whereas many traditionally
used models, including low density lipoprotein receptor (LDLr)
(�/�) and ApoE(�/�) mice, showed least overall similarity. How-
ever, the use of traditional models is still appropriate during the
preclinical stage of drug discovery.
Importantly, lipidomic applications are not only appropriate for
diseases related to hyperlipidemia or atherosclerosis, but can also
be applied to all diseases and therapeutic areas, including diabetes,
infectious diseases, cancer and central nervous system (CNS)-
related orders. For example, Suhre et al. [21] used lipidomics to
identify an efficacy biomarker for the inhibition of fatty acid-
binding protein 4 (FABP4) using a small-molecule inhibitor
BMS309403, which had been demonstrated to be effective in
the treatment of diabetes and atherosclerosis in mice [22].
Recently, lipid-mediator protectin D1 was identified as the innate
suppressor of influenza virus replication [23]. In cancer research,
several candidate biomarkers have been identified using lipido-
mics [24–27]. Lipids are also of interest in neurological disorders
owing to their high expression in the CNS. A defect in lipid
metabolism has been recognized in many CNS disorders and
injuries, including Alzheimer’s disease, Parkinson’s disease, Nie-
mann–Pick disease, Huntington’s disease [28], multiple sclerosis
[29], schizophrenia [30] and spinal cord injury [31]. For a com-
prehensive review of the role of lipids in CNS-related disorders, see
[32]. In this review, the authors concluded that lipidomic analyses
along with RNA silencing will provide new insights into the role of
lipid intermediates in cell signaling, and could open new avenues
for prevention or treatment options. In line with their conclu-
sions, it seems obvious that lipidomic technology will be a valu-
able tool in evaluating disease models and mechanisms of action
of new drug candidates in various areas.
Lipidomic-based biomarkersHuman plasma is estimated to contain many different lipid spe-
cies, ranging from a few hundred to thousands of lipids. Given that
166 www.drugdiscoverytoday.com
these numerous lipid species are likely to have well-defined roles in
the maintenance of cellular functions in the human body, it has
become obvious that detailed lipid analyses would reveal informa-
tion that will go a long way beyond the knowledge obtained using
current routine clinical lipidology tools, including LDL and high-
density lipoprotein (HDL) cholesterol measurements and apoli-
poprotein assays. Quehenberger et al. [33] described MS-based
lipidomic tools, which were developed by the LIPID MAPS Con-
sortium and used for the systematical identification and quanti-
fication of the human plasma lipidome. As a result of this
undertaking, the authors presented plasma concentrations for
more than 500 different lipid species from six main lipid cate-
gories, including fatty acyls, glycerolipids, glycerophospholipids,
sphingolipids, sterols and prenols in a pooled human plasma; such
a study can be covered routinely in high-throughput fashion [17].
One of the main application areas for lipidomics is as disease-
specific biomarkers. The advantage of the lipidomic approach is
that lipids can be considered as intermediate phenotypes that are
closer to the disease state in question compared with, for example,
genetic information. Thus, it might be possible to demonstrate
strong associations between molecular lipid species and disease
states even with relatively small sample sets, compared with
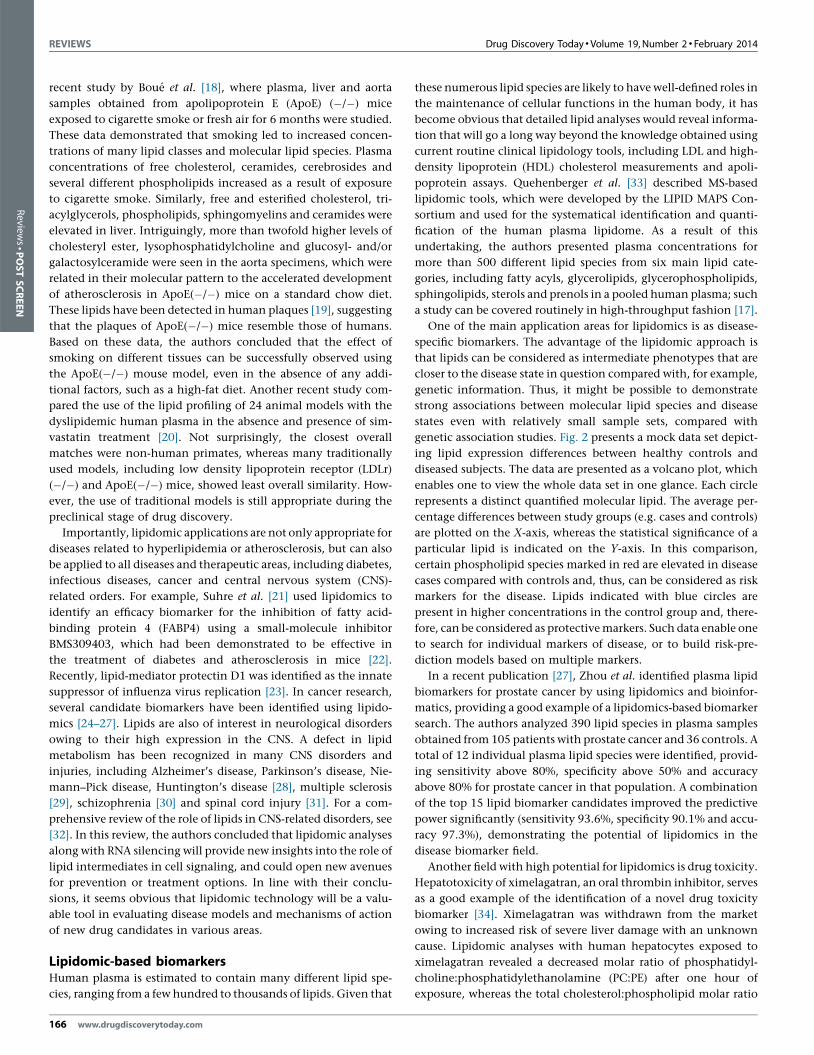
genetic association studies. Fig. 2 presents a mock data set depict-
ing lipid expression differences between healthy controls and
diseased subjects. The data are presented as a volcano plot, which
enables one to view the whole data set in one glance. Each circle
represents a distinct quantified molecular lipid. The average per-
centage differences between study groups (e.g. cases and controls)
are plotted on the X-axis, whereas the statistical significance of a
particular lipid is indicated on the Y-axis. In this comparison,
certain phospholipid species marked in red are elevated in disease
cases compared with controls and, thus, can be considered as risk
markers for the disease. Lipids indicated with blue circles are
present in higher concentrations in the control group and, there-
fore, can be considered as protective markers. Such data enable one
to search for individual markers of disease, or to build risk-pre-
diction models based on multiple markers.
In a recent publication [27], Zhou et al. identified plasma lipid
biomarkers for prostate cancer by using lipidomics and bioinfor-
matics, providing a good example of a lipidomics-based biomarker
search. The authors analyzed 390 lipid species in plasma samples
obtained from 105 patients with prostate cancer and 36 controls. A
total of 12 individual plasma lipid species were identified, provid-
ing sensitivity above 80%, specificity above 50% and accuracy
above 80% for prostate cancer in that population. A combination
of the top 15 lipid biomarker candidates improved the predictive
power significantly (sensitivity 93.6%, specificity 90.1% and accu-
racy 97.3%), demonstrating the potential of lipidomics in the
disease biomarker field.
Another field with high potential for lipidomics is drug toxicity.
Hepatotoxicity of ximelagatran, an oral thrombin inhibitor, serves
as a good example of the identification of a novel drug toxicity
biomarker [34]. Ximelagatran was withdrawn from the market
owing to increased risk of severe liver damage with an unknown
cause. Lipidomic analyses with human hepatocytes exposed to
ximelagatran revealed a decreased molar ratio of phosphatidyl-
choline:phosphatidylethanolamine (PC:PE) after one hour of
exposure, whereas the total cholesterol:phospholipid molar ratio
Drug Discovery Today � Volume 19, Number 2 � February 2014 REVIEWS
-5 0
% Difference
P-v
alue
5 10 15-10-15
1
0,5
0,2
0,1
0,05 0,0500
0,02
0,01
0,005
0,002
0,001
0,0005
0,0002
0,0001
5e-005 SM (d18:1/23:0) (d18:1/22:1-OH)
SM (d18:1/24:0) (d18:1/23:1-OH)
GlcCer(d18:1/24:0)
CE 20:4
Cer(d18:1/26:1)
PC O-16:0/20:4-alkyl
PC 18:1/20:4
PC 17:0/18:2
PE O-18:0/20:4-alkenyl (PE O-18:1/20:4-alkyl)
PC 18:2/18:2
CE 15:0
PC 16:0/16:0 PE 18:0/20:4
LacCer(d18:1/24:0)
Drug Discovery Today
FIGURE 2
Lipidomic biomarkers for disease. An imaginative volcano plot representing the average percentage differences (X-axis) in lipid species between cases and
controls plotted against statistical significance (I value; Y-axis). Each circle represents a defined molecular lipid: red or blue circles represent lipids that wereincreased or decreased, respectively, in cases versus controls. Color intensity reflects the magnitude of change. Circles above the horizontal line (P = 0.05)
represent lipids present at significantly different levels between the study groups.
Reviews�POSTSCREEN
decreased after a 48-hour exposure. Based on these results, the
investigators concluded that the observed lipid changes led to the
loss of membrane integrity and leakage of cellular proteins, which
could explain the observed effects of ximelagatran. These experi-
ments identified distinct molar phospholipid ratios as novel bio-
markers for hepatotoxicity.
Yet another potential lipidomic biomarker application area is the
identification of drug efficacy biomarkers and companion diagnos-
tic solutions. Different proprotein convertase subtilisin/kexin Type
9 (PCSK9) inhibitors are currently being developed by pharmaceu-
tical companies because these new compounds have been identified
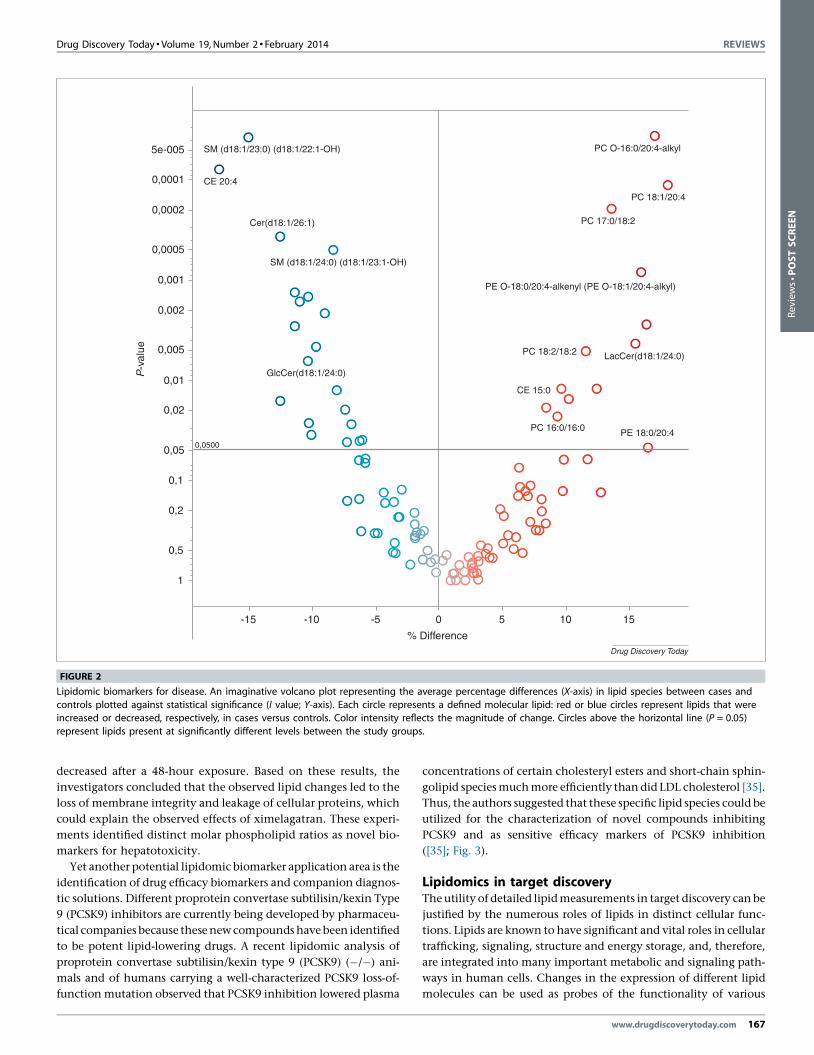
to be potent lipid-lowering drugs. A recent lipidomic analysis of
proprotein convertase subtilisin/kexin type 9 (PCSK9) (�/�) ani-
mals and of humans carrying a well-characterized PCSK9 loss-of-
function mutation observed that PCSK9 inhibition lowered plasma
concentrations of certain cholesteryl esters and short-chain sphin-
golipid species much more efficiently than did LDL cholesterol [35].
Thus, the authors suggested that these specific lipid species could be
utilized for the characterization of novel compounds inhibiting
PCSK9 and as sensitive efficacy markers of PCSK9 inhibition
([35]; Fig. 3).
Lipidomics in target discoveryThe utility of detailed lipid measurements in target discovery can be
justified by the numerous roles of lipids in distinct cellular func-
tions. Lipids are known to have significant and vital roles in cellular
trafficking, signaling, structure and energy storage, and, therefore,
are integrated into many important metabolic and signaling path-
ways in human cells. Changes in the expression of different lipid
molecules can be used as probes of the functionality of various
www.drugdiscoverytoday.com 167
REVIEWS Drug Discovery Today �Volume 19, Number 2 � February 2014
-20 -15
% Difference
-10 -5 0 5-25-30
P-v
alue
1
0,5
0,2
0,1
0,05
0,02
0,0500
0,01
0,005
0,002
0,001
0,0005
0,0002
0,0001
5e-005
2e-005
Improved lipidomicbiomarkers
Conventional biomarkers
CE 20:3
LacCer(d18:1/16:0)
CE 16:1LacCer(d18:1/18:0)
Cer(d18:1/18:0)
Cer(d18:1/16:0)
CE 17:1
CE 18:1
CE 16:0
CE 20:4
CE 14:0
CE 18:3
GlcCer(d18:1/16:0)GlcCer(d18:1/18:0)
Cer(d18:1/20:0)
ApoB
LDL-C
TG
ApoA1
LPC 16:0
SM (d18:1/18:0)
SM (d18:1/16:0) (d18:1/15:1-OH)
SM (d18:1/24:1) (d18:1/23:2-OH) SM (d18:1/16:1) (d18:1/15:2-OH)
Drug Discovery Today
FIGURE 3
Lipidomic biomarkers for drug efficacy. A volcano plot representing the average percentage differences (X-axis) in lipid species in response to lipid-loweringtreatment, plotted against statistical significance (P value; Y-axis). Each circle represents a defined molecular lipid: red or blue circles represent lipids that were
increased or decreased, respectively, in cases versus controls. Color intensity reflects the magnitude of change. Circles above the horizontal line (P = 0.05)
represent lipids present at significantly different levels between the study groups. Boxes highlight conventional lipid biomarkers (bottom box) and improved
lipidomic biomarkers (top box). Modified, with permission, from [35].
Review
s�P
OSTSCREEN
metabolic pathways in disease and this information can be used to
identify druggable target enzymes to control the pathway of inter-
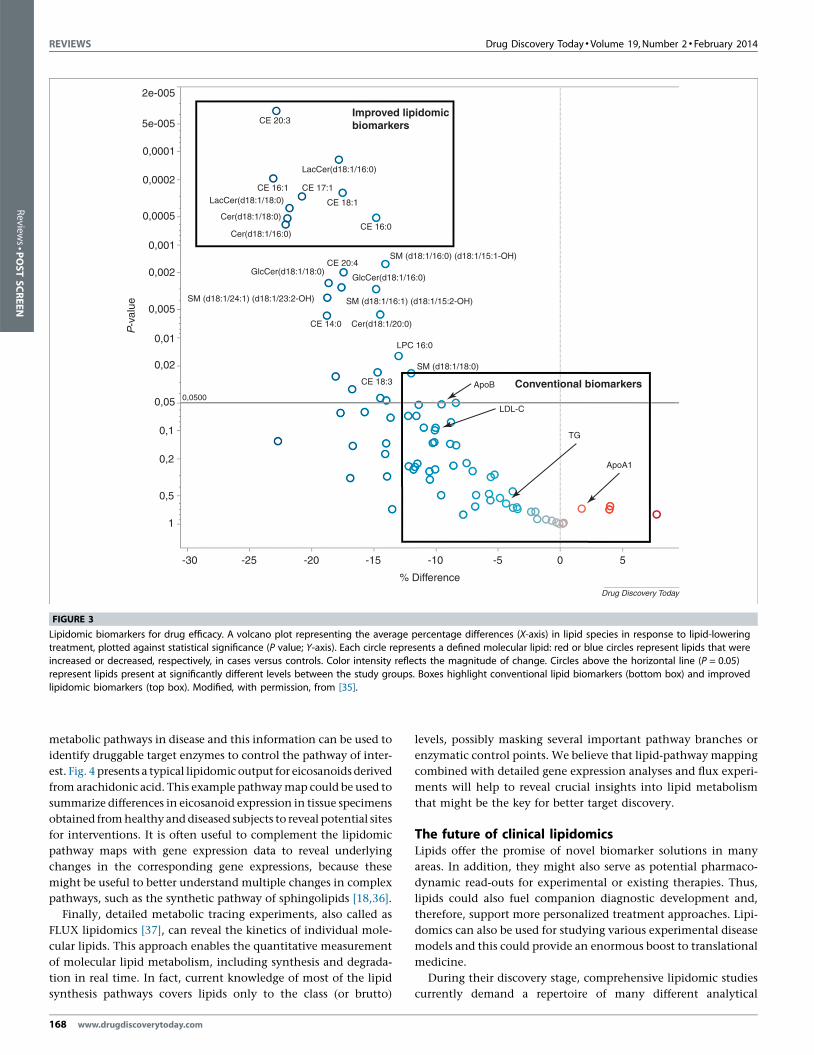
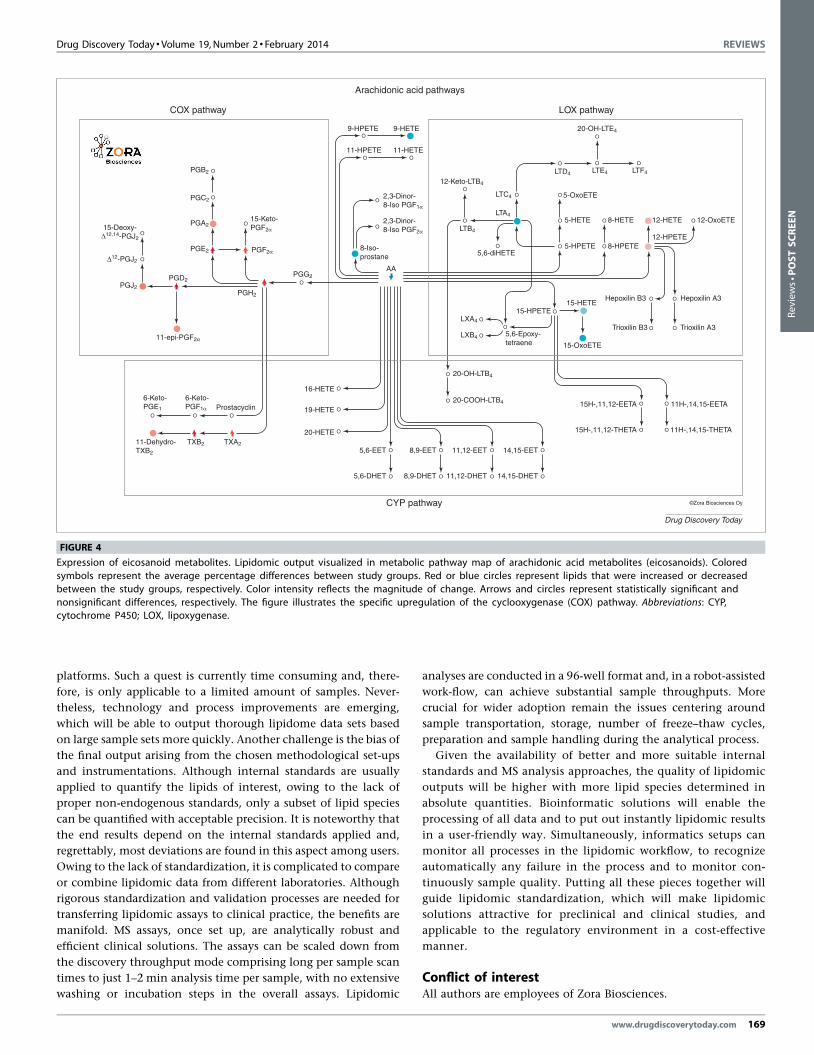
est. Fig. 4 presents a typical lipidomic output for eicosanoids derived
from arachidonic acid. This example pathway map could be used to
summarize differences in eicosanoid expression in tissue specimens
obtained from healthy and diseased subjects to reveal potential sites
for interventions. It is often useful to complement the lipidomic
pathway maps with gene expression data to reveal underlying
changes in the corresponding gene expressions, because these
might be useful to better understand multiple changes in complex
pathways, such as the synthetic pathway of sphingolipids [18,36].
Finally, detailed metabolic tracing experiments, also called as
FLUX lipidomics [37], can reveal the kinetics of individual mole-
cular lipids. This approach enables the quantitative measurement
of molecular lipid metabolism, including synthesis and degrada-
tion in real time. In fact, current knowledge of most of the lipid
synthesis pathways covers lipids only to the class (or brutto)
168 www.drugdiscoverytoday.com
levels, possibly masking several important pathway branches or
enzymatic control points. We believe that lipid-pathway mapping
combined with detailed gene expression analyses and flux experi-
ments will help to reveal crucial insights into lipid metabolism
that might be the key for better target discovery.
The future of clinical lipidomicsLipids offer the promise of novel biomarker solutions in many
areas. In addition, they might also serve as potential pharmaco-
dynamic read-outs for experimental or existing therapies. Thus,
lipids could also fuel companion diagnostic development and,
therefore, support more personalized treatment approaches. Lipi-
domics can also be used for studying various experimental disease
models and this could provide an enormous boost to translational
medicine.
During their discovery stage, comprehensive lipidomic studies
currently demand a repertoire of many different analytical
Drug Discovery Today � Volume 19, Number 2 � February 2014 REVIEWS
PGJ2
PGB2
COX pathway LOX pathway
Arachidonic acid pathways
PGC2
PGA2
TXB2 TXA2
PGE2
PGH2
PGF2α
11-epi-PGF2α
11-Dehydro-TXB2
15-Keto-PGF2α
2,3-Dinor-8-Iso PGF1α
2,3-Dinor-8-Iso PGF2α
6-Keto-PGE1
6-Keto-PGF1α Prostacyclin
O
O
O
O
O O
O
O
O
O
O
O
O
O
O
O
O
O
O
O
O
O
O
O
O
O
O O O
O
O
PGD2PGG2
8-Iso-prostane
20-OH-LTB4
20-COOH-LTB4
Hepoxilin A3
12-OxoETE12-HETE8-HETE5-HETE
8-HPETE5-HPETE5,6-diHETE
12-Keto-LTB4
LTC4
LTA4
LTD4 LTE4
20-OH-LTE4
5-OxoETE
LTF4
LTB412-HPETE
Trioxilin A3
16-HETE
19-HETE
20-HETE
5,6-EET
5,6-DHET
8,9-EET
9-HPETE
11-HPETE 11-HETE
9-HETE
8,9-DHET
11,12-EET
11,12-DHET
14,15-EET
14,15-DHET
15H-,11,12-EETA
Hepoxilin B3
Trioxilin B3
15-HETE
15-OxoETE
15-HPETE
5,6-Epoxy-tetraene
LXA4
LXB4
15H-,11,12-THETA
11H-,14,15-EETA
11H-,14,15-THETA
CYP pathway ©Zora Biosciences Oy
Δ12-PGJ2
15-Deoxy-Δ12,14-PGJ2
OO
OO
O
OO
O
O O
OO
OO
O O
O
O
O
O
O O
AA
Drug Discovery Today
FIGURE 4
Expression of eicosanoid metabolites. Lipidomic output visualized in metabolic pathway map of arachidonic acid metabolites (eicosanoids). Colored
symbols represent the average percentage differences between study groups. Red or blue circles represent lipids that were increased or decreased
between the study groups, respectively. Color intensity reflects the magnitude of change. Arrows and circles represent statistically significant and
nonsignificant differences, respectively. The figure illustrates the specific upregulation of the cyclooxygenase (COX) pathway. Abbreviations: CYP,cytochrome P450; LOX, lipoxygenase.
Reviews�POSTSCREEN
platforms. Such a quest is currently time consuming and, there-
fore, is only applicable to a limited amount of samples. Never-
theless, technology and process improvements are emerging,
which will be able to output thorough lipidome data sets based
on large sample sets more quickly. Another challenge is the bias of
the final output arising from the chosen methodological set-ups
and instrumentations. Although internal standards are usually
applied to quantify the lipids of interest, owing to the lack of
proper non-endogenous standards, only a subset of lipid species
can be quantified with acceptable precision. It is noteworthy that
the end results depend on the internal standards applied and,
regrettably, most deviations are found in this aspect among users.
Owing to the lack of standardization, it is complicated to compare
or combine lipidomic data from different laboratories. Although
rigorous standardization and validation processes are needed for
transferring lipidomic assays to clinical practice, the benefits are
manifold. MS assays, once set up, are analytically robust and
efficient clinical solutions. The assays can be scaled down from
the discovery throughput mode comprising long per sample scan
times to just 1–2 min analysis time per sample, with no extensive
washing or incubation steps in the overall assays. Lipidomic
analyses are conducted in a 96-well format and, in a robot-assisted
work-flow, can achieve substantial sample throughputs. More
crucial for wider adoption remain the issues centering around
sample transportation, storage, number of freeze–thaw cycles,
preparation and sample handling during the analytical process.
Given the availability of better and more suitable internal
standards and MS analysis approaches, the quality of lipidomic
outputs will be higher with more lipid species determined in
absolute quantities. Bioinformatic solutions will enable the
processing of all data and to put out instantly lipidomic results
in a user-friendly way. Simultaneously, informatics setups can
monitor all processes in the lipidomic workflow, to recognize
automatically any failure in the process and to monitor con-
tinuously sample quality. Putting all these pieces together will
guide lipidomic standardization, which will make lipidomic
solutions attractive for preclinical and clinical studies, and
applicable to the regulatory environment in a cost-effective
manner.
Conflict of interestAll authors are employees of Zora Biosciences.
www.drugdiscoverytoday.com 169
REVIEWS Drug Discovery Today �Volume 19, Number 2 � February 2014
Review
s�P
OSTSCREEN
1 Ejsing, C.S. et al. (2009) Global analysis of the yeast lipidome by quantitative
shotgun mass spectrometry. Proc. Natl. Acad. Sci. U. S. A. 106, 2136–2141
2 Hiukka, A. et al. (2009) ApoCIII-enriched LDL in type 2 diabetes displays
sphingomyelinase, and increased binding to biglycan. Diabetes 58, 2018–2026
3 Linden, D. et al. (2006) Liver-directed overexpression of mitochondrial glycerol-3-
phosphate acyltransferase results in hepatic steatosis, increased triacylglycerol
secretion and reduced fatty acid oxidation. FASEB J. 20, 434–443
4 Futerman, A.H. and Hannun, Y.A. (2004) The complex life of simple sphingolipids.
EMBO Rep. 5, 777–782
5 Zheng, W. et al. (2006) Ceramides and other bioactive sphingolipid backbones in
health and disease: lipidomic analysis, metabolism and roles in membrane
structure, dynamics, signaling and autophagy. Biochim. Biophys. Acta 1758, 1864–
1884
6 Alewijnse, A.E. and Peters, S.L.M. (2008) Sphingolipid signalling in the
cardiovascular system: good, bad or both? Eur. J. Pharmacol. 585, 292–302
7 Hannun, Y.A. and Obeid, L.M. (2008) Principles of bioactive lipid signalling: lessons
from sphingolipids. Nat. Rev. Mol. Cell Biol. 9, 139–150
8 Hartmann, D. et al. (2012) Long chain ceramides and very long chain ceramides
have opposite effects on human breast and colon cancer cell growth. Int. J. Biochem.
Cell B 44, 620–628
9 Ekroos, K. et al. (2012) Lipidomics Technologies and Applications. Wiley-VCH
10 Heiskanen, L.A. et al. (2013) Long-term performance and stability of molecular
shotgun lipidomic analysis of human plasma samples. Anal. Chem. http://
dx.doi.org/10.1021/ac401857a
11 Ogiso, H. et al. (2008) Development of a reverse-phase liquid chromatography
electrospray ionization mass spectrometry method for lipidomics, improving
detection of phosphatidic acid and phosphatidylserine. Anal. Biochem. 375,
124–131
12 Kuksis, A. et al. (1991) Plasma lipid profiling by liquid chromatography with
chloride-attachment mass spectrometry. Lipids 26, 240–246
13 Hopfgartner, G. et al. (2004) Triple quadrupole linear ion trap mass spectrometer for
the analysis of small molecules and macromolecules. J. Mass Spectrom. 39, 845–855
14 Shaner, R.L. et al. (2009) Quantitative analysis of sphingolipids for lipidomics using
triple quadrupole and quadrupole linear ion trap mass spectrometers. J. Lipid Res.
50, 1692–1707
15 Herzog, R. et al. (2012) LipidXplorer: a software for consensual cross-platform
lipidomics. PLoS ONE 7, e29851
16 Haimi, P. et al. (2006) Software tools for analysis of mass spectrometric lipidome
data. Anal. Chem. 78, 8324–8331
17 Jung, H.R. et al. (2011) High throughput quantitative molecular lipidomics.
Biochim. Biophys. Acta 1811, 925–934
References
170 www.drugdiscoverytoday.com
18 Boue, S. et al. (2012) Modulation of atherogenic lipidome by cigarette smoke in
apolipoprotein E-deficient mice. Atherosclerosis 225, 328–334
19 Stegemann, C. et al. (2011) Comparative lipidomics profiling of human
atherosclerotic plaques. Circ. Cardiovasc. Genet. 4, 232–242
20 Yin, W. et al. (2012) Plasma lipid profiling across species for the identification of
optimal animal models of human dyslipidemia. J. Lipid Res. 53, 51–65
21 Suhre, K. et al. (2011) Human metabolic individuality in biomedical and
pharmaceutical research. Nature 477, 54–60
22 Furuhashi, M. et al. (2007) Treatment of diabetes and atherosclerosis by inhibiting
fatty-acid-binding protein aP2. Nature 447, 959–965
23 Morita, M. et al. (2013) The lipid mediator protectin D1 inhibits influenza virus
replication and improves severe influenza. Cell 153, 112–125
24 Min, H.K. et al. (2011) Shotgun lipidomics for candidate biomarkers of urinary
phospholipids in prostate cancer. Anal. Bioanal. Chem. 399, 823–830
25 Bougnoux, P. et al. (2008) The lipidome as a composite biomarker of the modifiable
part of the risk of breast cancer. Prostaglandins Leukot. Essent. Fatty Acids 79, 93–96
26 Llorente, A. et al. (2013) Molecular lipidomics of exosomes released by PC-3 prostate
cancer cells. Biochim. Biophys. Acta 1831, 1302–1309
27 Zhou, X. et al. (2012) Identification of plasma lipid biomarkers for prostate cancer by
lipidomics and bioinformatics. PLoS ONE 7, e48889
28 Wenk, M.R. (2005) The emerging field of lipidomics. Nat. Rev. Drug Discov. 4, 594–610
29 Carlson, N.G. and Rose, J.W. (2006) Antioxidants in multiple sclerosis: do they have
a role in therapy? CNS Drugs 20, 433–441
30 McEvoy, J. et al. (2013) Lipidomics reveals early metabolic changes in subjects with
schizophrenia: effects of atypical antipsychotics. PLoS ONE 8, e68717
31 Hall, E.D. and Springer, J.E. (2004) Neuroprotection and acute spinal cord injury: a
reappraisal. NeuroRx 1, 80–100
32 Adibhatla, R.M. and Hatcher, J.F. (2007) Role of lipids in brain injury and diseases.
Future Lipidol. 2, 403–422
33 Quehenberger, O. et al. (2010) Lipidomics reveals a remarkable diversity of lipids in
human plasma. J. Lipid Res. 51, 3299–3305
34 Sergent, O. et al. (2009) Ximelagatran increases membrane fluidity and changes
membrane lipid composition in primary human hepatocytes. Toxicol. In vitro 23,
1305–1310
35 Janis, M.T. et al. (2013) Beyond LDL-C lowering: distinct molecular sphingolipids
are good indicators of proprotein convertase subtilisin/kexin type 9 (PCSK9)
deficiency. Atherosclerosis 228, 380–385
36 Gupta, S. et al. (2011) Integration of lipidomics and transcriptomics data towards a
systems biology model of sphingolipid metabolism. BMC Syst. Biol. 5, 26
37 Kuerschner, L. et al. (2005) Polyene-lipids: a new tool to image lipids. Nat. Meth. 2,
39–45