Embed Size (px)
Citation preview
Lipid Update 2015
Jacques Genest MD
Cardiovascular Research Laboratories McGill University Health Center
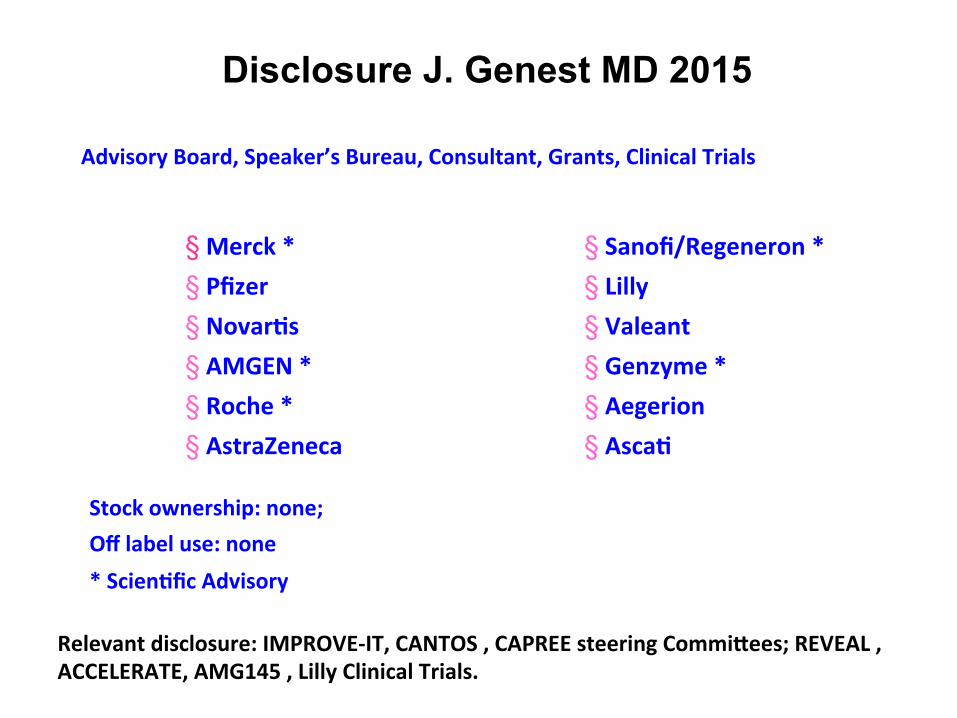
§ Merck * § Pfizer § Novar/s § AMGEN * § Roche * § AstraZeneca
Disclosure J. Genest MD 2015
Relevant disclosure: IMPROVE-‐IT, CANTOS , CAPREE steering CommiHees; REVEAL , ACCELERATE, AMG145 , Lilly Clinical Trials.
Advisory Board, Speaker’s Bureau, Consultant, Grants, Clinical Trials
§ Sanofi/Regeneron * § Lilly § Valeant § Genzyme * § Aegerion § Asca/
Stock ownership: none; Off label use: none * Scien/fic Advisory
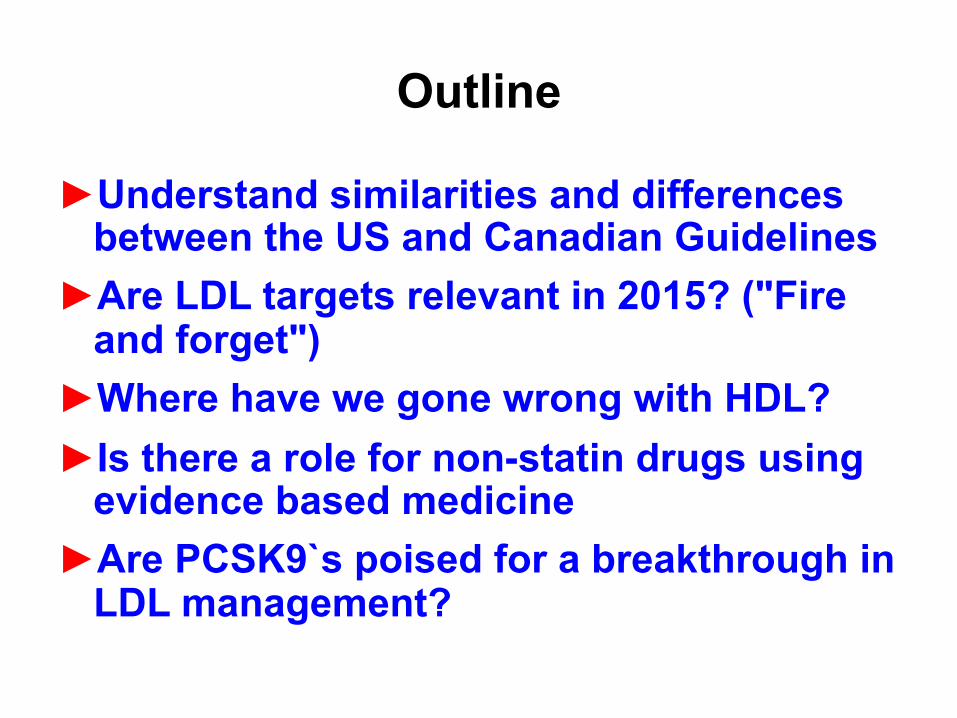
Outline
► Understand similarities and differences between the US and Canadian Guidelines
► Are LDL targets relevant in 2015? ("Fire and forget")
► Where have we gone wrong with HDL? ► Is there a role for non-statin drugs using
evidence based medicine ► Are PCSK9`s poised for a breakthrough in
LDL management?
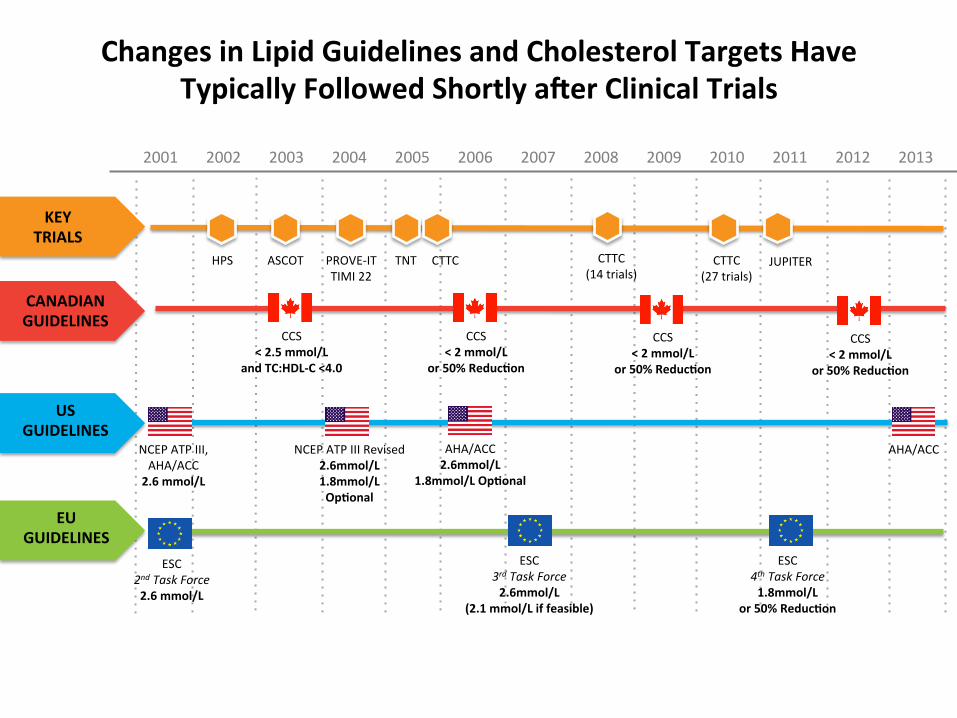
Changes in Lipid Guidelines and Cholesterol Targets Have Typically Followed Shortly aYer Clinical Trials
2001 2002 2003 2004 2005 2006 2007 2008 2009 2010 2011 2012 2013
US GUIDELINES
NCEP ATP III, AHA/ACC 2.6 mmol/L
NCEP ATP III Revised 2.6mmol/L 1.8mmol/L Op/onal
AHA/ACC 2.6mmol/L
1.8mmol/L Op/onal
AHA/ACC
CANADIAN GUIDELINES
CCS < 2 mmol/L
or 50% Reduc/on
CCS < 2 mmol/L
or 50% Reduc/on
EU GUIDELINES
ESC 4th Task Force 1.8mmol/L
or 50% Reduc/on
ESC 3rd Task Force 2.6mmol/L
(2.1 mmol/L if feasible)
ESC 2nd Task Force 2.6 mmol/L
KEY TRIALS
HPS ASCOT PROVE-‐IT TIMI 22
TNT CTTC (27 trials)
JUPITER CTTC CTTC (14 trials)
CCS < 2 mmol/L
or 50% Reduc/on
CCS < 2.5 mmol/L
and TC:HDL-‐C <4.0
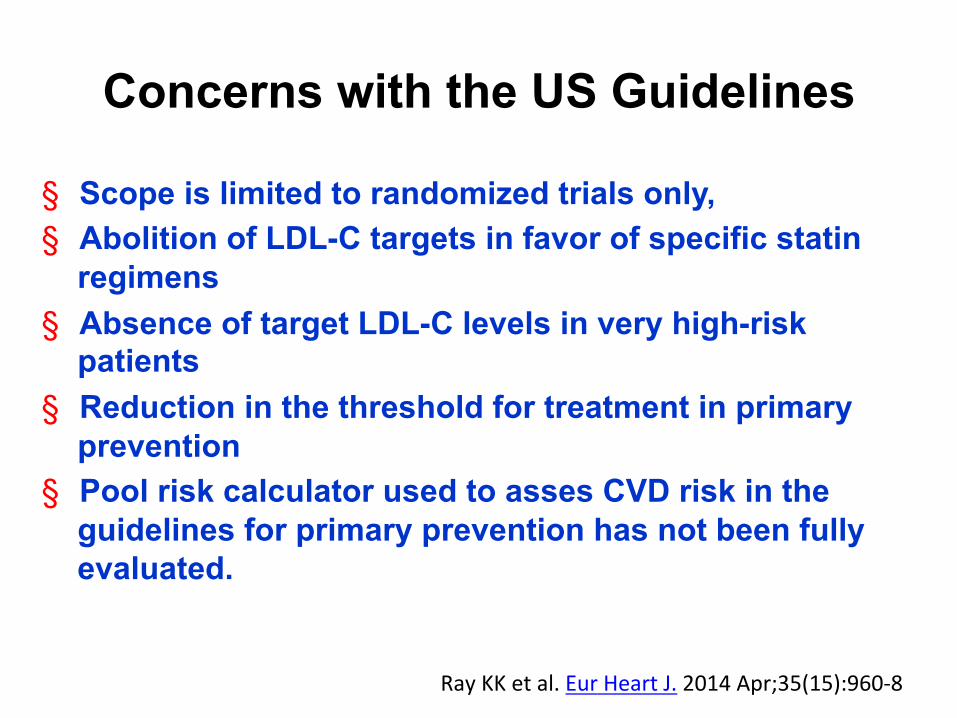
Concerns with the US Guidelines
§ Scope is limited to randomized trials only, § Abolition of LDL-C targets in favor of specific statin
regimens § Absence of target LDL-C levels in very high-risk
patients § Reduction in the threshold for treatment in primary
prevention § Pool risk calculator used to asses CVD risk in the
guidelines for primary prevention has not been fully evaluated.
Ray KK et al. Eur Heart J. 2014 Apr;35(15):960-‐8
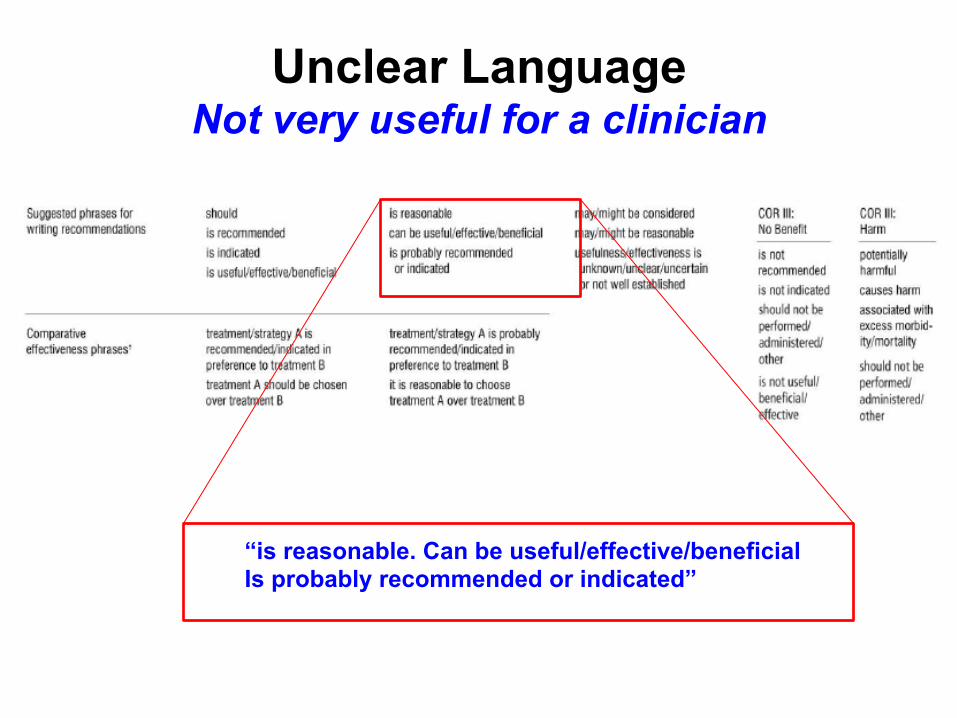
Unclear Language Not very useful for a clinician
“is reasonable. Can be useful/effective/beneficial Is probably recommended or indicated”
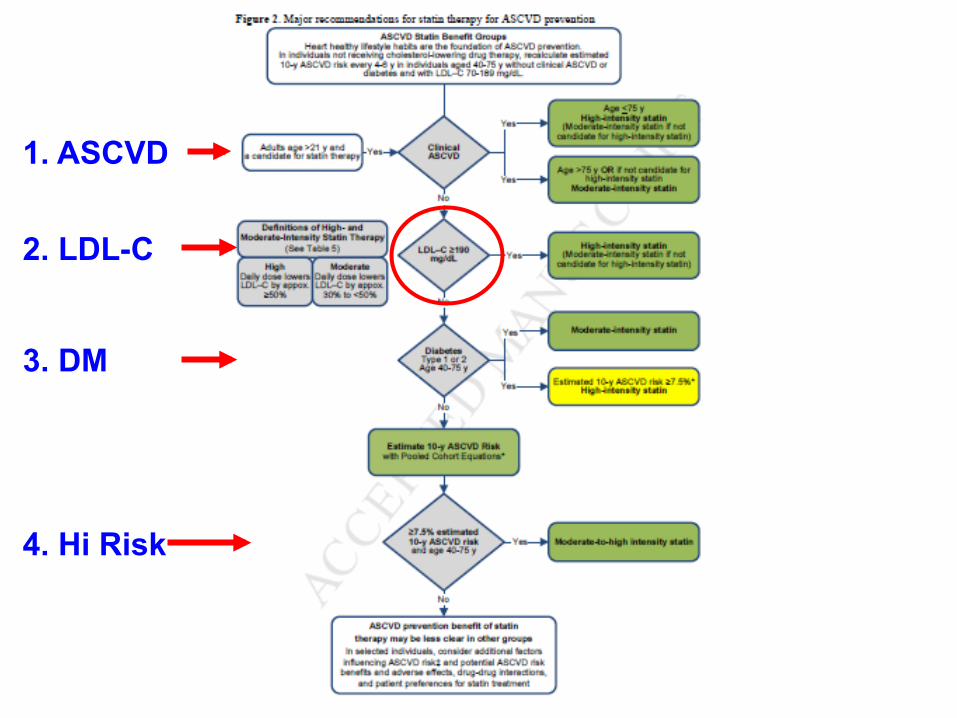
1. ASCVD
2. LDL-C
3. DM
4. Hi Risk
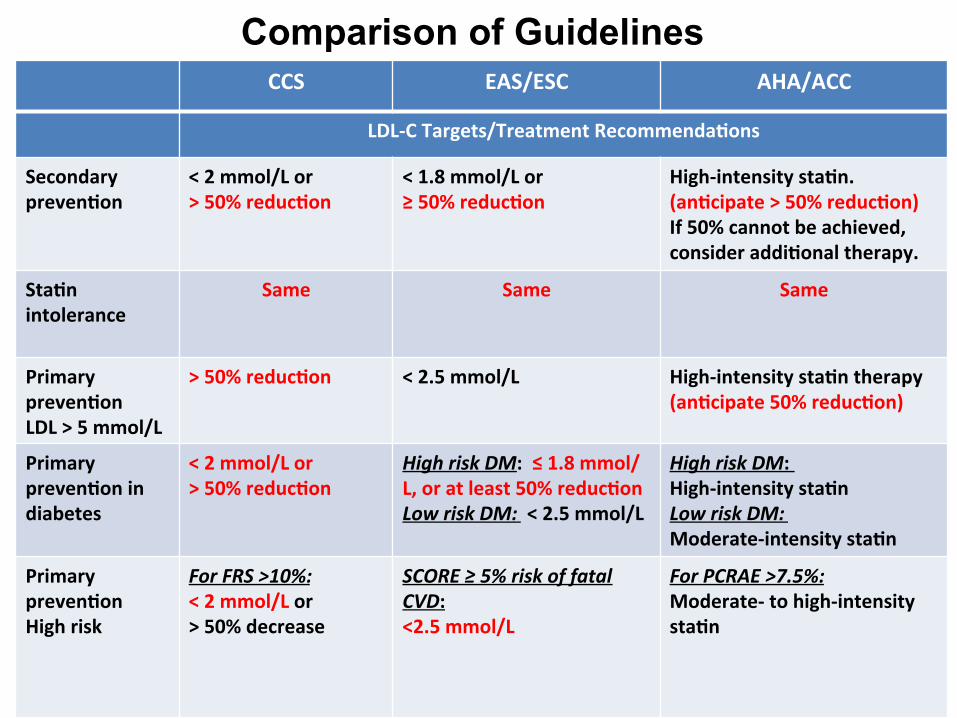
Comparison of Guidelines CCS EAS/ESC AHA/ACC
LDL-‐C Targets/Treatment Recommenda/ons
Secondary preven/on
< 2 mmol/L or > 50% reduc/on
< 1.8 mmol/L or ≥ 50% reduc/on
High-‐intensity sta/n. (an/cipate > 50% reduc/on) If 50% cannot be achieved, consider addi/onal therapy.
Sta/n intolerance
Same Same Same
Primary preven/on LDL > 5 mmol/L
> 50% reduc/on < 2.5 mmol/L
High-‐intensity sta/n therapy (an/cipate 50% reduc/on)
Primary preven/on in diabetes
< 2 mmol/L or > 50% reduc/on
High risk DM: ≤ 1.8 mmol/L, or at least 50% reduc/on Low risk DM: < 2.5 mmol/L
High risk DM: High-‐intensity sta/n Low risk DM: Moderate-‐intensity sta/n
Primary preven/on High risk
For FRS >10%: < 2 mmol/L or > 50% decrease
SCORE ≥ 5% risk of fatal CVD: <2.5 mmol/L
For PCRAE >7.5%: Moderate-‐ to high-‐intensity sta/n

Evidence for LDL-C Target?
Fire and Forget?
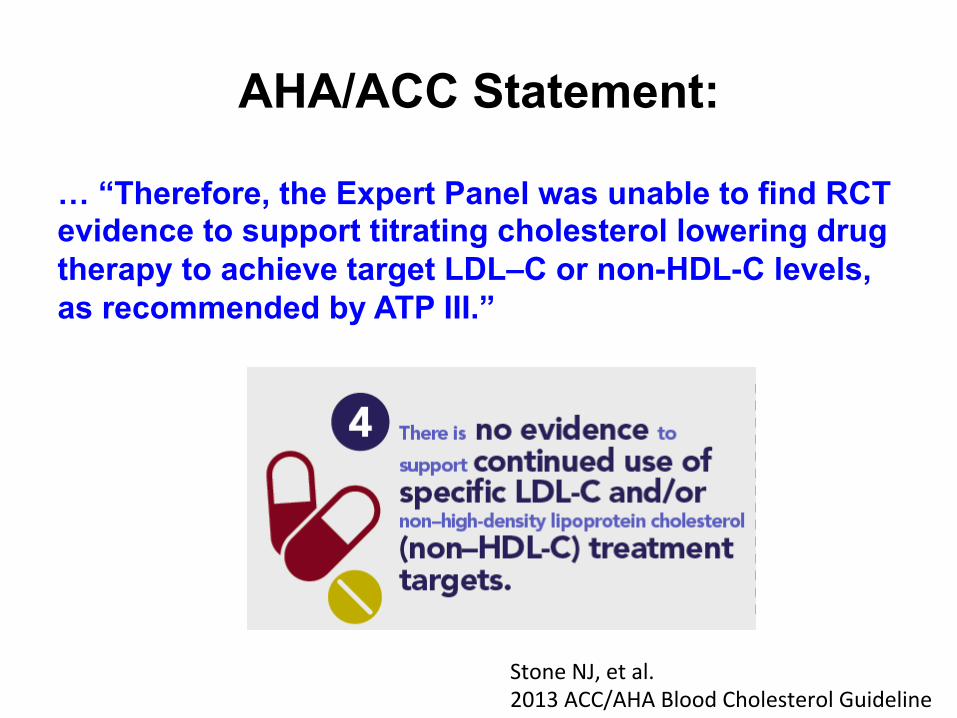
AHA/ACC Statement:
… “Therefore, the Expert Panel was unable to find RCT evidence to support titrating cholesterol lowering drug therapy to achieve target LDL–C or non-HDL-C levels, as recommended by ATP III.”
Stone NJ, et al. 2013 ACC/AHA Blood Cholesterol Guideline

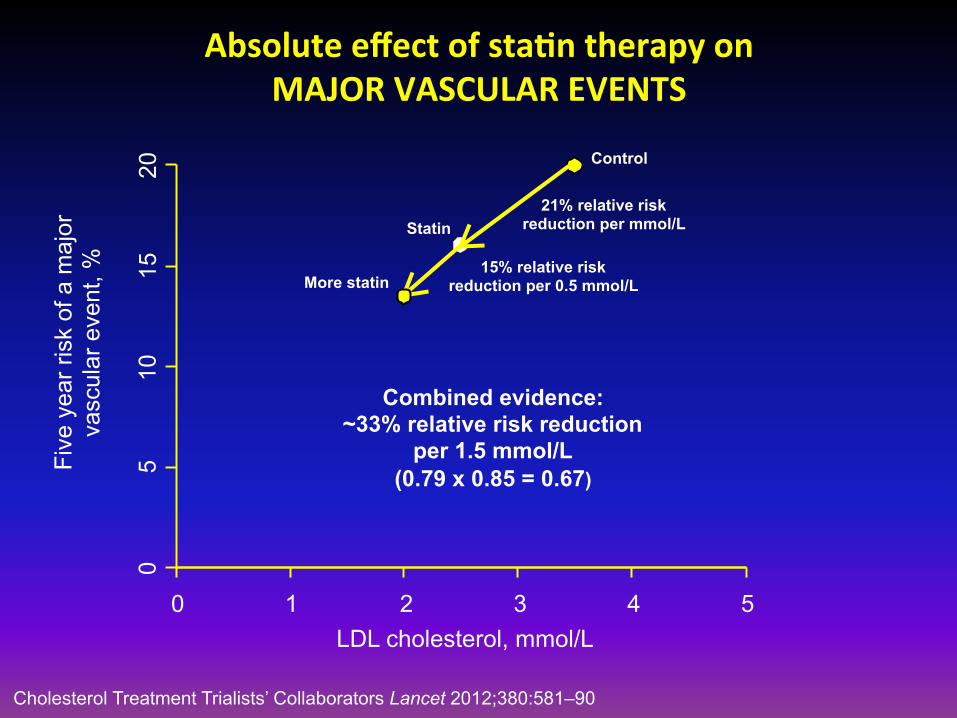
Absolute effect of sta/n therapy on MAJOR VASCULAR EVENTS
0 1 2 3 4 5
0 5
10
15
20
LDL cholesterol, mmol/L
Five
yea
r ris
k of
a m
ajor
va
scul
ar e
vent
, %
Control
21% relative risk reduction per mmol/L Statin
15% relative risk reduction per 0.5 mmol/L More statin
Combined evidence: ~33% relative risk reduction
per 1.5 mmol/L (0.79 x 0.85 = 0.67)
Cholesterol Treatment Trialists’ Collaborators Lancet 2012;380:581–90
Less statin
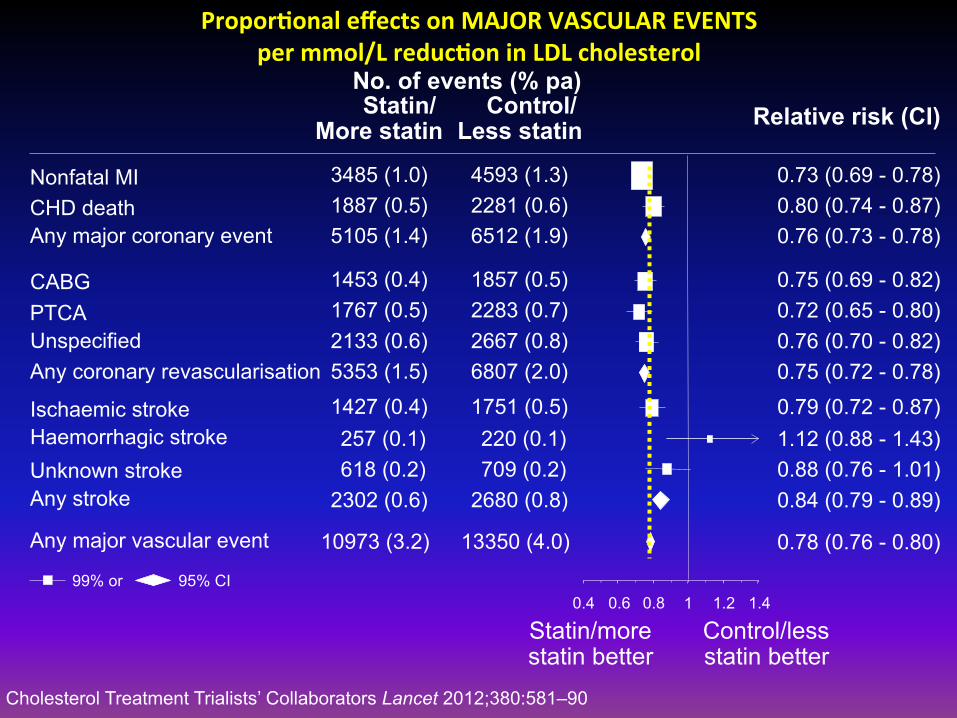
Propor/onal effects on MAJOR VASCULAR EVENTS per mmol/L reduc/on in LDL cholesterol
0.4 0.6 0.8 1 1.2 1.4
No. of events (% pa) Statin/
More statin Contr ol/ Relative risk (CI)
Statin/more statin better
Control/less statin better
Nonfatal MI CHD death Any major coronary event CABG PTCA Unspecified Any coronary revascularisation Ischaemic stroke Haemorrhagic stroke Unknown stroke Any stroke Any major vascular event
3485 (1.0) 1887 (0.5) 5105 (1.4) 1453 (0.4) 1767 (0.5) 2133 (0.6) 5353 (1.5) 1427 (0.4) 257 (0.1) 618 (0.2)
2302 (0.6) 10973 (3.2)
4593 (1.3) 2281 (0.6) 6512 (1.9) 1857 (0.5) 2283 (0.7) 2667 (0.8) 6807 (2.0) 1751 (0.5) 220 (0.1) 709 (0.2)
2680 (0.8) 13350 (4.0)
0.73 (0.69 - 0.78) 0.80 (0.74 - 0.87) 0.76 (0.73 - 0.78) 0.75 (0.69 - 0.82) 0.72 (0.65 - 0.80) 0.76 (0.70 - 0.82) 0.75 (0.72 - 0.78) 0.79 (0.72 - 0.87) 1.12 (0.88 - 1.43) 0.88 (0.76 - 1.01) 0.84 (0.79 - 0.89) 0.78 (0.76 - 0.80)
99% or 95% CI
Cholesterol Treatment Trialists’ Collaborators Lancet 2012;380:581–90
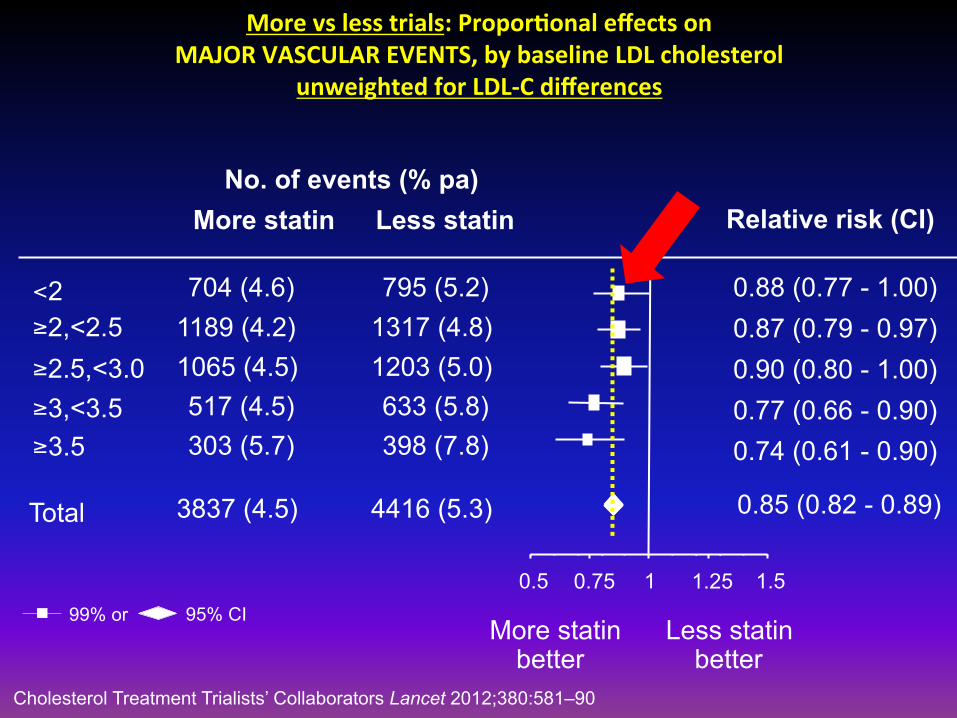
More vs less trials: Propor/onal effects on MAJOR VASCULAR EVENTS, by baseline LDL cholesterol
unweighted for LDL-‐C differences
0.88 (0.77 - 1.00) 0.87 (0.79 - 0.97) 0.90 (0.80 - 1.00) 0.77 (0.66 - 0.90) 0.74 (0.61 - 0.90) 0.85 (0.82 - 0.89)
No. of events (% pa) More statin Less statin Relative risk (CI)
More statin better
Less statin better
99% or 95% CI
≥ 3.5
Total 3837 (4.5) 4416 (5.3)
< 2 ≥ 2,<2.5 ≥ 2.5,<3.0 ≥ 3,<3.5
704 (4.6) 1189 (4.2) 1065 (4.5) 517 (4.5) 303 (5.7)
795 (5.2) 1317 (4.8) 1203 (5.0) 633 (5.8) 398 (7.8)
0.5 0.75 1 1.25 1.5
Cholesterol Treatment Trialists’ Collaborators Lancet 2012;380:581–90
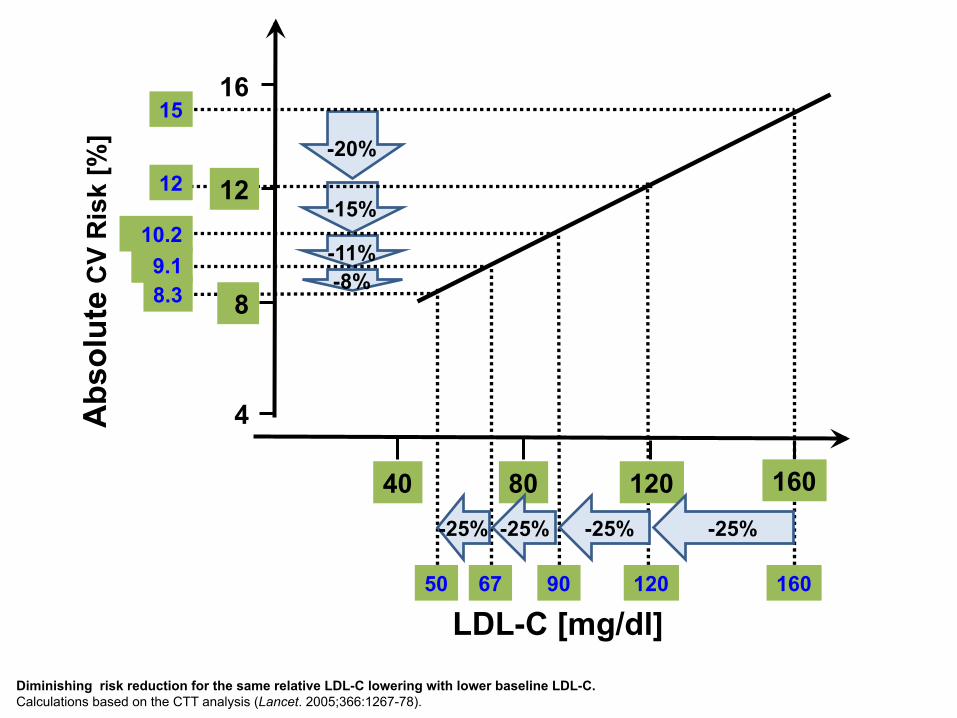
-25% -25%
16
4
160 120 90 67 50
-20%
-15%
-11% -8%
LDL-C [mg/dl]
8
12
80 120 40 160
10.2
15
12
8.3 9.1
Abs
olut
e C
V R
isk
[%]
-25% -25%
Diminishing risk reduction for the same relative LDL-C lowering with lower baseline LDL-C. Calculations based on the CTT analysis (Lancet. 2005;366:1267-78).
But: Clinicians treat patients, not meta-analysis

-‐120
-‐100
-‐80
-‐60
-‐40
-‐20
0
20
40
60 Change in LDL-‐C (% baseline)
-‐100
-‐50
0
50
100 PSCK9 12 months
Percent LDL-C Reduction in JUPITER Rosuvastatin 20 mg
Awan Z et al. Clin Chem 2011
N=1,000
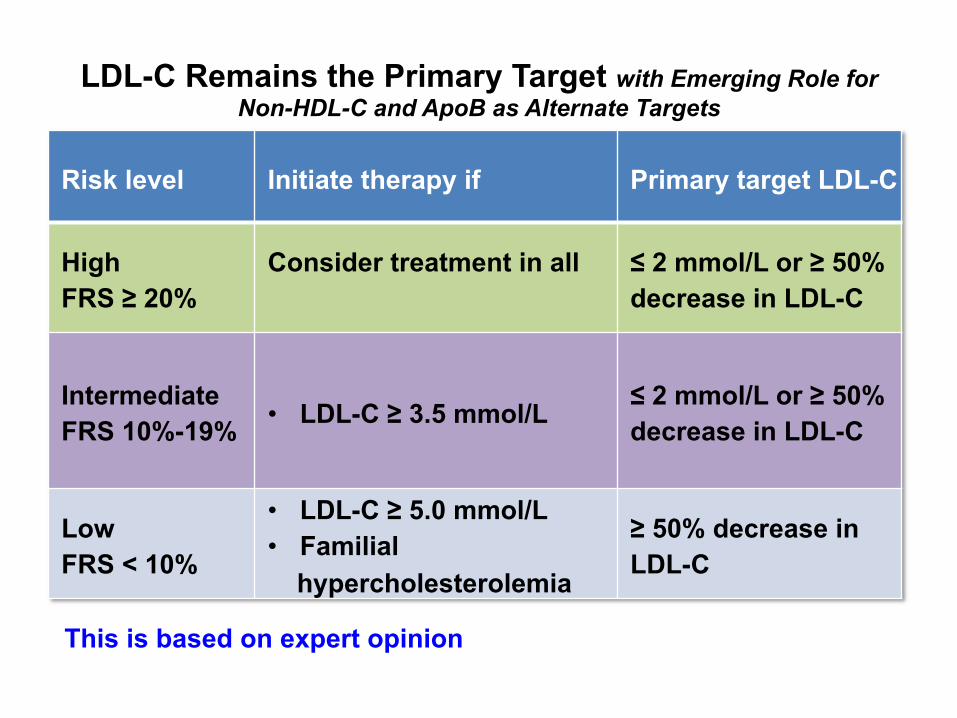
LDL-C Remains the Primary Target with Emerging Role for Non-HDL-C and ApoB as Alternate Targets
Risk level Initiate therapy if Primary target LDL-C
High FRS ≥ 20%
Consider treatment in all
≤ 2 mmol/L or ≥ 50% decrease in LDL-C
Intermediate FRS 10%-19% • LDL-C ≥ 3.5 mmol/L ≤ 2 mmol/L or ≥ 50%
decrease in LDL-C
Low FRS < 10%
• LDL-C ≥ 5.0 mmol/L • Familial
hypercholesterolemia
≥ 50% decrease in LDL-C
This is based on expert opinion
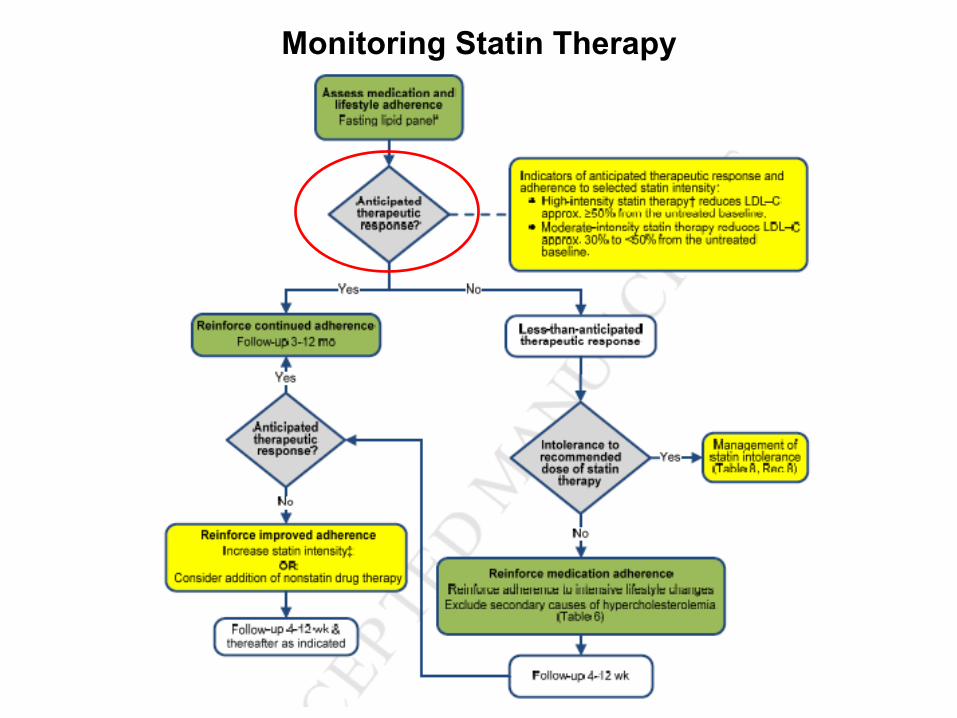
Monitoring Statin Therapy

Indicators of anticipated therapeutic response and adherence to selected statin intensity: High intensity statin therapy reduces LDL-C approx. 50% from the untreated baseline
“The evidence is less clear regarding the most appropriate tests for determining whether an anticipated therapeutic response to statin therapy has occurred on the maximally tolerated dose. RCT evidence to support the use of specific LDL–C or non-HDL–C targets was not identified. The focus is on the intensity of the statin therapy, but as an aid to monitoring response to therapy and adherence, it is reasonable to use as indicators of anticipated therapeutic response to statin therapy.”
Is HDL-C still relevant?
A time to pause…
2015 Guidelines for microbes

Recent HDL Stories v Torcetrapib v Accord (Fenofibrate) v Mendelian Randomization (ABCA1) v Aim High (Niacin) v Mendelian Randomization v Dalcetrapib v HPS-2 THRIVE (Niacin +Laropiprant) v CER, CSL-112, RVX-208
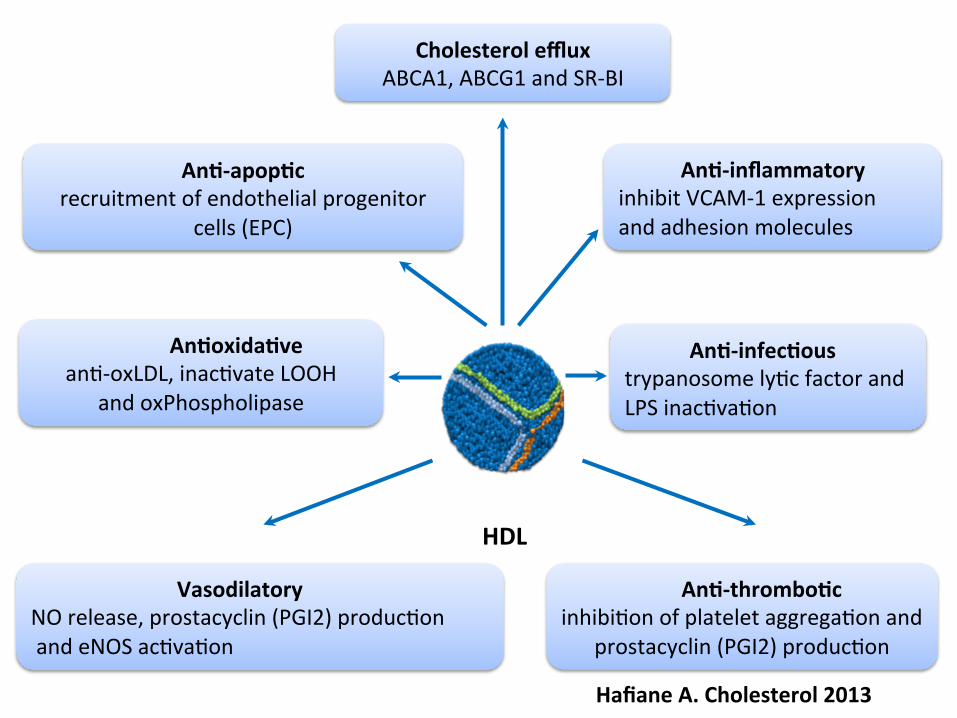
Cholesterol efflux ABCA1, ABCG1 and SR-‐BI
An/-‐infec/ous trypanosome lyWc factor and LPS inacWvaWon
An/-‐apop/c recruitment of endothelial progenitor
cells (EPC)
Vasodilatory NO release, prostacyclin (PGI2) producWon and eNOS acWvaWon
An/-‐inflammatory inhibit VCAM-‐1 expression and adhesion molecules
An/oxida/ve anW-‐oxLDL, inacWvate LOOH
and oxPhospholipase
An/-‐thrombo/c inhibiWon of platelet aggregaWon and
prostacyclin (PGI2) producWon
HDL
Hafiane A. Cholesterol 2013
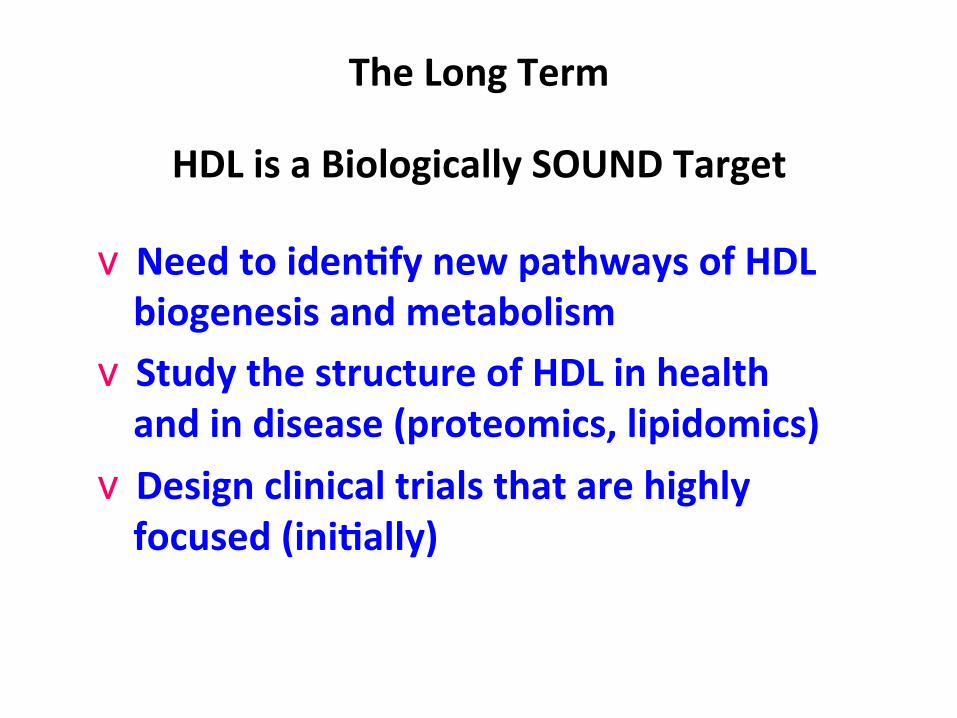
v Need to iden/fy new pathways of HDL biogenesis and metabolism
v Study the structure of HDL in health and in disease (proteomics, lipidomics)
v Design clinical trials that are highly focused (ini/ally)
The Long Term
HDL is a Biologically SOUND Target

Non-statin Drugs?

Clinical study DATA
§ Fibrates VA-HIT; FIELD; Accord § Niacin: AIM-HIGH; HPS2-THRIVE § Ezetimibe § Bile acid sequestrants § Cetrapibs (CETP Inhibitors)
Effects of CombinaWon Lipid Therapy on Cardiovascular Events in Type 2 Diabetes Mellitus: The AcWon to Control Cardiovascular Risk in Diabetes (ACCORD) Lipid Trial
Henry C. Ginsberg, MD College of Physicians & Surgeons , Columbia University, New York For The ACCORD Study Group
Effects of Combina/on Lipid Therapy in Type 2 Diabetes Mellitus The ACCORD Study Group Published at www.nejm.org March 14, 2010 (10.1056/NEJMoa1001282)
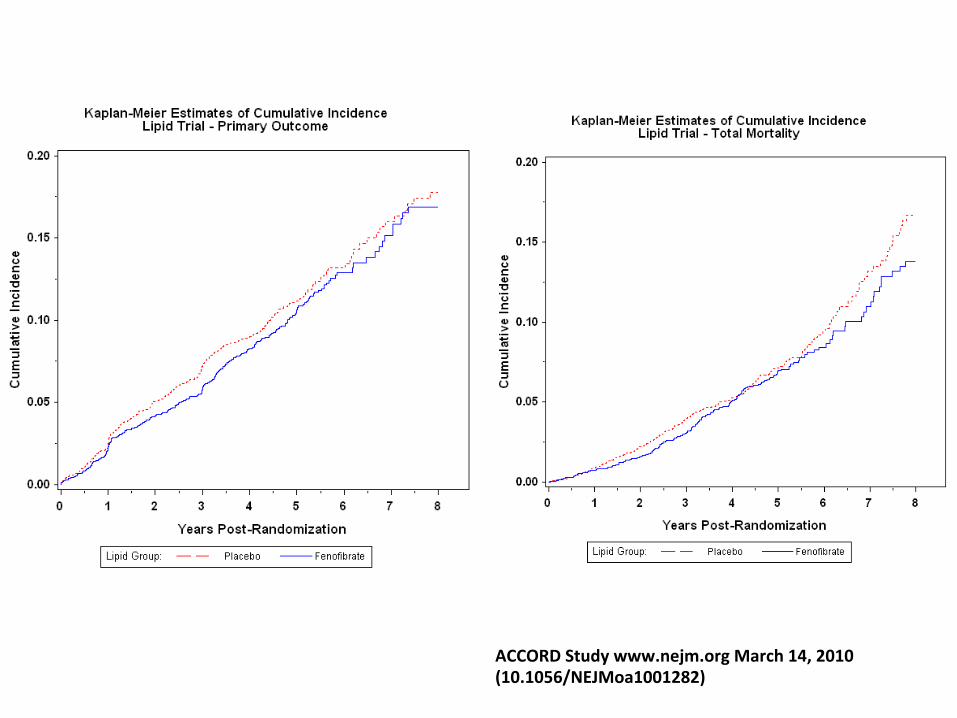
ACCORD Study www.nejm.org March 14, 2010 (10.1056/NEJMoa1001282)

Meta-‐Analysis of Fibrate trials
Jun M, Lancet 2010;375:1875

Niacin
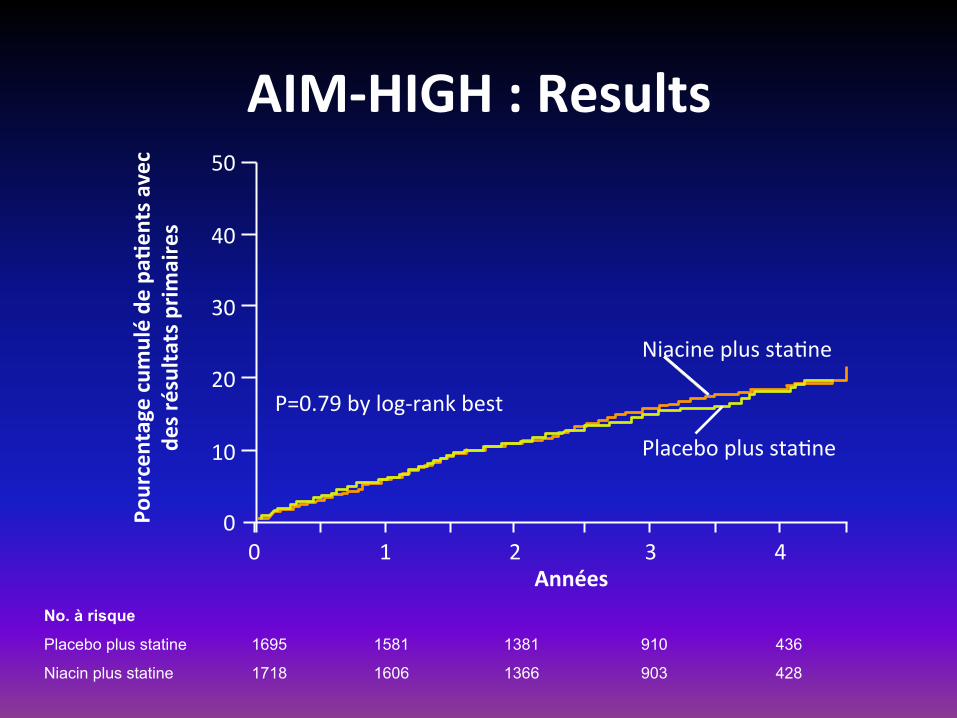
AIM-‐HIGH : Results 50
40
30
20
10
0 0 1 2 3 4
P=0.79 by log-‐rank best
Niacine plus staWne
Placebo plus staWne
Années
Pourcentage cumulé de
pa/
ents avec
des résultats prim
aires
No. à risque
Placebo plus statine 1695 1581 1381 910 436
Niacin plus statine 1718 1606 1366 903 428
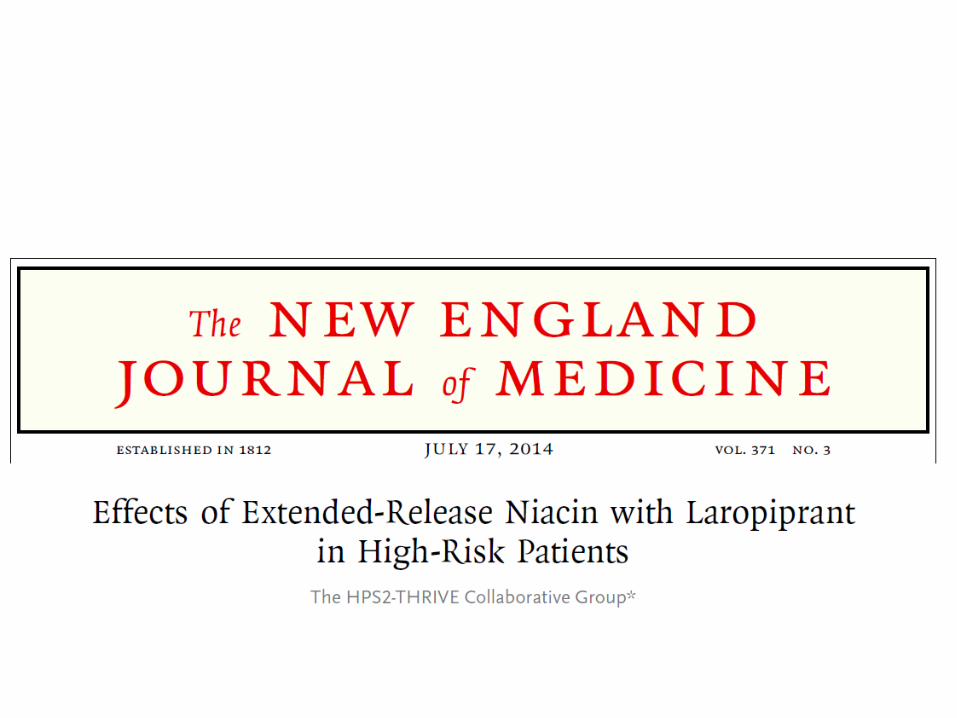
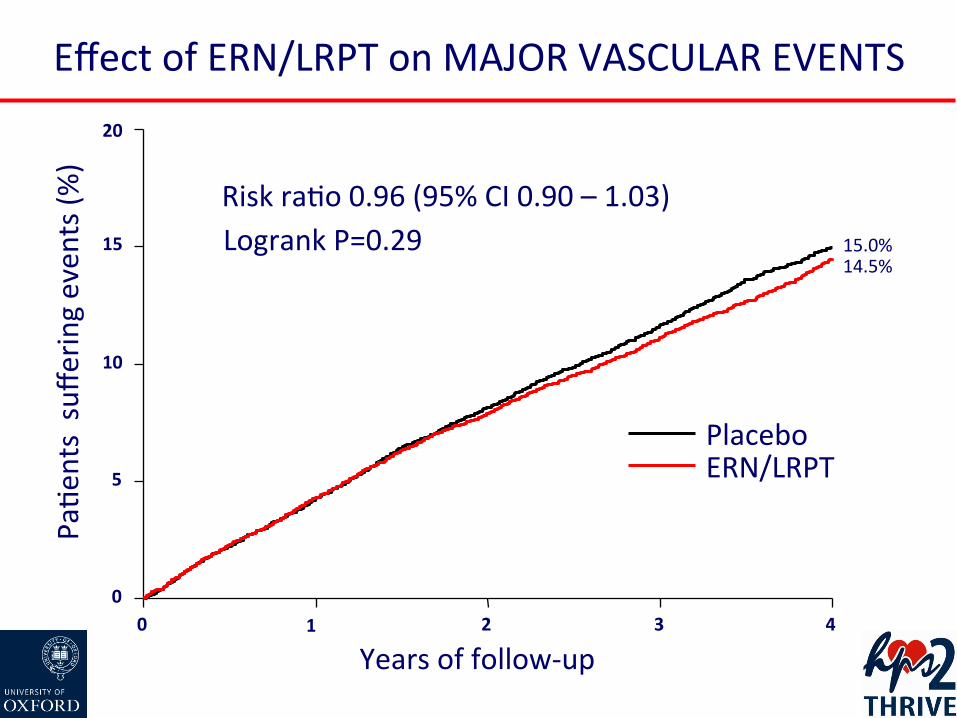
Effect of ERN/LRPT on MAJOR VASCULAR EVENTS
0 1 2 3 4
Years of follow-‐up
0
5
10
15
20
PaWe
nts suffe
ring even
ts (%
)
15.0% 14.5%
Placebo ERN/LRPT
Logrank P=0.29 Risk raWo 0.96 (95% CI 0.90 – 1.03)
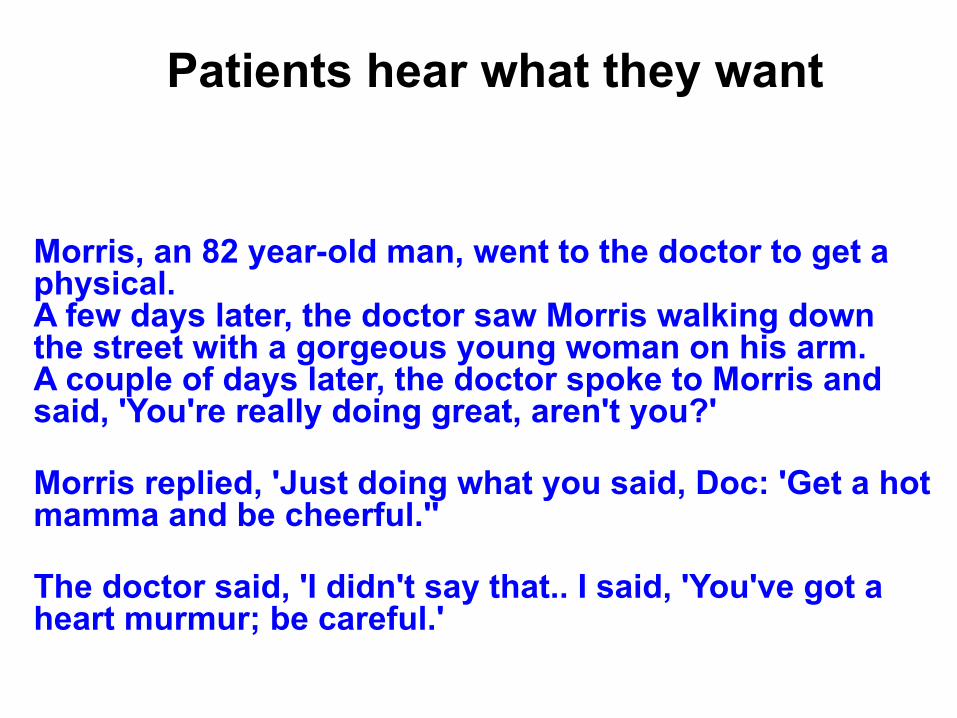
Patients hear what they want
Morris, an 82 year-old man, went to the doctor to get a physical. A few days later, the doctor saw Morris walking down the street with a gorgeous young woman on his arm. A couple of days later, the doctor spoke to Morris and said, 'You're really doing great, aren't you?' Morris replied, 'Just doing what you said, Doc: 'Get a hot mamma and be cheerful.'' The doctor said, 'I didn't say that.. I said, 'You've got a heart murmur; be careful.'
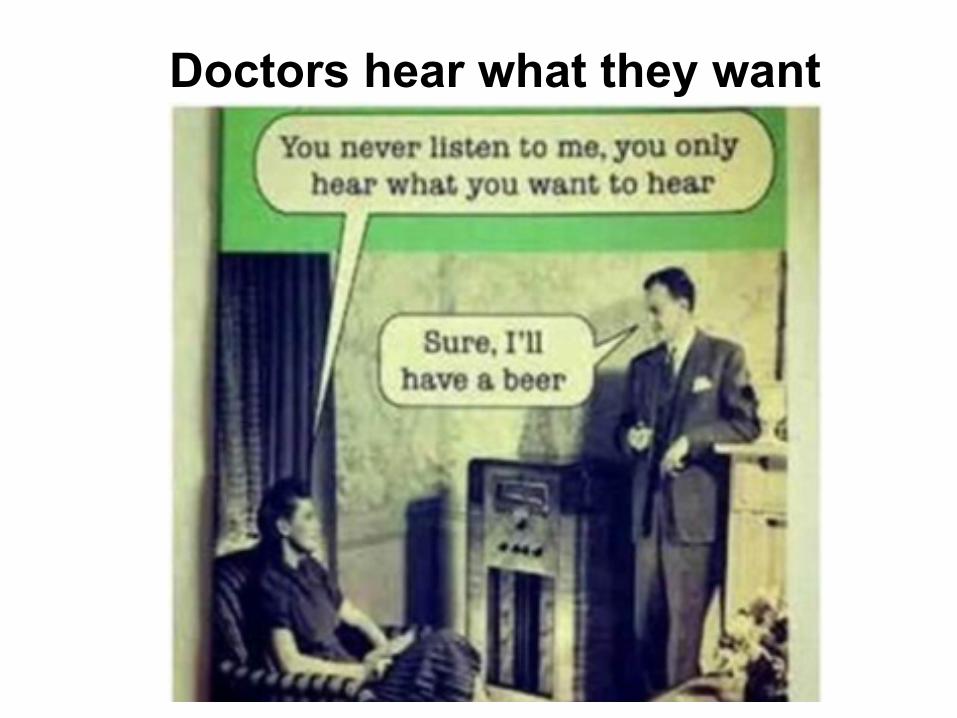
Doctors hear what they want
IMProved Reduc/on of Outcomes: Vytorin Efficacy Interna/onal Trial
A Mul/center, Double-‐Blind, Randomized Study to Establish the Clinical Benefit and Safety of Vytorin (Eze/mibe/Simvasta/n Tablet) vs Simvasta/n Monotherapy in High-‐Risk Subjects Presen/ng
With Acute Coronary Syndrome
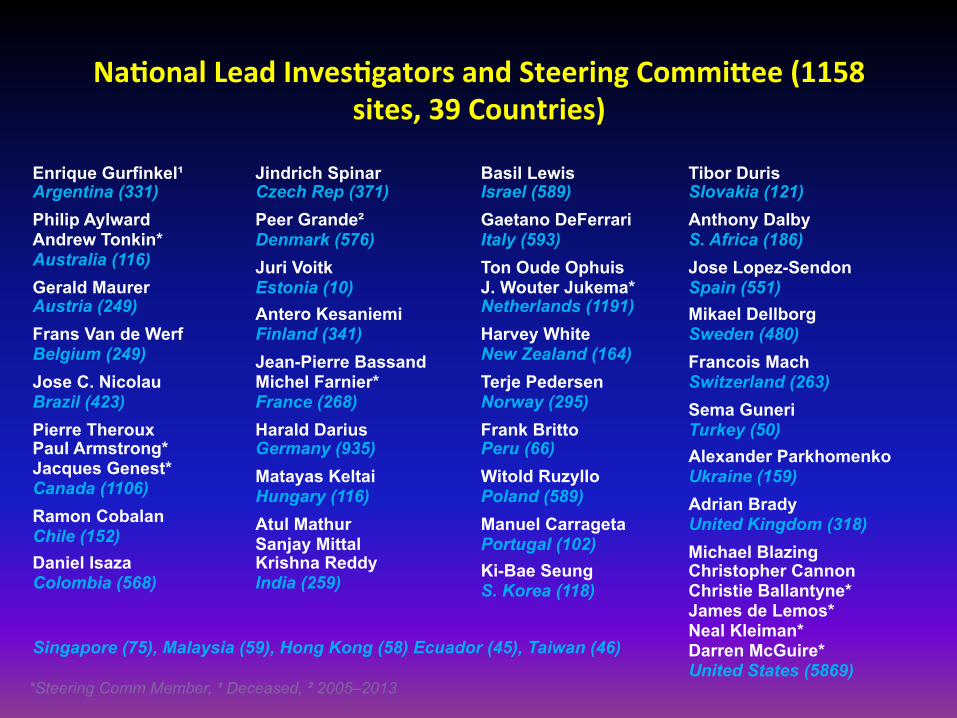
Na/onal Lead Inves/gators and Steering CommiHee (1158 sites, 39 Countries)
Enrique Gurfinkel¹ Argentina (331) Philip Aylward Andrew Tonkin* Australia (116) Gerald Maurer Austria (249) Frans Van de Werf Belgium (249) Jose C. Nicolau Brazil (423) Pierre Theroux Paul Armstrong* Jacques Genest* Canada (1106) Ramon Cobalan Chile (152) Daniel Isaza Colombia (568)
Jindrich Spinar Czech Rep (371) Peer Grande² Denmark (576) Juri Voitk Estonia (10) Antero Kesaniemi Finland (341) Jean-Pierre Bassand Michel Farnier* France (268) Harald Darius Germany (935) Matayas Keltai Hungary (116) Atul Mathur Sanjay Mittal Krishna Reddy India (259)
Basil Lewis Israel (589) Gaetano DeFerrari Italy (593) Ton Oude Ophuis J. Wouter Jukema* Netherlands (1191) Harvey White New Zealand (164) Terje Pedersen Norway (295) Frank Britto Peru (66) Witold Ruzyllo Poland (589) Manuel Carrageta Portugal (102) Ki-Bae Seung S. Korea (118)
Singapore (75), Malaysia (59), Hong Kong (58) Ecuador (45), Taiwan (46)
*Steering Comm Member, ¹ Deceased, ² 2005–2013
Tibor Duris Slovakia (121) Anthony Dalby S. Africa (186) Jose Lopez-Sendon Spain (551) Mikael Dellborg Sweden (480) Francois Mach Switzerland (263) Sema Guneri Turkey (50) Alexander Parkhomenko Ukraine (159) Adrian Brady United Kingdom (318) Michael Blazing Christopher Cannon Christie Ballantyne* James de Lemos* Neal Kleiman* Darren McGuire* United States (5869)
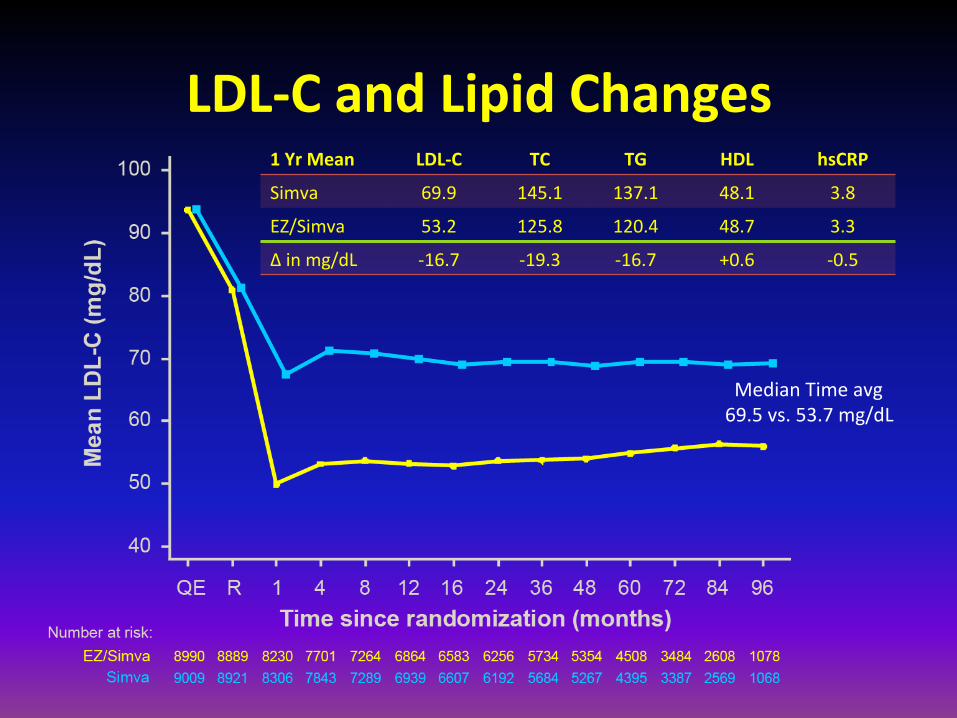
LDL-‐C and Lipid Changes 1 Yr Mean LDL-‐C TC TG HDL hsCRP
Simva 69.9 145.1 137.1 48.1 3.8
EZ/Simva 53.2 125.8 120.4 48.7 3.3
Δ in mg/dL -‐16.7 -‐19.3 -‐16.7 +0.6 -‐0.5
Median Time avg 69.5 vs. 53.7 mg/dL
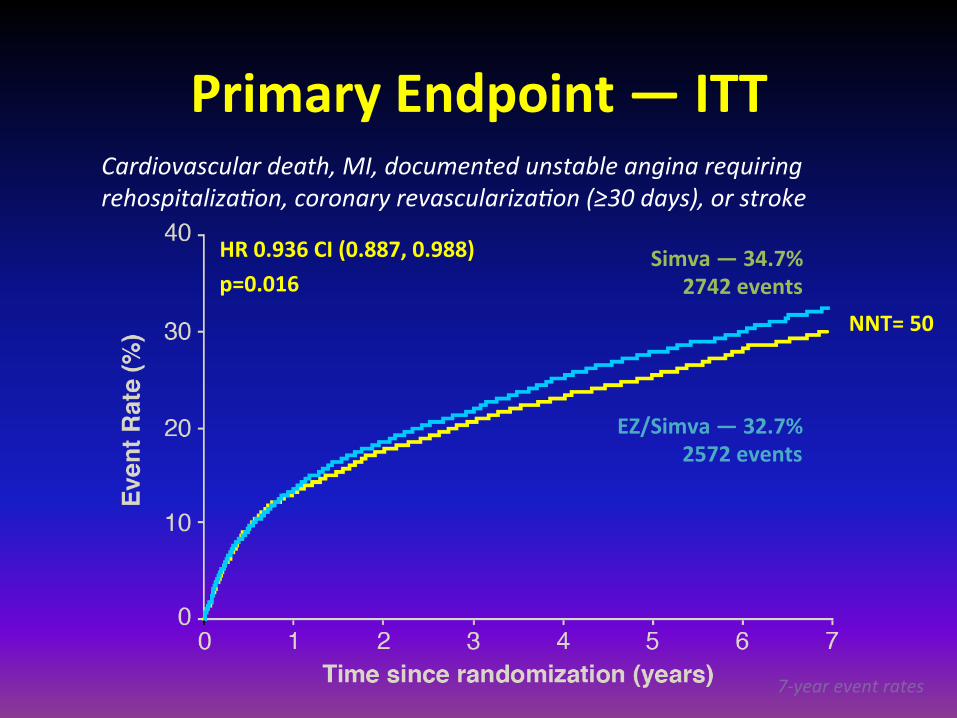
Primary Endpoint — ITT
Simva — 34.7% 2742 events
EZ/Simva — 32.7% 2572 events
HR 0.936 CI (0.887, 0.988) p=0.016
Cardiovascular death, MI, documented unstable angina requiring rehospitalizaNon, coronary revascularizaNon (≥30 days), or stroke
7-‐year event rates
NNT= 50

IMPROVE-IT vs. CTT: Ezetimibe vs. Statin Benefit
CTT Collaboration. Lancet 2005; 366:1267-78; Lancet 2010;376:1670-81.
IMPROVE-IT

Conclusions • IMPROVE-IT: First trial demonstrating incremental clinical benefit when adding a non-statin agent (ezetimibe) to statin therapy:
YES: Non-statin lowering LDL-C with ezetimibe reduces cardiovascular events
YES: Even Lower is Even Better (achieved mean LDL-C 53 vs. 70 mg/dL at 1yr)
YES: Confirms ezetimibe safety profile • Reaffirms the LDL hypothesis, that reducing LDL-‐C prevents cardiovascular events
• Results could be considered for future guidelines

Effects of Dalcetrapib in Pa/ents with a Recent Acute Coronary Syndrome
Schawartz GG. N Engl J Med. 2012 Nov 5. [Epub ahead of print]
44
DALcetrapib Outcomes
45

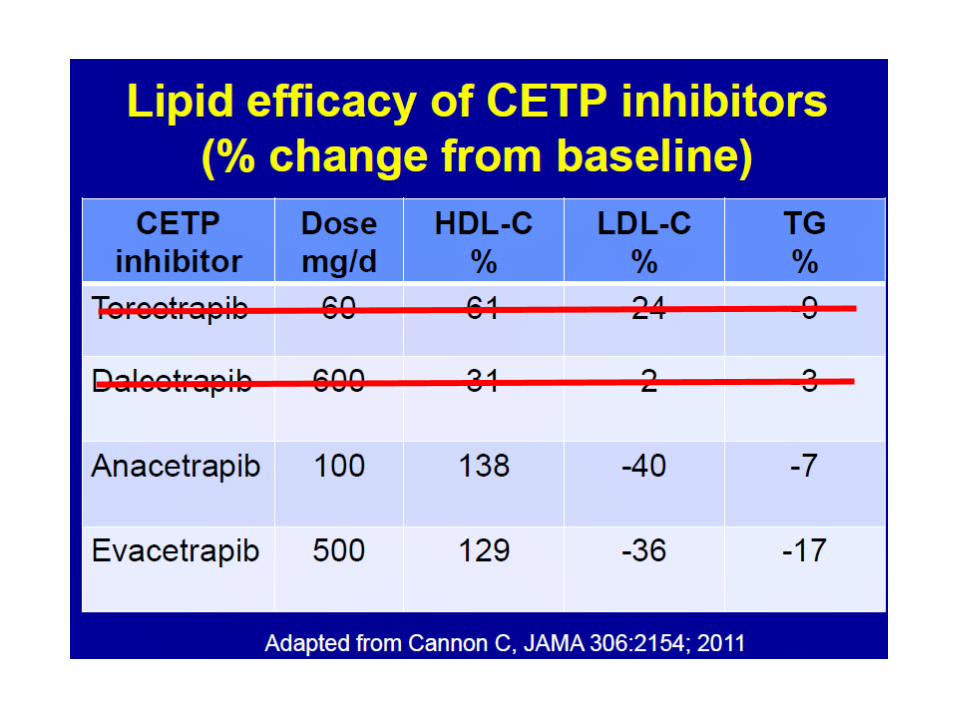
Inhibiting CETP
v Anacetrapib (REVEAL TIMI 55) v Evacetrapib (ACCELERATE)
Anacetrapib: Effects on LDL-C and HDL-C
HDL-‐C
Study Week
Baseline Wk 6 Wk 12 Wk 18 Wk 24 Wk 30 Wk 46 Wk 62 Wk 76
HD
L-C
(mg/
dL) (
SE
)
0
20
40
60
80
100
120
Anacetrapib Placebo
Anacetrapib n = 776 757 718 687 647 607 572 543 Placebo n = 766 761 741 744 736 711 691 666
LDL-‐C
Study Week
Baseline Wk 6 Wk 12 Wk 18 Wk 24 Wk 30 Wk 46 Wk 62 Wk 76
LDL-
C (m
g/dL
) (S
E)
0
20
40
60
80
100
Anacetrapib Placebo
Anacetrapib n = 804 771 716 687 646 604 568 540 Placebo n = 803 759 741 743 735 711 691 666
-‐39.8% (p<0.001) +138.1% (p<0.001)

In Conclusions…
• To date, only ezetimibe added to optimally used statins change outcomes.
• Raising HDL-C pharmacologically does not improve CV outcomes
• The role of niacin and fibrates for CAD prevention is really, really, really unclear.
• The potential for benefit must be weighed against the concern of harm.
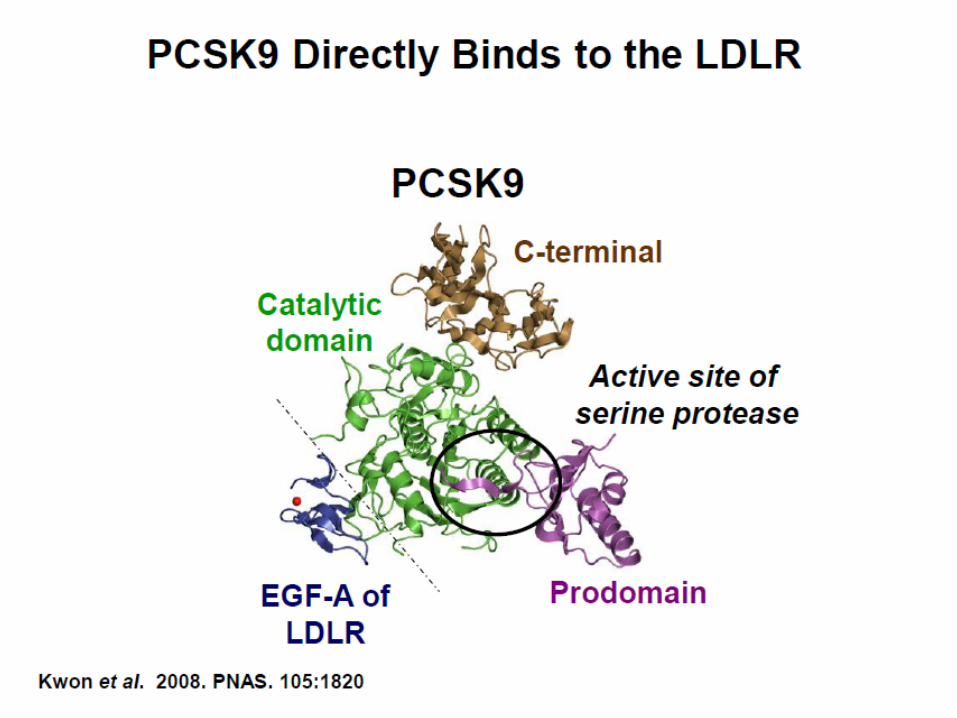
Proprotein Convertase Subtilisin/Kexin Type 9
Evolutionary Conservation: Must be important
Bacillus amyloliquefaciens Saccharomyces cerevisiae Homo sapiens

ER TGN
Endosome Lysosome
LDL-R
PCSK9
Deg
rada
tion
pre-PCSK9
A: LDL-R pathway in absence of PCSK9
B: Intracellular PCSK9 route
C: Extracellular PCSK9 route
Mature PCSK9
LDL
apoB
PCSK9

Terminology of Monoclonal AnWbodies
1. Weiner LM. J Immunother. 2006;29:1-‐9.; 2. Yang XD, et al. Crit Rev Oncol Hematol. 2001;38:17-‐23.; 3. Lonberg N. Nat Biotechnol. 2005;23:1117-‐1125.; 4. Gerber DE. Am Fam Physician. 2008;77:311-‐319.
Mouse (0% human)
Fully Human (100% human)
Humanized (> 90% human)
Chimeric (65% human)
-‐umab -‐zumab -‐ximab -‐omab Generic suffix:
Source (% human protein)
High Low Poten/al for immunogenicity
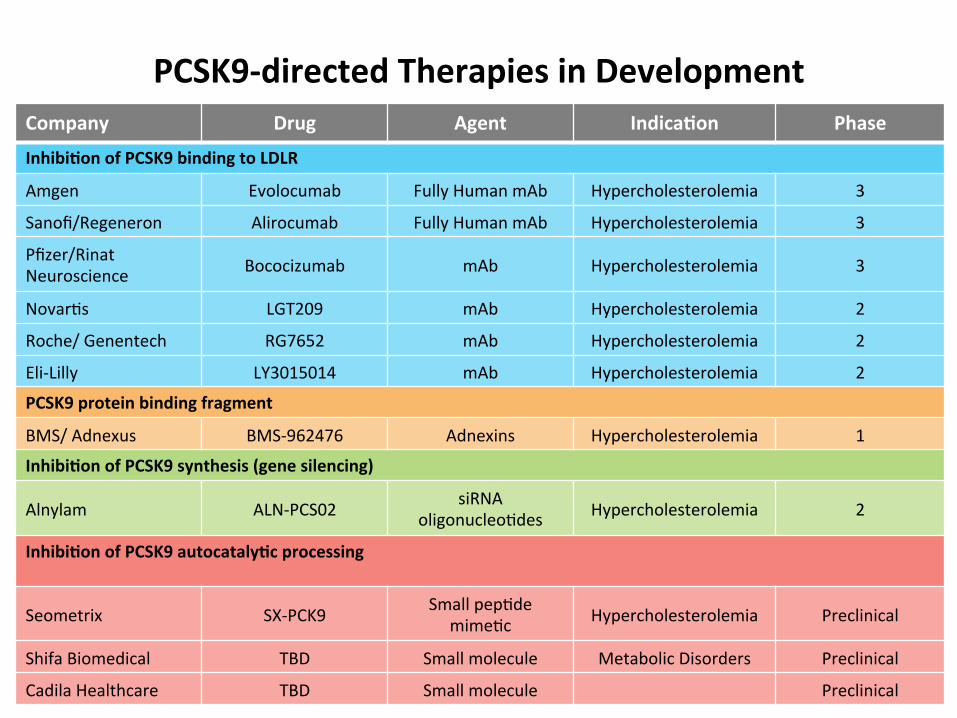
PCSK9-‐directed Therapies in Development Company Drug Agent Indica/on Phase
Inhibi/on of PCSK9 binding to LDLR
Amgen Evolocumab Fully Human mAb Hypercholesterolemia 3
Sanofi/Regeneron Alirocumab Fully Human mAb Hypercholesterolemia 3
Pfizer/Rinat Neuroscience Bococizumab mAb Hypercholesterolemia 3
NovarWs LGT209 mAb Hypercholesterolemia 2
Roche/ Genentech RG7652 mAb Hypercholesterolemia 2
Eli-‐Lilly LY3015014 mAb Hypercholesterolemia 2
PCSK9 protein binding fragment
BMS/ Adnexus BMS-‐962476 Adnexins Hypercholesterolemia 1
Inhibi/on of PCSK9 synthesis (gene silencing)
Alnylam ALN-‐PCS02 siRNA oligonucleoWdes Hypercholesterolemia 2
Inhibi/on of PCSK9 autocataly/c processing
Seometrix SX-‐PCK9 Small pepWde mimeWc Hypercholesterolemia Preclinical
Shifa Biomedical TBD Small molecule Metabolic Disorders Preclinical
Cadila Healthcare TBD Small molecule Preclinical
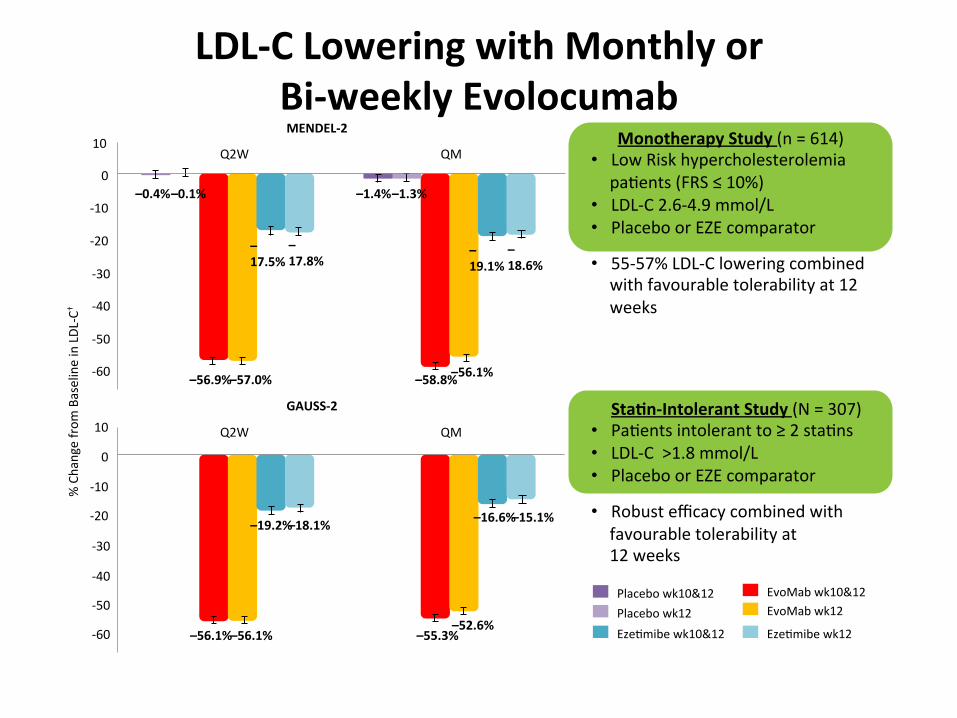
LDL-‐C Lowering with Monthly or Bi-‐weekly Evolocumab
Monotherapy Study (n = 614) • Low Risk hypercholesterolemia paWents (FRS ≤ 10%)
• LDL-‐C 2.6-‐4.9 mmol/L • Placebo or EZE comparator
• 55-‐57% LDL-‐C lowering combined with favourable tolerability at 12 weeks
Sta/n-‐Intolerant Study (N = 307) • PaWents intolerant to ≥ 2 staWns • LDL-‐C >1.8 mmol/L • Placebo or EZE comparator
• Robust efficacy combined with favourable tolerability at 12 weeks
Placebo wk10&12 Placebo wk12
EvoMab wk10&12 EvoMab wk12
EzeWmibe wk10&12 EzeWmibe wk12
0
-‐10
-‐20
-‐30
-‐40
-‐50
-‐60
-‐60
-‐50
-‐40
-‐30
-‐20
-‐10
0
10
MENDEL-‐2
QM Q2W
QM Q2W
GAUSS-‐2
–56.9%
–0.1%
10
–0.4%
–17.8%
–17.5%
–18.6%
–19.1%
–1.3% –1.4%
–57.0% –58.8% –56.1%
–56.1% –56.1% –55.3% –52.6%
–19.2% –18.1% –16.6% –15.1%
% Change from
Baseline in LDL
-‐C†
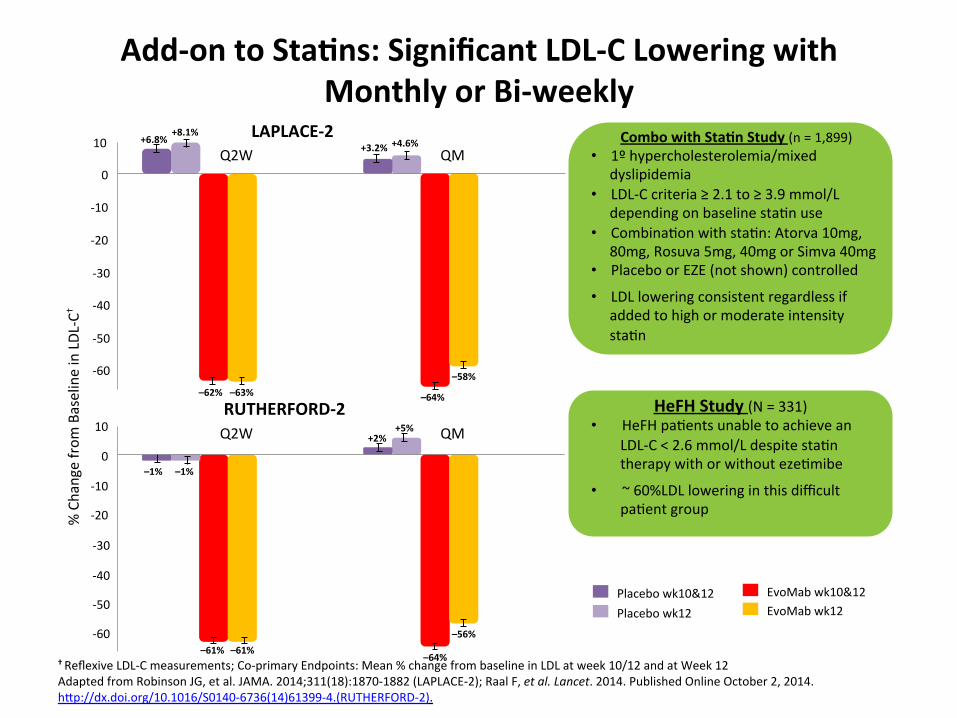
Add-‐on to Sta/ns: Significant LDL-‐C Lowering with Monthly or Bi-‐weekly
† Reflexive LDL-‐C measurements; Co-‐primary Endpoints: Mean % change from baseline in LDL at week 10/12 and at Week 12 Adapted from Robinson JG, et al. JAMA. 2014;311(18):1870-‐1882 (LAPLACE-‐2); Raal F, et al. Lancet. 2014. Published Online October 2, 2014. hxp://dx.doi.org/10.1016/S0140-‐6736(14)61399-‐4.(RUTHERFORD-‐2).
Combo with Sta/n Study (n = 1,899) • 1º hypercholesterolemia/mixed
dyslipidemia • LDL-‐C criteria ≥ 2.1 to ≥ 3.9 mmol/L
depending on baseline staWn use • CombinaWon with staWn: Atorva 10mg,
80mg, Rosuva 5mg, 40mg or Simva 40mg • Placebo or EZE (not shown) controlled
• LDL lowering consistent regardless if added to high or moderate intensity staWn
HeFH Study (N = 331) • HeFH paWents unable to achieve an
LDL-‐C < 2.6 mmol/L despite staWn therapy with or without ezeWmibe
• ~ 60%LDL lowering in this difficult paWent group
Placebo wk10&12 Placebo wk12
EvoMab wk10&12 EvoMab wk12
10
0
-‐10
-‐20
-‐30
-‐40
-‐50
-‐60
-‐60
-‐50
-‐40
-‐30
-‐20
-‐10
0
10
% Change from
Baseline in LDL
-‐C†
LAPLACE-‐2 QM Q2W
QM Q2W RUTHERFORD-‐2
–62% –63% –64%
–58%
+6.8% +8.1%
+3.2% +4.6%
–1% –1%
+2% +5%
–61% –61% –64%
–56%

Effect of Evolocumab on Other Lipid Parameters across Phase 3 Studies
Without Sta/ns* vs Eze/mibe
With Sta/ns ± Eze/mibe vs Placebo
MENDEL-‐2 GAUSS-‐2 LAPLACE-‐2 RUTHERFORD-‐2
Endpoint (wk10/12)
140 mg Q2W/ 420 mg QM
140 mg Q2W/ 420 mg QM
140 mg Q2W/ 420 mg QM
140 mg Q2W/ 420 mg QM
TC Not reported -‐24% / -‐26%* -‐41% / -‐40% -‐42% / -‐44%
Non-‐HDL-‐C -‐36% / -‐36%* -‐32% / -‐35%* -‐61% / -‐60% -‐56% / -‐60%
ApoB -‐34% / -‐35%* -‐32% /-‐35%* -‐56% / -‐56% -‐49% / -‐55%
Lp(a) -‐18% / -‐17%* -‐24% / -‐25%* -‐30% / -‐28% -‐31% / -‐31%
TG -‐8% / -‐12%* -‐3% / -‐6%* -‐18% / -‐23% -‐22% / -‐17%
VLDL-‐C -‐6% / -‐13%* -‐2% / -‐4%* -‐19% / -‐23% -‐23% / -‐16%
HDL-‐C 5% / 4%* 5% / 6%* 6% / 8% 8% / 9%
ApoA1 3% / 3%* 6% / 3% 3% / 5% 7% / 5%
Mean % Change from Baseline Versus Placebo and/or Eze/mibe
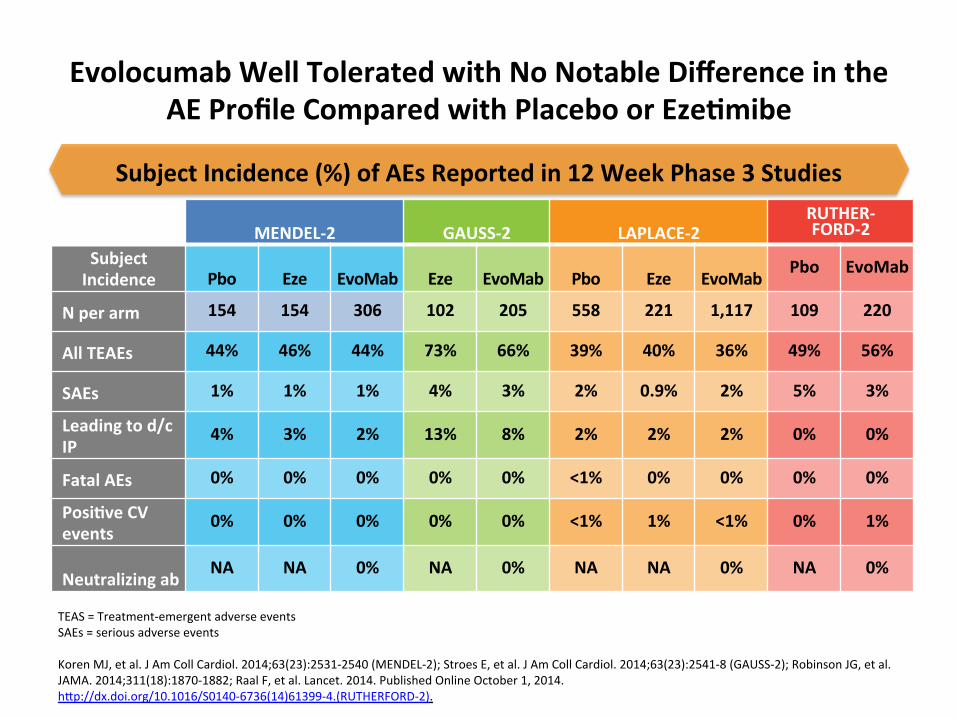
Evolocumab Well Tolerated with No Notable Difference in the AE Profile Compared with Placebo or Eze/mibe
TEAS = Treatment-‐emergent adverse events SAEs = serious adverse events Koren MJ, et al. J Am Coll Cardiol. 2014;63(23):2531-‐2540 (MENDEL-‐2); Stroes E, et al. J Am Coll Cardiol. 2014;63(23):2541-‐8 (GAUSS-‐2); Robinson JG, et al. JAMA. 2014;311(18):1870-‐1882; Raal F, et al. Lancet. 2014. Published Online October 1, 2014. hxp://dx.doi.org/10.1016/S0140-‐6736(14)61399-‐4.(RUTHERFORD-‐2).
MENDEL-‐2 GAUSS-‐2 LAPLACE-‐2 RUTHER-‐FORD-‐2
Subject Incidence Pbo Eze EvoMab Eze EvoMab Pbo Eze EvoMab
Pbo EvoMab
N per arm 154 154 306 102 205 558 221 1,117 109 220
All TEAEs 44% 46% 44% 73% 66% 39% 40% 36% 49% 56%
SAEs 1% 1% 1% 4% 3% 2% 0.9% 2% 5% 3%
Leading to d/c IP
4% 3% 2% 13% 8% 2% 2% 2% 0% 0%
Fatal AEs 0% 0% 0% 0% 0% <1% 0% 0% 0% 0%
Posi/ve CV events
0% 0% 0% 0% 0% <1% 1% <1% 0% 1%
Neutralizing ab NA NA 0% NA 0% NA NA 0% NA 0%
Subject Incidence (%) of AEs Reported in 12 Week Phase 3 Studies
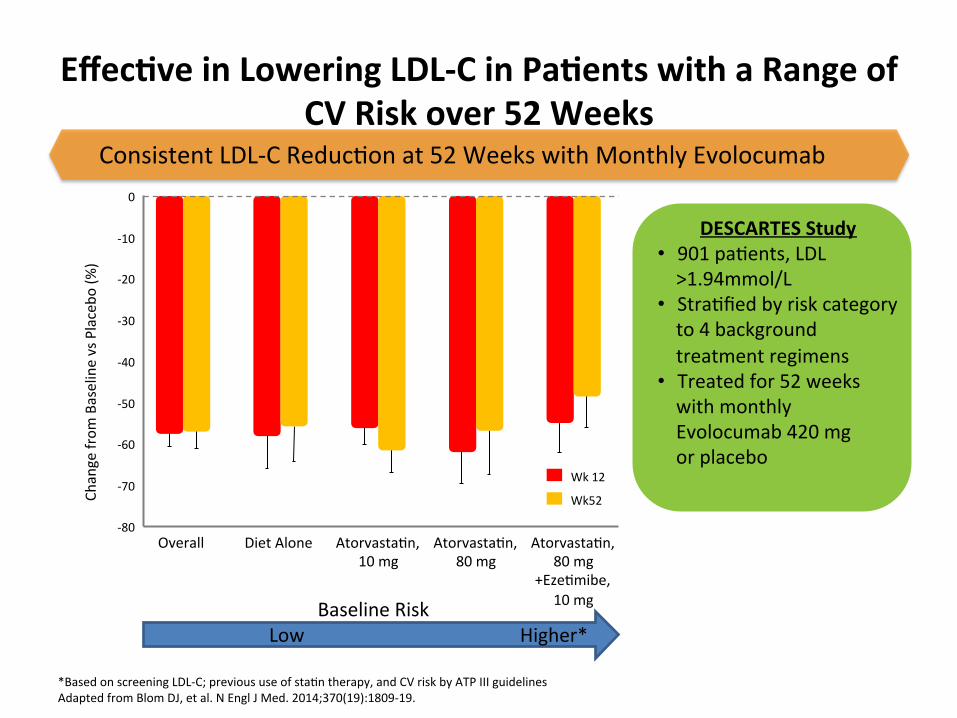
Effec/ve in Lowering LDL-‐C in Pa/ents with a Range of CV Risk over 52 Weeks
.
DESCARTES Study • 901 paWents, LDL >1.94mmol/L
• StraWfied by risk category to 4 background treatment regimens
• Treated for 52 weeks with monthly Evolocumab 420 mg or placebo
0
-‐20
-‐30
-‐40
-‐50
-‐60
Change from
Baseline vs Placebo
(%)
-‐70
-‐80
-‐10
Overall Diet Alone AtorvastaWn, 10 mg
AtorvastaWn, 80 mg
AtorvastaWn, 80 mg
+EzeWmibe, 10 mg
Wk 12
Wk52
Consistent LDL-‐C ReducWon at 52 Weeks with Monthly Evolocumab
*Based on screening LDL-‐C; previous use of staWn therapy, and CV risk by ATP III guidelines Adapted from Blom DJ, et al. N Engl J Med. 2014;370(19):1809-‐19.
Low Higher* Baseline Risk
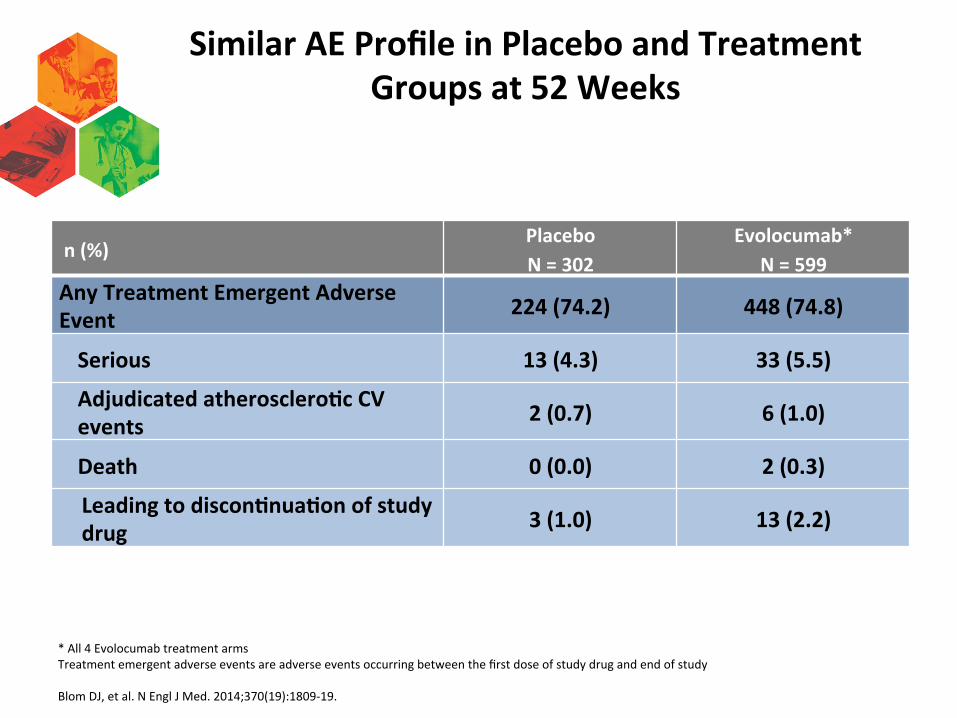
Similar AE Profile in Placebo and Treatment Groups at 52 Weeks
* All 4 Evolocumab treatment arms Treatment emergent adverse events are adverse events occurring between the first dose of study drug and end of study Blom DJ, et al. N Engl J Med. 2014;370(19):1809-‐19.
n (%)Placebo N = 302
Evolocumab* N = 599
Any Treatment Emergent Adverse Event 224 (74.2) 448 (74.8)
Serious 13 (4.3) 33 (5.5)
Adjudicated atherosclero/c CV events 2 (0.7) 6 (1.0)
Death 0 (0.0) 2 (0.3)
Leading to discon/nua/on of study drug 3 (1.0) 13 (2.2)
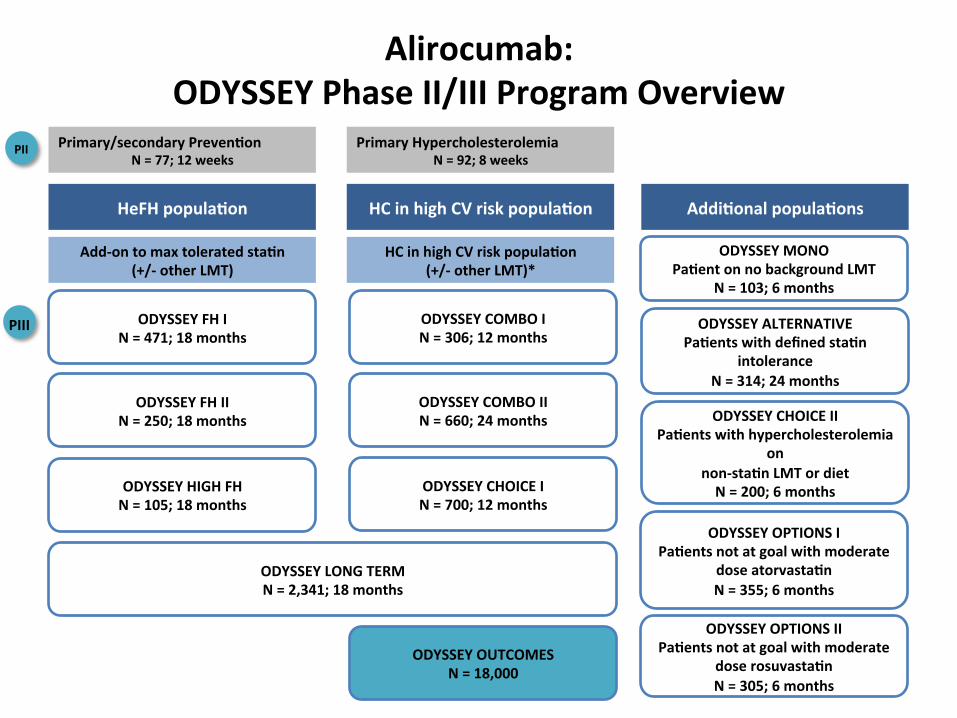
Alirocumab: ODYSSEY Phase II/III Program Overview
HeFH popula/on HC in high CV risk popula/on Addi/onal popula/ons
Add-‐on to max tolerated sta/n (+/-‐ other LMT)
HC in high CV risk popula/on (+/-‐ other LMT)*
ODYSSEY FH I N = 471; 18 months
ODYSSEY FH II N = 250; 18 months
ODYSSEY HIGH FH N = 105; 18 months
ODYSSEY COMBO I N = 306; 12 months
ODYSSEY COMBO II N = 660; 24 months
ODYSSEY CHOICE I N = 700; 12 months
ODYSSEY LONG TERM N = 2,341; 18 months
ODYSSEY OUTCOMES N = 18,000
ODYSSEY MONO Pa/ent on no background LMT
N = 103; 6 months
ODYSSEY ALTERNATIVE Pa/ents with defined sta/n
intolerance N = 314; 24 months
ODYSSEY OPTIONS I Pa/ents not at goal with moderate
dose atorvasta/n N = 355; 6 months
ODYSSEY OPTIONS II Pa/ents not at goal with moderate
dose rosuvasta/n N = 305; 6 months
Primary/secondary Preven/on N = 77; 12 weeks
PII
PIII
Primary Hypercholesterolemia N = 92; 8 weeks
ODYSSEY CHOICE II Pa/ents with hypercholesterolemia
on non-‐sta/n LMT or diet N = 200; 6 months
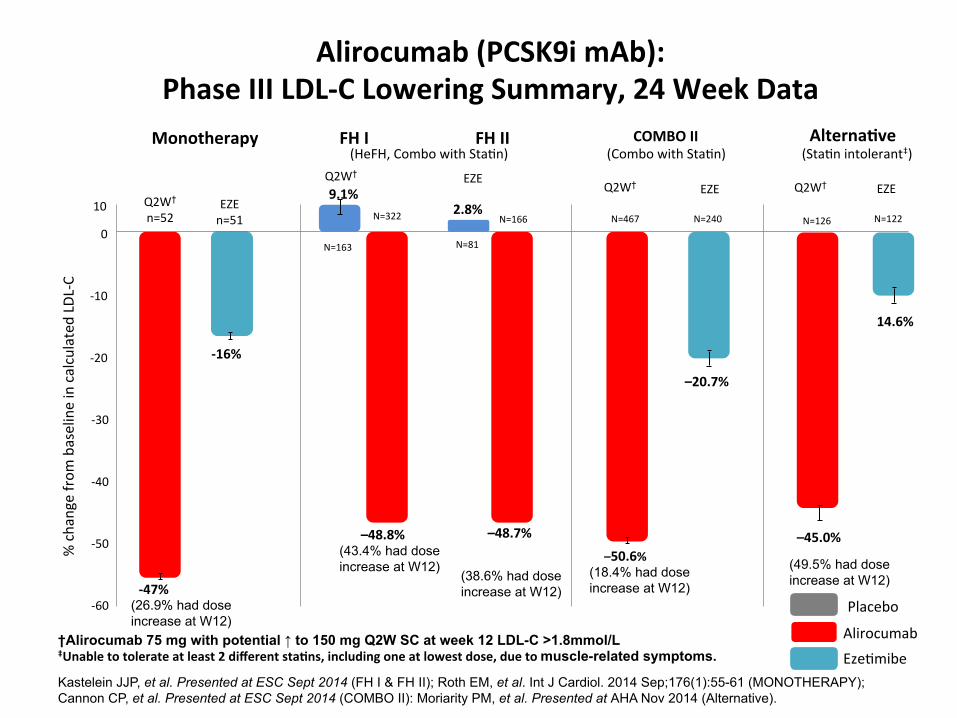
Alirocumab (PCSK9i mAb): Phase III LDL-‐C Lowering Summary, 24 Week Data
†Alirocumab 75 mg with potential ↑ to 150 mg Q2W SC at week 12 LDL-C >1.8mmol/L ‡Unable to tolerate at least 2 different sta/ns, including one at lowest dose, due to muscle-related symptoms.
Kastelein JJP, et al. Presented at ESC Sept 2014 (FH I & FH II); Roth EM, et al. Int J Cardiol. 2014 Sep;176(1):55-61 (MONOTHERAPY); Cannon CP, et al. Presented at ESC Sept 2014 (COMBO II): Moriarity PM, et al. Presented at AHA Nov 2014 (Alternative).
% change from
baseline in calculated LD
L-‐C
10
0
-‐10
-‐20
-‐30
-‐40
-‐50
-‐60
Monotherapy Alterna/ve
Q2W† n=52
-‐47%
EZE n=51
-‐16%
14.6%
N=126
–45.0%
(StaWn intolerant‡)
(26.9% had dose increase at W12)
Alirocumab
EzeWmibe
–20.7%
N=240 N=467
(Combo with StaWn)
(18.4% had dose increase at W12)
COMBO II
–50.6%
FH I FH II (HeFH, Combo with StaWn)
–48.8% –48.7% (43.4% had dose increase at W12)
(38.6% had dose increase at W12)
9.1%
N=163
N=322
N=81
N=166 2.8%
N=122
(49.5% had dose increase at W12)
Placebo
Q2W†
Q2W† Q2W† EZE EZE EZE

Comparable TEAE Profile in Placebo and Treatment Groups aYer at least 52 Weeks* of Treatment
(ODYSSEY Long Term study)
n (%) †Placebo n = 788
Alirocumab n=1550
Any Treatment Emergent Adverse Event 635 (80.6) 1218 (78.6)
Treatment-‐emergent SAEs 139 (17.6) 255 (16.5)
TEAE leading to death 8 (1.0) 7 (0.5)
TEAE leading to treatment discon/nua/on 43 (5.5) 96 (6.2)
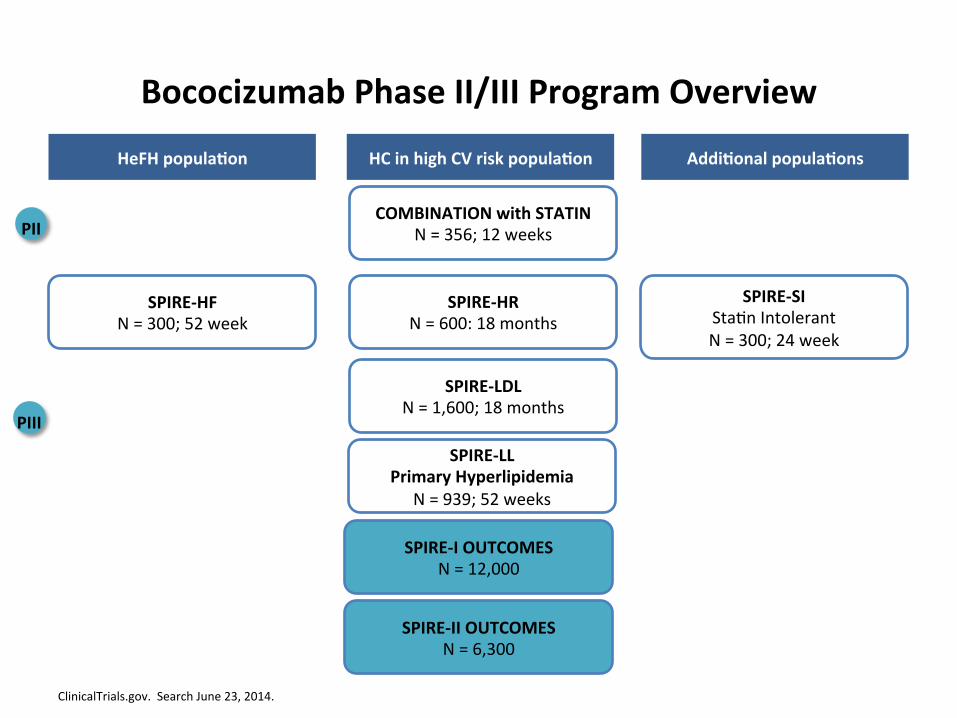
Bococizumab Phase II/III Program Overview
ClinicalTrials.gov. Search June 23, 2014.
HeFH popula/on HC in high CV risk popula/on Addi/onal popula/ons
SPIRE-‐HF N = 300; 52 week
COMBINATION with STATIN N = 356; 12 weeks
SPIRE-‐HR N = 600: 18 months
SPIRE-‐LDL N = 1,600; 18 months
SPIRE-‐I OUTCOMES N = 12,000
SPIRE-‐SI StaWn Intolerant N = 300; 24 week
PII
PIII
SPIRE-‐II OUTCOMES N = 6,300
SPIRE-‐LL Primary Hyperlipidemia
N = 939; 52 weeks

Bococizumab: Efficacy as Add-‐on Therapy in Hypercholesterolemia 24 Week Study
Ballantyne CM, et al. Poster presentaWon at ACC 2014. Abstract 1183-‐129.
LS Mean % Change in LDL-‐C Level at Week 8/12 LOCF
0
-‐10
-‐20
-‐30
-‐40
-‐50
-‐60
-‐70
150 mg
Q2W Q2W
150 mg
150 mg 50 mg 100 mg
150 mg
Q2W
Q4W
-‐34%
-‐45%
-‐53%
-‐28%
200 mg
-‐45%
300 mg
Q4W
Phase 2 Study Hypercholesterolemia N=354, add-‐on therapy,
inclusion LDL-‐C ≥2.1 mmol/L
Incidence and profile of adverse events similar across groups.
Long-‐term safety, tolerability and efficacy of alirocumab versus placebo in high cardiovascular risk pa/ents: first results from
the ODYSSEY LONG TERM study in 2,341 pa/ents
Jennifer G. Robinson,1 Michel Farnier,2 Michel Krempf,3 Jean Bergeron,4 Gérald Luc,5 Maurizio Averna,6 Erik Stroes,7 Gisle Langslet,8 Frederick J. Raal,9 Mahfouz El Shahawy,10 Michael J. Koren,11 Norman Lepor,12 Christelle Lorenzato,13 Robert Pordy,14 Umesh Chaudhari,15 John J.P. Kastelein7
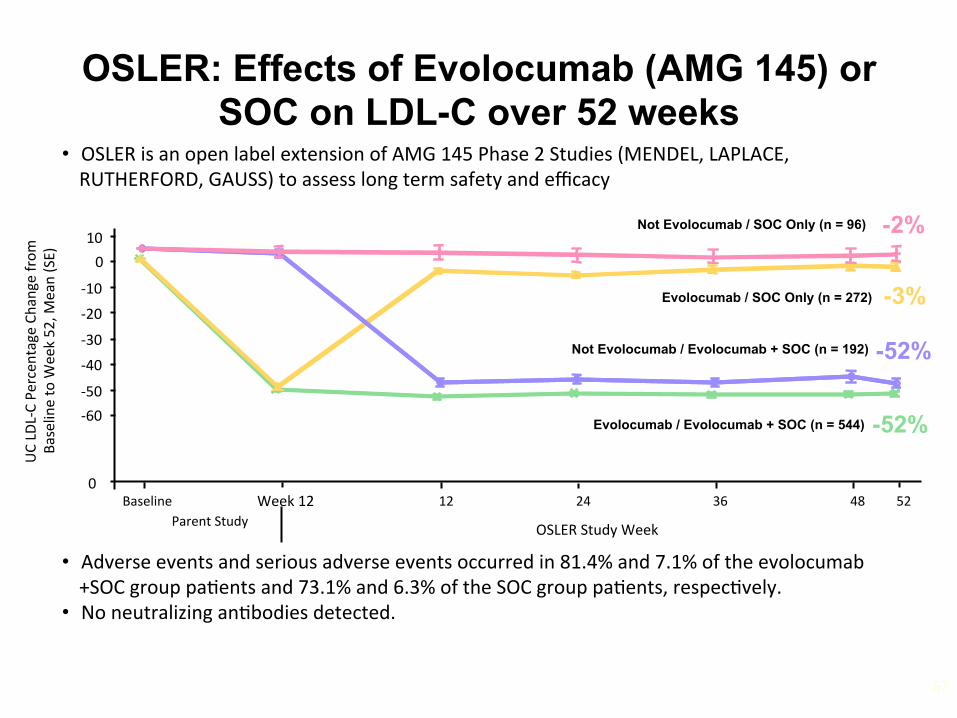
OSLER: Effects of Evolocumab (AMG 145) or SOC on LDL-C over 52 weeks
67
• Adverse events and serious adverse events occurred in 81.4% and 7.1% of the evolocumab+SOC group paWents and 73.1% and 6.3% of the SOC group paWents, respecWvely.
• No neutralizing anWbodies detected.
Week 12
UC LD
L-‐C Pe
rcen
tage Change from
Ba
seline to W
eek 52, M
ean (SE)
-‐60
0 Baseline
OSLER Study Week
-‐50
-‐40
-‐30
-‐20
-‐10
0 10
Parent Study 12 24 36 48 52
Evolocumab / SOC Only (n = 272)
Evolocumab / Evolocumab + SOC (n = 544) -52%
-3%
• OSLER is an open label extension of AMG 145 Phase 2 Studies (MENDEL, LAPLACE, RUTHERFORD, GAUSS) to assess long term safety and efficacy
-2%
-52%
Not Evolocumab / SOC Only (n = 96)
Not Evolocumab / Evolocumab + SOC (n = 192)
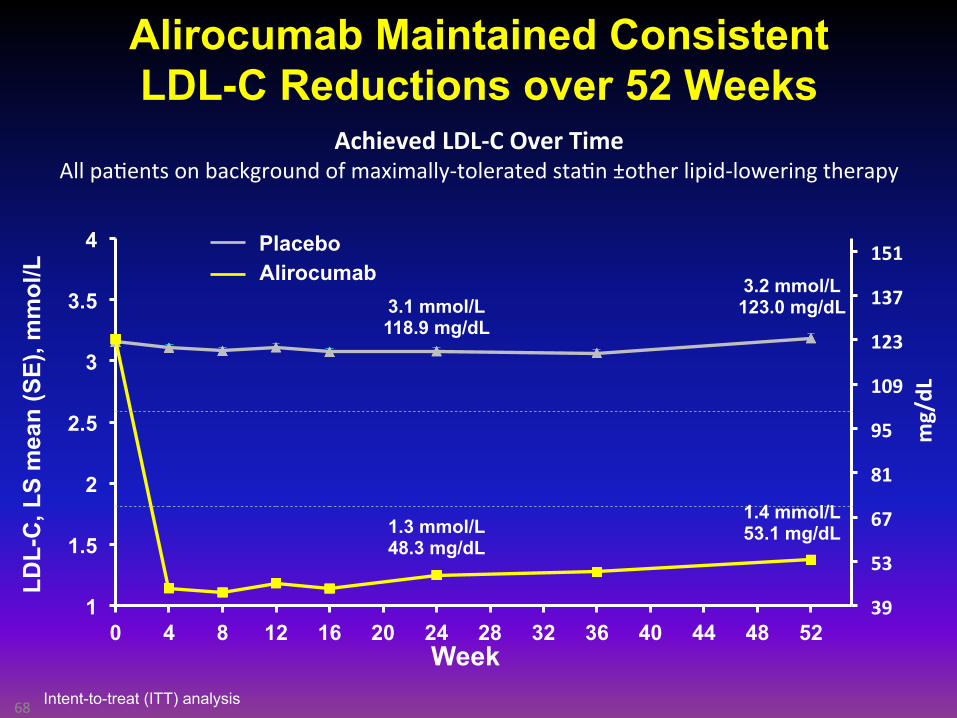
Alirocumab Maintained Consistent LDL-C Reductions over 52 Weeks
68
39
53
67
81
95
109
123
137
151
1
1.5
2
2.5
3
3.5
4
0 4 8 12 16 20 24 28 32 36 40 44 48 52 Week
3.1 mmol/L 118.9 mg/dL
1.3 mmol/L 48.3 mg/dL
3.2 mmol/L 123.0 mg/dL
1.4 mmol/L 53.1 mg/dL
mg/dL
Placebo Alirocumab
LDL-
C, L
S m
ean
(SE)
, mm
ol/L
Achieved LDL-‐C Over Time All paWents on background of maximally-‐tolerated staWn ±other lipid-‐lowering therapy
Intent-to-treat (ITT) analysis
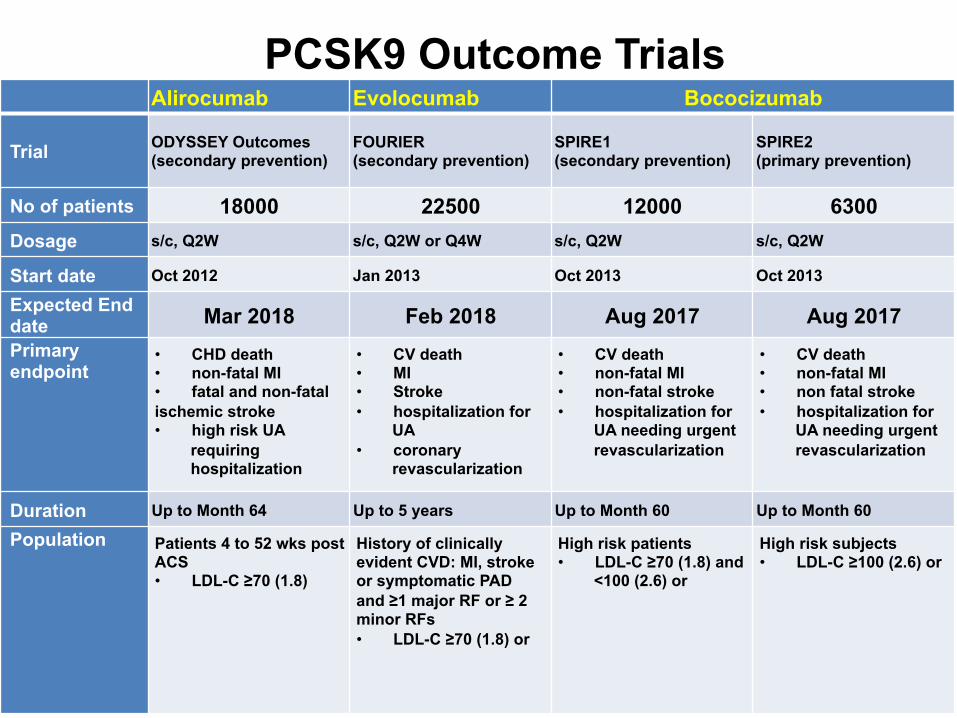
PCSK9 Outcome Trials Alirocumab Evolocumab Bococizumab
Trial ODYSSEY Outcomes (secondary prevention)
FOURIER (secondary prevention)
SPIRE1 (secondary prevention)
SPIRE2 (primary prevention)
No of patients 18000 22500 12000 6300 Dosage s/c, Q2W s/c, Q2W or Q4W s/c, Q2W s/c, Q2W
Start date Oct 2012 Jan 2013 Oct 2013 Oct 2013
Expected End date Mar 2018 Feb 2018 Aug 2017 Aug 2017 Primary endpoint
• CHD death • non-fatal MI • fatal and non-fatal ischemic stroke • high risk UA
requiring hospitalization
• CV death • MI • Stroke • hospitalization for
UA • coronary
revascularization
• CV death • non-fatal MI • non-fatal stroke • hospitalization for
UA needing urgent revascularization
• CV death • non-fatal MI • non fatal stroke • hospitalization for
UA needing urgent revascularization
Duration Up to Month 64 Up to 5 years Up to Month 60 Up to Month 60
Population Patients 4 to 52 wks post ACS • LDL-C ≥70 (1.8)
History of clinically evident CVD: MI, stroke or symptomatic PAD and ≥1 major RF or ≥ 2 minor RFs • LDL-C ≥70 (1.8) or
High risk patients • LDL-C ≥70 (1.8) and
<100 (2.6) or
High risk subjects • LDL-C ≥100 (2.6) or

PCSK9 inh: Whom?
Start with the no-brainers

FH + CAD
New Drugs: Whom, When?
FH Not @ Goal
CAD* Not @ Goal
Hi Risk Not @ Goal
Numbers (Guess)
10,000
10,000
250,000
CAD* Approx 1.5 M CDN
>250,000
20-30 HoFH
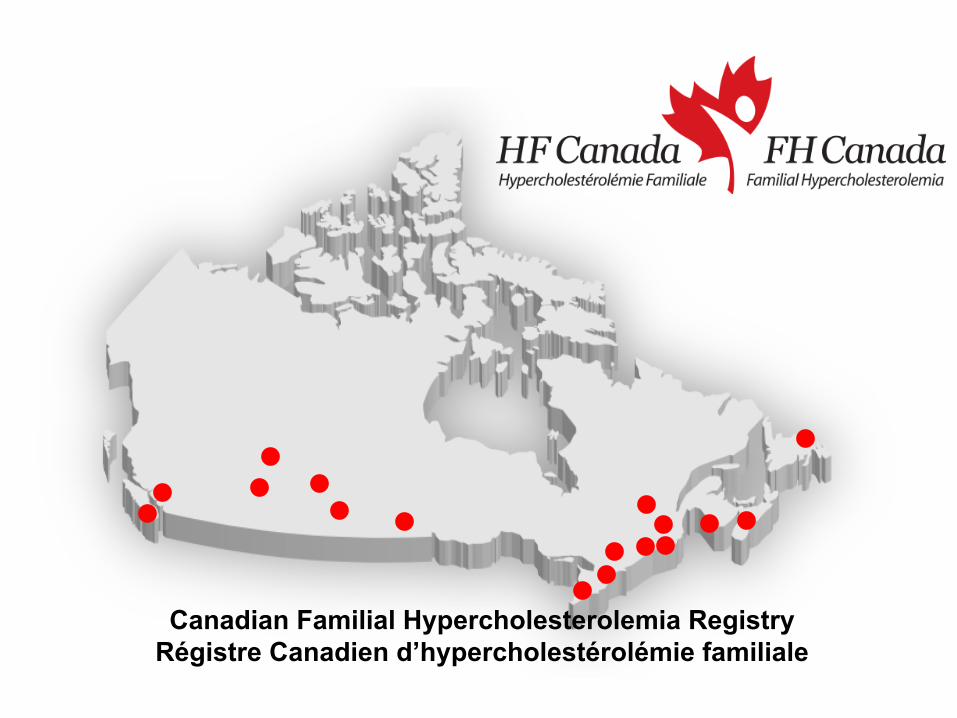
Canadian Familial Hypercholesterolemia Registry Régistre Canadien d’hypercholestérolémie familiale

Familial Hypercholesterolemia: Autosomal Dominant GeneWc Disease
Goldstein JL, Brown MS. Arterioscler Thromb Vasc Biol. 2009;29:431-‐438; Moorjani S, et al. Arteriosclerosis.1989;9(2):211-‐6; Al-‐Sarraf A, et al. Can J Cardiol. 2013;29:6-‐9; Nordestgaard BG, et al. Eur Heart J. 2013;34(45):3478-‐90; Cuchel M, et al. Eur Heart J. 2014;35:2146-‐2157.
§ LDL-‐C >7.5 mmol/L § ½ number of LDL receptors § 2-‐fold increase in plasma LDL § ~20-‐fold increase risk of CHD in
untreated paWents § 5% of all heart axacks under
age 60
§ LDL-‐C > 13 mmol/L § Few or no funcWonal LDL receptors § 6-‐ to 10-‐fold increase in plasma LDL § Widespread severe atherosclerosis § Heart axacks in childhood
FH Heterozygotes (HeFH) FH Homozygote HoFH
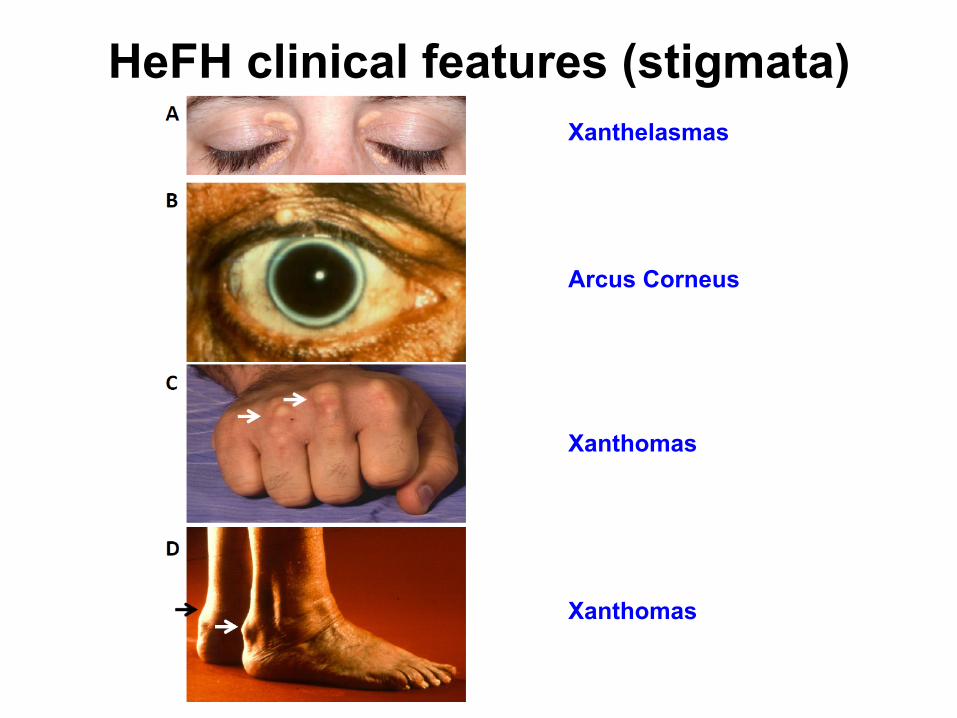
HeFH clinical features (stigmata) Xanthelasmas
Xanthomas
Xanthomas
Arcus Corneus

0
10
20
30
40
50
60
70
80
Xanthelasma Corneal Arcus
Tendinous xanthomas
1979 (n = 371)
2000 (n = 270)
Fréq
uenc
y (%
)
Heterozygous FH: Clinical Manifestations; 1979 vs 2000
(Men and women> 20 y)
Courtoisie Dr. C. Gagné Québec
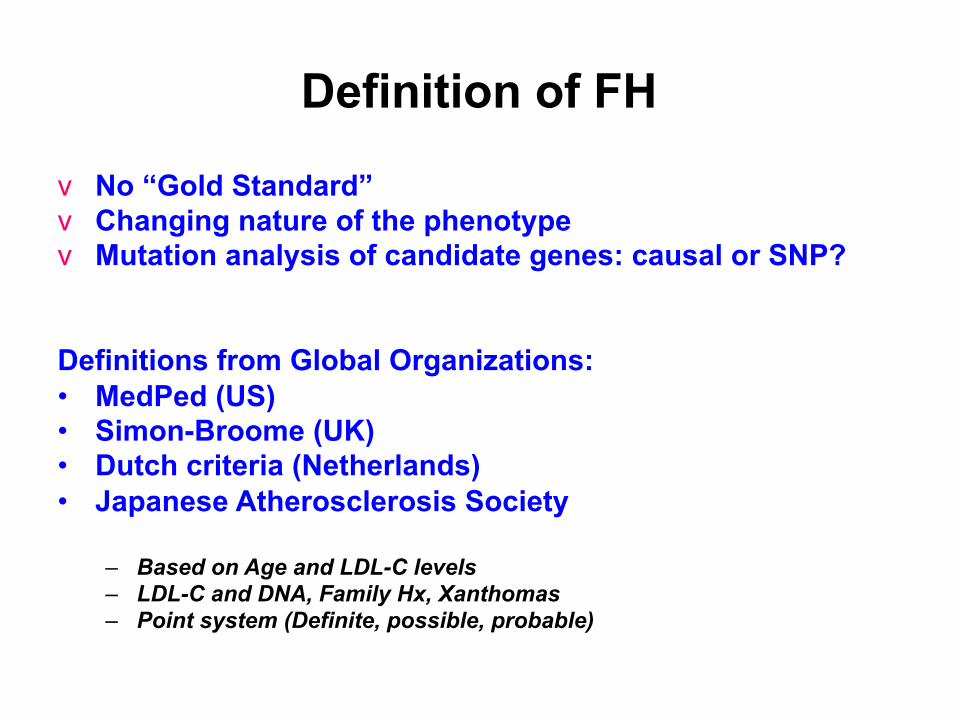
Definition of FH
v No “Gold Standard” v Changing nature of the phenotype v Mutation analysis of candidate genes: causal or SNP?
Definitions from Global Organizations: • MedPed (US) • Simon-Broome (UK) • Dutch criteria (Netherlands) • Japanese Atherosclerosis Society
– Based on Age and LDL-C levels – LDL-C and DNA, Family Hx, Xanthomas – Point system (Definite, possible, probable)
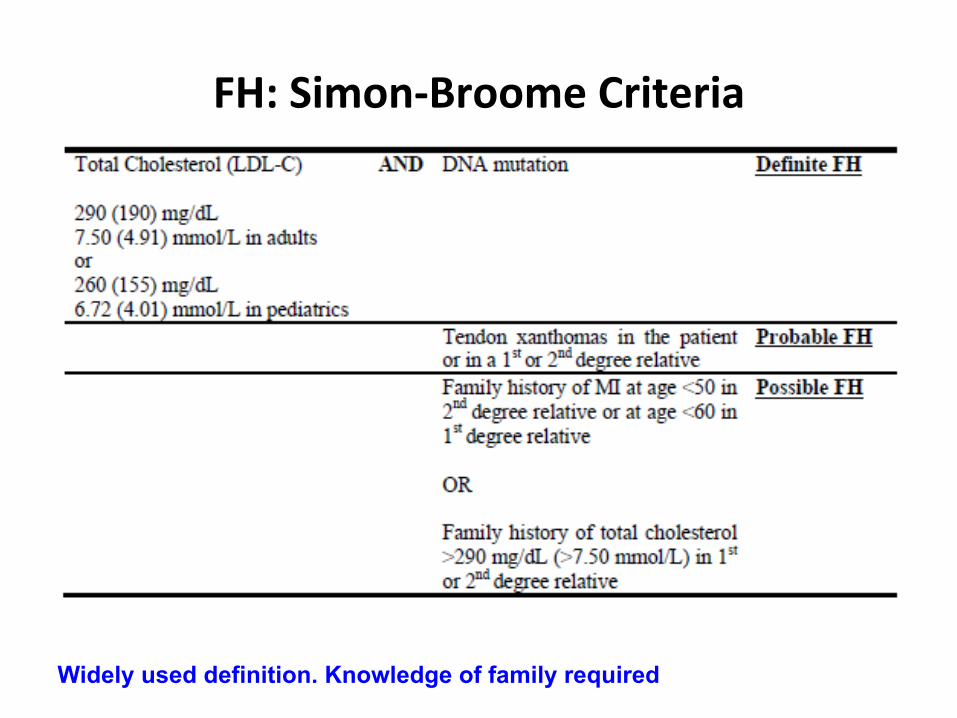
FH: Simon-‐Broome Criteria
Widely used definition. Knowledge of family required
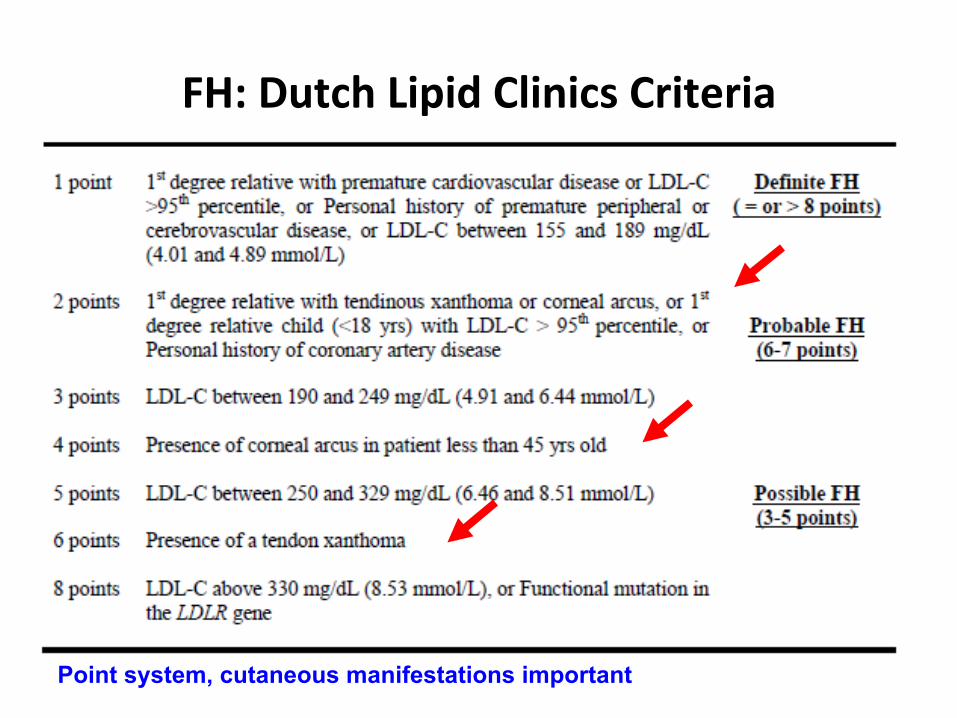
FH: Dutch Lipid Clinics Criteria
Point system, cutaneous manifestations important
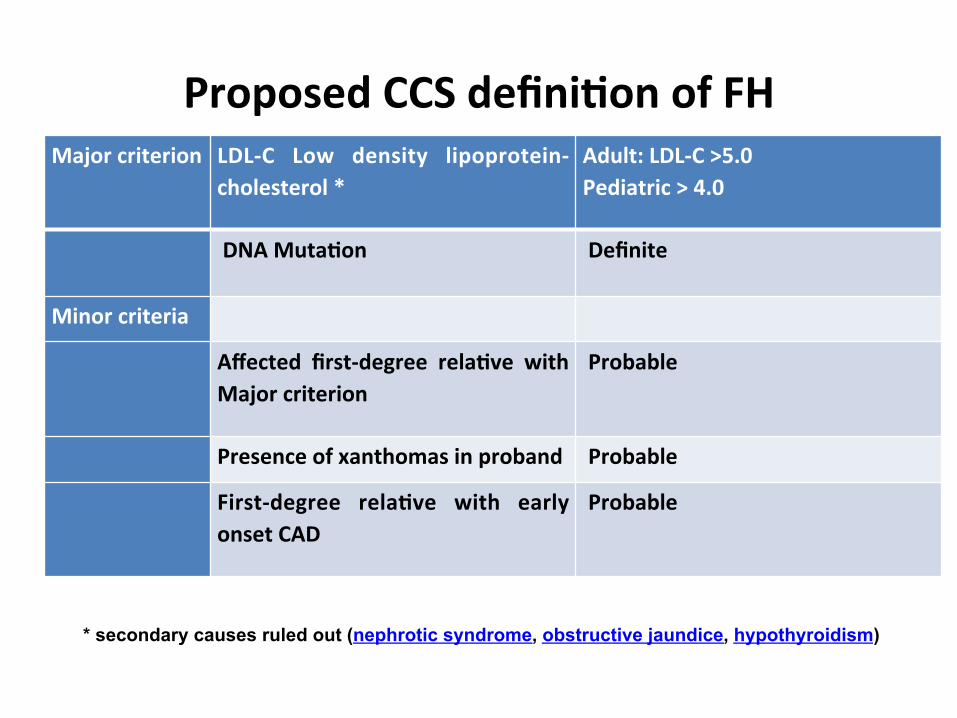
Proposed CCS defini/on of FH Major criterion LDL-‐C Low density lipoprotein-‐
cholesterol * Adult: LDL-‐C >5.0 Pediatric > 4.0
DNA Muta/on
Definite
Minor criteria
Affected first-‐degree rela/ve with Major criterion
Probable
Presence of xanthomas in proband Probable
First-‐degree rela/ve with early onset CAD
Probable
* secondary causes ruled out (nephrotic syndrome, obstructive jaundice, hypothyroidism)

LDL cholesterol burden in individuals with or without familial hypercholesterolaemia as a function of the age of initiation of statin therapy.
Nordestgaard B G et al. Eur Heart J 2013;eurheartj.eht273
© The Author 2013. Published by Oxford University Press on behalf of the European Society of Cardiology.

www.FHCanada.net or www.HFcanada.net

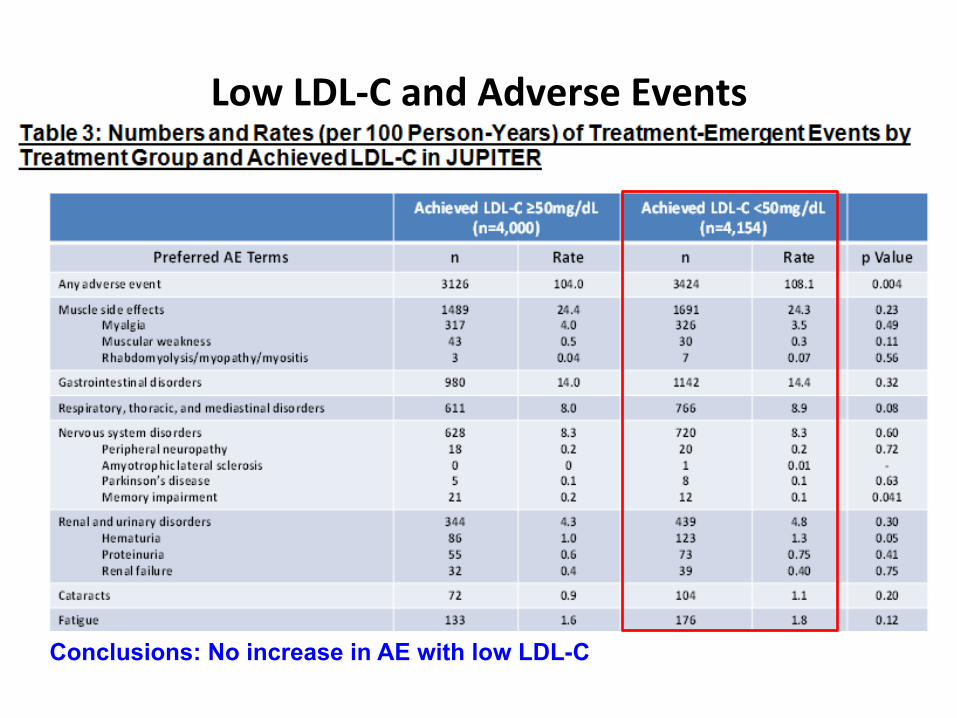
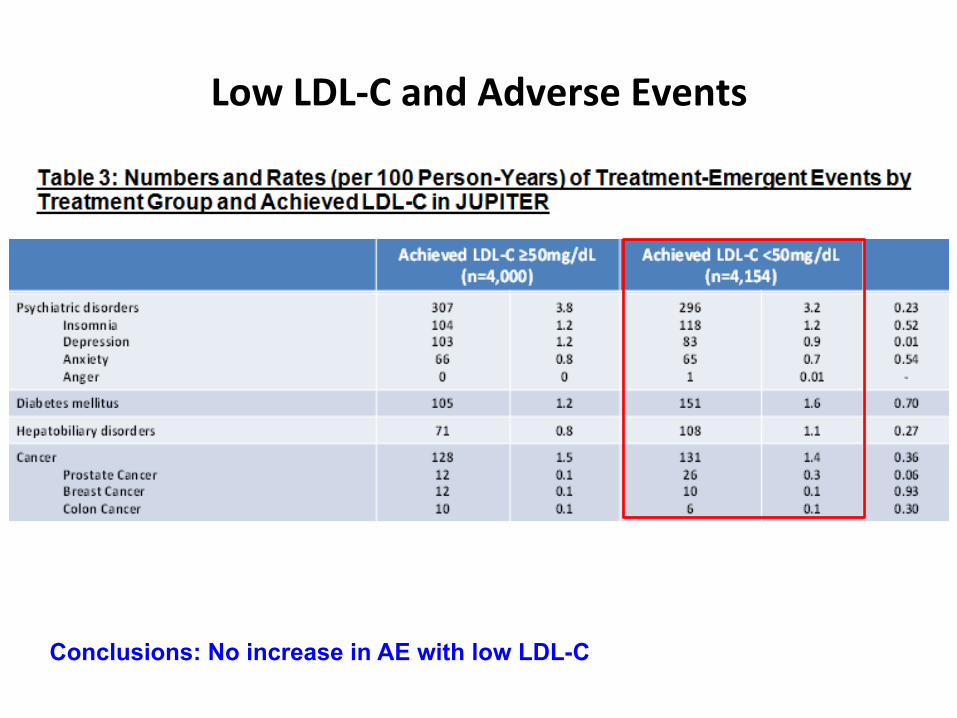
Low LDL-C and AE
Is it unsafe to lower LDL-C<0.5 mmol/L?
Fire and Forget?

Low LDL-‐C and Adverse Events
Conclusions: No increase in AE with low LDL-C

Low LDL-‐C and Adverse Events
Conclusions: No increase in AE with low LDL-C
Low LDL-‐C and Adverse Events
Conclusions: No increase in AE with low LDL-C
Low LDL-‐C and Adverse Events
Conclusions: No increase in AE with low LDL-C
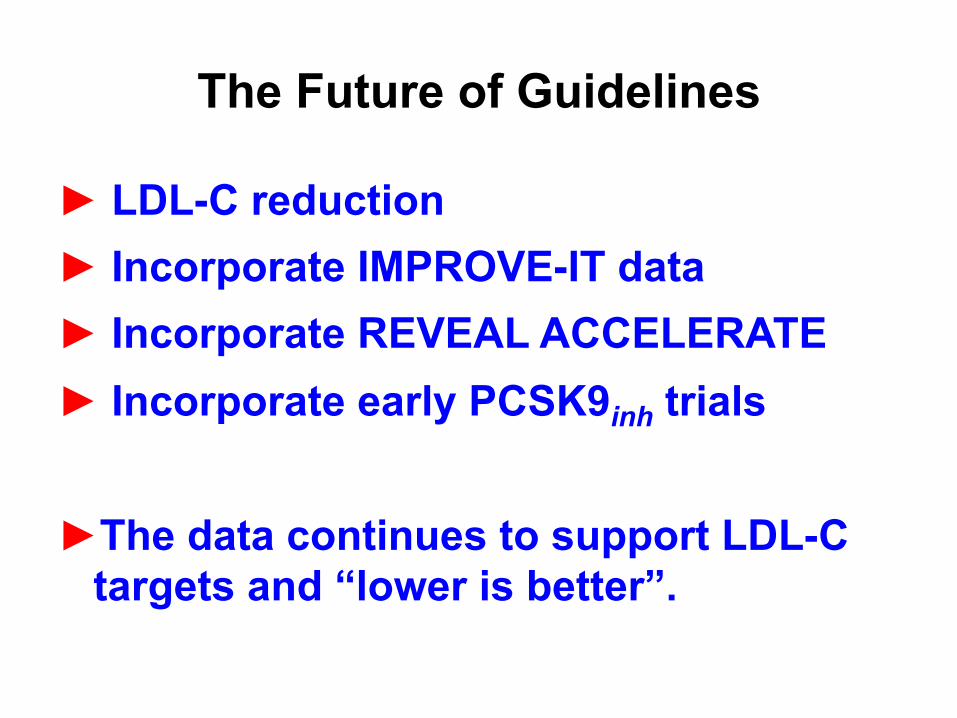
The Future of Guidelines
► LDL-C reduction ► Incorporate IMPROVE-IT data ► Incorporate REVEAL ACCELERATE ► Incorporate early PCSK9inh trials
► The data continues to support LDL-C targets and “lower is better”.