Embed Size (px)
Citation preview
Linux Tracing: LTTng vs. SystemTap
Fabian Bornhofen
Software Profiling, Summer 2013Supervisor: Dr. Peter Troger
Hasso-Plattner-Institut
2013-05-13
1 / 25
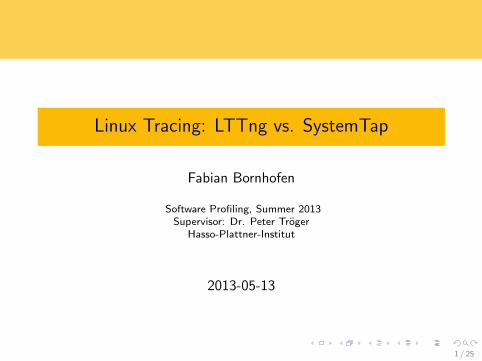
Agenda
1 Motivation
2 LTTng
3 SystemTap
4 Case Study
5 Conclusion
2 / 25
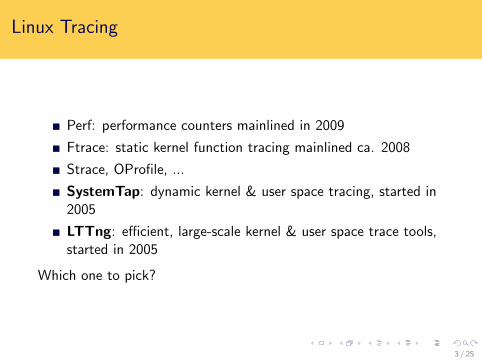
Linux Tracing
Perf: performance counters mainlined in 2009
Ftrace: static kernel function tracing mainlined ca. 2008
Strace, OProfile, ...
SystemTap: dynamic kernel & user space tracing, started in2005
LTTng: efficient, large-scale kernel & user space trace tools,started in 2005
Which one to pick?
3 / 25
LTTng
4 / 25
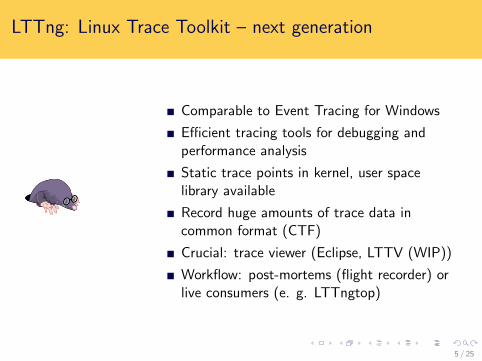
LTTng: Linux Trace Toolkit – next generation
Comparable to Event Tracing for Windows
Efficient tracing tools for debugging andperformance analysis
Static trace points in kernel, user spacelibrary available
Record huge amounts of trace data incommon format (CTF)
Crucial: trace viewer (Eclipse, LTTV (WIP))
Workflow: post-mortems (flight recorder) orlive consumers (e. g. LTTngtop)
5 / 25
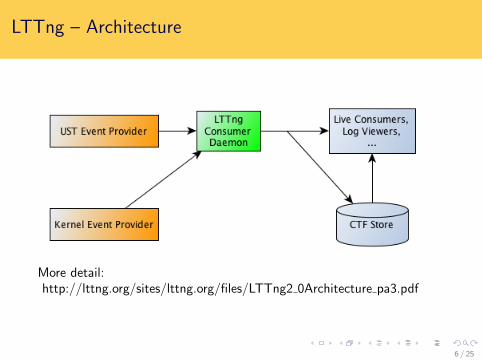
LTTng – Architecture
More detail:http://lttng.org/sites/lttng.org/files/LTTng2 0Architecture pa3.pdf
6 / 25
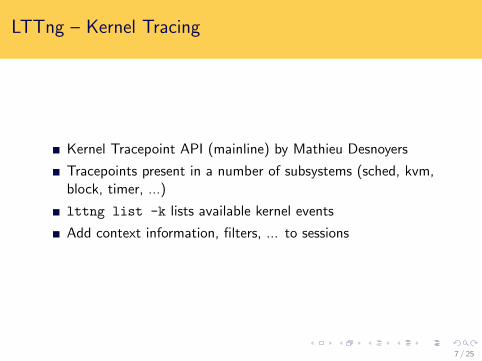
LTTng – Kernel Tracing
Kernel Tracepoint API (mainline) by Mathieu Desnoyers
Tracepoints present in a number of subsystems (sched, kvm,block, timer, ...)
lttng list -k lists available kernel events
Add context information, filters, ... to sessions
7 / 25
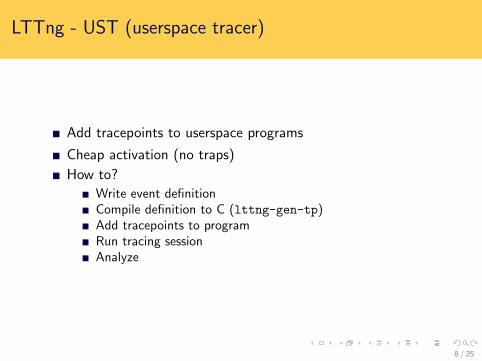
LTTng - UST (userspace tracer)
Add tracepoints to userspace programs
Cheap activation (no traps)
How to?
Write event definitionCompile definition to C (lttng-gen-tp)Add tracepoints to programRun tracing sessionAnalyze
8 / 25
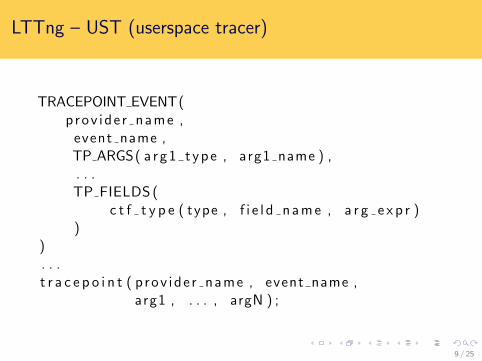
LTTng – UST (userspace tracer)
TRACEPOINT EVENT(p r o v i d e r n a m e ,
event name ,TP ARGS( a r g 1 t y p e , arg1 name ) ,. . .TP FIELDS (
c t f t y p e ( type , f i e l d n a m e , a r g e x p r ))
). . .t r a c e p o i n t ( p r o v i d e r n a m e , event name ,
arg1 , . . . , argN ) ;
9 / 25

SystemTap
10 / 25
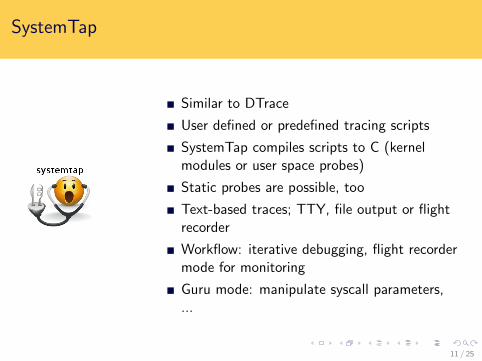
SystemTap
Similar to DTrace
User defined or predefined tracing scripts
SystemTap compiles scripts to C (kernelmodules or user space probes)
Static probes are possible, too
Text-based traces; TTY, file output or flightrecorder
Workflow: iterative debugging, flight recordermode for monitoring
Guru mode: manipulate syscall parameters,...
11 / 25
SystemTap – Sample Script
12 / 25
Case Study
http://trac.nginx.org/nginx/ticket/53
13 / 25
nginx bug #53 – deadlock after active worker crashes
Lightweight web server with worker processes, sync via atomicGCC primitives in shared memory region (no syscalls involved)
Synchronized access to incoming requests
Active worker := worker holding that lock
If active worker terminates abnormally, server deadlocks
14 / 25
nginx #53 – post mortem with LTTng
Trace: run nginx, request files, kill active worker, request files,nothing happens
Server does not accept connections
Search trace for sys accept4
Last sys accept4 event appears before a worker was killed
As developers, we know that nginx protects sys accept4 witha mutex
Might conclude that mutex is lost after active workerterminates.
Possibly introduce UST trace points in C code
15 / 25
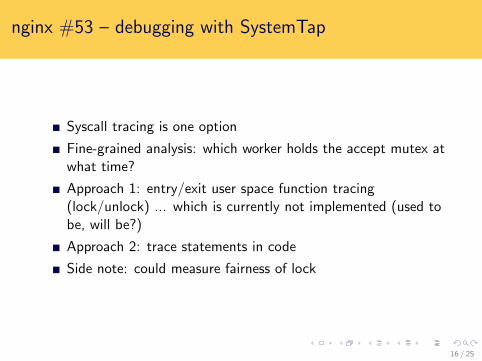
nginx #53 – debugging with SystemTap
Syscall tracing is one option
Fine-grained analysis: which worker holds the accept mutex atwhat time?
Approach 1: entry/exit user space function tracing(lock/unlock) ... which is currently not implemented (used tobe, will be?)
Approach 2: trace statements in code
Side note: could measure fairness of lock
16 / 25
Conclusion
17 / 25
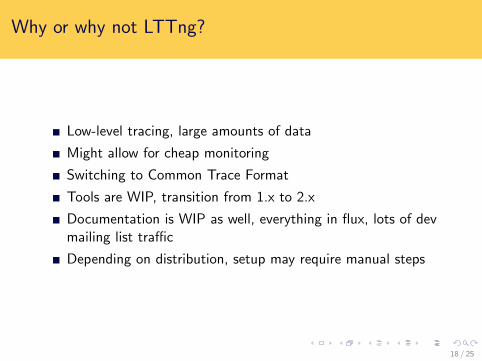
Why or why not LTTng?
Low-level tracing, large amounts of data
Might allow for cheap monitoring
Switching to Common Trace Format
Tools are WIP, transition from 1.x to 2.x
Documentation is WIP as well, everything in flux, lots of devmailing list traffic
Depending on distribution, setup may require manual steps
18 / 25
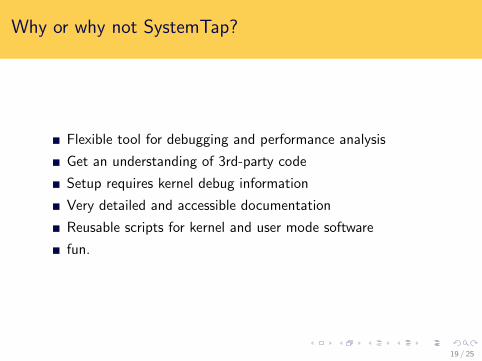
Why or why not SystemTap?
Flexible tool for debugging and performance analysis
Get an understanding of 3rd-party code
Setup requires kernel debug information
Very detailed and accessible documentation
Reusable scripts for kernel and user mode software
fun.
19 / 25
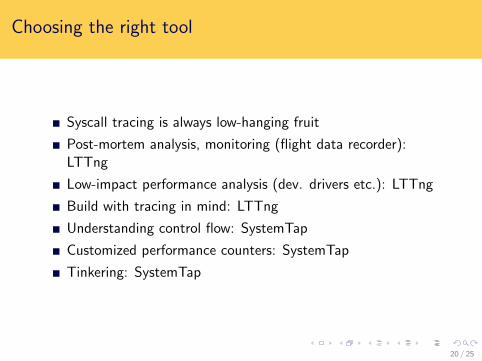
Choosing the right tool
Syscall tracing is always low-hanging fruit
Post-mortem analysis, monitoring (flight data recorder):LTTng
Low-impact performance analysis (dev. drivers etc.): LTTng
Build with tracing in mind: LTTng
Understanding control flow: SystemTap
Customized performance counters: SystemTap
Tinkering: SystemTap
20 / 25

Questions?
21 / 25
References
Linux Tracing Overview
ftrace http://lwn.net/Articles/322666/single buffer https://lwn.net/Articles/388978/perf mainlined http://lwn.net/Articles/339361/utrace http://lwn.net/Articles/224772/,http://lwn.net/Articles/371210/,https://lwn.net/Articles/499190/
LTTng https://lttng.org/
LTTng Architecturehttp://lttng.org/sites/lttng.org/files/LTTng2 0Architecture -pa3.pdf
SystemTaphttp://sourceware.org/systemtap/documentation.html
22 / 25
Backup
23 / 25
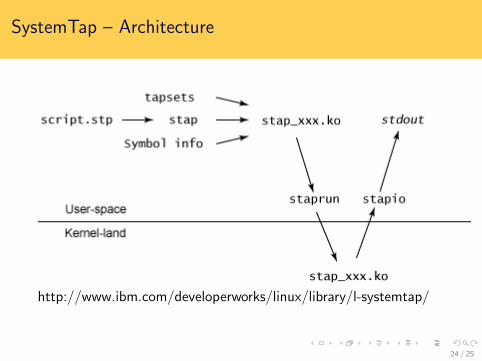
SystemTap – Architecture
http://www.ibm.com/developerworks/linux/library/l-systemtap/
24 / 25
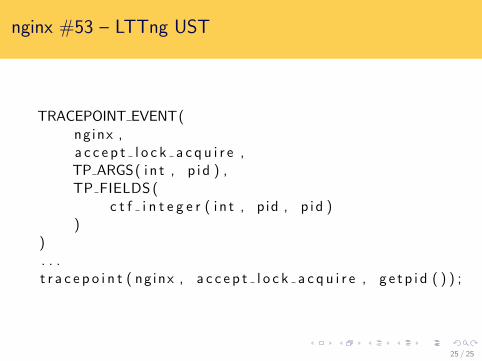
nginx #53 – LTTng UST
TRACEPOINT EVENT(nginx ,a c c e p t l o c k a c q u i r e ,TP ARGS( i n t , p i d ) ,TP FIELDS (
c t f i n t e g e r ( i n t , p id , p i d ))
). . .t r a c e p o i n t ( ng inx , a c c e p t l o c k a c q u i r e , g e t p i d ( ) ) ;
25 / 25