Embed Size (px)
Citation preview
ibm.com/redbooks
Linux on IBM Eserver zSeries and S/390: Performance Toolkit for VM
Gregory GeiselhartBruce Dailey
Dean DiTommasoBernard Royole Degieux
Klaus EgelerMario Held
Lívio SousaRoger Thibault
Understanding Performance Toolkit for VM
Monitoring VM performance
Optimizing Linux guest performance
Front cover


Linux on IBM Eserver zSeries and S/390: Performance Toolkit for VM
August 2004
International Technical Support Organization
SG24-6059-00
© Copyright International Business Machines Corporation 2004. All rights reserved.Note to U.S. Government Users Restricted Rights -- Use, duplication or disclosure restricted by GSA ADPSchedule Contract with IBM Corp.
First Edition (August 2004)
This edition applies to z/VM Version 4 Release 4 and multiple Linux distributions. SUSE Linux Enterprise 8 (SLES8) and Red Hat Enterprise Linux 3 (RHEL 3) are used for examples in this publication.
Note: Before using this information and the product it supports, read the information in “Notices” on page ix.
Contents
Notices . . . . . . . . . . . . . . . . . . . . . . . . . . . . . . . . . . . . . . . . . . . . . . . . . . . . . . . ixTrademarks . . . . . . . . . . . . . . . . . . . . . . . . . . . . . . . . . . . . . . . . . . . . . . . . . . . . x
Preface . . . . . . . . . . . . . . . . . . . . . . . . . . . . . . . . . . . . . . . . . . . . . . . . . . . . . . . xiThe team that wrote this redbook. . . . . . . . . . . . . . . . . . . . . . . . . . . . . . . . . . . . xiBecome a published author . . . . . . . . . . . . . . . . . . . . . . . . . . . . . . . . . . . . . . . xivComments welcome. . . . . . . . . . . . . . . . . . . . . . . . . . . . . . . . . . . . . . . . . . . . . xiv
Chapter 1. Performance Toolkit for VM at a glance . . . . . . . . . . . . . . . . . . . 11.1 Defining Performance Toolkit for VM . . . . . . . . . . . . . . . . . . . . . . . . . . . . . 21.2 Starting Performance Toolkit for VM . . . . . . . . . . . . . . . . . . . . . . . . . . . . . . 41.3 Basic mode . . . . . . . . . . . . . . . . . . . . . . . . . . . . . . . . . . . . . . . . . . . . . . . . . 5
1.3.1 Redisplay facility . . . . . . . . . . . . . . . . . . . . . . . . . . . . . . . . . . . . . . . . . 61.4 Monitor mode . . . . . . . . . . . . . . . . . . . . . . . . . . . . . . . . . . . . . . . . . . . . . . . 81.5 Help facility . . . . . . . . . . . . . . . . . . . . . . . . . . . . . . . . . . . . . . . . . . . . . . . . . 9
1.5.1 Context-sensitive help. . . . . . . . . . . . . . . . . . . . . . . . . . . . . . . . . . . . 101.6 Displaying current and average data. . . . . . . . . . . . . . . . . . . . . . . . . . . . . 111.7 Sorting reported data. . . . . . . . . . . . . . . . . . . . . . . . . . . . . . . . . . . . . . . . . 121.8 History performance analysis . . . . . . . . . . . . . . . . . . . . . . . . . . . . . . . . . . 13
1.8.1 Simple history data files . . . . . . . . . . . . . . . . . . . . . . . . . . . . . . . . . . 151.8.2 Extended trend files . . . . . . . . . . . . . . . . . . . . . . . . . . . . . . . . . . . . . 16
1.9 Benchmark data analysis . . . . . . . . . . . . . . . . . . . . . . . . . . . . . . . . . . . . . 161.10 Threshold monitoring. . . . . . . . . . . . . . . . . . . . . . . . . . . . . . . . . . . . . . . . 171.11 Variable correlation coefficient analysis . . . . . . . . . . . . . . . . . . . . . . . . . 201.12 When to use Performance Toolkit for VM . . . . . . . . . . . . . . . . . . . . . . . . 20
1.12.1 Performance Toolkit for VM overhead . . . . . . . . . . . . . . . . . . . . . . 20
Chapter 2. Navigating through Performance Toolkit for VM . . . . . . . . . . . 232.1 Information available in Performance Toolkit for VM. . . . . . . . . . . . . . . . . 242.2 General system data reporting . . . . . . . . . . . . . . . . . . . . . . . . . . . . . . . . . 24
2.2.1 CPU load. . . . . . . . . . . . . . . . . . . . . . . . . . . . . . . . . . . . . . . . . . . . . . 262.2.2 Storage utilization . . . . . . . . . . . . . . . . . . . . . . . . . . . . . . . . . . . . . . . 272.2.3 Spool file overview . . . . . . . . . . . . . . . . . . . . . . . . . . . . . . . . . . . . . . 302.2.4 LPAR data. . . . . . . . . . . . . . . . . . . . . . . . . . . . . . . . . . . . . . . . . . . . . 322.2.5 Shared segments . . . . . . . . . . . . . . . . . . . . . . . . . . . . . . . . . . . . . . . 332.2.6 System configuration. . . . . . . . . . . . . . . . . . . . . . . . . . . . . . . . . . . . . 34
2.3 I/O data reporting . . . . . . . . . . . . . . . . . . . . . . . . . . . . . . . . . . . . . . . . . . . 352.3.1 I/O device load . . . . . . . . . . . . . . . . . . . . . . . . . . . . . . . . . . . . . . . . . 362.3.2 CP-owned disks . . . . . . . . . . . . . . . . . . . . . . . . . . . . . . . . . . . . . . . . 38
© Copyright IBM Corp. 2004. All rights reserved. iii
2.4 User data reporting . . . . . . . . . . . . . . . . . . . . . . . . . . . . . . . . . . . . . . . . . . 402.4.1 User resource usage. . . . . . . . . . . . . . . . . . . . . . . . . . . . . . . . . . . . . 412.4.2 Linux systems . . . . . . . . . . . . . . . . . . . . . . . . . . . . . . . . . . . . . . . . . . 46
2.5 History data reporting . . . . . . . . . . . . . . . . . . . . . . . . . . . . . . . . . . . . . . . . 502.5.1 Graphics selection. . . . . . . . . . . . . . . . . . . . . . . . . . . . . . . . . . . . . . . 512.5.2 History data files . . . . . . . . . . . . . . . . . . . . . . . . . . . . . . . . . . . . . . . . 552.5.3 Benchmark displays . . . . . . . . . . . . . . . . . . . . . . . . . . . . . . . . . . . . . 572.5.4 Correlation coefficients . . . . . . . . . . . . . . . . . . . . . . . . . . . . . . . . . . . 58
2.6 User-defined screens . . . . . . . . . . . . . . . . . . . . . . . . . . . . . . . . . . . . . . . . 602.6.1 Defining a user data screen . . . . . . . . . . . . . . . . . . . . . . . . . . . . . . . 612.6.2 User-defined display selection . . . . . . . . . . . . . . . . . . . . . . . . . . . . . 612.6.3 User-defined performance screen. . . . . . . . . . . . . . . . . . . . . . . . . . . 62
2.7 Using the Web interface . . . . . . . . . . . . . . . . . . . . . . . . . . . . . . . . . . . . . . 63
Chapter 3. Configuring Performance Toolkit for VM . . . . . . . . . . . . . . . . . 653.1 Performance Toolkit for VM installation. . . . . . . . . . . . . . . . . . . . . . . . . . . 66
3.1.1 The 4VMPTK40 user. . . . . . . . . . . . . . . . . . . . . . . . . . . . . . . . . . . . . 663.1.2 The PERFSVM user . . . . . . . . . . . . . . . . . . . . . . . . . . . . . . . . . . . . . 67
3.2 Performance Toolkit for VM control files . . . . . . . . . . . . . . . . . . . . . . . . . . 683.2.1 FCONX $PROFILE . . . . . . . . . . . . . . . . . . . . . . . . . . . . . . . . . . . . . . 693.2.2 The FCONTROL RESET command . . . . . . . . . . . . . . . . . . . . . . . . . 763.2.3 Printed reports. . . . . . . . . . . . . . . . . . . . . . . . . . . . . . . . . . . . . . . . . . 773.2.4 Trend data collection. . . . . . . . . . . . . . . . . . . . . . . . . . . . . . . . . . . . . 80
3.3 Sample PROFILE EXEC for PERFSVM . . . . . . . . . . . . . . . . . . . . . . . . . . 813.4 Performance Toolkit for VM operation. . . . . . . . . . . . . . . . . . . . . . . . . . . . 833.5 Tailoring Performance Toolkit for VM . . . . . . . . . . . . . . . . . . . . . . . . . . . . 84
3.5.1 Tailor the FCONX $PROFILE control file . . . . . . . . . . . . . . . . . . . . . 853.5.2 Tailor the FCONX REPORTS control file . . . . . . . . . . . . . . . . . . . . . 853.5.3 Tailor the FCONX TRENDREC control file . . . . . . . . . . . . . . . . . . . . 85
3.6 Enabling remote access and monitoring . . . . . . . . . . . . . . . . . . . . . . . . . . 853.6.1 Create the FCONRMT AUTHORIZ control file . . . . . . . . . . . . . . . . . 863.6.2 Create the FCONRMT SYSTEMS control file . . . . . . . . . . . . . . . . . . 87
3.7 Enabling data collection for Linux guests . . . . . . . . . . . . . . . . . . . . . . . . . 88
Chapter 4. Remote access and monitoring . . . . . . . . . . . . . . . . . . . . . . . . 894.1 Remote monitoring with Performance Toolkit for VM . . . . . . . . . . . . . . . . 904.2 APPC/VM interface to Performance Toolkit for VM. . . . . . . . . . . . . . . . . . 91
4.2.1 Implementing APPC/VM for a local system . . . . . . . . . . . . . . . . . . . 914.2.2 Using an alternate resource name . . . . . . . . . . . . . . . . . . . . . . . . . . 924.2.3 Implementing APPC/VM for remote systems . . . . . . . . . . . . . . . . . . 93
4.3 Performance Toolkit for VM Web interface . . . . . . . . . . . . . . . . . . . . . . . . 954.3.1 Web interface main selection menu . . . . . . . . . . . . . . . . . . . . . . . . . 974.3.2 Line graphic displays in the Web interface . . . . . . . . . . . . . . . . . . . . 98
iv Linux on IBM Eserver zSeries and S/390: Performance Toolkit for VM
4.3.3 Enabling the Web interface . . . . . . . . . . . . . . . . . . . . . . . . . . . . . . . . 994.3.4 Web interface authentication. . . . . . . . . . . . . . . . . . . . . . . . . . . . . . 100
Chapter 5. Understanding z/VM configuration . . . . . . . . . . . . . . . . . . . . . 1035.1 Commands to use for configuration information . . . . . . . . . . . . . . . . . . . 1045.2 System configuration screen . . . . . . . . . . . . . . . . . . . . . . . . . . . . . . . . . . 1055.3 Storage layout . . . . . . . . . . . . . . . . . . . . . . . . . . . . . . . . . . . . . . . . . . . . . 1075.4 System settings . . . . . . . . . . . . . . . . . . . . . . . . . . . . . . . . . . . . . . . . . . . . 109
5.4.1 Effect of the timer patch on Linux guest scheduling . . . . . . . . . . . . 1095.4.2 The QUICKDISP option . . . . . . . . . . . . . . . . . . . . . . . . . . . . . . . . . 1105.4.3 Assigning processing share . . . . . . . . . . . . . . . . . . . . . . . . . . . . . . 111
5.5 System counters . . . . . . . . . . . . . . . . . . . . . . . . . . . . . . . . . . . . . . . . . . . 1135.6 Monitor settings . . . . . . . . . . . . . . . . . . . . . . . . . . . . . . . . . . . . . . . . . . . . 1155.7 I/O configuration . . . . . . . . . . . . . . . . . . . . . . . . . . . . . . . . . . . . . . . . . . . 1165.8 Page and spool allocation . . . . . . . . . . . . . . . . . . . . . . . . . . . . . . . . . . . . 1195.9 Spool file usage. . . . . . . . . . . . . . . . . . . . . . . . . . . . . . . . . . . . . . . . . . . . 1215.10 User paging utilization . . . . . . . . . . . . . . . . . . . . . . . . . . . . . . . . . . . . . . 1225.11 Virtual disks in storage . . . . . . . . . . . . . . . . . . . . . . . . . . . . . . . . . . . . . 123
Chapter 6. Analyzing I/O and network performance . . . . . . . . . . . . . . . . 1256.1 Analyzing I/O to DASD performance. . . . . . . . . . . . . . . . . . . . . . . . . . . . 1266.2 Channel monitoring . . . . . . . . . . . . . . . . . . . . . . . . . . . . . . . . . . . . . . . . . 1266.3 Control unit monitoring . . . . . . . . . . . . . . . . . . . . . . . . . . . . . . . . . . . . . . 128
6.3.1 Cache control unit overall performance . . . . . . . . . . . . . . . . . . . . . 1296.3.2 Cache extended function performance . . . . . . . . . . . . . . . . . . . . . . 130
6.4 I/O device load . . . . . . . . . . . . . . . . . . . . . . . . . . . . . . . . . . . . . . . . . . . . 1316.4.1 Minidisk cache. . . . . . . . . . . . . . . . . . . . . . . . . . . . . . . . . . . . . . . . . 135
6.5 Analyzing VM TCP/IP data . . . . . . . . . . . . . . . . . . . . . . . . . . . . . . . . . . . 1376.5.1 Virtual switch activity . . . . . . . . . . . . . . . . . . . . . . . . . . . . . . . . . . . . 1376.5.2 TCP/IP Activity Log . . . . . . . . . . . . . . . . . . . . . . . . . . . . . . . . . . . . . 1386.5.3 General TCP/IP data transfer log . . . . . . . . . . . . . . . . . . . . . . . . . . 139
Chapter 7. Understanding LPAR configuration . . . . . . . . . . . . . . . . . . . . 1417.1 Collecting LPAR data . . . . . . . . . . . . . . . . . . . . . . . . . . . . . . . . . . . . . . . 1427.2 Displaying LPAR configuration and activity . . . . . . . . . . . . . . . . . . . . . . . 1427.3 Understanding LPAR options . . . . . . . . . . . . . . . . . . . . . . . . . . . . . . . . . 144
7.3.1 Shared or dedicated processors . . . . . . . . . . . . . . . . . . . . . . . . . . . 1457.3.2 Shared or dedicated CHPIDs . . . . . . . . . . . . . . . . . . . . . . . . . . . . . 146
Chapter 8. Monitoring Linux guests . . . . . . . . . . . . . . . . . . . . . . . . . . . . . 1478.1 Reporting Linux monitor data . . . . . . . . . . . . . . . . . . . . . . . . . . . . . . . . . 148
8.1.1 Installing DDS . . . . . . . . . . . . . . . . . . . . . . . . . . . . . . . . . . . . . . . . . 1488.1.2 Configuring and starting DDS . . . . . . . . . . . . . . . . . . . . . . . . . . . . . 1508.1.3 Registering Linux guests with Performance Toolkit for VM. . . . . . . 151
Contents v
8.2 Viewing Linux performance data . . . . . . . . . . . . . . . . . . . . . . . . . . . . . . . 1528.2.1 RMF DDS browser interface . . . . . . . . . . . . . . . . . . . . . . . . . . . . . . 1548.2.2 DDS Java client. . . . . . . . . . . . . . . . . . . . . . . . . . . . . . . . . . . . . . . . 155
8.3 Analyzing Linux guest memory utilization . . . . . . . . . . . . . . . . . . . . . . . . 1558.3.1 Comparing virtual machine size on memory usage . . . . . . . . . . . . 1578.3.2 Analyzing memory usage inside Linux guests . . . . . . . . . . . . . . . . 158
8.4 Analyzing Linux guest paging . . . . . . . . . . . . . . . . . . . . . . . . . . . . . . . . . 1598.4.1 Using a VDISK as a Linux swap partition . . . . . . . . . . . . . . . . . . . . 1608.4.2 Effect of minidisk cache . . . . . . . . . . . . . . . . . . . . . . . . . . . . . . . . . 1618.4.3 Effect of expanded storage . . . . . . . . . . . . . . . . . . . . . . . . . . . . . . . 1618.4.4 Monitoring Linux guest paging . . . . . . . . . . . . . . . . . . . . . . . . . . . . 1628.4.5 Using a single minidisk swap partition . . . . . . . . . . . . . . . . . . . . . . 1628.4.6 Using four minidisk swap partitions. . . . . . . . . . . . . . . . . . . . . . . . . 1668.4.7 Using a VDISK swap partition . . . . . . . . . . . . . . . . . . . . . . . . . . . . . 168
8.5 Analyzing processor utilization . . . . . . . . . . . . . . . . . . . . . . . . . . . . . . . . 1708.5.1 Processor utilization for a Linux guest . . . . . . . . . . . . . . . . . . . . . . 1718.5.2 Shared and dedicated processors . . . . . . . . . . . . . . . . . . . . . . . . . 1738.5.3 Running services and daemons . . . . . . . . . . . . . . . . . . . . . . . . . . . 175
Chapter 9. RTM and PRF functions in Performance Toolkit for VM . . . . 1779.1 Equivalent RTM functions . . . . . . . . . . . . . . . . . . . . . . . . . . . . . . . . . . . . 1789.2 The RTM general display . . . . . . . . . . . . . . . . . . . . . . . . . . . . . . . . . . . . 178
9.2.1 The Performance Toolkit for VM general display . . . . . . . . . . . . . . 1799.3 The RTM SLOG display . . . . . . . . . . . . . . . . . . . . . . . . . . . . . . . . . . . . . 180
9.3.1 Performance Toolkit for VM history files . . . . . . . . . . . . . . . . . . . . . 1809.4 The RTM environment display . . . . . . . . . . . . . . . . . . . . . . . . . . . . . . . . 182
9.4.1 Performance Toolkit for VM system configuration display . . . . . . . 1829.5 The RTM user display . . . . . . . . . . . . . . . . . . . . . . . . . . . . . . . . . . . . . . . 183
9.5.1 The Performance Toolkit for VM user display . . . . . . . . . . . . . . . . . 1849.6 The RTM idle user display. . . . . . . . . . . . . . . . . . . . . . . . . . . . . . . . . . . . 185
9.6.1 The Performance Toolkit for VM idle user display . . . . . . . . . . . . . 1859.7 The RTM I/O display . . . . . . . . . . . . . . . . . . . . . . . . . . . . . . . . . . . . . . . . 185
9.7.1 The Performance Toolkit for VM I/O display . . . . . . . . . . . . . . . . . . 1869.8 Using the Virtual Machine Communication Facility . . . . . . . . . . . . . . . . . 1879.9 Creating scheduled printed reports . . . . . . . . . . . . . . . . . . . . . . . . . . . . . 1879.10 VMPRF functions . . . . . . . . . . . . . . . . . . . . . . . . . . . . . . . . . . . . . . . . . 187
9.10.1 Creating history data . . . . . . . . . . . . . . . . . . . . . . . . . . . . . . . . . . . 1889.10.2 Processing historical data . . . . . . . . . . . . . . . . . . . . . . . . . . . . . . . 1889.10.3 When to use MONSCAN. . . . . . . . . . . . . . . . . . . . . . . . . . . . . . . . 1889.10.4 When to use TRNDSCAN . . . . . . . . . . . . . . . . . . . . . . . . . . . . . . . 1909.10.5 Reports . . . . . . . . . . . . . . . . . . . . . . . . . . . . . . . . . . . . . . . . . . . . . 191
Chapter 10. Performance Toolkit for VM updates for function level 510 193
vi Linux on IBM Eserver zSeries and S/390: Performance Toolkit for VM
10.1 Performance Toolkit for VM changes for FL510 . . . . . . . . . . . . . . . . . . 19410.2 Performance Toolkit for VM installation changes . . . . . . . . . . . . . . . . . 19410.3 Control file changes for FL510 . . . . . . . . . . . . . . . . . . . . . . . . . . . . . . . 197
10.3.1 FCONX $PROFILE change . . . . . . . . . . . . . . . . . . . . . . . . . . . . . 19710.3.2 Performance Toolkit for VM report changes . . . . . . . . . . . . . . . . . 19710.3.3 FCONX TRENDREC change . . . . . . . . . . . . . . . . . . . . . . . . . . . . 19810.3.4 New FCONX SUMREC. . . . . . . . . . . . . . . . . . . . . . . . . . . . . . . . . 198
10.4 Performance Toolkit for VM PRF support . . . . . . . . . . . . . . . . . . . . . . . 19810.5 Using APPLDATA from Linux . . . . . . . . . . . . . . . . . . . . . . . . . . . . . . . . 20010.6 New reports for SCSI DASD . . . . . . . . . . . . . . . . . . . . . . . . . . . . . . . . . 20410.7 Summary of changes for FL510 . . . . . . . . . . . . . . . . . . . . . . . . . . . . . . 204
Appendix A. Monitoring for z/VM . . . . . . . . . . . . . . . . . . . . . . . . . . . . . . . . 205VM Monitor facility overview. . . . . . . . . . . . . . . . . . . . . . . . . . . . . . . . . . . . . . 206
A word about the monitor system service (*MONITOR) . . . . . . . . . . . . . . 208Types of available monitor data . . . . . . . . . . . . . . . . . . . . . . . . . . . . . . . . . . . 208Using the CP MONITOR command . . . . . . . . . . . . . . . . . . . . . . . . . . . . . . . . 210
Appendix B. Performance Toolkit for VM sample files . . . . . . . . . . . . . . 211The sample FCONX $PROFILE. . . . . . . . . . . . . . . . . . . . . . . . . . . . . . . . . . . 212
Appendix C. Adding VM page space . . . . . . . . . . . . . . . . . . . . . . . . . . . . . 223How to add page space to a running z/VM system . . . . . . . . . . . . . . . . . . . . 224Making the dynamic change permanent . . . . . . . . . . . . . . . . . . . . . . . . . . . . 228Optional steps . . . . . . . . . . . . . . . . . . . . . . . . . . . . . . . . . . . . . . . . . . . . . . . . 228
Appendix D. Sample tools . . . . . . . . . . . . . . . . . . . . . . . . . . . . . . . . . . . . . 229Sample monitoring EXECs. . . . . . . . . . . . . . . . . . . . . . . . . . . . . . . . . . . . . . . 230
The PAG EXEC. . . . . . . . . . . . . . . . . . . . . . . . . . . . . . . . . . . . . . . . . . . . . 230The SHARE EXEC . . . . . . . . . . . . . . . . . . . . . . . . . . . . . . . . . . . . . . . . . . 231
Sample VMCX front end. . . . . . . . . . . . . . . . . . . . . . . . . . . . . . . . . . . . . . . . . 232
Related publications . . . . . . . . . . . . . . . . . . . . . . . . . . . . . . . . . . . . . . . . . . 235IBM Redbooks . . . . . . . . . . . . . . . . . . . . . . . . . . . . . . . . . . . . . . . . . . . . . . . . 235Other publications . . . . . . . . . . . . . . . . . . . . . . . . . . . . . . . . . . . . . . . . . . . . . 235Online resources . . . . . . . . . . . . . . . . . . . . . . . . . . . . . . . . . . . . . . . . . . . . . . 236How to get IBM Redbooks . . . . . . . . . . . . . . . . . . . . . . . . . . . . . . . . . . . . . . . 236Help from IBM . . . . . . . . . . . . . . . . . . . . . . . . . . . . . . . . . . . . . . . . . . . . . . . . 236
Abbreviations and acronyms . . . . . . . . . . . . . . . . . . . . . . . . . . . . . . . . . . . 237
Index . . . . . . . . . . . . . . . . . . . . . . . . . . . . . . . . . . . . . . . . . . . . . . . . . . . . . . . 239
Contents vii
viii Linux on IBM Eserver zSeries and S/390: Performance Toolkit for VM
Notices
This information was developed for products and services offered in the U.S.A.
IBM may not offer the products, services, or features discussed in this document in other countries. Consult your local IBM representative for information on the products and services currently available in your area. Any reference to an IBM product, program, or service is not intended to state or imply that only that IBM product, program, or service may be used. Any functionally equivalent product, program, or service that does not infringe any IBM intellectual property right may be used instead. However, it is the user's responsibility to evaluate and verify the operation of any non-IBM product, program, or service.
IBM may have patents or pending patent applications covering subject matter described in this document. The furnishing of this document does not give you any license to these patents. You can send license inquiries, in writing, to: IBM Director of Licensing, IBM Corporation, North Castle Drive Armonk, NY 10504-1785 U.S.A.
The following paragraph does not apply to the United Kingdom or any other country where such provisions are inconsistent with local law: INTERNATIONAL BUSINESS MACHINES CORPORATION PROVIDES THIS PUBLICATION "AS IS" WITHOUT WARRANTY OF ANY KIND, EITHER EXPRESS OR IMPLIED, INCLUDING, BUT NOT LIMITED TO, THE IMPLIED WARRANTIES OF NON-INFRINGEMENT, MERCHANTABILITY OR FITNESS FOR A PARTICULAR PURPOSE. Some states do not allow disclaimer of express or implied warranties in certain transactions, therefore, this statement may not apply to you.
This information could include technical inaccuracies or typographical errors. Changes are periodically made to the information herein; these changes will be incorporated in new editions of the publication. IBM may make improvements and/or changes in the product(s) and/or the program(s) described in this publication at any time without notice.
Any references in this information to non-IBM Web sites are provided for convenience only and do not in any manner serve as an endorsement of those Web sites. The materials at those Web sites are not part of the materials for this IBM product and use of those Web sites is at your own risk.
IBM may use or distribute any of the information you supply in any way it believes appropriate without incurring any obligation to you.
Information concerning non-IBM products was obtained from the suppliers of those products, their published announcements or other publicly available sources. IBM has not tested those products and cannot confirm the accuracy of performance, compatibility or any other claims related to non-IBM products. Questions on the capabilities of non-IBM products should be addressed to the suppliers of those products.
This information contains examples of data and reports used in daily business operations. To illustrate them as completely as possible, the examples include the names of individuals, companies, brands, and products. All of these names are fictitious and any similarity to the names and addresses used by an actual business enterprise is entirely coincidental.
COPYRIGHT LICENSE: This information contains sample application programs in source language, which illustrates programming techniques on various operating platforms. You may copy, modify, and distribute these sample programs in any form without payment to IBM, for the purposes of developing, using, marketing or distributing application programs conforming to the application programming interface for the operating platform for which the sample programs are written. These examples have not been thoroughly tested under all conditions. IBM, therefore, cannot guarantee or imply reliability, serviceability, or function of these programs. You may copy, modify, and distribute these sample programs in any form without payment to IBM for the purposes of developing, using, marketing, or distributing application programs conforming to IBM's application programming interfaces.
© Copyright IBM Corp. 2004. All rights reserved. ix
TrademarksThe following terms are trademarks of the International Business Machines Corporation in the United States, other countries, or both:
ESCON®Eserver®Eserver®GDDM®IBM®PR/SM™
RACF®RAMAC®Redbooks™Redbooks (logo) ™Resource Measurement Facility™RMF™
S/390®SQL/DS™VTAM®z/OS®z/VM®zSeries®
The following terms are trademarks of other companies:
Java and all Java-based trademarks and logos are trademarks or registered trademarks of Sun Microsystems, Inc. in the United States, other countries, or both.
Microsoft, Windows, and the Windows logo are trademarks of Microsoft Corporation in the United States, other countries, or both.
Linux is a trademark of Linus Torvalds in the United States, other countries, or both.
Other company, product, and service names may be trademarks or service marks of others.
x Linux on IBM Eserver zSeries and S/390: Performance Toolkit for VM
Preface
This IBM® Redbook introduces Performance Toolkit for VM, which provides real-time monitoring and historical performance analysis for multiple z/VM® systems. Offered as an optional z/VM feature, Performance Toolkit for VM is derived from the FCON/ESA program. It provides enhanced capabilities for system programmers, operators, and performance analysts to monitor and report performance data.
This redbook provides an overview of the functions and features of Performance Toolkit for VM. We present the major monitoring screens, show its configuration, and illustrate how to monitor remote z/VM systems from a central Performance Toolkit for VM server. Using this product, we explain how to monitor your z/VM system identify potential performance problems. We discuss critical systems setting and performance measurements to help understand z/VM configuration and subsystems.
The team that wrote this redbookThis redbook was produced by a team of specialists from around the world working at the International Technical Support Organization, Poughkeepsie Center.
Gregory Geiselhart is a Project Leader for Linux® on zSeries® at the International Technical Support Organization, Poughkeepsie Center.
Bruce Dailey is a software engineer with the z/VM development organization in the United States. For the past 10 years he has been lead developer and change team member for many VM performance products. He has a degree in mathematics from Illinois Institute of Technology and a Masters’ degree in Computer and Information Systems from Syracuse University. He has also written about and presented on using CMS Pipelines with SQL/DS™.
Dean DiTommaso is an Advisory Software Engineer in the IBM Systems and Technology Group, Endicott, NY. He joined IBM in 1980 after receiving a B.S. in Computer Science from the State University of New York at Potsdam. Dean has held positions in system software and application software development including project planning, project management, technical team leadership, and more recently in performance evaluation for z/VM. Dean has been recognized for his project management, team leadership, and design work.
© Copyright IBM Corp. 2004. All rights reserved. xi
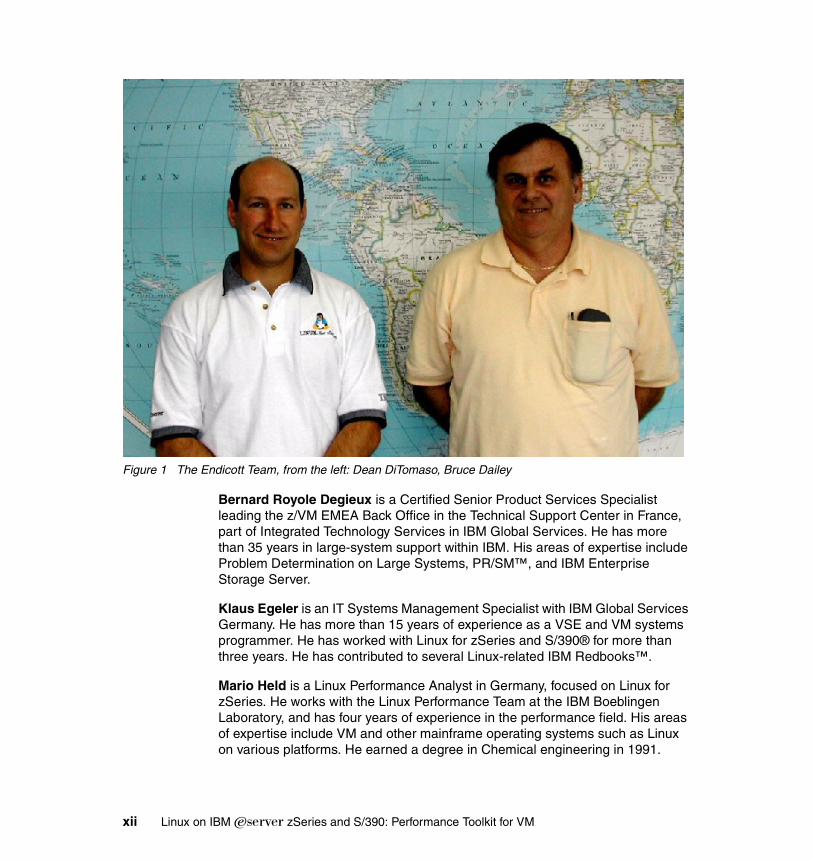
Figure 1 The Endicott Team, from the left: Dean DiTomaso, Bruce Dailey
Bernard Royole Degieux is a Certified Senior Product Services Specialist leading the z/VM EMEA Back Office in the Technical Support Center in France, part of Integrated Technology Services in IBM Global Services. He has more than 35 years in large-system support within IBM. His areas of expertise include Problem Determination on Large Systems, PR/SM™, and IBM Enterprise Storage Server.
Klaus Egeler is an IT Systems Management Specialist with IBM Global Services Germany. He has more than 15 years of experience as a VSE and VM systems programmer. He has worked with Linux for zSeries and S/390® for more than three years. He has contributed to several Linux-related IBM Redbooks™.
Mario Held is a Linux Performance Analyst in Germany, focused on Linux for zSeries. He works with the Linux Performance Team at the IBM Boeblingen Laboratory, and has four years of experience in the performance field. His areas of expertise include VM and other mainframe operating systems such as Linux on various platforms. He earned a degree in Chemical engineering in 1991.
xii Linux on IBM Eserver zSeries and S/390: Performance Toolkit for VM
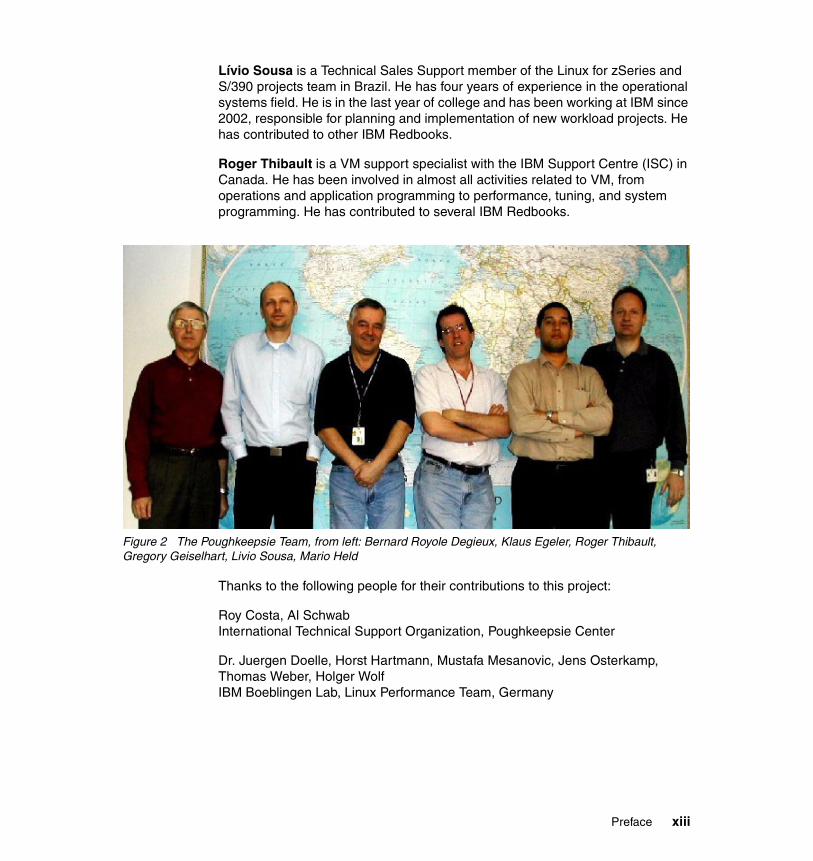
Lívio Sousa is a Technical Sales Support member of the Linux for zSeries and S/390 projects team in Brazil. He has four years of experience in the operational systems field. He is in the last year of college and has been working at IBM since 2002, responsible for planning and implementation of new workload projects. He has contributed to other IBM Redbooks.
Roger Thibault is a VM support specialist with the IBM Support Centre (ISC) in Canada. He has been involved in almost all activities related to VM, from operations and application programming to performance, tuning, and system programming. He has contributed to several IBM Redbooks.
Figure 2 The Poughkeepsie Team, from left: Bernard Royole Degieux, Klaus Egeler, Roger Thibault, Gregory Geiselhart, Livio Sousa, Mario Held
Thanks to the following people for their contributions to this project:
Roy Costa, Al SchwabInternational Technical Support Organization, Poughkeepsie Center
Dr. Juergen Doelle, Horst Hartmann, Mustafa Mesanovic, Jens Osterkamp, Thomas Weber, Holger WolfIBM Boeblingen Lab, Linux Performance Team, Germany
Preface xiii
Become a published authorJoin us for a two- to six-week residency program! Help write an IBM Redbook dealing with specific products or solutions, while getting hands-on experience with leading-edge technologies. You will team with IBM technical professionals, Business Partners and/or customers.
Your efforts will help increase product acceptance and customer satisfaction. As a bonus, you’ll develop a network of contacts in IBM development labs, and increase your productivity and marketability.
Find out more about the residency program, browse the residency index, and apply online at:
ibm.com/redbooks/residencies.html
Comments welcomeYour comments are important to us. We want our Redbooks to be as helpful as possible. Send us your comments about this or other Redbooks in one of the following ways:
� Use the online Contact us review redbook form found at:
ibm.com/redbooks
� Send your comments in an e-mail to:
� Mail your comments to:
IBM Corporation, International Technical Support OrganizationDept. HYJ Mail Station P0992455 South RoadPoughkeepsie, NY 12601-5400
xiv Linux on IBM Eserver zSeries and S/390: Performance Toolkit for VM
Chapter 1. Performance Toolkit for VM at a glance
This chapter provides an overview of the functions and features of Performance Toolkit for VM. We discuss:
� Defining Performance Toolkit for VM
� Starting Performance Toolkit for VM
� Basic mode
� Monitor mode
� Help facility
� Displaying current and average data
� Sorting reported data
� History performance analysis
� Benchmark data analysis
� Threshold monitoring
� Variable correlation coefficient analysis
� When to use Performance Toolkit for VM
Details about specific Performance Toolkit for VM functions can be found in z/VM: Performance Toolkit, SC24-6062, which is available in the z/VM Internet library:
http://www.vm.ibm.com/library
1
© Copyright IBM Corp. 2004. All rights reserved. 1
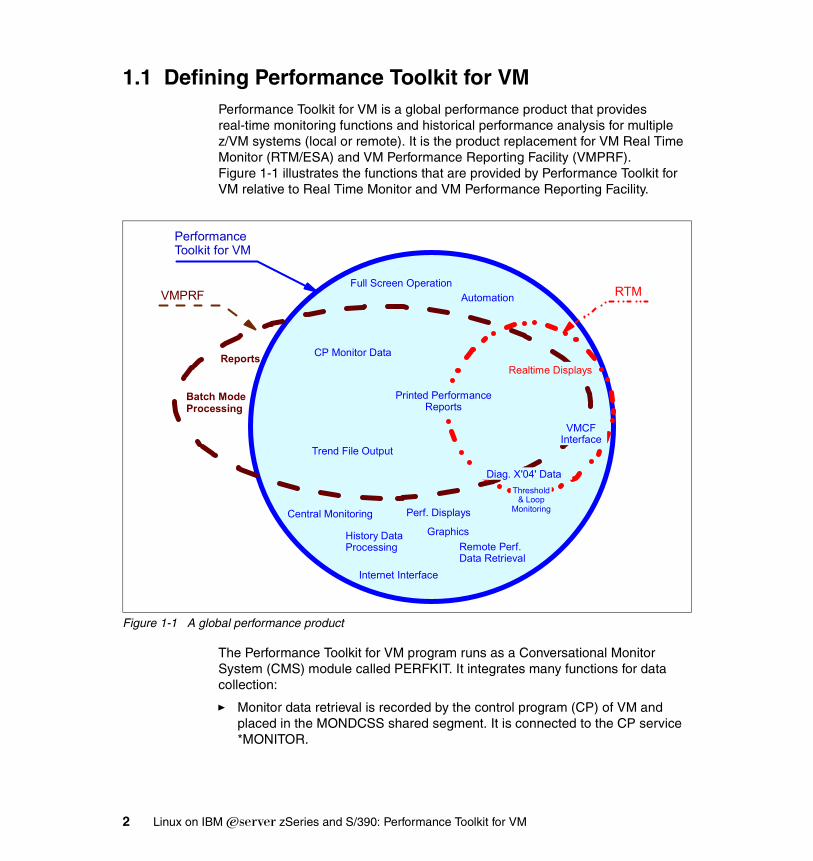
1.1 Defining Performance Toolkit for VMPerformance Toolkit for VM is a global performance product that provides real-time monitoring functions and historical performance analysis for multiple z/VM systems (local or remote). It is the product replacement for VM Real Time Monitor (RTM/ESA) and VM Performance Reporting Facility (VMPRF). Figure 1-1 illustrates the functions that are provided by Performance Toolkit for VM relative to Real Time Monitor and VM Performance Reporting Facility.
Figure 1-1 A global performance product
The Performance Toolkit for VM program runs as a Conversational Monitor System (CMS) module called PERFKIT. It integrates many functions for data collection:
� Monitor data retrieval is recorded by the control program (CP) of VM and placed in the MONDCSS shared segment. It is connected to the CP service *MONITOR.
PerformanceToolkit for VM
VMPRF RTMFull Screen Operation
CP Monitor Data
Trend File Output
Central Monitoring
Remote Perf.Data Retrieval
Internet Interface
Batch ModeProcessing
VMCF Interface
Diag. X'04' Data
Realtime Displays
History DataProcessing
Graphics
Automation
Reports
Perf. Displays
Printed PerformanceReports
Threshold& Loop
Monitoring
2 Linux on IBM Eserver zSeries and S/390: Performance Toolkit for VM
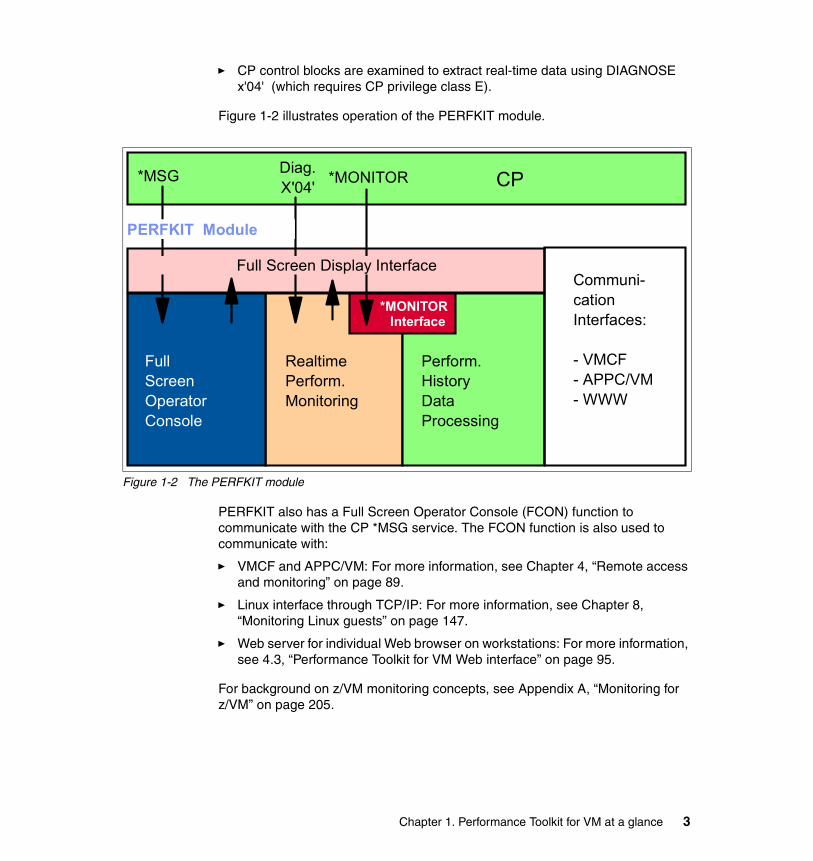
� CP control blocks are examined to extract real-time data using DIAGNOSE x'04' (which requires CP privilege class E).
Figure 1-2 illustrates operation of the PERFKIT module.
Figure 1-2 The PERFKIT module
PERFKIT also has a Full Screen Operator Console (FCON) function to communicate with the CP *MSG service. The FCON function is also used to communicate with:
� VMCF and APPC/VM: For more information, see Chapter 4, “Remote access and monitoring” on page 89.
� Linux interface through TCP/IP: For more information, see Chapter 8, “Monitoring Linux guests” on page 147.
� Web server for individual Web browser on workstations: For more information, see 4.3, “Performance Toolkit for VM Web interface” on page 95.
For background on z/VM monitoring concepts, see Appendix A, “Monitoring for z/VM” on page 205.
CP*MSG
FullScreenOperatorConsole
RealtimePerform.Monitoring
Perform.HistoryDataProcessing
*MONITORDiag.X'04'
*MONITOR Interface
Communi-cationInterfaces: - VMCF- APPC/VM- WWW
PERFKIT Module
Full Screen Display Interface
Chapter 1. Performance Toolkit for VM at a glance 3
1.2 Starting Performance Toolkit for VMBy default, Performance Toolkit for VM is enabled to run in the virtual machine of the PERFSVM user. It is started by using the PERFKIT command.
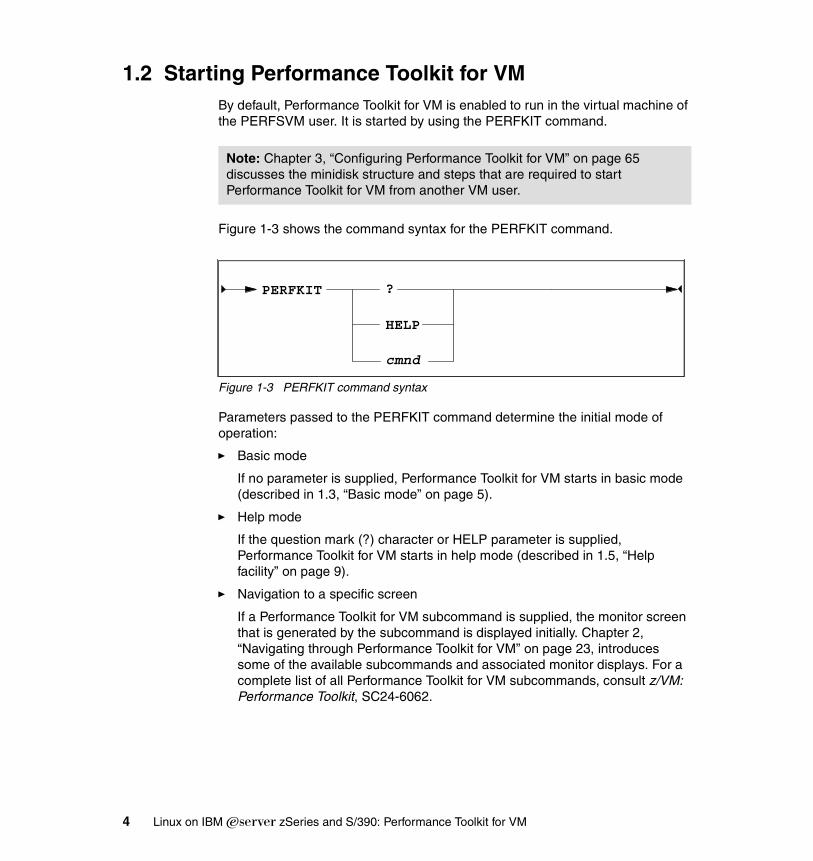
Figure 1-3 shows the command syntax for the PERFKIT command.
Figure 1-3 PERFKIT command syntax
Parameters passed to the PERFKIT command determine the initial mode of operation:
� Basic mode
If no parameter is supplied, Performance Toolkit for VM starts in basic mode (described in 1.3, “Basic mode” on page 5).
� Help mode
If the question mark (?) character or HELP parameter is supplied, Performance Toolkit for VM starts in help mode (described in 1.5, “Help facility” on page 9).
� Navigation to a specific screen
If a Performance Toolkit for VM subcommand is supplied, the monitor screen that is generated by the subcommand is displayed initially. Chapter 2, “Navigating through Performance Toolkit for VM” on page 23, introduces some of the available subcommands and associated monitor displays. For a complete list of all Performance Toolkit for VM subcommands, consult z/VM: Performance Toolkit, SC24-6062.
Note: Chapter 3, “Configuring Performance Toolkit for VM” on page 65 discusses the minidisk structure and steps that are required to start Performance Toolkit for VM from another VM user.
PERFKIT ?
HELP
cmnd
4 Linux on IBM Eserver zSeries and S/390: Performance Toolkit for VM
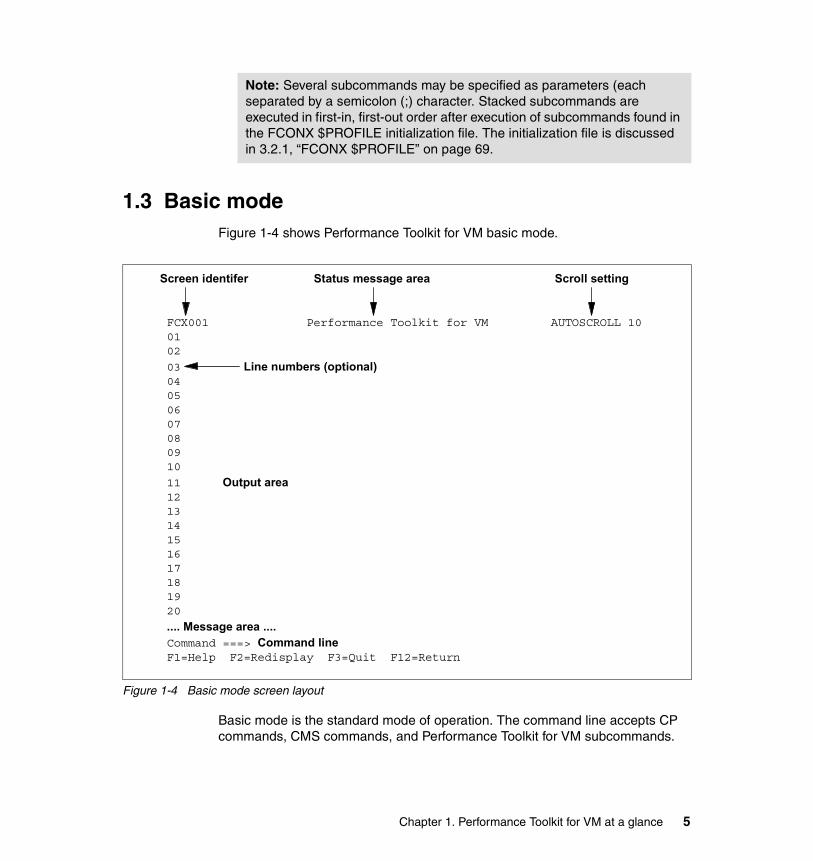
1.3 Basic modeFigure 1-4 shows Performance Toolkit for VM basic mode.
Figure 1-4 Basic mode screen layout
Basic mode is the standard mode of operation. The command line accepts CP commands, CMS commands, and Performance Toolkit for VM subcommands.
Note: Several subcommands may be specified as parameters (each separated by a semicolon (;) character. Stacked subcommands are executed in first-in, first-out order after execution of subcommands found in the FCONX $PROFILE initialization file. The initialization file is discussed in 3.2.1, “FCONX $PROFILE” on page 69.
Screen identifer Status message area Scroll setting FCX001 Performance Toolkit for VM AUTOSCROLL 10 01 02
03 Line numbers (optional) 04 05 06 07 08 09 10
11 Output area 12 13 14 15 16 17 18 19 20
.... Message area .... Command ===> Command line F1=Help F2=Redisplay F3=Quit F12=Return
Chapter 1. Performance Toolkit for VM at a glance 5
Command output is displayed in the output area. The default command search order is:
1. Performance Toolkit for VM subcommand2. CP command3. CMS command
In basic mode, command output may be filtered. You can define message output to be suppressed. (Performance Toolkit for VM hides these messages.) Message output may also be redirected. For example, to route tape-related messages from to the tape operator (user ID tapeop), use the commands:
FC PROCESS CPMSG * ‘TAPE’ NODISP RER TAPEOP CPMSGFC PROCESS CPAMSG * ‘HCPERP2215A’ RER TAPEOP CPMSG
A limited automation capability is available with Performance Toolkit for VM. You can invoke REXX procedure triggered by a message or a string within a message.
1.3.1 Redisplay facilityThe redisplay facility of Performance Toolkit for VM enables browsing through the accumulated console log or through a previous day’s logs. To enter the redisplay mode, press PF2 or enter the REDISP subcommand in basic mode. Figure 1-5 on page 7 shows features of the redisplay facility.
Tip: To change the command search order, see the FCONTROL SEARCH subcommand on page 74.
Note: In large computing centers, the tape units are typically located some distance from the z/VM consoles. In many cases, there is a dedicated tape operator, and all tape-related messages should be directed to a console near the tape units. With message routing, Performance Toolkit for VM can act as the system console.
6 Linux on IBM Eserver zSeries and S/390: Performance Toolkit for VM
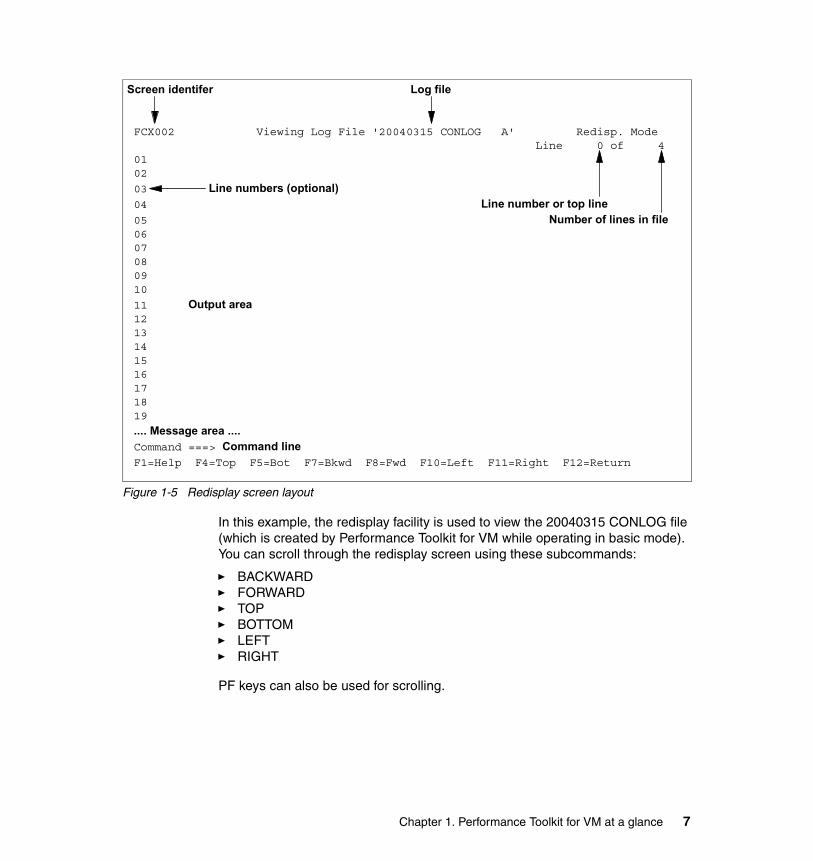
Figure 1-5 Redisplay screen layout
In this example, the redisplay facility is used to view the 20040315 CONLOG file (which is created by Performance Toolkit for VM while operating in basic mode). You can scroll through the redisplay screen using these subcommands:
� BACKWARD� FORWARD� TOP� BOTTOM� LEFT� RIGHT
PF keys can also be used for scrolling.
Screen identifer Log file
FCX002 Viewing Log File '20040315 CONLOG A' Redisp. Mode Line 0 of 4 01 02
03 Line numbers (optional) 04 Line number or top line 05 Number of lines in file 06 07 08 09 10
11 Output area 12 13 14 15 16 17 18 19
.... Message area .... Command ===> Command line F1=Help F4=Top F5=Bot F7=Bkwd F8=Fwd F10=Left F11=Right F12=Return
Chapter 1. Performance Toolkit for VM at a glance 7
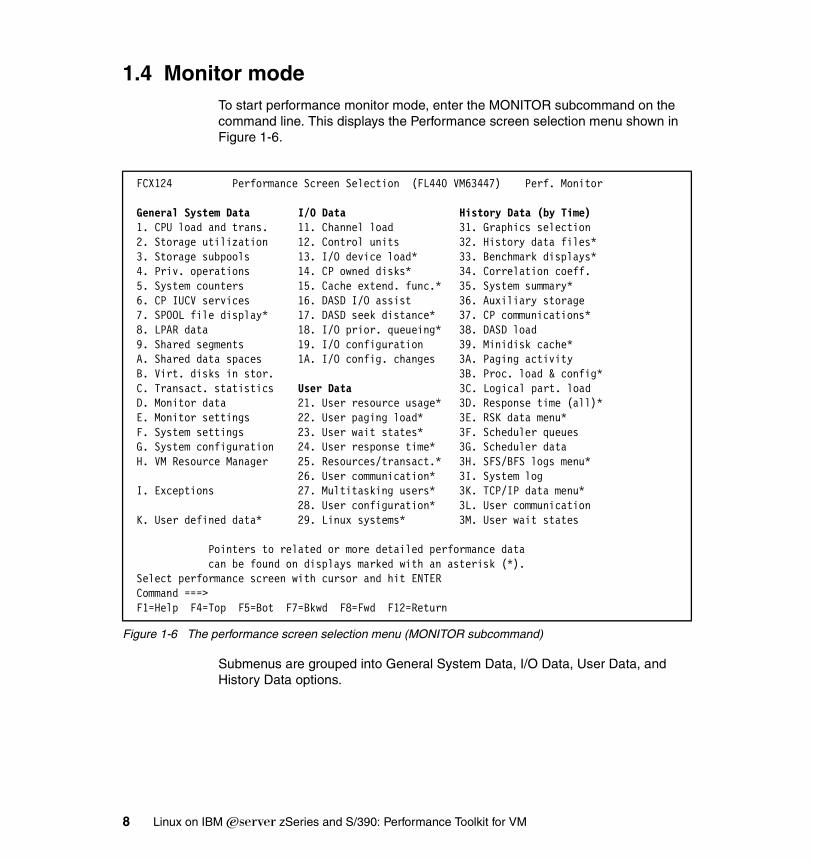
1.4 Monitor modeTo start performance monitor mode, enter the MONITOR subcommand on the command line. This displays the Performance screen selection menu shown in Figure 1-6.
Figure 1-6 The performance screen selection menu (MONITOR subcommand)
Submenus are grouped into General System Data, I/O Data, User Data, and History Data options.
FCX124 Performance Screen Selection (FL440 VM63447) Perf. Monitor General System Data I/O Data History Data (by Time) 1. CPU load and trans. 11. Channel load 31. Graphics selection 2. Storage utilization 12. Control units 32. History data files* 3. Storage subpools 13. I/O device load* 33. Benchmark displays* 4. Priv. operations 14. CP owned disks* 34. Correlation coeff. 5. System counters 15. Cache extend. func.* 35. System summary* 6. CP IUCV services 16. DASD I/O assist 36. Auxiliary storage 7. SPOOL file display* 17. DASD seek distance* 37. CP communications* 8. LPAR data 18. I/O prior. queueing* 38. DASD load 9. Shared segments 19. I/O configuration 39. Minidisk cache* A. Shared data spaces 1A. I/O config. changes 3A. Paging activity B. Virt. disks in stor. 3B. Proc. load & config* C. Transact. statistics User Data 3C. Logical part. load D. Monitor data 21. User resource usage* 3D. Response time (all)* E. Monitor settings 22. User paging load* 3E. RSK data menu* F. System settings 23. User wait states* 3F. Scheduler queues G. System configuration 24. User response time* 3G. Scheduler data H. VM Resource Manager 25. Resources/transact.* 3H. SFS/BFS logs menu* 26. User communication* 3I. System log I. Exceptions 27. Multitasking users* 3K. TCP/IP data menu* 28. User configuration* 3L. User communication K. User defined data* 29. Linux systems* 3M. User wait states Pointers to related or more detailed performance data can be found on displays marked with an asterisk (*). Select performance screen with cursor and hit ENTER Command ===> F1=Help F4=Top F5=Bot F7=Bkwd F8=Fwd F12=Return
8 Linux on IBM Eserver zSeries and S/390: Performance Toolkit for VM
The asterisk (*) character that follows a menu definition indicates that the menu contains subsequent submenus. You can drill down to submenus for more detailed information.
Several methods may be used to navigate:
� Use the screen option number.
Type the desired option number on the command line and press the Enter key. For example, enter 8 on the command line to view LPAR data.
� Use the sensitive select option.
Move the cursor over the desired option and press Enter.
� Use the option subcommand name.
Enter the short path subcommand name for the selected screen and press Enter. We discuss some common subcommands in Chapter 2, “Navigating through Performance Toolkit for VM” on page 23.
In the Web interface for the Performance Toolkit for VM (described in 4.3, “Performance Toolkit for VM Web interface” on page 95), you can navigate using the mouse. Move the mouse to the desired option, and click the left mouse button to select that option.
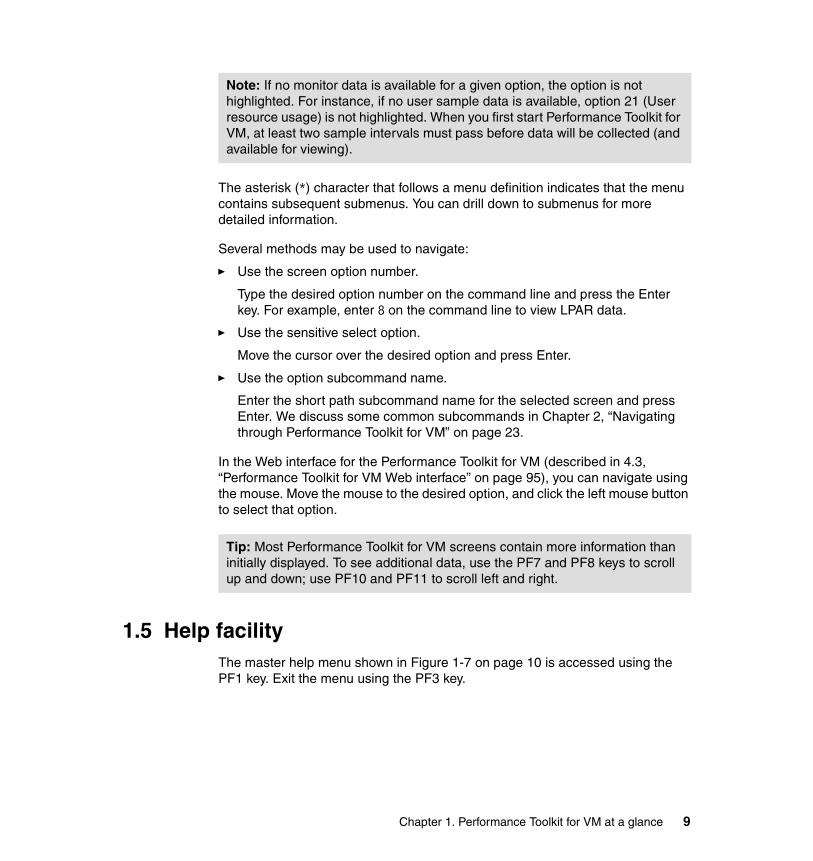
1.5 Help facilityThe master help menu shown in Figure 1-7 on page 10 is accessed using the PF1 key. Exit the menu using the PF3 key.
Note: If no monitor data is available for a given option, the option is not highlighted. For instance, if no user sample data is available, option 21 (User resource usage) is not highlighted. When you first start Performance Toolkit for VM, at least two sample intervals must pass before data will be collected (and available for viewing).
Tip: Most Performance Toolkit for VM screens contain more information than initially displayed. To see additional data, use the PF7 and PF8 keys to scroll up and down; use PF10 and PF11 to scroll left and right.
Chapter 1. Performance Toolkit for VM at a glance 9
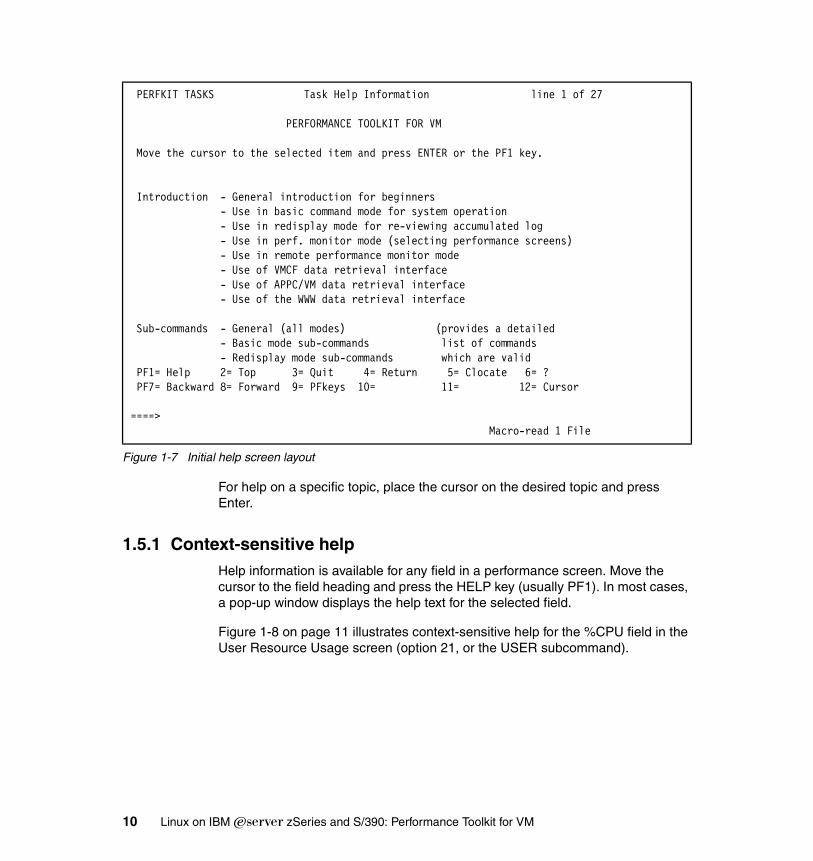
Figure 1-7 Initial help screen layout
For help on a specific topic, place the cursor on the desired topic and press Enter.
1.5.1 Context-sensitive helpHelp information is available for any field in a performance screen. Move the cursor to the field heading and press the HELP key (usually PF1). In most cases, a pop-up window displays the help text for the selected field.
Figure 1-8 on page 11 illustrates context-sensitive help for the %CPU field in the User Resource Usage screen (option 21, or the USER subcommand).
PERFKIT TASKS Task Help Information line 1 of 27 PERFORMANCE TOOLKIT FOR VM Move the cursor to the selected item and press ENTER or the PF1 key. Introduction - General introduction for beginners - Use in basic command mode for system operation - Use in redisplay mode for re-viewing accumulated log - Use in perf. monitor mode (selecting performance screens) - Use in remote performance monitor mode - Use of VMCF data retrieval interface - Use of APPC/VM data retrieval interface - Use of the WWW data retrieval interface Sub-commands - General (all modes) (provides a detailed - Basic mode sub-commands list of commands - Redisplay mode sub-commands which are valid PF1= Help 2= Top 3= Quit 4= Return 5= Clocate 6= ? PF7= Backward 8= Forward 9= PFkeys 10= 11= 12= Cursor ====> Macro-read 1 File
10 Linux on IBM Eserver zSeries and S/390: Performance Toolkit for VM
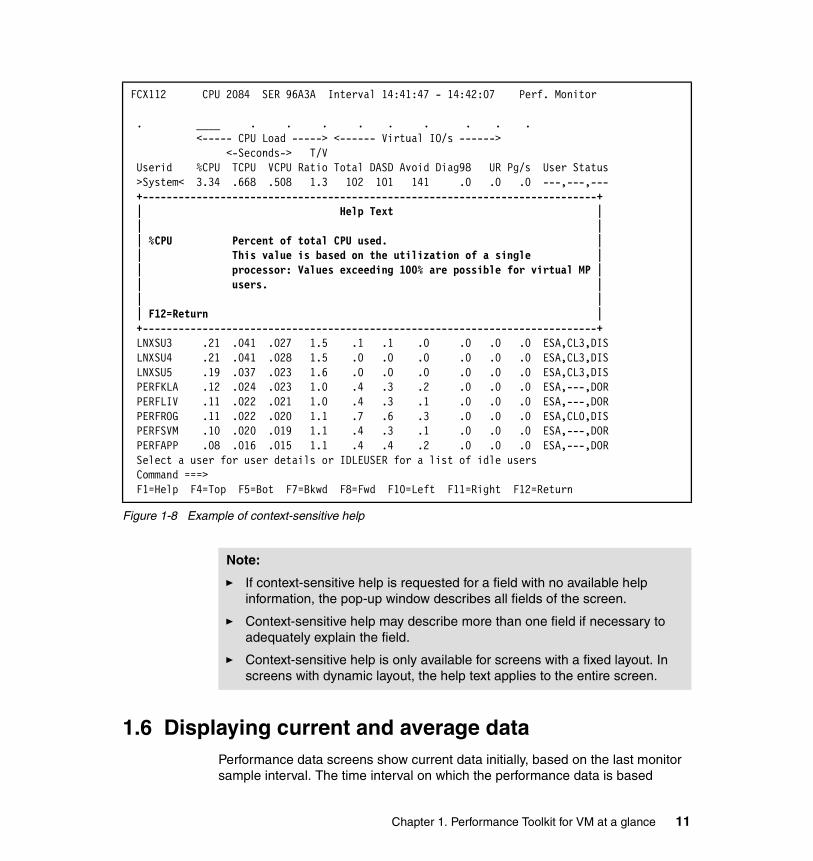
Figure 1-8 Example of context-sensitive help
1.6 Displaying current and average dataPerformance data screens show current data initially, based on the last monitor sample interval. The time interval on which the performance data is based
FCX112 CPU 2084 SER 96A3A Interval 14:41:47 - 14:42:07 Perf. Monitor . ____ . . . . . . . . . <----- CPU Load -----> <------ Virtual IO/s ------> <-Seconds-> T/V Userid %CPU TCPU VCPU Ratio Total DASD Avoid Diag98 UR Pg/s User Status >System< 3.34 .668 .508 1.3 102 101 141 .0 .0 .0 ---,---,--- +----------------------------------------------------------------------------+ | Help Text | | | | %CPU Percent of total CPU used. | | This value is based on the utilization of a single | | processor: Values exceeding 100% are possible for virtual MP | | users. | | | | F12=Return | +----------------------------------------------------------------------------+ LNXSU3 .21 .041 .027 1.5 .1 .1 .0 .0 .0 .0 ESA,CL3,DIS LNXSU4 .21 .041 .028 1.5 .0 .0 .0 .0 .0 .0 ESA,CL3,DIS LNXSU5 .19 .037 .023 1.6 .0 .0 .0 .0 .0 .0 ESA,CL3,DIS PERFKLA .12 .024 .023 1.0 .4 .3 .2 .0 .0 .0 ESA,---,DOR PERFLIV .11 .022 .021 1.0 .4 .3 .1 .0 .0 .0 ESA,---,DOR PERFROG .11 .022 .020 1.1 .7 .6 .3 .0 .0 .0 ESA,CL0,DIS PERFSVM .10 .020 .019 1.1 .4 .3 .1 .0 .0 .0 ESA,---,DOR PERFAPP .08 .016 .015 1.1 .4 .4 .2 .0 .0 .0 ESA,---,DOR Select a user for user details or IDLEUSER for a list of idle users Command ===> F1=Help F4=Top F5=Bot F7=Bkwd F8=Fwd F10=Left F11=Right F12=Return
Note:
� If context-sensitive help is requested for a field with no available help information, the pop-up window describes all fields of the screen.
� Context-sensitive help may describe more than one field if necessary to adequately explain the field.
� Context-sensitive help is only available for screens with a fixed layout. In screens with dynamic layout, the help text applies to the entire screen.
Chapter 1. Performance Toolkit for VM at a glance 11
appears in the header line. Data is shown as either current values or average values. To switch modes:
� Enter the AVERAGE subcommand to see average data values.
In average mode, displayed data are average values since the start of monitoring. or since the last data reset.
� Enter the CURRENT subcommand to see current data values.
This is the default display mode for most performance screens. Displayed data is the value since the last measuring interval. Start and end time indicate the time the two samples were taken (the monitor sample interval for most options).
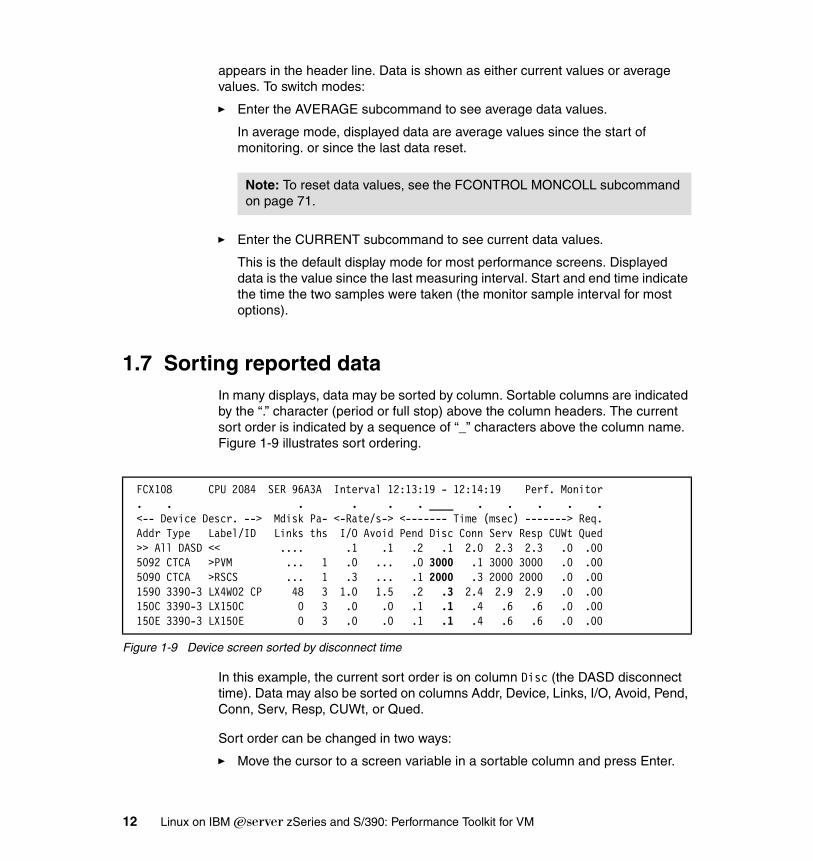
1.7 Sorting reported dataIn many displays, data may be sorted by column. Sortable columns are indicated by the “.” character (period or full stop) above the column headers. The current sort order is indicated by a sequence of “_” characters above the column name. Figure 1-9 illustrates sort ordering.
Figure 1-9 Device screen sorted by disconnect time
In this example, the current sort order is on column Disc (the DASD disconnect time). Data may also be sorted on columns Addr, Device, Links, I/O, Avoid, Pend, Conn, Serv, Resp, CUWt, or Qued.
Sort order can be changed in two ways:
� Move the cursor to a screen variable in a sortable column and press Enter.
Note: To reset data values, see the FCONTROL MONCOLL subcommand on page 71.
FCX108 CPU 2084 SER 96A3A Interval 12:13:19 - 12:14:19 Perf. Monitor . . . . . . ____ . . . . . <-- Device Descr. --> Mdisk Pa- <-Rate/s-> <------- Time (msec) -------> Req. Addr Type Label/ID Links ths I/O Avoid Pend Disc Conn Serv Resp CUWt Qued >> All DASD << .... .1 .1 .2 .1 2.0 2.3 2.3 .0 .00 5092 CTCA >PVM ... 1 .0 ... .0 3000 .1 3000 3000 .0 .00 5090 CTCA >RSCS ... 1 .3 ... .1 2000 .3 2000 2000 .0 .00 1590 3390-3 LX4W02 CP 48 3 1.0 1.5 .2 .3 2.4 2.9 2.9 .0 .00 150C 3390-3 LX150C 0 3 .0 .0 .1 .1 .4 .6 .6 .0 .00 150E 3390-3 LX150E 0 3 .0 .0 .1 .1 .4 .6 .6 .0 .00
12 Linux on IBM Eserver zSeries and S/390: Performance Toolkit for VM
� Issue the SORT column subcommand. In this example, we use the SORT DISC subcommand to sort on disconnect time.
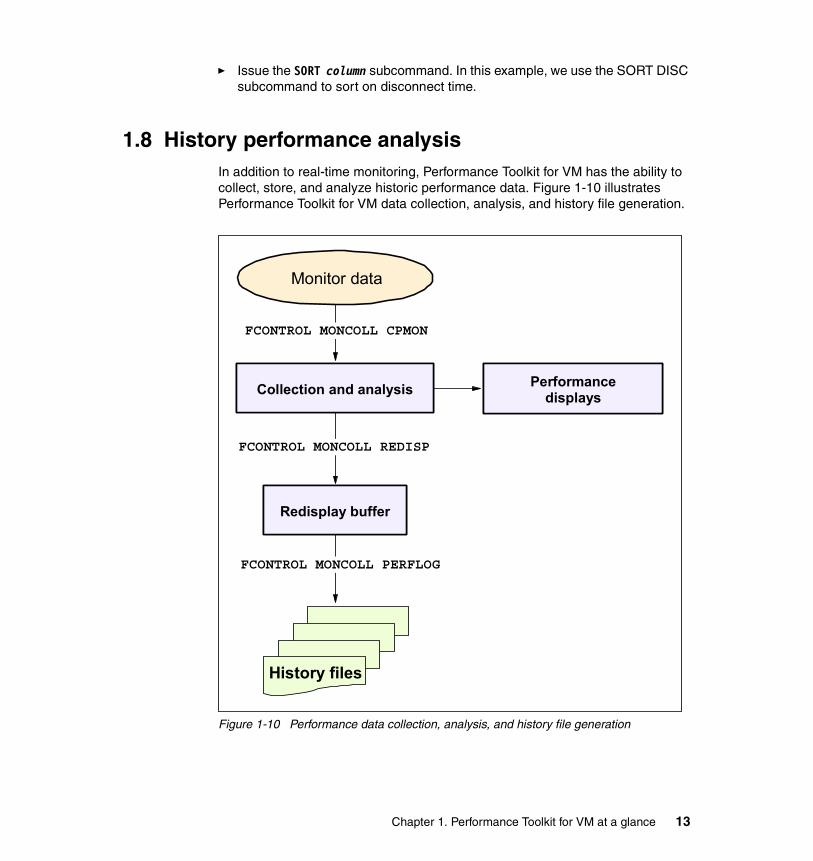
1.8 History performance analysisIn addition to real-time monitoring, Performance Toolkit for VM has the ability to collect, store, and analyze historic performance data. Figure 1-10 illustrates Performance Toolkit for VM data collection, analysis, and history file generation.
Figure 1-10 Performance data collection, analysis, and history file generation
Performance displays
Redisplay buffer
Collection and analysis
History files
Monitor data
FCONTROL MONCOLL CPMON
FCONTROL MONCOLL PERFLOG
FCONTROL MONCOLL REDISP
Chapter 1. Performance Toolkit for VM at a glance 13
The figure depicts:
The FCONTROL MONCOLL CPMON command controls monitor data collection. Performance Toolkit for VM can analyze real-time data, as well as monitor data that was created using the MONWRITE utility:
– The FCONTROL MONCOLL CPMON DCSS command starts real-time analysis. Real-time data is collected from a shared segment (MONDCSS by default) and from CP control blocks.
– The FCONTROL MONCOLL CPMON DISK command causes Performance Toolkit for VM to read previously saved monitor data.
In both cases, monitor data is collected into the redisplay buffer and analyzed using the performance displays.
� The FCONTROL MONCOLL REDISP command sets the redisplay buffer size.
� The FCONTROL MONCOLL PERFLOG command writes monitor data to disk files. Performance Toolkit for VM can produce two types of monitor data files:
– Simple history files that contain overall system data. These are discussed in 1.8.1, “Simple history data files” on page 15.
– Extended trend files that contain both overall system data and performance data for specific users, processors, channels, and I/O devices. We discuss these in 1.8.2, “Extended trend files” on page 16.
The FCONTROL MONCOLL PERFLOG command enables you to control the start and stop times, and the active days for history data collection. For instance, it is possible to designate history data collection during only first shift (08:00 to 18:00) on weekdays (Monday to Friday).
Collected history data may be analyzed later by Performance Toolkit for VM (as discussed in 2.5, “History data reporting” on page 50). For details about the Performance Toolkit for VM commands for data collection, see the FCONTROL MONCOLL subcommand on page 71.
Note: There is overhead associated with monitor data file collection, and monitor data files require additional DASD space. Save performance data files only if performing in-depth performance analysis. For extended trend files, save data only for users and devices that require detailed analysis.
14 Linux on IBM Eserver zSeries and S/390: Performance Toolkit for VM
1.8.1 Simple history data filesPerformance Toolkit for VM produces two types of simple data files:
� Detailed data files contain one record per monitor sample interval. The files are written to the A disk and are named yyyymmdd HISTLOG using the current date. Up to three generations of performance data are retained (using filetypes HISTLOG, HISTLOG1, and HISTLOG2). Filetypes are automatically renamed and the oldest generation (HISTLOG2) is deleted when a new date is created.
� Summary data files contain the same data fields as detailed data files, but are updated once per hour. The recorded values are computed averages for the one-hour period and written to the ACUM HISTSUM file on the A disk. Summary data is intended for performance trend analysis and capacity planning.
PERFLOG history filesIn addition to HISTLOG and HISTSUM history data files, Performance Toolkit for VM supports the older PERFLOG and PERFHIST history data format:
� PERFLOG files correspond to HISTLOG detailed data files.� PERFHIST files correspond to HISTSUM data files.
The type of history data format that is created is controlled by the FCONTROL SETTINGS HISTFILE command:
� The FCONTROL SETTINGS HISTFILE NEW command generates HISTLOG and HISTSUM history data format files.
� The FCONTROL SETTINGS HISTFILE OLD command generates PERFLOG and PERFSUM history data format files.
� The FCONTROL SETTINGS HISTFILE BOTH command generates both types of history data format files.
We recommend using the new history data format files (HISTLOG and HISTSUM).
Note: PERFLOG and PERFHIST files are constructed exclusively from data in the redisplay buffer. In addition to data in the redisplay buffer, HISTLOG and HISTSUM files are built from by time logs available in real-time mode.
Chapter 1. Performance Toolkit for VM at a glance 15
1.8.2 Extended trend filesIn addition to general system load information, extended trend files contain monitor data with detailed information about specific users, processors, channels, and I/O devices.
The FCONTROL MONCOLL RESET command (discussed in 3.2.2, “The FCONTROL RESET command” on page 76) controls when trend data is collected. In 3.2.4, “Trend data collection” on page 80, we discuss how to generate trend data files.
1.9 Benchmark data analysisFor detailed performance analysis of one or more users and/or I/O devices, use the benchmark feature of Performance Toolkit for VM. Benchmarking generates performance data for specific users or devices. Log files are generated for each benchmarked user and device log. These are updated each monitor interval. (The initial default interval is 60 seconds.)
To keep storage requirements and data collection overhead low, these logs are not automatically generated. To initiate benchmarking, use the FCONTROL BENCHMRK command. (Figure 1-11 on page 17 shows the syntax.) By default, logs are written into volatile storage; data may also be written to DASD.
Note: Extended trend files are similar to Performance Reporting Facility (PRF) trend files; however, Performance Toolkit for VM and PRF trend files cannot be interchanged. In 9.10.2, “Processing historical data” on page 188, we discuss how PRF trend data analysis maps to Performance Toolkit for VM functions.
16 Linux on IBM Eserver zSeries and S/390: Performance Toolkit for VM
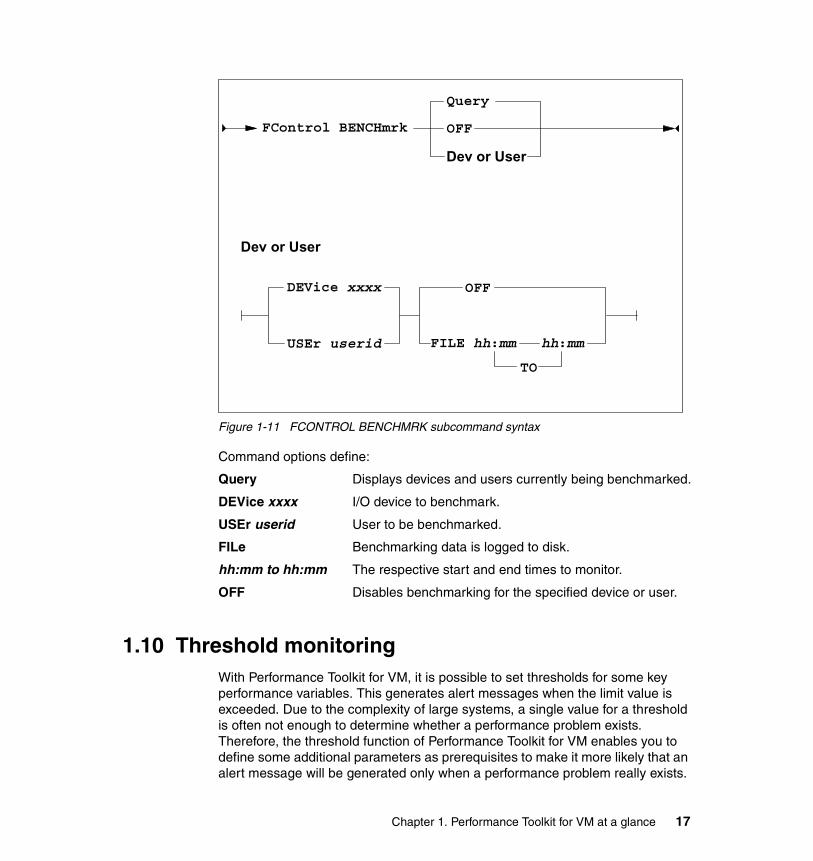
Figure 1-11 FCONTROL BENCHMRK subcommand syntax
Command options define:
Query Displays devices and users currently being benchmarked.
DEVice xxxx I/O device to benchmark.
USEr userid User to be benchmarked.
FILe Benchmarking data is logged to disk.
hh:mm to hh:mm The respective start and end times to monitor.
OFF Disables benchmarking for the specified device or user.
1.10 Threshold monitoringWith Performance Toolkit for VM, it is possible to set thresholds for some key performance variables. This generates alert messages when the limit value is exceeded. Due to the complexity of large systems, a single value for a threshold is often not enough to determine whether a performance problem exists. Therefore, the threshold function of Performance Toolkit for VM enables you to define some additional parameters as prerequisites to make it more likely that an alert message will be generated only when a performance problem really exists.
FControl BENCHmrk
Query
OFF
Dev or User
Dev or User
DEVice xxxx
USEr userid FILE hh:mm hh:mm
TO
OFF
Chapter 1. Performance Toolkit for VM at a glance 17
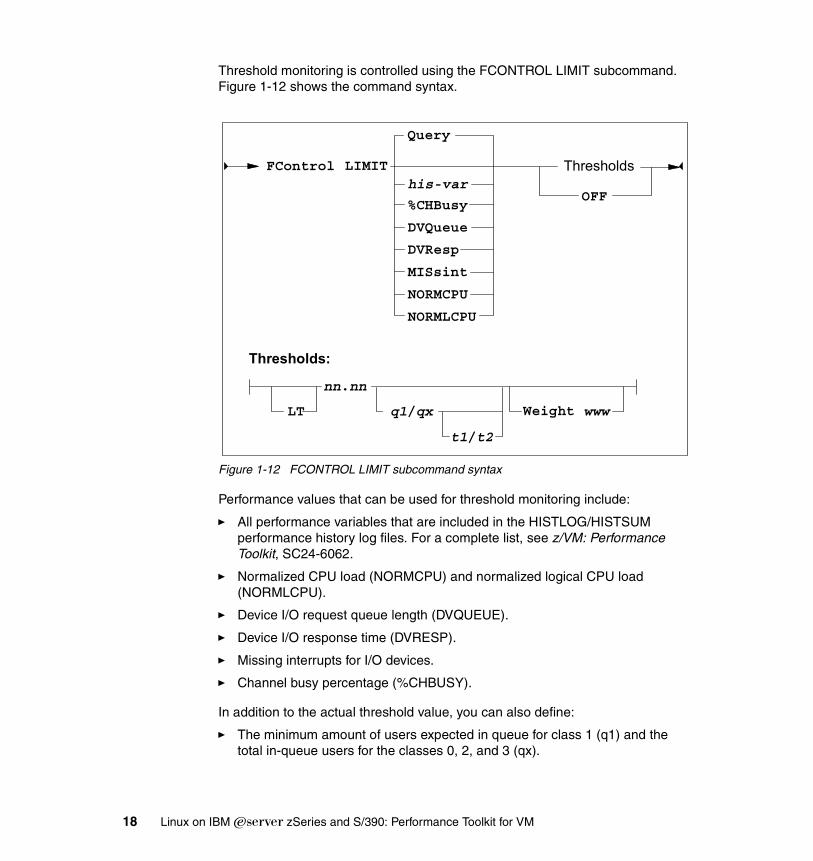
Threshold monitoring is controlled using the FCONTROL LIMIT subcommand. Figure 1-12 shows the command syntax.
Figure 1-12 FCONTROL LIMIT subcommand syntax
Performance values that can be used for threshold monitoring include:
� All performance variables that are included in the HISTLOG/HISTSUM performance history log files. For a complete list, see z/VM: Performance Toolkit, SC24-6062.
� Normalized CPU load (NORMCPU) and normalized logical CPU load (NORMLCPU).
� Device I/O request queue length (DVQUEUE).
� Device I/O response time (DVRESP).
� Missing interrupts for I/O devices.
� Channel busy percentage (%CHBUSY).
In addition to the actual threshold value, you can also define:
� The minimum amount of users expected in queue for class 1 (q1) and the total in-queue users for the classes 0, 2, and 3 (qx).
Query
his-var
%CHBusy
DVQueue
DVResp
MISsint
NORMCPU
NORMLCPU
OFF
FControl LIMIT Thresholds
Thresholds:
nn.nn
t1/t2
LT q1/qx Weight www
18 Linux on IBM Eserver zSeries and S/390: Performance Toolkit for VM
� The time period in minutes that a problem must exist before a message is generated. You can specify a time interval use to repeat the message if the problem still exists.
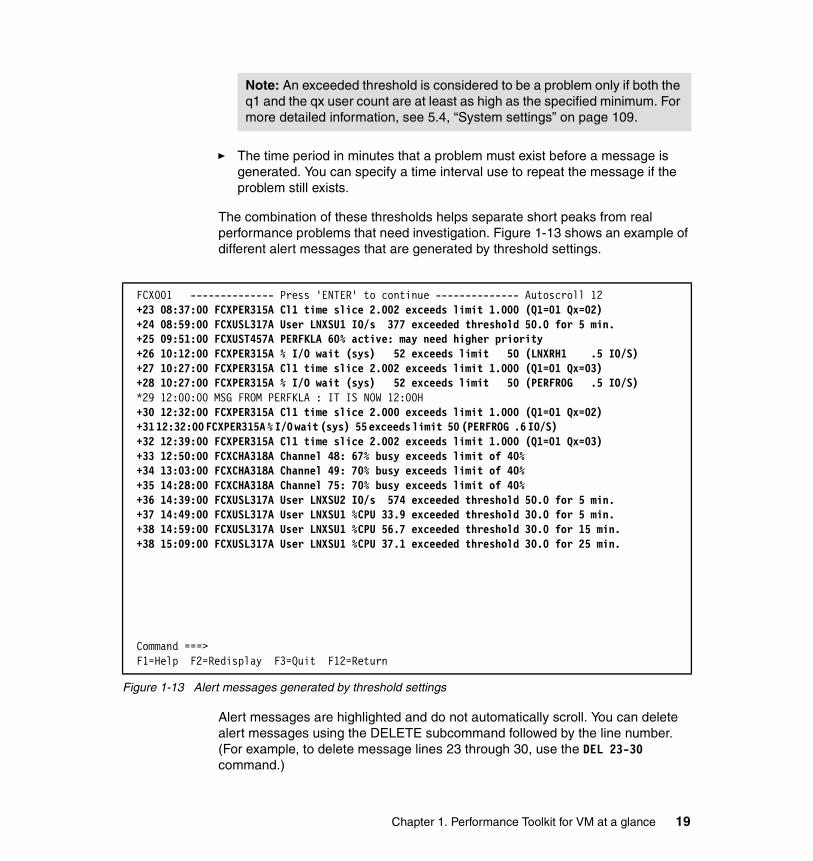
The combination of these thresholds helps separate short peaks from real performance problems that need investigation. Figure 1-13 shows an example of different alert messages that are generated by threshold settings.
Figure 1-13 Alert messages generated by threshold settings
Alert messages are highlighted and do not automatically scroll. You can delete alert messages using the DELETE subcommand followed by the line number. (For example, to delete message lines 23 through 30, use the DEL 23-30 command.)
Note: An exceeded threshold is considered to be a problem only if both the q1 and the qx user count are at least as high as the specified minimum. For more detailed information, see 5.4, “System settings” on page 109.
FCX001 -------------- Press 'ENTER' to continue -------------- Autoscroll 12 +23 08:37:00 FCXPER315A Cl1 time slice 2.002 exceeds limit 1.000 (Q1=01 Qx=02) +24 08:59:00 FCXUSL317A User LNXSU1 IO/s 377 exceeded threshold 50.0 for 5 min. +25 09:51:00 FCXUST457A PERFKLA 60% active: may need higher priority +26 10:12:00 FCXPER315A % I/O wait (sys) 52 exceeds limit 50 (LNXRH1 .5 IO/S) +27 10:27:00 FCXPER315A Cl1 time slice 2.002 exceeds limit 1.000 (Q1=01 Qx=03) +28 10:27:00 FCXPER315A % I/O wait (sys) 52 exceeds limit 50 (PERFROG .5 IO/S) *29 12:00:00 MSG FROM PERFKLA : IT IS NOW 12:00H +30 12:32:00 FCXPER315A Cl1 time slice 2.000 exceeds limit 1.000 (Q1=01 Qx=02) +31 12:32:00 FCXPER315A % I/O wait (sys) 55 exceeds limit 50 (PERFROG .6 IO/S) +32 12:39:00 FCXPER315A Cl1 time slice 2.002 exceeds limit 1.000 (Q1=01 Qx=03) +33 12:50:00 FCXCHA318A Channel 48: 67% busy exceeds limit of 40% +34 13:03:00 FCXCHA318A Channel 49: 70% busy exceeds limit of 40% +35 14:28:00 FCXCHA318A Channel 75: 70% busy exceeds limit of 40% +36 14:39:00 FCXUSL317A User LNXSU2 IO/s 574 exceeded threshold 50.0 for 5 min. +37 14:49:00 FCXUSL317A User LNXSU1 %CPU 33.9 exceeded threshold 30.0 for 5 min. +38 14:59:00 FCXUSL317A User LNXSU1 %CPU 56.7 exceeded threshold 30.0 for 15 min. +38 15:09:00 FCXUSL317A User LNXSU1 %CPU 37.1 exceeded threshold 30.0 for 25 min.
Command ===> F1=Help F2=Redisplay F3=Quit F12=Return
Chapter 1. Performance Toolkit for VM at a glance 19
1.11 Variable correlation coefficient analysisWith Performance Toolkit for VM, it is possible to measure how one or more performance measurements change relative to a base measurement over time. This feature is referred to as variable correlation coefficients. Analysis is performed using performance data saved in HISTLOG and HISTSUM history files.
1.12 When to use Performance Toolkit for VMYou should run Performance Toolkit for VM as part of your normal running system configuration. There are a number of advantages in doing this:
� You can perform real-time monitoring of system performance with the ability to monitor individual virtual machines or system resources.
� You can set up automated processes to be invoked (such as application programs and REXX execs) based on events such as when thresholds set in FCONX $PROFILE are being exceeded.
� By enabling the collection of history data in FCONX $PROFILE, you can perform trend analysis and capacity planning.
1.12.1 Performance Toolkit for VM overheadGenerally, running Performance Toolkit for VM for real-time system monitoring results in very low system overhead. The CPU load for normal data collection with the default interval of 60 seconds will be considerably less than 1% of total CPU capacity (typically 0.1% to 0.2% on a system with 1000 users).
The actual CPU load that is generated by the Performance Toolkit for VM will vary depending on:
� The system environment being monitored (for example, the I/O configuration and number of monitored virtual machines)
� The monitor domains that have been enabled
� The time interval between monitor samples
Monitor domainsIf CP monitor data collection has been enabled, Performance Toolkit for VM will collect all the data it can use. This can cause a considerable load if you have enabled EVENT data for all users on a large system. Records will be generated by CP and collected by Performance Toolkit for VM for each user transaction. The same is true when enabling EVENT SEEKS data for many disks. A large
20 Linux on IBM Eserver zSeries and S/390: Performance Toolkit for VM
number of monitor records will be generated (one record for each disk I/O operation), and all of these records will have to be processed by Performance Toolkit for VM.
Frequency of data collectionThe monitor SAMPLE interval is used for all of the permanently collected data. Performance Toolkit for VM also uses this sample interval when collecting data from CP control blocks. The default interval is 60 seconds, but you can change it to a shorter or longer period. Setting a longer interval will reduce the data collection overhead for both CP and Performance Toolkit for VM, while setting a shorter interval will increase it. When viewing one of the detailed displays for users, I/O devices, or storage devices, you can force a new calculation of performance data by pressing the Enter key. Forcing calculations repeatedly over a short period of time will result in a proportional increase in the data collection overhead for the selected display.
Chapter 1. Performance Toolkit for VM at a glance 21

22 Linux on IBM Eserver zSeries and S/390: Performance Toolkit for VM
Chapter 2. Navigating through Performance Toolkit for VM
In this chapter, we discuss navigate through Performance Toolkit for VM and introduce some of the major monitoring screens. Topics that are covered include:
� Information available in Performance Toolkit for VM
� General system data reporting
� I/O data reporting
� User data reporting
� History data reporting
� User-defined screens
� Using the Web interface
2
© Copyright IBM Corp. 2004. All rights reserved. 23
2.1 Information available in Performance Toolkit for VMPerformance Toolkit for VM reports information on system behavior, performance, and configuration. Data reports are grouped into screens for:
� General system data reporting� I/O data reporting� User data reporting� History data reporting� User-defined screens
2.2 General system data reportingFigure 2-1 on page 25 shows the group of general system data screens.
24 Linux on IBM Eserver zSeries and S/390: Performance Toolkit for VM
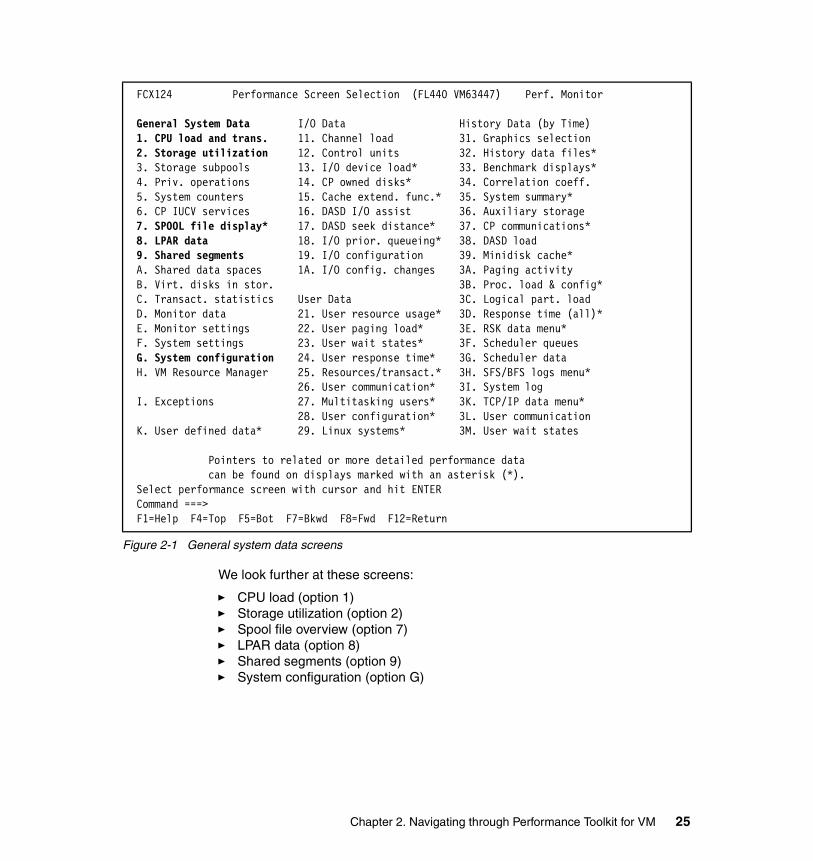
Figure 2-1 General system data screens
We look further at these screens:
� CPU load (option 1)� Storage utilization (option 2)� Spool file overview (option 7)� LPAR data (option 8)� Shared segments (option 9) � System configuration (option G)
FCX124 Performance Screen Selection (FL440 VM63447) Perf. Monitor General System Data I/O Data History Data (by Time) 1. CPU load and trans. 11. Channel load 31. Graphics selection 2. Storage utilization 12. Control units 32. History data files* 3. Storage subpools 13. I/O device load* 33. Benchmark displays* 4. Priv. operations 14. CP owned disks* 34. Correlation coeff. 5. System counters 15. Cache extend. func.* 35. System summary* 6. CP IUCV services 16. DASD I/O assist 36. Auxiliary storage 7. SPOOL file display* 17. DASD seek distance* 37. CP communications* 8. LPAR data 18. I/O prior. queueing* 38. DASD load 9. Shared segments 19. I/O configuration 39. Minidisk cache* A. Shared data spaces 1A. I/O config. changes 3A. Paging activity B. Virt. disks in stor. 3B. Proc. load & config* C. Transact. statistics User Data 3C. Logical part. load D. Monitor data 21. User resource usage* 3D. Response time (all)* E. Monitor settings 22. User paging load* 3E. RSK data menu* F. System settings 23. User wait states* 3F. Scheduler queues G. System configuration 24. User response time* 3G. Scheduler data H. VM Resource Manager 25. Resources/transact.* 3H. SFS/BFS logs menu* 26. User communication* 3I. System log I. Exceptions 27. Multitasking users* 3K. TCP/IP data menu* 28. User configuration* 3L. User communication K. User defined data* 29. Linux systems* 3M. User wait states Pointers to related or more detailed performance data can be found on displays marked with an asterisk (*). Select performance screen with cursor and hit ENTER Command ===> F1=Help F4=Top F5=Bot F7=Bkwd F8=Fwd F12=Return
Chapter 2. Navigating through Performance Toolkit for VM 25
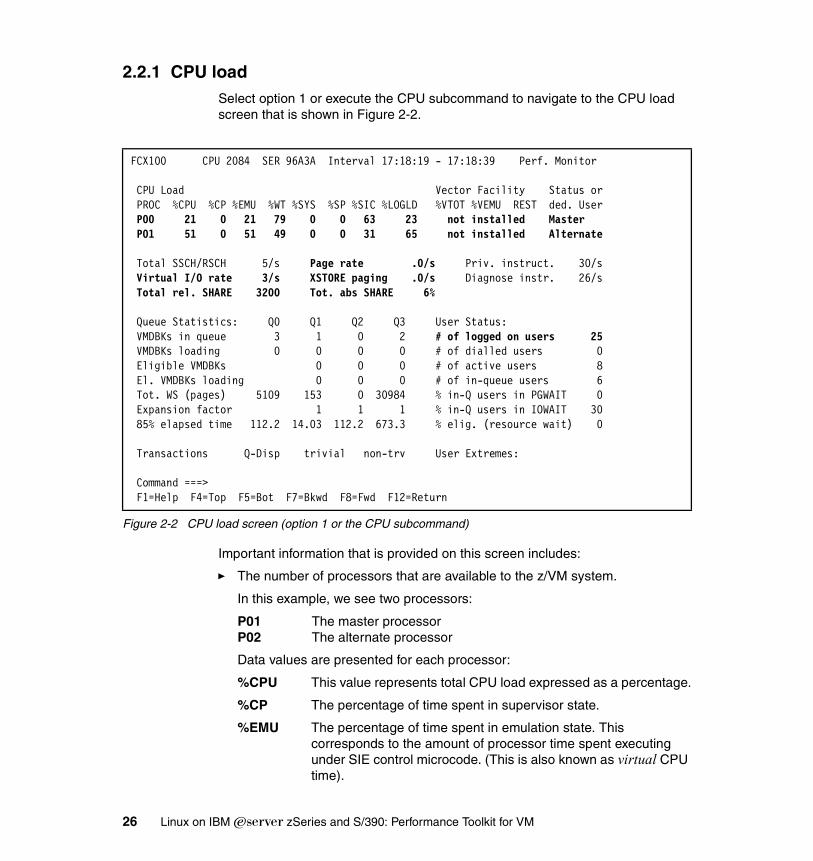
2.2.1 CPU loadSelect option 1 or execute the CPU subcommand to navigate to the CPU load screen that is shown in Figure 2-2.
Figure 2-2 CPU load screen (option 1 or the CPU subcommand)
Important information that is provided on this screen includes:
� The number of processors that are available to the z/VM system.
In this example, we see two processors:
P01 The master processorP02 The alternate processor
Data values are presented for each processor:
%CPU This value represents total CPU load expressed as a percentage.
%CP The percentage of time spent in supervisor state.
%EMU The percentage of time spent in emulation state. This corresponds to the amount of processor time spent executing under SIE control microcode. (This is also known as virtual CPU time).
FCX100 CPU 2084 SER 96A3A Interval 17:18:19 - 17:18:39 Perf. Monitor CPU Load Vector Facility Status or PROC %CPU %CP %EMU %WT %SYS %SP %SIC %LOGLD %VTOT %VEMU REST ded. User P00 21 0 21 79 0 0 63 23 not installed Master P01 51 0 51 49 0 0 31 65 not installed Alternate Total SSCH/RSCH 5/s Page rate .0/s Priv. instruct. 30/s Virtual I/O rate 3/s XSTORE paging .0/s Diagnose instr. 26/s Total rel. SHARE 3200 Tot. abs SHARE 6% Queue Statistics: Q0 Q1 Q2 Q3 User Status: VMDBKs in queue 3 1 0 2 # of logged on users 25 VMDBKs loading 0 0 0 0 # of dialled users 0 Eligible VMDBKs 0 0 0 # of active users 8 El. VMDBKs loading 0 0 0 # of in-queue users 6 Tot. WS (pages) 5109 153 0 30984 % in-Q users in PGWAIT 0 Expansion factor 1 1 1 % in-Q users in IOWAIT 30 85% elapsed time 112.2 14.03 112.2 673.3 % elig. (resource wait) 0 Transactions Q-Disp trivial non-trv User Extremes: Command ===> F1=Help F4=Top F5=Bot F7=Bkwd F8=Fwd F12=Return
26 Linux on IBM Eserver zSeries and S/390: Performance Toolkit for VM
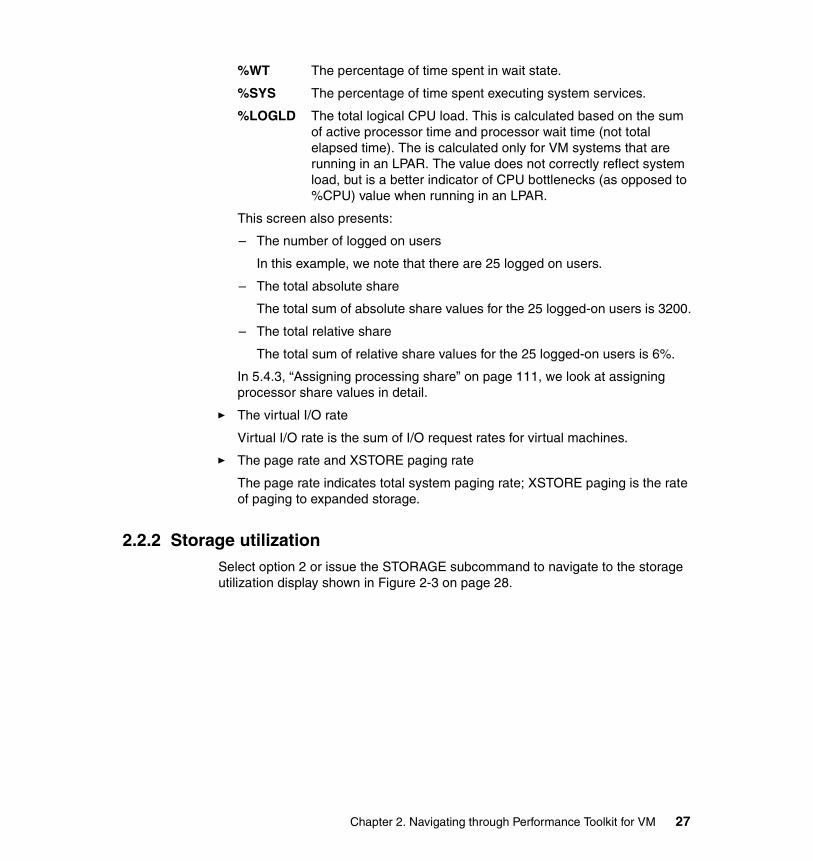
%WT The percentage of time spent in wait state.
%SYS The percentage of time spent executing system services.
%LOGLD The total logical CPU load. This is calculated based on the sum of active processor time and processor wait time (not total elapsed time). The is calculated only for VM systems that are running in an LPAR. The value does not correctly reflect system load, but is a better indicator of CPU bottlenecks (as opposed to %CPU) value when running in an LPAR.
This screen also presents:
– The number of logged on users
In this example, we note that there are 25 logged on users.
– The total absolute share
The total sum of absolute share values for the 25 logged-on users is 3200.
– The total relative share
The total sum of relative share values for the 25 logged-on users is 6%.
In 5.4.3, “Assigning processing share” on page 111, we look at assigning processor share values in detail.
� The virtual I/O rate
Virtual I/O rate is the sum of I/O request rates for virtual machines.
� The page rate and XSTORE paging rate
The page rate indicates total system paging rate; XSTORE paging is the rate of paging to expanded storage.
2.2.2 Storage utilizationSelect option 2 or issue the STORAGE subcommand to navigate to the storage utilization display shown in Figure 2-3 on page 28.
Chapter 2. Navigating through Performance Toolkit for VM 27
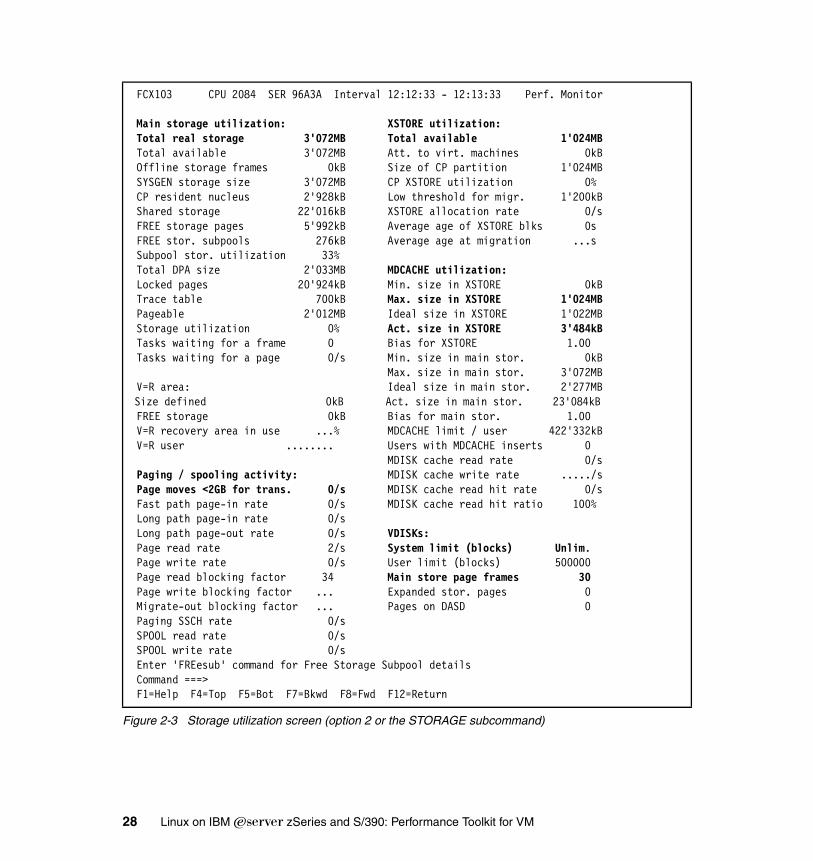
Figure 2-3 Storage utilization screen (option 2 or the STORAGE subcommand)
FCX103 CPU 2084 SER 96A3A Interval 12:12:33 - 12:13:33 Perf. Monitor Main storage utilization: XSTORE utilization: Total real storage 3'072MB Total available 1'024MB Total available 3'072MB Att. to virt. machines 0kB Offline storage frames 0kB Size of CP partition 1'024MB SYSGEN storage size 3'072MB CP XSTORE utilization 0% CP resident nucleus 2'928kB Low threshold for migr. 1'200kB Shared storage 22'016kB XSTORE allocation rate 0/s FREE storage pages 5'992kB Average age of XSTORE blks 0s FREE stor. subpools 276kB Average age at migration ...s Subpool stor. utilization 33% Total DPA size 2'033MB MDCACHE utilization: Locked pages 20'924kB Min. size in XSTORE 0kB Trace table 700kB Max. size in XSTORE 1'024MB Pageable 2'012MB Ideal size in XSTORE 1'022MB Storage utilization 0% Act. size in XSTORE 3'484kB Tasks waiting for a frame 0 Bias for XSTORE 1.00 Tasks waiting for a page 0/s Min. size in main stor. 0kB Max. size in main stor. 3'072MB V=R area: Ideal size in main stor. 2'277MB Size defined 0kB Act. size in main stor. 23'084kB FREE storage 0kB Bias for main stor. 1.00 V=R recovery area in use ...% MDCACHE limit / user 422'332kB V=R user ........ Users with MDCACHE inserts 0 MDISK cache read rate 0/s Paging / spooling activity: MDISK cache write rate ...../s Page moves <2GB for trans. 0/s MDISK cache read hit rate 0/s Fast path page-in rate 0/s MDISK cache read hit ratio 100% Long path page-in rate 0/s Long path page-out rate 0/s VDISKs: Page read rate 2/s System limit (blocks) Unlim. Page write rate 0/s User limit (blocks) 500000 Page read blocking factor 34 Main store page frames 30 Page write blocking factor ... Expanded stor. pages 0 Migrate-out blocking factor ... Pages on DASD 0 Paging SSCH rate 0/s SPOOL read rate 0/s SPOOL write rate 0/s Enter 'FREesub' command for Free Storage Subpool details Command ===> F1=Help F4=Top F5=Bot F7=Bkwd F8=Fwd F12=Return
28 Linux on IBM Eserver zSeries and S/390: Performance Toolkit for VM
This screen provides information about:
� Main storage utilization
In this example, 3 GB (3,072 MB) of main storage is defined to VM.
� Expanded storage (XSTORE) utilization
The system has 1 GB (1,024 MB) of expanded storage defined.
� Minidisk cache (MDCACHE) utilization
The maximum size of the minidisk cache is defined as 1 GB (1,024 MB). The actual size of the minidisk cache is 3 MB (3,484 KB).
� Paging and spooling activity
The Page moves <2GB for trans. value indicates the rate at which main storage pages are moved below the 2 GB line for translation.
� VDISK usage
In this example, 30 main storage page frames are used by virtual disks. We look at VDISKs further in 5.11, “Virtual disks in storage” on page 123.
Note: The apostrophe character (‘) is used as punctuation between digits.
Note: Pages must move below the 2 GB line when I/O operations are performed on data residing on the page.
Chapter 2. Navigating through Performance Toolkit for VM 29
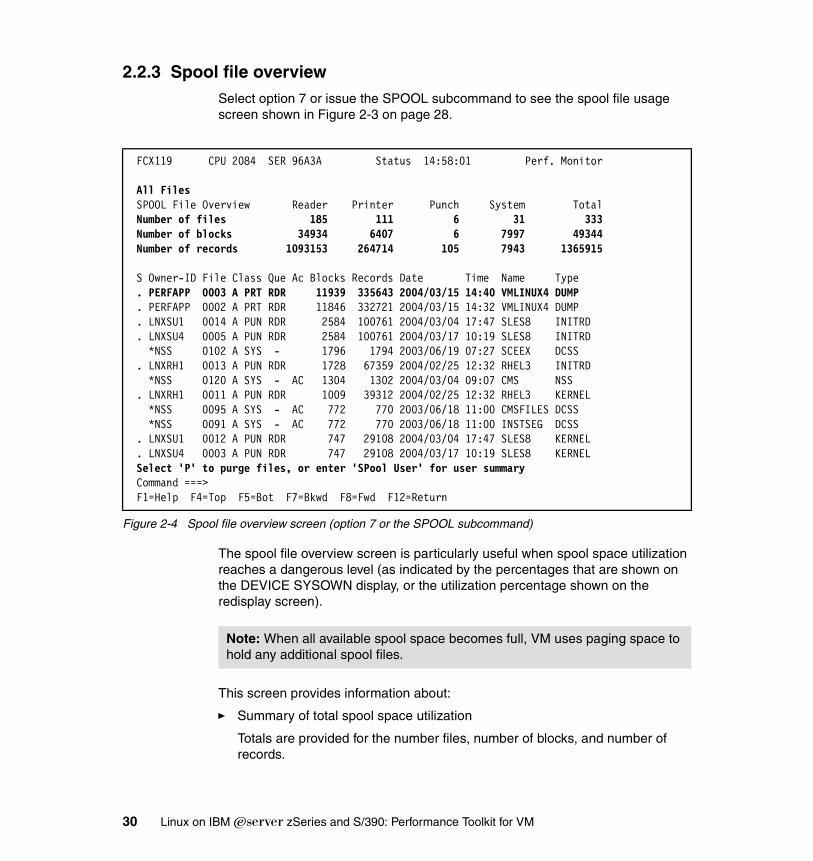
2.2.3 Spool file overviewSelect option 7 or issue the SPOOL subcommand to see the spool file usage screen shown in Figure 2-3 on page 28.
Figure 2-4 Spool file overview screen (option 7 or the SPOOL subcommand)
The spool file overview screen is particularly useful when spool space utilization reaches a dangerous level (as indicated by the percentages that are shown on the DEVICE SYSOWN display, or the utilization percentage shown on the redisplay screen).
This screen provides information about:
� Summary of total spool space utilization
Totals are provided for the number files, number of blocks, and number of records.
FCX119 CPU 2084 SER 96A3A Status 14:58:01 Perf. Monitor All Files SPOOL File Overview Reader Printer Punch System Total Number of files 185 111 6 31 333 Number of blocks 34934 6407 6 7997 49344 Number of records 1093153 264714 105 7943 1365915 S Owner-ID File Class Que Ac Blocks Records Date Time Name Type . PERFAPP 0003 A PRT RDR 11939 335643 2004/03/15 14:40 VMLINUX4 DUMP . PERFAPP 0002 A PRT RDR 11846 332721 2004/03/15 14:32 VMLINUX4 DUMP . LNXSU1 0014 A PUN RDR 2584 100761 2004/03/04 17:47 SLES8 INITRD . LNXSU4 0005 A PUN RDR 2584 100761 2004/03/17 10:19 SLES8 INITRD *NSS 0102 A SYS - 1796 1794 2003/06/19 07:27 SCEEX DCSS . LNXRH1 0013 A PUN RDR 1728 67359 2004/02/25 12:32 RHEL3 INITRD *NSS 0120 A SYS - AC 1304 1302 2004/03/04 09:07 CMS NSS . LNXRH1 0011 A PUN RDR 1009 39312 2004/02/25 12:32 RHEL3 KERNEL *NSS 0095 A SYS - AC 772 770 2003/06/18 11:00 CMSFILES DCSS *NSS 0091 A SYS - AC 772 770 2003/06/18 11:00 INSTSEG DCSS . LNXSU1 0012 A PUN RDR 747 29108 2004/03/04 17:47 SLES8 KERNEL . LNXSU4 0003 A PUN RDR 747 29108 2004/03/17 10:19 SLES8 KERNEL Select 'P' to purge files, or enter 'SPool User' for user summary Command ===> F1=Help F4=Top F5=Bot F7=Bkwd F8=Fwd F12=Return
Note: When all available spool space becomes full, VM uses paging space to hold any additional spool files.
30 Linux on IBM Eserver zSeries and S/390: Performance Toolkit for VM
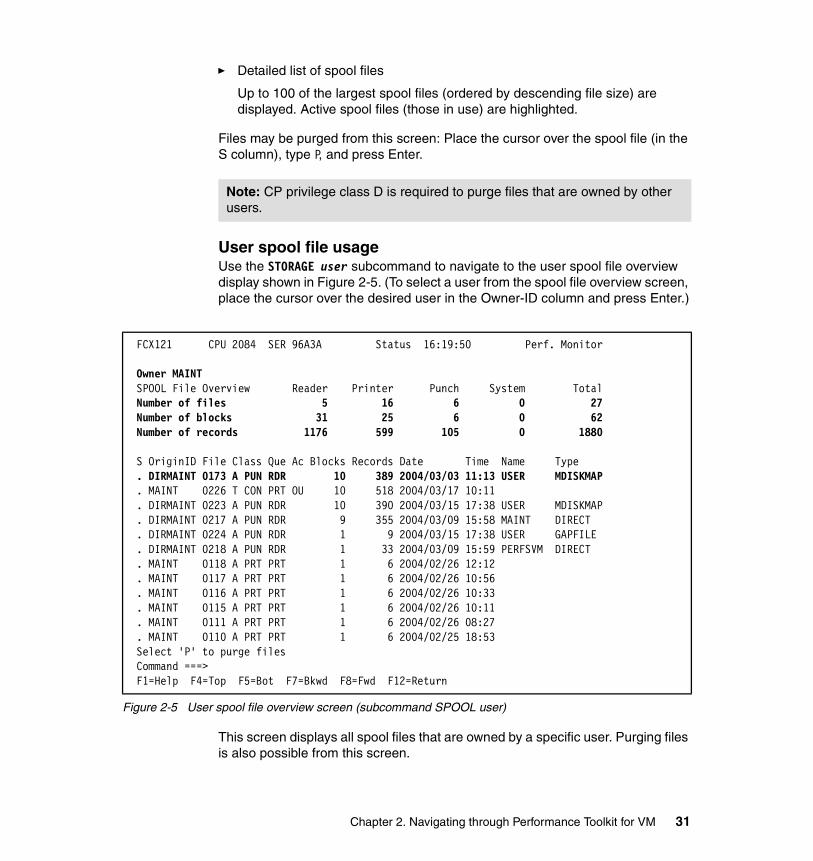
� Detailed list of spool files
Up to 100 of the largest spool files (ordered by descending file size) are displayed. Active spool files (those in use) are highlighted.
Files may be purged from this screen: Place the cursor over the spool file (in the S column), type P, and press Enter.
User spool file usageUse the STORAGE user subcommand to navigate to the user spool file overview display shown in Figure 2-5. (To select a user from the spool file overview screen, place the cursor over the desired user in the Owner-ID column and press Enter.)
Figure 2-5 User spool file overview screen (subcommand SPOOL user)
This screen displays all spool files that are owned by a specific user. Purging files is also possible from this screen.
Note: CP privilege class D is required to purge files that are owned by other users.
FCX121 CPU 2084 SER 96A3A Status 16:19:50 Perf. Monitor Owner MAINT SPOOL File Overview Reader Printer Punch System Total Number of files 5 16 6 0 27 Number of blocks 31 25 6 0 62 Number of records 1176 599 105 0 1880 S OriginID File Class Que Ac Blocks Records Date Time Name Type . DIRMAINT 0173 A PUN RDR 10 389 2004/03/03 11:13 USER MDISKMAP . MAINT 0226 T CON PRT OU 10 518 2004/03/17 10:11 . DIRMAINT 0223 A PUN RDR 10 390 2004/03/15 17:38 USER MDISKMAP . DIRMAINT 0217 A PUN RDR 9 355 2004/03/09 15:58 MAINT DIRECT . DIRMAINT 0224 A PUN RDR 1 9 2004/03/15 17:38 USER GAPFILE . DIRMAINT 0218 A PUN RDR 1 33 2004/03/09 15:59 PERFSVM DIRECT . MAINT 0118 A PRT PRT 1 6 2004/02/26 12:12 . MAINT 0117 A PRT PRT 1 6 2004/02/26 10:56 . MAINT 0116 A PRT PRT 1 6 2004/02/26 10:33 . MAINT 0115 A PRT PRT 1 6 2004/02/26 10:11 . MAINT 0111 A PRT PRT 1 6 2004/02/26 08:27 . MAINT 0110 A PRT PRT 1 6 2004/02/25 18:53 Select 'P' to purge files Command ===> F1=Help F4=Top F5=Bot F7=Bkwd F8=Fwd F12=Return
Chapter 2. Navigating through Performance Toolkit for VM 31
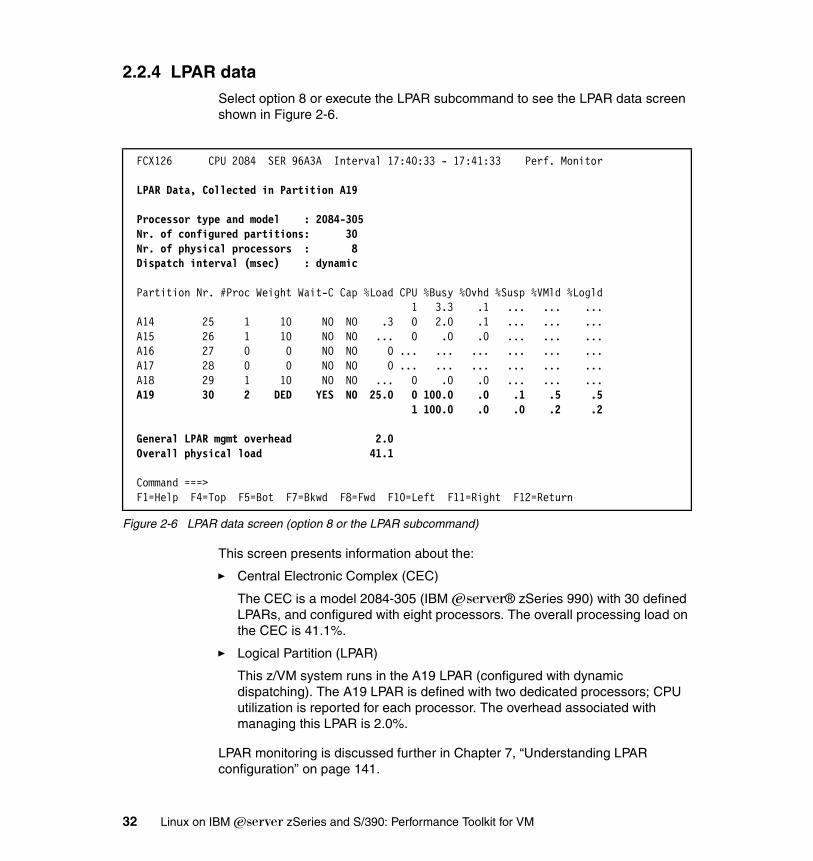
2.2.4 LPAR dataSelect option 8 or execute the LPAR subcommand to see the LPAR data screen shown in Figure 2-6.
Figure 2-6 LPAR data screen (option 8 or the LPAR subcommand)
This screen presents information about the:
� Central Electronic Complex (CEC)
The CEC is a model 2084-305 (IBM ^® zSeries 990) with 30 defined LPARs, and configured with eight processors. The overall processing load on the CEC is 41.1%.
� Logical Partition (LPAR)
This z/VM system runs in the A19 LPAR (configured with dynamic dispatching). The A19 LPAR is defined with two dedicated processors; CPU utilization is reported for each processor. The overhead associated with managing this LPAR is 2.0%.
LPAR monitoring is discussed further in Chapter 7, “Understanding LPAR configuration” on page 141.
FCX126 CPU 2084 SER 96A3A Interval 17:40:33 - 17:41:33 Perf. Monitor LPAR Data, Collected in Partition A19 Processor type and model : 2084-305 Nr. of configured partitions: 30 Nr. of physical processors : 8 Dispatch interval (msec) : dynamic Partition Nr. #Proc Weight Wait-C Cap %Load CPU %Busy %Ovhd %Susp %VMld %Logld 1 3.3 .1 ... ... ... A14 25 1 10 NO NO .3 0 2.0 .1 ... ... ... A15 26 1 10 NO NO ... 0 .0 .0 ... ... ... A16 27 0 0 NO NO 0 ... ... ... ... ... ... A17 28 0 0 NO NO 0 ... ... ... ... ... ... A18 29 1 10 NO NO ... 0 .0 .0 ... ... ... A19 30 2 DED YES NO 25.0 0 100.0 .0 .1 .5 .5 1 100.0 .0 .0 .2 .2 General LPAR mgmt overhead 2.0 Overall physical load 41.1 Command ===> F1=Help F4=Top F5=Bot F7=Bkwd F8=Fwd F10=Left F11=Right F12=Return
32 Linux on IBM Eserver zSeries and S/390: Performance Toolkit for VM
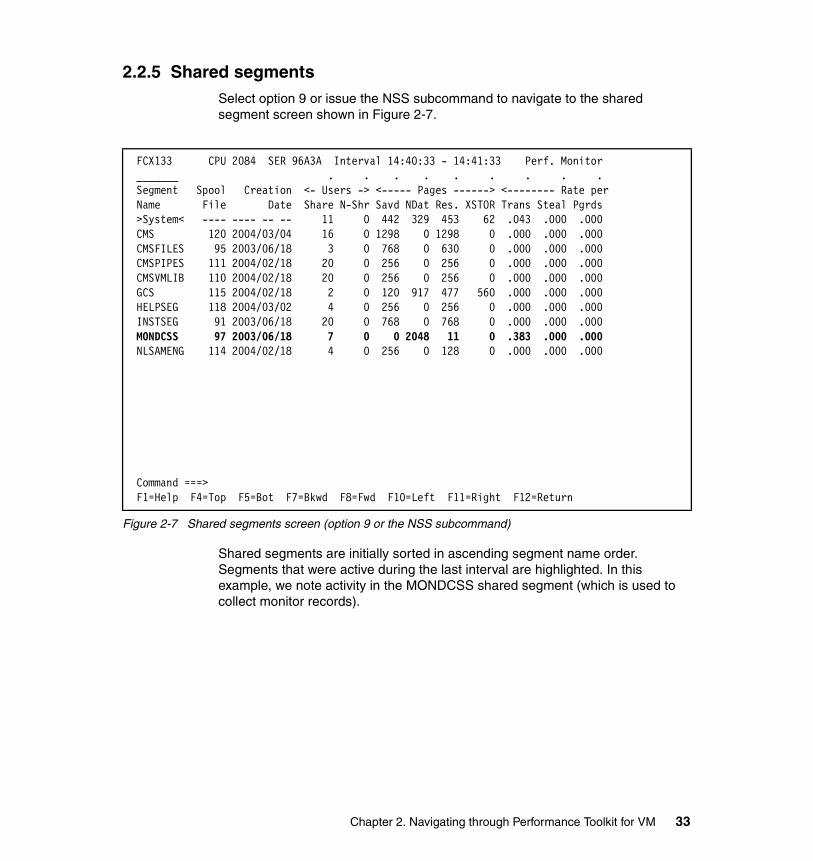
2.2.5 Shared segmentsSelect option 9 or issue the NSS subcommand to navigate to the shared segment screen shown in Figure 2-7.
Figure 2-7 Shared segments screen (option 9 or the NSS subcommand)
Shared segments are initially sorted in ascending segment name order. Segments that were active during the last interval are highlighted. In this example, we note activity in the MONDCSS shared segment (which is used to collect monitor records).
FCX133 CPU 2084 SER 96A3A Interval 14:40:33 - 14:41:33 Perf. Monitor _______ . . . . . . . . . Segment Spool Creation <- Users -> <----- Pages ------> <-------- Rate per Name File Date Share N-Shr Savd NDat Res. XSTOR Trans Steal Pgrds >System< ---- ---- -- -- 11 0 442 329 453 62 .043 .000 .000 CMS 120 2004/03/04 16 0 1298 0 1298 0 .000 .000 .000 CMSFILES 95 2003/06/18 3 0 768 0 630 0 .000 .000 .000 CMSPIPES 111 2004/02/18 20 0 256 0 256 0 .000 .000 .000 CMSVMLIB 110 2004/02/18 20 0 256 0 256 0 .000 .000 .000 GCS 115 2004/02/18 2 0 120 917 477 560 .000 .000 .000 HELPSEG 118 2004/03/02 4 0 256 0 256 0 .000 .000 .000 INSTSEG 91 2003/06/18 20 0 768 0 768 0 .000 .000 .000 MONDCSS 97 2003/06/18 7 0 0 2048 11 0 .383 .000 .000 NLSAMENG 114 2004/02/18 4 0 256 0 128 0 .000 .000 .000 Command ===> F1=Help F4=Top F5=Bot F7=Bkwd F8=Fwd F10=Left F11=Right F12=Return
Chapter 2. Navigating through Performance Toolkit for VM 33
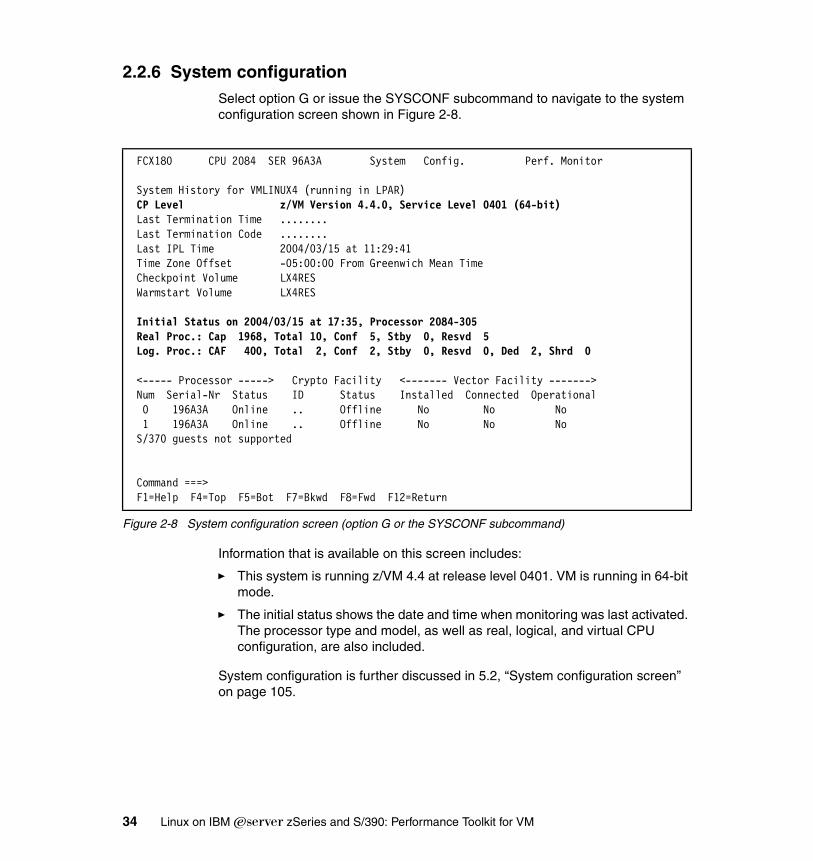
2.2.6 System configurationSelect option G or issue the SYSCONF subcommand to navigate to the system configuration screen shown in Figure 2-8.
Figure 2-8 System configuration screen (option G or the SYSCONF subcommand)
Information that is available on this screen includes:
� This system is running z/VM 4.4 at release level 0401. VM is running in 64-bit mode.
� The initial status shows the date and time when monitoring was last activated. The processor type and model, as well as real, logical, and virtual CPU configuration, are also included.
System configuration is further discussed in 5.2, “System configuration screen” on page 105.
FCX180 CPU 2084 SER 96A3A System Config. Perf. Monitor System History for VMLINUX4 (running in LPAR) CP Level z/VM Version 4.4.0, Service Level 0401 (64-bit) Last Termination Time ........ Last Termination Code ........ Last IPL Time 2004/03/15 at 11:29:41 Time Zone Offset -05:00:00 From Greenwich Mean Time Checkpoint Volume LX4RES Warmstart Volume LX4RES Initial Status on 2004/03/15 at 17:35, Processor 2084-305 Real Proc.: Cap 1968, Total 10, Conf 5, Stby 0, Resvd 5 Log. Proc.: CAF 400, Total 2, Conf 2, Stby 0, Resvd 0, Ded 2, Shrd 0 <----- Processor -----> Crypto Facility <------- Vector Facility -------> Num Serial-Nr Status ID Status Installed Connected Operational 0 196A3A Online .. Offline No No No 1 196A3A Online .. Offline No No No S/370 guests not supported Command ===> F1=Help F4=Top F5=Bot F7=Bkwd F8=Fwd F12=Return
34 Linux on IBM Eserver zSeries and S/390: Performance Toolkit for VM
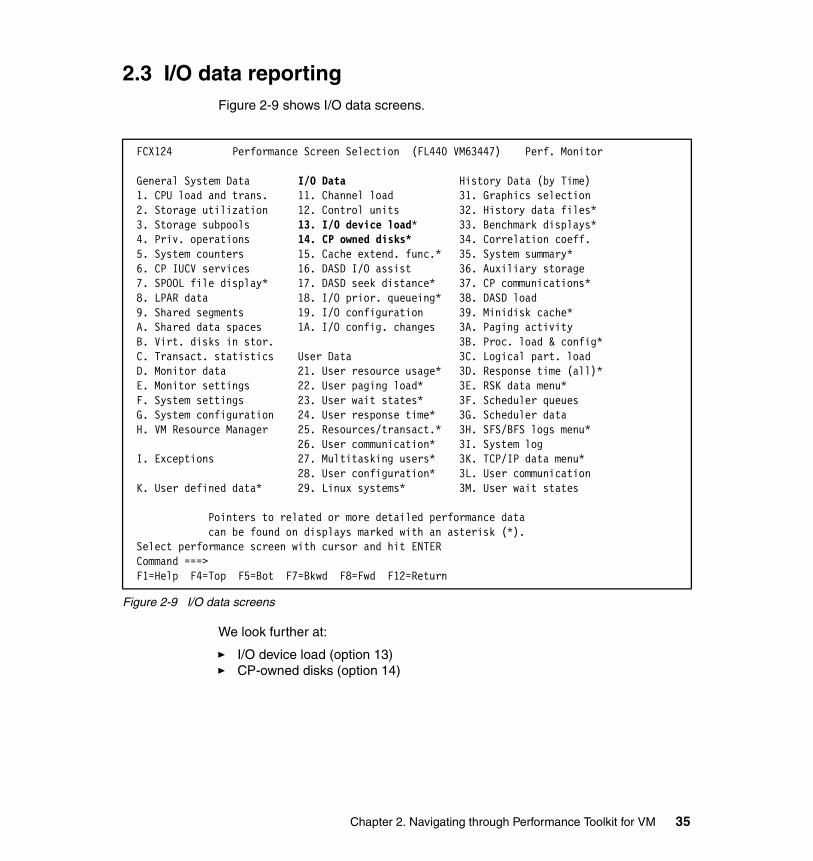
2.3 I/O data reportingFigure 2-9 shows I/O data screens.
Figure 2-9 I/O data screens
We look further at:
� I/O device load (option 13) � CP-owned disks (option 14)
FCX124 Performance Screen Selection (FL440 VM63447) Perf. Monitor General System Data I/O Data History Data (by Time) 1. CPU load and trans. 11. Channel load 31. Graphics selection 2. Storage utilization 12. Control units 32. History data files* 3. Storage subpools 13. I/O device load* 33. Benchmark displays* 4. Priv. operations 14. CP owned disks* 34. Correlation coeff. 5. System counters 15. Cache extend. func.* 35. System summary* 6. CP IUCV services 16. DASD I/O assist 36. Auxiliary storage 7. SPOOL file display* 17. DASD seek distance* 37. CP communications* 8. LPAR data 18. I/O prior. queueing* 38. DASD load 9. Shared segments 19. I/O configuration 39. Minidisk cache* A. Shared data spaces 1A. I/O config. changes 3A. Paging activity B. Virt. disks in stor. 3B. Proc. load & config* C. Transact. statistics User Data 3C. Logical part. load D. Monitor data 21. User resource usage* 3D. Response time (all)* E. Monitor settings 22. User paging load* 3E. RSK data menu* F. System settings 23. User wait states* 3F. Scheduler queues G. System configuration 24. User response time* 3G. Scheduler data H. VM Resource Manager 25. Resources/transact.* 3H. SFS/BFS logs menu* 26. User communication* 3I. System log I. Exceptions 27. Multitasking users* 3K. TCP/IP data menu* 28. User configuration* 3L. User communication K. User defined data* 29. Linux systems* 3M. User wait states Pointers to related or more detailed performance data can be found on displays marked with an asterisk (*). Select performance screen with cursor and hit ENTER Command ===> F1=Help F4=Top F5=Bot F7=Bkwd F8=Fwd F12=Return
Chapter 2. Navigating through Performance Toolkit for VM 35
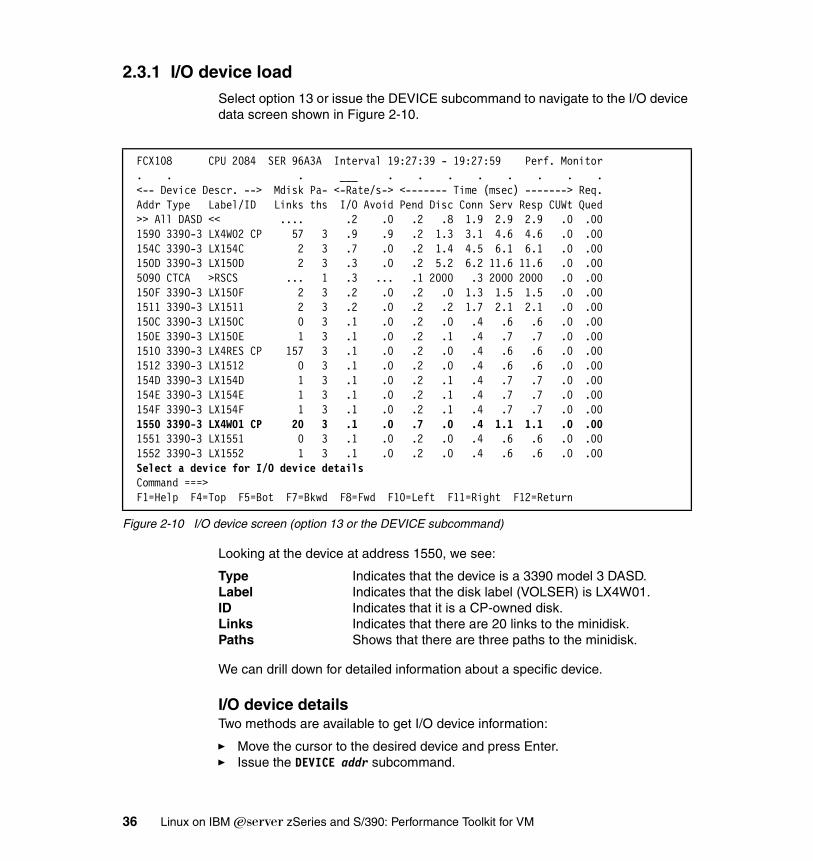
2.3.1 I/O device loadSelect option 13 or issue the DEVICE subcommand to navigate to the I/O device data screen shown in Figure 2-10.
Figure 2-10 I/O device screen (option 13 or the DEVICE subcommand)
Looking at the device at address 1550, we see:
Type Indicates that the device is a 3390 model 3 DASD. Label Indicates that the disk label (VOLSER) is LX4W01.ID Indicates that it is a CP-owned disk.Links Indicates that there are 20 links to the minidisk.Paths Shows that there are three paths to the minidisk.
We can drill down for detailed information about a specific device.
I/O device detailsTwo methods are available to get I/O device information:
� Move the cursor to the desired device and press Enter.� Issue the DEVICE addr subcommand.
FCX108 CPU 2084 SER 96A3A Interval 19:27:39 - 19:27:59 Perf. Monitor . . . ___ . . . . . . . . <-- Device Descr. --> Mdisk Pa- <-Rate/s-> <------- Time (msec) -------> Req. Addr Type Label/ID Links ths I/O Avoid Pend Disc Conn Serv Resp CUWt Qued >> All DASD << .... .2 .0 .2 .8 1.9 2.9 2.9 .0 .00 1590 3390-3 LX4W02 CP 57 3 .9 .9 .2 1.3 3.1 4.6 4.6 .0 .00 154C 3390-3 LX154C 2 3 .7 .0 .2 1.4 4.5 6.1 6.1 .0 .00 150D 3390-3 LX150D 2 3 .3 .0 .2 5.2 6.2 11.6 11.6 .0 .00 5090 CTCA >RSCS ... 1 .3 ... .1 2000 .3 2000 2000 .0 .00 150F 3390-3 LX150F 2 3 .2 .0 .2 .0 1.3 1.5 1.5 .0 .00 1511 3390-3 LX1511 2 3 .2 .0 .2 .2 1.7 2.1 2.1 .0 .00 150C 3390-3 LX150C 0 3 .1 .0 .2 .0 .4 .6 .6 .0 .00 150E 3390-3 LX150E 1 3 .1 .0 .2 .1 .4 .7 .7 .0 .00 1510 3390-3 LX4RES CP 157 3 .1 .0 .2 .0 .4 .6 .6 .0 .00 1512 3390-3 LX1512 0 3 .1 .0 .2 .0 .4 .6 .6 .0 .00 154D 3390-3 LX154D 1 3 .1 .0 .2 .1 .4 .7 .7 .0 .00 154E 3390-3 LX154E 1 3 .1 .0 .2 .1 .4 .7 .7 .0 .00 154F 3390-3 LX154F 1 3 .1 .0 .2 .1 .4 .7 .7 .0 .00 1550 3390-3 LX4W01 CP 20 3 .1 .0 .7 .0 .4 1.1 1.1 .0 .00 1551 3390-3 LX1551 0 3 .1 .0 .2 .0 .4 .6 .6 .0 .00 1552 3390-3 LX1552 1 3 .1 .0 .2 .0 .4 .6 .6 .0 .00 Select a device for I/O device details Command ===> F1=Help F4=Top F5=Bot F7=Bkwd F8=Fwd F10=Left F11=Right F12=Return
36 Linux on IBM Eserver zSeries and S/390: Performance Toolkit for VM
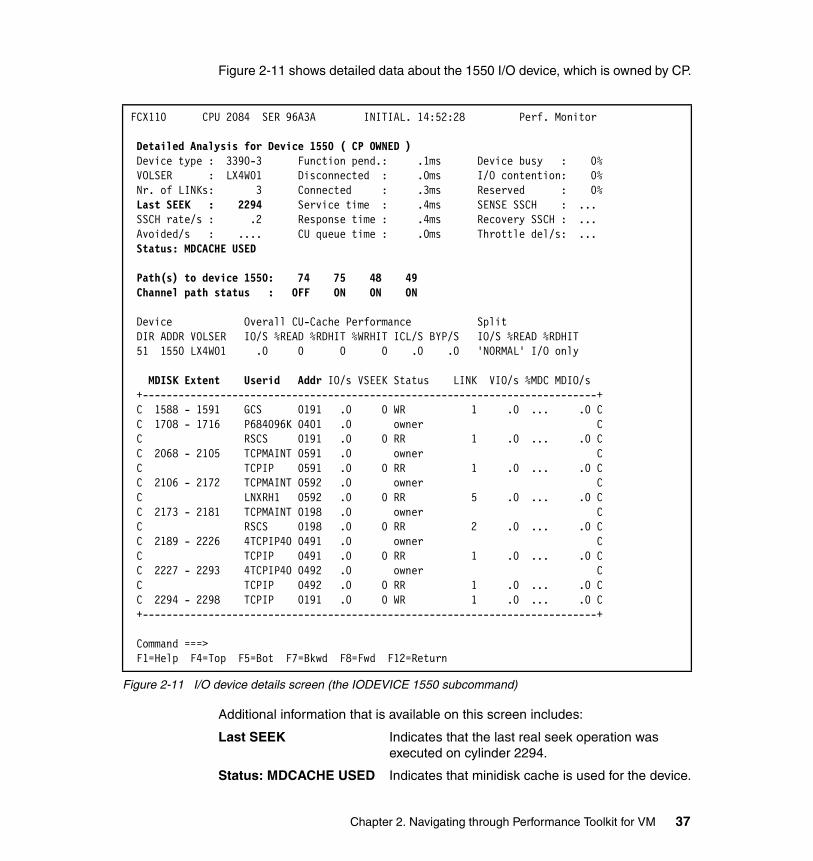
Figure 2-11 shows detailed data about the 1550 I/O device, which is owned by CP.
Figure 2-11 I/O device details screen (the IODEVICE 1550 subcommand)
Additional information that is available on this screen includes:
Last SEEK Indicates that the last real seek operation was executed on cylinder 2294.
Status: MDCACHE USED Indicates that minidisk cache is used for the device.
FCX110 CPU 2084 SER 96A3A INITIAL. 14:52:28 Perf. Monitor Detailed Analysis for Device 1550 ( CP OWNED ) Device type : 3390-3 Function pend.: .1ms Device busy : 0% VOLSER : LX4W01 Disconnected : .0ms I/O contention: 0% Nr. of LINKs: 3 Connected : .3ms Reserved : 0% Last SEEK : 2294 Service time : .4ms SENSE SSCH : ... SSCH rate/s : .2 Response time : .4ms Recovery SSCH : ... Avoided/s : .... CU queue time : .0ms Throttle del/s: ... Status: MDCACHE USED Path(s) to device 1550: 74 75 48 49 Channel path status : OFF ON ON ON Device Overall CU-Cache Performance Split DIR ADDR VOLSER IO/S %READ %RDHIT %WRHIT ICL/S BYP/S IO/S %READ %RDHIT 51 1550 LX4W01 .0 0 0 0 .0 .0 'NORMAL' I/O only MDISK Extent Userid Addr IO/s VSEEK Status LINK VIO/s %MDC MDIO/s +----------------------------------------------------------------------------+ C 1588 - 1591 GCS 0191 .0 0 WR 1 .0 ... .0 C C 1708 - 1716 P684096K 0401 .0 owner C C RSCS 0191 .0 0 RR 1 .0 ... .0 C C 2068 - 2105 TCPMAINT 0591 .0 owner C C TCPIP 0591 .0 0 RR 1 .0 ... .0 C C 2106 - 2172 TCPMAINT 0592 .0 owner C C LNXRH1 0592 .0 0 RR 5 .0 ... .0 C C 2173 - 2181 TCPMAINT 0198 .0 owner C C RSCS 0198 .0 0 RR 2 .0 ... .0 C C 2189 - 2226 4TCPIP40 0491 .0 owner C C TCPIP 0491 .0 0 RR 1 .0 ... .0 C C 2227 - 2293 4TCPIP40 0492 .0 owner C C TCPIP 0492 .0 0 RR 1 .0 ... .0 C C 2294 - 2298 TCPIP 0191 .0 0 WR 1 .0 ... .0 C +----------------------------------------------------------------------------+ Command ===> F1=Help F4=Top F5=Bot F7=Bkwd F8=Fwd F12=Return
Chapter 2. Navigating through Performance Toolkit for VM 37
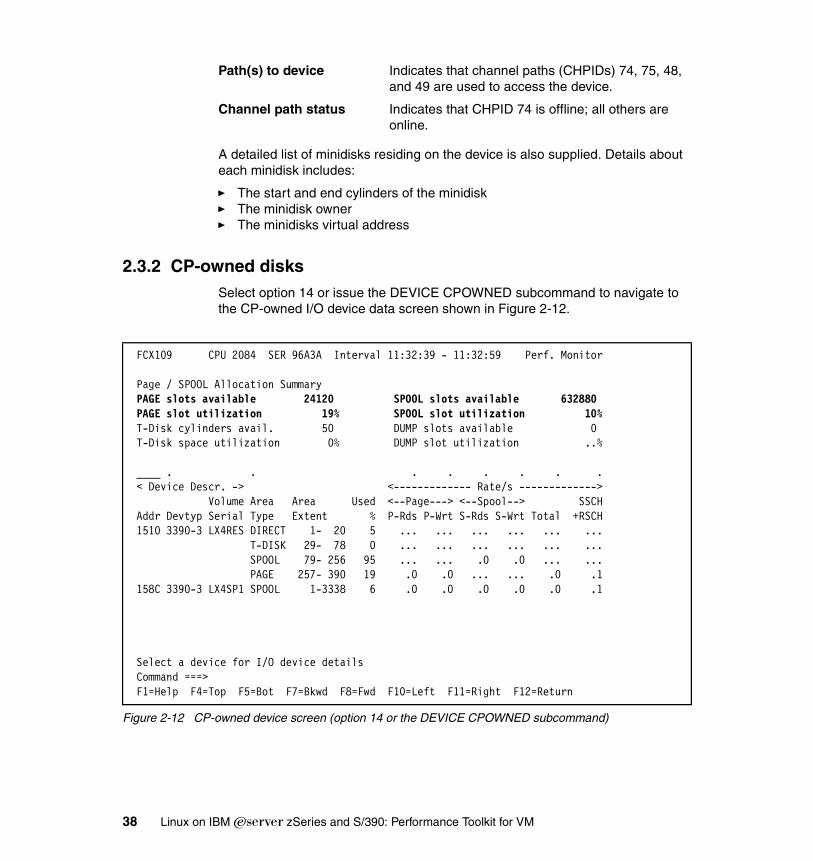
Path(s) to device Indicates that channel paths (CHPIDs) 74, 75, 48, and 49 are used to access the device.
Channel path status Indicates that CHPID 74 is offline; all others are online.
A detailed list of minidisks residing on the device is also supplied. Details about each minidisk includes:
� The start and end cylinders of the minidisk� The minidisk owner � The minidisks virtual address
2.3.2 CP-owned disksSelect option 14 or issue the DEVICE CPOWNED subcommand to navigate to the CP-owned I/O device data screen shown in Figure 2-12.
Figure 2-12 CP-owned device screen (option 14 or the DEVICE CPOWNED subcommand)
FCX109 CPU 2084 SER 96A3A Interval 11:32:39 - 11:32:59 Perf. Monitor Page / SPOOL Allocation Summary PAGE slots available 24120 SPOOL slots available 632880 PAGE slot utilization 19% SPOOL slot utilization 10% T-Disk cylinders avail. 50 DUMP slots available 0 T-Disk space utilization 0% DUMP slot utilization ..% ____ . . . . . . . . < Device Descr. -> <------------- Rate/s -------------> Volume Area Area Used <--Page---> <--Spool--> SSCH Addr Devtyp Serial Type Extent % P-Rds P-Wrt S-Rds S-Wrt Total +RSCH 1510 3390-3 LX4RES DIRECT 1- 20 5 ... ... ... ... ... ... T-DISK 29- 78 0 ... ... ... ... ... ... SPOOL 79- 256 95 ... ... .0 .0 ... ... PAGE 257- 390 19 .0 .0 ... ... .0 .1 158C 3390-3 LX4SP1 SPOOL 1-3338 6 .0 .0 .0 .0 .0 .1 Select a device for I/O device details Command ===> F1=Help F4=Top F5=Bot F7=Bkwd F8=Fwd F10=Left F11=Right F12=Return
38 Linux on IBM Eserver zSeries and S/390: Performance Toolkit for VM
Performance of paging and spooling devices is a key factor for system performance. This screen is a good starting point when problems in that area are suspected.
Information on this screen includes:
� PAGE slots available and PAGE slot utilization
In this example, there are 24120 available page slots, of which 19% are used.
� SPOOL slots available and SPOOL slot utilization
There are 632880 available spool slots, of which 10% are used.
In Chapter 6, “Analyzing I/O and network performance” on page 125, we look at I/O device usage in detail.
Note: When paging space is exhausted, VM will use page to spool space.
Chapter 2. Navigating through Performance Toolkit for VM 39
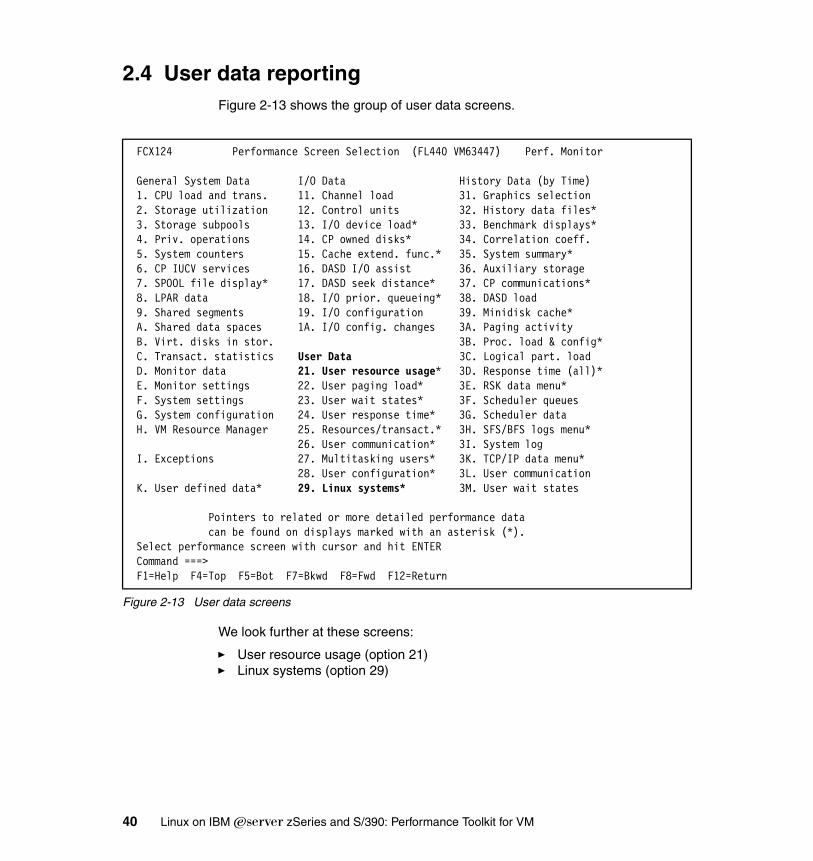
2.4 User data reportingFigure 2-13 shows the group of user data screens.
Figure 2-13 User data screens
We look further at these screens:
� User resource usage (option 21)� Linux systems (option 29)
FCX124 Performance Screen Selection (FL440 VM63447) Perf. Monitor General System Data I/O Data History Data (by Time) 1. CPU load and trans. 11. Channel load 31. Graphics selection 2. Storage utilization 12. Control units 32. History data files* 3. Storage subpools 13. I/O device load* 33. Benchmark displays* 4. Priv. operations 14. CP owned disks* 34. Correlation coeff. 5. System counters 15. Cache extend. func.* 35. System summary* 6. CP IUCV services 16. DASD I/O assist 36. Auxiliary storage 7. SPOOL file display* 17. DASD seek distance* 37. CP communications* 8. LPAR data 18. I/O prior. queueing* 38. DASD load 9. Shared segments 19. I/O configuration 39. Minidisk cache* A. Shared data spaces 1A. I/O config. changes 3A. Paging activity B. Virt. disks in stor. 3B. Proc. load & config* C. Transact. statistics User Data 3C. Logical part. load D. Monitor data 21. User resource usage* 3D. Response time (all)* E. Monitor settings 22. User paging load* 3E. RSK data menu* F. System settings 23. User wait states* 3F. Scheduler queues G. System configuration 24. User response time* 3G. Scheduler data H. VM Resource Manager 25. Resources/transact.* 3H. SFS/BFS logs menu* 26. User communication* 3I. System log I. Exceptions 27. Multitasking users* 3K. TCP/IP data menu* 28. User configuration* 3L. User communication K. User defined data* 29. Linux systems* 3M. User wait states Pointers to related or more detailed performance data can be found on displays marked with an asterisk (*). Select performance screen with cursor and hit ENTER Command ===> F1=Help F4=Top F5=Bot F7=Bkwd F8=Fwd F12=Return
40 Linux on IBM Eserver zSeries and S/390: Performance Toolkit for VM
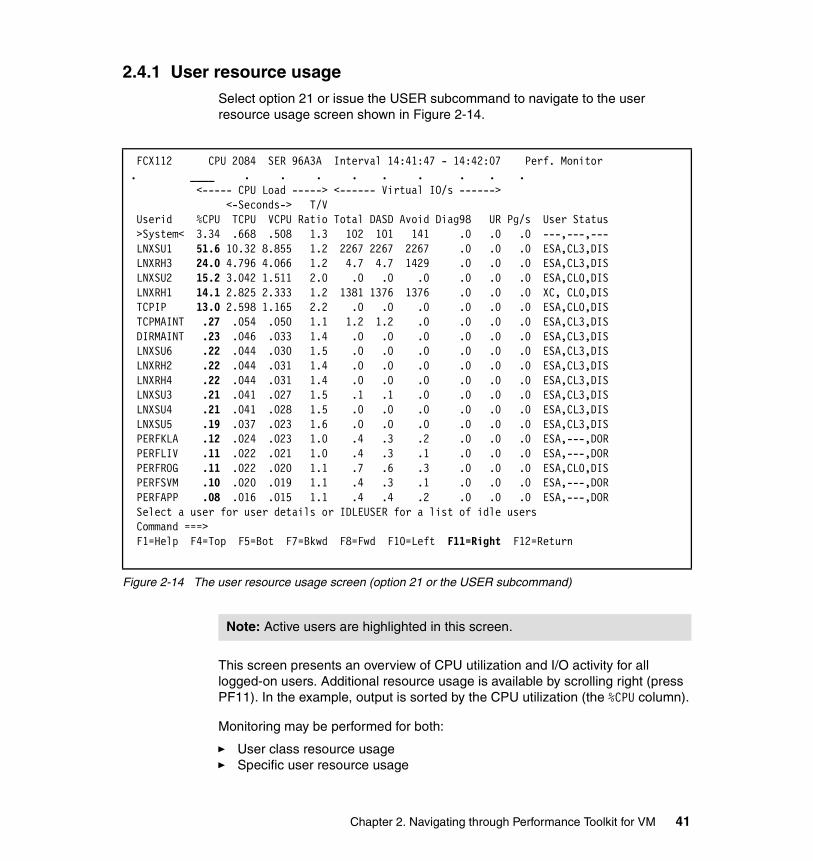
2.4.1 User resource usageSelect option 21 or issue the USER subcommand to navigate to the user resource usage screen shown in Figure 2-14.
Figure 2-14 The user resource usage screen (option 21 or the USER subcommand)
This screen presents an overview of CPU utilization and I/O activity for all logged-on users. Additional resource usage is available by scrolling right (press PF11). In the example, output is sorted by the CPU utilization (the %CPU column).
Monitoring may be performed for both:
� User class resource usage� Specific user resource usage
FCX112 CPU 2084 SER 96A3A Interval 14:41:47 - 14:42:07 Perf. Monitor. ____ . . . . . . . . . <----- CPU Load -----> <------ Virtual IO/s ------> <-Seconds-> T/V Userid %CPU TCPU VCPU Ratio Total DASD Avoid Diag98 UR Pg/s User Status >System< 3.34 .668 .508 1.3 102 101 141 .0 .0 .0 ---,---,--- LNXSU1 51.6 10.32 8.855 1.2 2267 2267 2267 .0 .0 .0 ESA,CL3,DIS LNXRH3 24.0 4.796 4.066 1.2 4.7 4.7 1429 .0 .0 .0 ESA,CL3,DIS LNXSU2 15.2 3.042 1.511 2.0 .0 .0 .0 .0 .0 .0 ESA,CL0,DIS LNXRH1 14.1 2.825 2.333 1.2 1381 1376 1376 .0 .0 .0 XC, CL0,DIS TCPIP 13.0 2.598 1.165 2.2 .0 .0 .0 .0 .0 .0 ESA,CL0,DIS TCPMAINT .27 .054 .050 1.1 1.2 1.2 .0 .0 .0 .0 ESA,CL3,DIS DIRMAINT .23 .046 .033 1.4 .0 .0 .0 .0 .0 .0 ESA,CL3,DIS LNXSU6 .22 .044 .030 1.5 .0 .0 .0 .0 .0 .0 ESA,CL3,DIS LNXRH2 .22 .044 .031 1.4 .0 .0 .0 .0 .0 .0 ESA,CL3,DIS LNXRH4 .22 .044 .031 1.4 .0 .0 .0 .0 .0 .0 ESA,CL3,DIS LNXSU3 .21 .041 .027 1.5 .1 .1 .0 .0 .0 .0 ESA,CL3,DIS LNXSU4 .21 .041 .028 1.5 .0 .0 .0 .0 .0 .0 ESA,CL3,DISLNXSU5 .19 .037 .023 1.6 .0 .0 .0 .0 .0 .0 ESA,CL3,DIS PERFKLA .12 .024 .023 1.0 .4 .3 .2 .0 .0 .0 ESA,---,DOR PERFLIV .11 .022 .021 1.0 .4 .3 .1 .0 .0 .0 ESA,---,DOR PERFROG .11 .022 .020 1.1 .7 .6 .3 .0 .0 .0 ESA,CL0,DIS PERFSVM .10 .020 .019 1.1 .4 .3 .1 .0 .0 .0 ESA,---,DOR PERFAPP .08 .016 .015 1.1 .4 .4 .2 .0 .0 .0 ESA,---,DOR Select a user for user details or IDLEUSER for a list of idle users Command ===> F1=Help F4=Top F5=Bot F7=Bkwd F8=Fwd F10=Left F11=Right F12=Return
Note: Active users are highlighted in this screen.
Chapter 2. Navigating through Performance Toolkit for VM 41
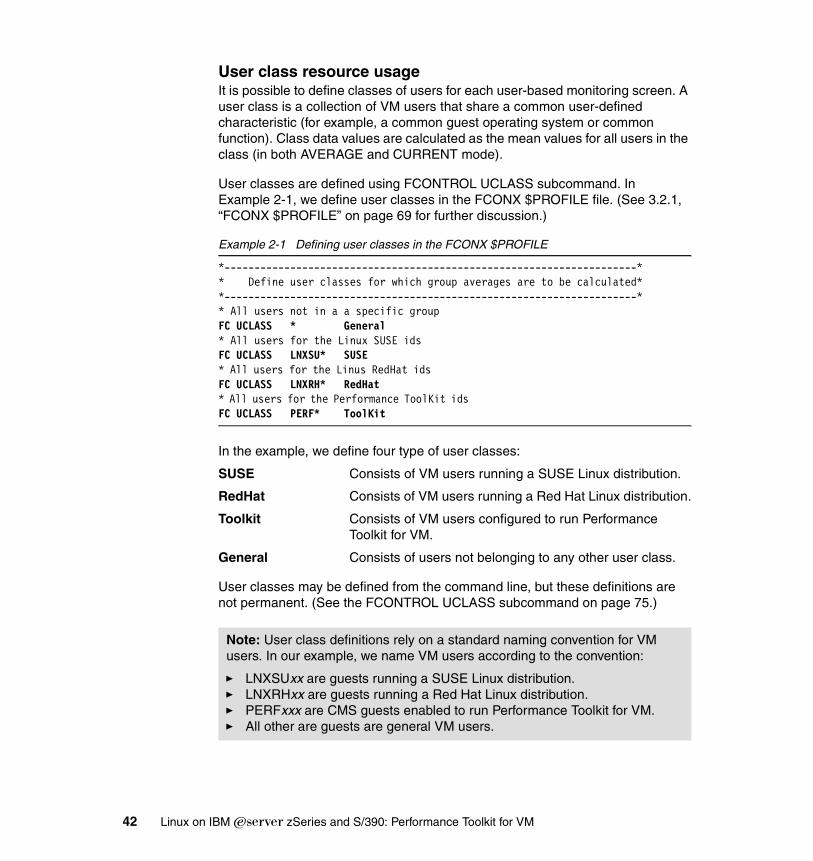
User class resource usageIt is possible to define classes of users for each user-based monitoring screen. A user class is a collection of VM users that share a common user-defined characteristic (for example, a common guest operating system or common function). Class data values are calculated as the mean values for all users in the class (in both AVERAGE and CURRENT mode).
User classes are defined using FCONTROL UCLASS subcommand. In Example 2-1, we define user classes in the FCONX $PROFILE file. (See 3.2.1, “FCONX $PROFILE” on page 69 for further discussion.)
Example 2-1 Defining user classes in the FCONX $PROFILE
*---------------------------------------------------------------------** Define user classes for which group averages are to be calculated**---------------------------------------------------------------------** All users not in a a specific groupFC UCLASS * General* All users for the Linux SUSE ids FC UCLASS LNXSU* SUSE* All users for the Linus RedHat ids FC UCLASS LNXRH* RedHat* All users for the Performance ToolKit ids FC UCLASS PERF* ToolKit
In the example, we define four type of user classes:
SUSE Consists of VM users running a SUSE Linux distribution.
RedHat Consists of VM users running a Red Hat Linux distribution.
Toolkit Consists of VM users configured to run Performance Toolkit for VM.
General Consists of users not belonging to any other user class.
User classes may be defined from the command line, but these definitions are not permanent. (See the FCONTROL UCLASS subcommand on page 75.)
Note: User class definitions rely on a standard naming convention for VM users. In our example, we name VM users according to the convention:
� LNXSUxx are guests running a SUSE Linux distribution.� LNXRHxx are guests running a Red Hat Linux distribution.� PERFxxx are CMS guests enabled to run Performance Toolkit for VM.� All other are guests are general VM users.
42 Linux on IBM Eserver zSeries and S/390: Performance Toolkit for VM
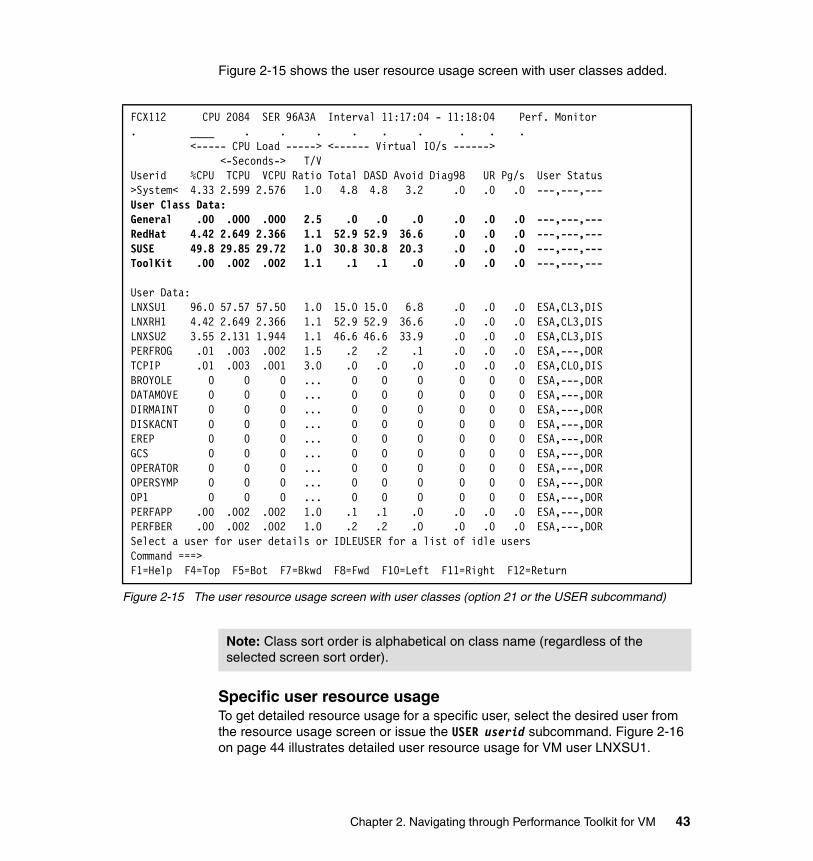
Figure 2-15 shows the user resource usage screen with user classes added.
Figure 2-15 The user resource usage screen with user classes (option 21 or the USER subcommand)
Specific user resource usageTo get detailed resource usage for a specific user, select the desired user from the resource usage screen or issue the USER userid subcommand. Figure 2-16 on page 44 illustrates detailed user resource usage for VM user LNXSU1.
FCX112 CPU 2084 SER 96A3A Interval 11:17:04 - 11:18:04 Perf. Monitor . ____ . . . . . . . . . <----- CPU Load -----> <------ Virtual IO/s ------> <-Seconds-> T/V Userid %CPU TCPU VCPU Ratio Total DASD Avoid Diag98 UR Pg/s User Status>System< 4.33 2.599 2.576 1.0 4.8 4.8 3.2 .0 .0 .0 ---,---,---User Class Data: General .00 .000 .000 2.5 .0 .0 .0 .0 .0 .0 ---,---,---RedHat 4.42 2.649 2.366 1.1 52.9 52.9 36.6 .0 .0 .0 ---,---,---SUSE 49.8 29.85 29.72 1.0 30.8 30.8 20.3 .0 .0 .0 ---,---,---ToolKit .00 .002 .002 1.1 .1 .1 .0 .0 .0 .0 ---,---,--- User Data: LNXSU1 96.0 57.57 57.50 1.0 15.0 15.0 6.8 .0 .0 .0 ESA,CL3,DISLNXRH1 4.42 2.649 2.366 1.1 52.9 52.9 36.6 .0 .0 .0 ESA,CL3,DISLNXSU2 3.55 2.131 1.944 1.1 46.6 46.6 33.9 .0 .0 .0 ESA,CL3,DISPERFROG .01 .003 .002 1.5 .2 .2 .1 .0 .0 .0 ESA,---,DORTCPIP .01 .003 .001 3.0 .0 .0 .0 .0 .0 .0 ESA,CL0,DISBROYOLE 0 0 0 ... 0 0 0 0 0 0 ESA,---,DORDATAMOVE 0 0 0 ... 0 0 0 0 0 0 ESA,---,DORDIRMAINT 0 0 0 ... 0 0 0 0 0 0 ESA,---,DORDISKACNT 0 0 0 ... 0 0 0 0 0 0 ESA,---,DOREREP 0 0 0 ... 0 0 0 0 0 0 ESA,---,DORGCS 0 0 0 ... 0 0 0 0 0 0 ESA,---,DOROPERATOR 0 0 0 ... 0 0 0 0 0 0 ESA,---,DOROPERSYMP 0 0 0 ... 0 0 0 0 0 0 ESA,---,DOROP1 0 0 0 ... 0 0 0 0 0 0 ESA,---,DORPERFAPP .00 .002 .002 1.0 .1 .1 .0 .0 .0 .0 ESA,---,DORPERFBER .00 .002 .002 1.0 .2 .2 .0 .0 .0 .0 ESA,---,DORSelect a user for user details or IDLEUSER for a list of idle users Command ===> F1=Help F4=Top F5=Bot F7=Bkwd F8=Fwd F10=Left F11=Right F12=Return
Note: Class sort order is alphabetical on class name (regardless of the selected screen sort order).
Chapter 2. Navigating through Performance Toolkit for VM 43
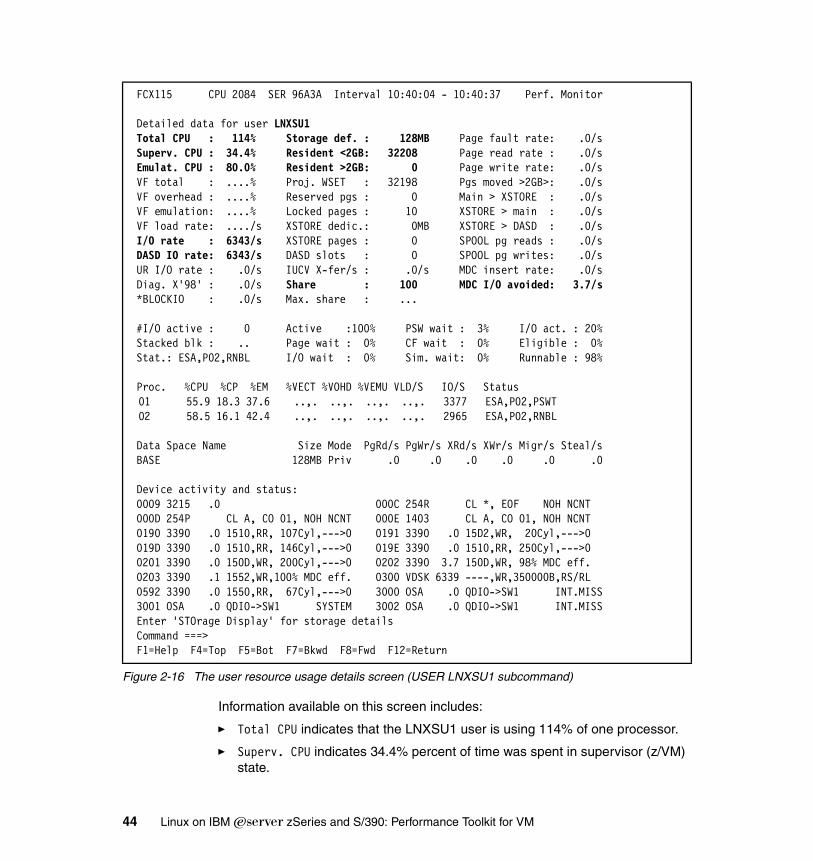
Figure 2-16 The user resource usage details screen (USER LNXSU1 subcommand)
Information available on this screen includes:
� Total CPU indicates that the LNXSU1 user is using 114% of one processor.
� Superv. CPU indicates 34.4% percent of time was spent in supervisor (z/VM) state.
FCX115 CPU 2084 SER 96A3A Interval 10:40:04 - 10:40:37 Perf. Monitor Detailed data for user LNXSU1 Total CPU : 114% Storage def. : 128MB Page fault rate: .0/s Superv. CPU : 34.4% Resident <2GB: 32208 Page read rate : .0/s Emulat. CPU : 80.0% Resident >2GB: 0 Page write rate: .0/s VF total : ....% Proj. WSET : 32198 Pgs moved >2GB>: .0/s VF overhead : ....% Reserved pgs : 0 Main > XSTORE : .0/s VF emulation: ....% Locked pages : 10 XSTORE > main : .0/s VF load rate: ..../s XSTORE dedic.: 0MB XSTORE > DASD : .0/s I/O rate : 6343/s XSTORE pages : 0 SPOOL pg reads : .0/s DASD IO rate: 6343/s DASD slots : 0 SPOOL pg writes: .0/s UR I/O rate : .0/s IUCV X-fer/s : .0/s MDC insert rate: .0/s Diag. X'98' : .0/s Share : 100 MDC I/O avoided: 3.7/s *BLOCKIO : .0/s Max. share : ... #I/O active : 0 Active :100% PSW wait : 3% I/O act. : 20% Stacked blk : .. Page wait : 0% CF wait : 0% Eligible : 0% Stat.: ESA,P02,RNBL I/O wait : 0% Sim. wait: 0% Runnable : 98% Proc. %CPU %CP %EM %VECT %VOHD %VEMU VLD/S IO/S Status 01 55.9 18.3 37.6 ..,. ..,. ..,. ..,. 3377 ESA,P02,PSWT
02 58.5 16.1 42.4 ..,. ..,. ..,. ..,. 2965 ESA,P02,RNBL Data Space Name Size Mode PgRd/s PgWr/s XRd/s XWr/s Migr/s Steal/s BASE 128MB Priv .0 .0 .0 .0 .0 .0 Device activity and status: 0009 3215 .0 000C 254R CL *, EOF NOH NCNT 000D 254P CL A, CO 01, NOH NCNT 000E 1403 CL A, CO 01, NOH NCNT 0190 3390 .0 1510,RR, 107Cyl,--->0 0191 3390 .0 15D2,WR, 20Cyl,--->0 019D 3390 .0 1510,RR, 146Cyl,--->0 019E 3390 .0 1510,RR, 250Cyl,--->0 0201 3390 .0 150D,WR, 200Cyl,--->0 0202 3390 3.7 150D,WR, 98% MDC eff. 0203 3390 .1 1552,WR,100% MDC eff. 0300 VDSK 6339 ----,WR,350000B,RS/RL 0592 3390 .0 1550,RR, 67Cyl,--->0 3000 OSA .0 QDIO->SW1 INT.MISS 3001 OSA .0 QDIO->SW1 SYSTEM 3002 OSA .0 QDIO->SW1 INT.MISS Enter 'STOrage Display' for storage details Command ===> F1=Help F4=Top F5=Bot F7=Bkwd F8=Fwd F12=Return
44 Linux on IBM Eserver zSeries and S/390: Performance Toolkit for VM
� Emulat. CPU (80.0% percentage) is virtual CPU time expressed as a percentage.
� I/O rate indicates on average, 6343 non-spooled I/O operations were attributed to the user in the last interval.
� DASD I/O rate indicates that all I/O operations (6343) occurred to disk in the last interval.
� Storage def. shows that the virtual storage size for the user is 128 MB.
� Resident <2GB indicates that 32208 main storage pages were resident below 2 GB at the end of the last measuring interval. This translates to all main storage for the user.
� Resident >2GB indicates that no main storage pages were resident above the 2 GB line at the end of the last measuring interval.
� Share indicates that the user is assigned the default relative share value (100).
� MDC avoided indicates that 3.7 I/O operations per second (in the last interval) were avoided because the data was found in the minidisk cache.
Note: Relative shares are presented as numbers; absolute shares are presented as percentages.
Chapter 2. Navigating through Performance Toolkit for VM 45
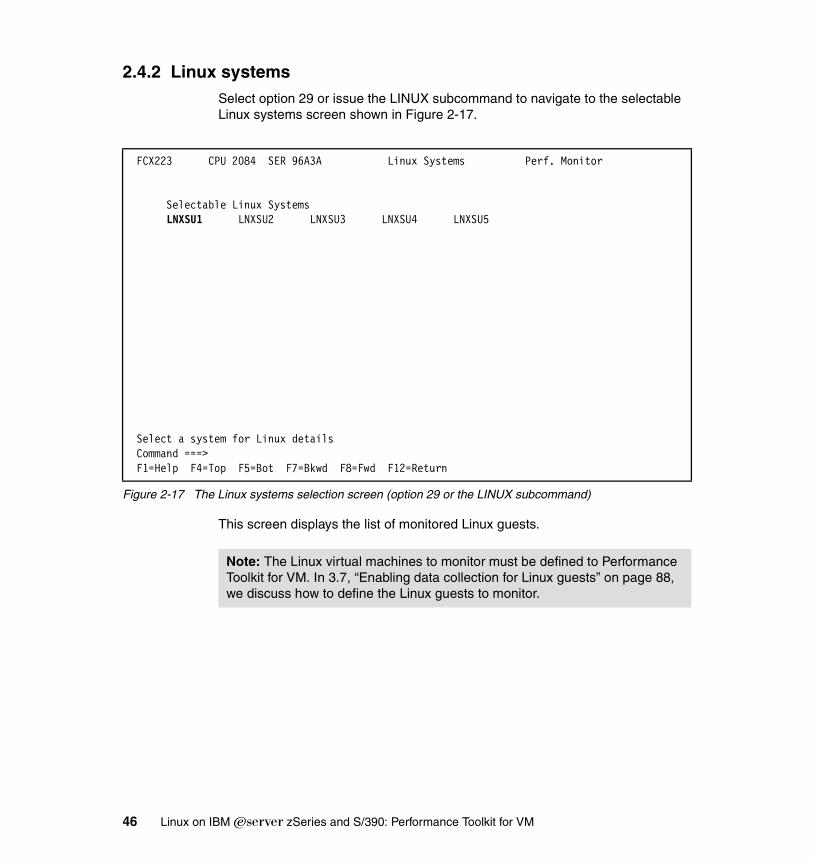
2.4.2 Linux systemsSelect option 29 or issue the LINUX subcommand to navigate to the selectable Linux systems screen shown in Figure 2-17.
Figure 2-17 The Linux systems selection screen (option 29 or the LINUX subcommand)
This screen displays the list of monitored Linux guests.
FCX223 CPU 2084 SER 96A3A Linux Systems Perf. Monitor Selectable Linux Systems LNXSU1 LNXSU2 LNXSU3 LNXSU4 LNXSU5
Select a system for Linux details Command ===> F1=Help F4=Top F5=Bot F7=Bkwd F8=Fwd F12=Return
Note: The Linux virtual machines to monitor must be defined to Performance Toolkit for VM. In 3.7, “Enabling data collection for Linux guests” on page 88, we discuss how to define the Linux guests to monitor.
46 Linux on IBM Eserver zSeries and S/390: Performance Toolkit for VM
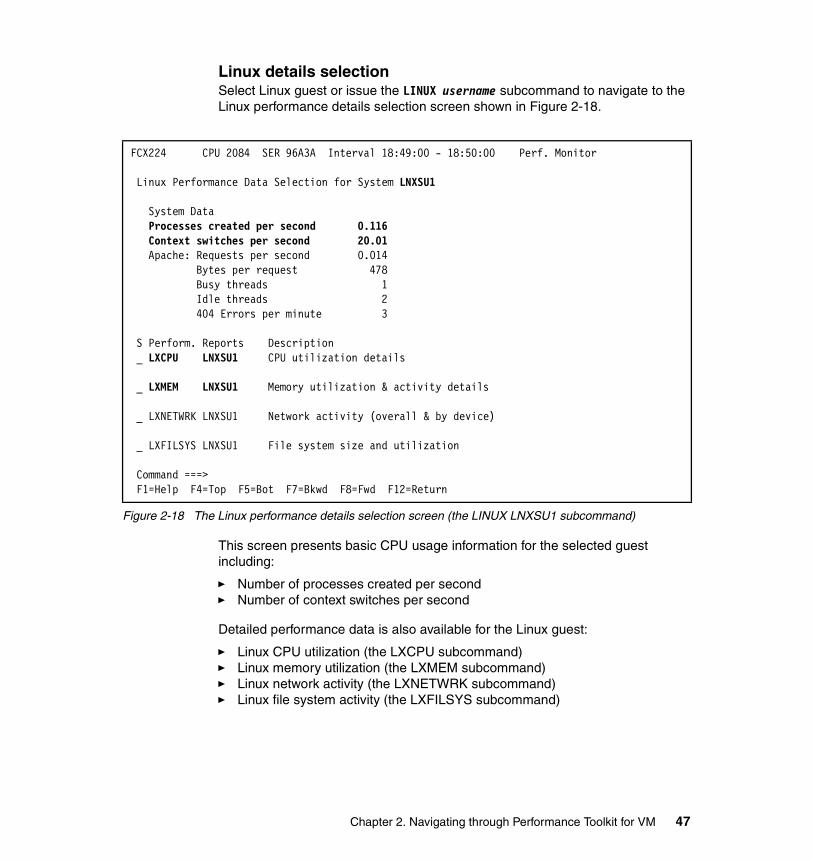
Linux details selectionSelect Linux guest or issue the LINUX username subcommand to navigate to the Linux performance details selection screen shown in Figure 2-18.
Figure 2-18 The Linux performance details selection screen (the LINUX LNXSU1 subcommand)
This screen presents basic CPU usage information for the selected guest including:
� Number of processes created per second� Number of context switches per second
Detailed performance data is also available for the Linux guest:
� Linux CPU utilization (the LXCPU subcommand)� Linux memory utilization (the LXMEM subcommand)� Linux network activity (the LXNETWRK subcommand)� Linux file system activity (the LXFILSYS subcommand)
FCX224 CPU 2084 SER 96A3A Interval 18:49:00 - 18:50:00 Perf. Monitor Linux Performance Data Selection for System LNXSU1 System Data Processes created per second 0.116 Context switches per second 20.01 Apache: Requests per second 0.014 Bytes per request 478 Busy threads 1 Idle threads 2 404 Errors per minute 3 S Perform. Reports Description _ LXCPU LNXSU1 CPU utilization details _ LXMEM LNXSU1 Memory utilization & activity details _ LXNETWRK LNXSU1 Network activity (overall & by device) _ LXFILSYS LNXSU1 File system size and utilization
Command ===> F1=Help F4=Top F5=Bot F7=Bkwd F8=Fwd F12=Return
Chapter 2. Navigating through Performance Toolkit for VM 47
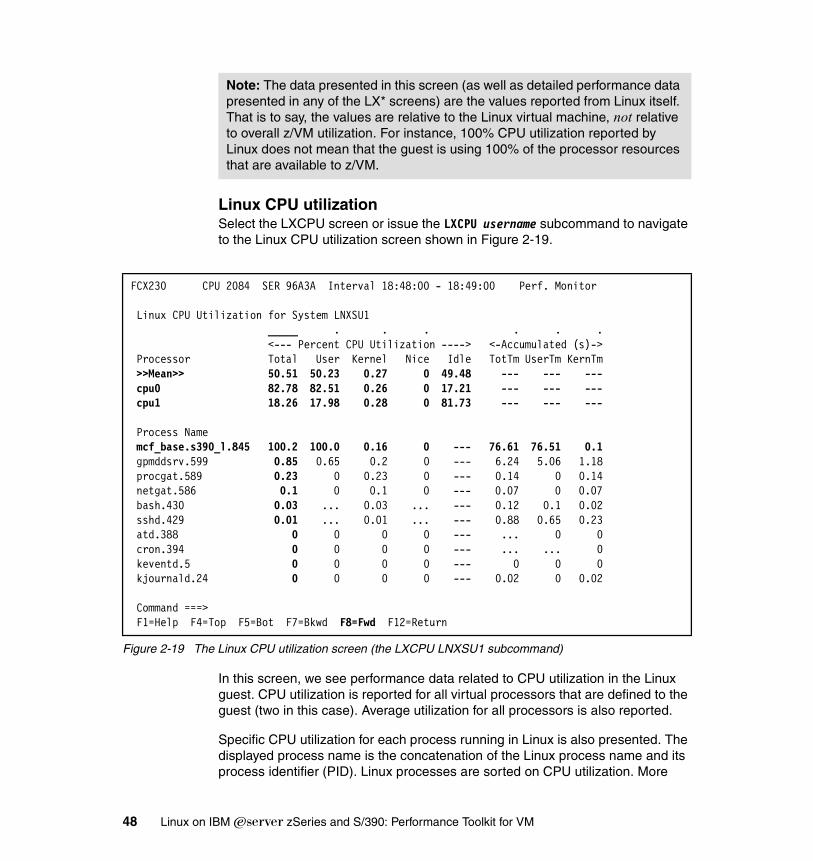
Linux CPU utilizationSelect the LXCPU screen or issue the LXCPU username subcommand to navigate to the Linux CPU utilization screen shown in Figure 2-19.
Figure 2-19 The Linux CPU utilization screen (the LXCPU LNXSU1 subcommand)
In this screen, we see performance data related to CPU utilization in the Linux guest. CPU utilization is reported for all virtual processors that are defined to the guest (two in this case). Average utilization for all processors is also reported.
Specific CPU utilization for each process running in Linux is also presented. The displayed process name is the concatenation of the Linux process name and its process identifier (PID). Linux processes are sorted on CPU utilization. More
Note: The data presented in this screen (as well as detailed performance data presented in any of the LX* screens) are the values reported from Linux itself. That is to say, the values are relative to the Linux virtual machine, not relative to overall z/VM utilization. For instance, 100% CPU utilization reported by Linux does not mean that the guest is using 100% of the processor resources that are available to z/VM.
FCX230 CPU 2084 SER 96A3A Interval 18:48:00 - 18:49:00 Perf. Monitor Linux CPU Utilization for System LNXSU1 _____ . . . . . . <--- Percent CPU Utilization ----> <-Accumulated (s)-> Processor Total User Kernel Nice Idle TotTm UserTm KernTm >>Mean>> 50.51 50.23 0.27 0 49.48 --- --- --- cpu0 82.78 82.51 0.26 0 17.21 --- --- --- cpu1 18.26 17.98 0.28 0 81.73 --- --- --- Process Name mcf_base.s390_l.845 100.2 100.0 0.16 0 --- 76.61 76.51 0.1 gpmddsrv.599 0.85 0.65 0.2 0 --- 6.24 5.06 1.18 procgat.589 0.23 0 0.23 0 --- 0.14 0 0.14 netgat.586 0.1 0 0.1 0 --- 0.07 0 0.07 bash.430 0.03 ... 0.03 ... --- 0.12 0.1 0.02 sshd.429 0.01 ... 0.01 ... --- 0.88 0.65 0.23 atd.388 0 0 0 0 --- ... 0 0 cron.394 0 0 0 0 --- ... ... 0 keventd.5 0 0 0 0 --- 0 0 0 kjournald.24 0 0 0 0 --- 0.02 0 0.02 Command ===> F1=Help F4=Top F5=Bot F7=Bkwd F8=Fwd F12=Return
48 Linux on IBM Eserver zSeries and S/390: Performance Toolkit for VM
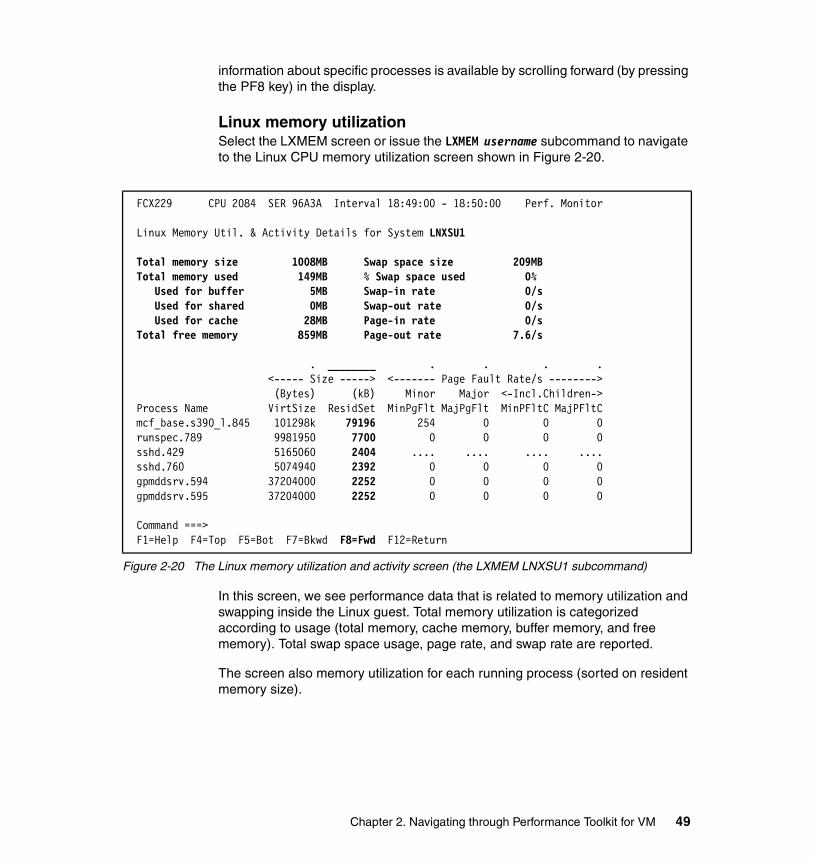
information about specific processes is available by scrolling forward (by pressing the PF8 key) in the display.
Linux memory utilizationSelect the LXMEM screen or issue the LXMEM username subcommand to navigate to the Linux CPU memory utilization screen shown in Figure 2-20.
Figure 2-20 The Linux memory utilization and activity screen (the LXMEM LNXSU1 subcommand)
In this screen, we see performance data that is related to memory utilization and swapping inside the Linux guest. Total memory utilization is categorized according to usage (total memory, cache memory, buffer memory, and free memory). Total swap space usage, page rate, and swap rate are reported.
The screen also memory utilization for each running process (sorted on resident memory size).
FCX229 CPU 2084 SER 96A3A Interval 18:49:00 - 18:50:00 Perf. Monitor Linux Memory Util. & Activity Details for System LNXSU1 Total memory size 1008MB Swap space size 209MB Total memory used 149MB % Swap space used 0% Used for buffer 5MB Swap-in rate 0/s Used for shared 0MB Swap-out rate 0/s Used for cache 28MB Page-in rate 0/s Total free memory 859MB Page-out rate 7.6/s . ________ . . . . <----- Size -----> <------- Page Fault Rate/s --------> (Bytes) (kB) Minor Major <-Incl.Children-> Process Name VirtSize ResidSet MinPgFlt MajPgFlt MinPFltC MajPFltC mcf_base.s390_l.845 101298k 79196 254 0 0 0 runspec.789 9981950 7700 0 0 0 0 sshd.429 5165060 2404 .... .... .... .... sshd.760 5074940 2392 0 0 0 0 gpmddsrv.594 37204000 2252 0 0 0 0 gpmddsrv.595 37204000 2252 0 0 0 0 Command ===> F1=Help F4=Top F5=Bot F7=Bkwd F8=Fwd F12=Return
Chapter 2. Navigating through Performance Toolkit for VM 49
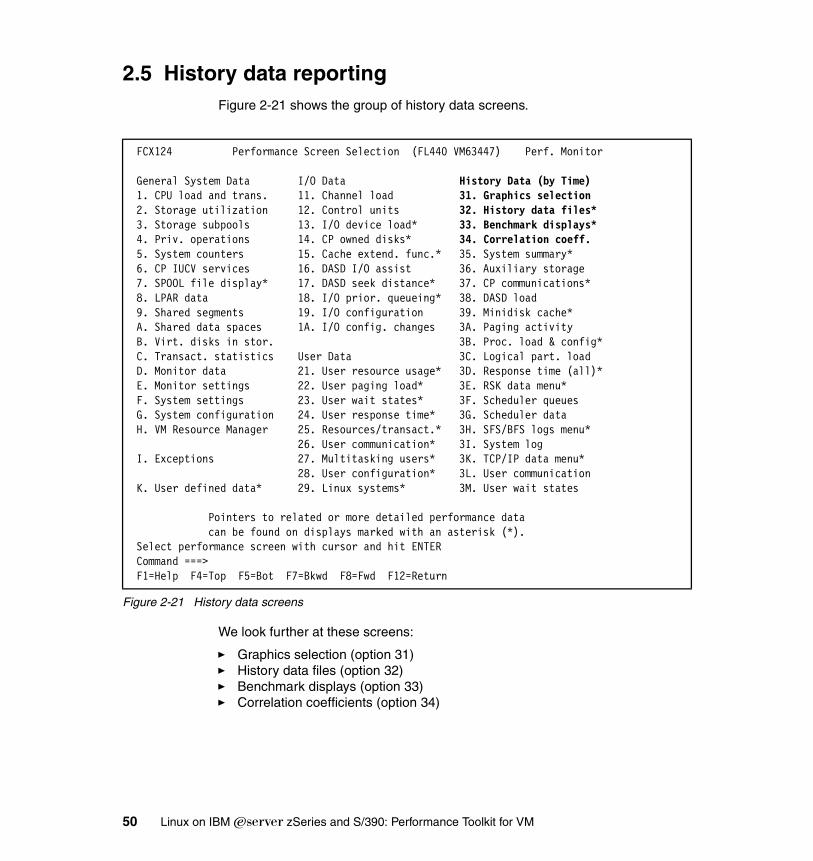
2.5 History data reportingFigure 2-21 shows the group of history data screens.
Figure 2-21 History data screens
We look further at these screens:
� Graphics selection (option 31)� History data files (option 32) � Benchmark displays (option 33)� Correlation coefficients (option 34)
FCX124 Performance Screen Selection (FL440 VM63447) Perf. Monitor General System Data I/O Data History Data (by Time) 1. CPU load and trans. 11. Channel load 31. Graphics selection 2. Storage utilization 12. Control units 32. History data files* 3. Storage subpools 13. I/O device load* 33. Benchmark displays* 4. Priv. operations 14. CP owned disks* 34. Correlation coeff. 5. System counters 15. Cache extend. func.* 35. System summary* 6. CP IUCV services 16. DASD I/O assist 36. Auxiliary storage 7. SPOOL file display* 17. DASD seek distance* 37. CP communications* 8. LPAR data 18. I/O prior. queueing* 38. DASD load 9. Shared segments 19. I/O configuration 39. Minidisk cache* A. Shared data spaces 1A. I/O config. changes 3A. Paging activity B. Virt. disks in stor. 3B. Proc. load & config* C. Transact. statistics User Data 3C. Logical part. load D. Monitor data 21. User resource usage* 3D. Response time (all)* E. Monitor settings 22. User paging load* 3E. RSK data menu* F. System settings 23. User wait states* 3F. Scheduler queues G. System configuration 24. User response time* 3G. Scheduler data H. VM Resource Manager 25. Resources/transact.* 3H. SFS/BFS logs menu* 26. User communication* 3I. System log I. Exceptions 27. Multitasking users* 3K. TCP/IP data menu* 28. User configuration* 3L. User communication K. User defined data* 29. Linux systems* 3M. User wait states Pointers to related or more detailed performance data can be found on displays marked with an asterisk (*). Select performance screen with cursor and hit ENTER Command ===> F1=Help F4=Top F5=Bot F7=Bkwd F8=Fwd F12=Return
50 Linux on IBM Eserver zSeries and S/390: Performance Toolkit for VM
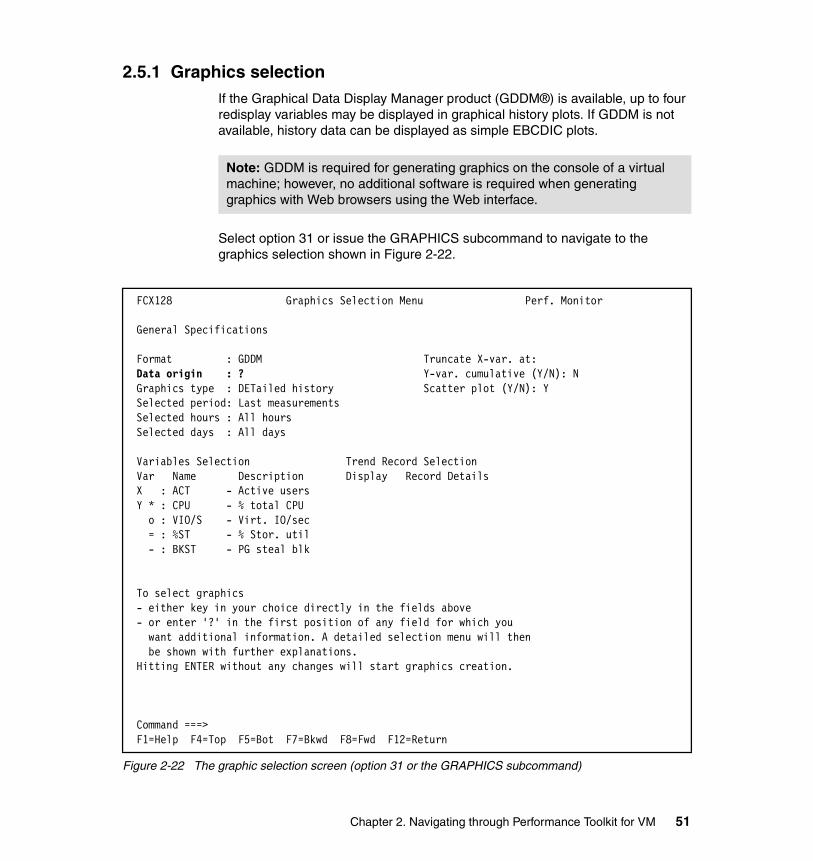
2.5.1 Graphics selectionIf the Graphical Data Display Manager product (GDDM®) is available, up to four redisplay variables may be displayed in graphical history plots. If GDDM is not available, history data can be displayed as simple EBCDIC plots.
Select option 31 or issue the GRAPHICS subcommand to navigate to the graphics selection shown in Figure 2-22.
Figure 2-22 The graphic selection screen (option 31 or the GRAPHICS subcommand)
Note: GDDM is required for generating graphics on the console of a virtual machine; however, no additional software is required when generating graphics with Web browsers using the Web interface.
FCX128 Graphics Selection Menu Perf. Monitor General Specifications Format : GDDM Truncate X-var. at: Data origin : ? Y-var. cumulative (Y/N): N Graphics type : DETailed history Scatter plot (Y/N): Y Selected period: Last measurements Selected hours : All hours Selected days : All days Variables Selection Trend Record Selection Var Name Description Display Record Details X : ACT - Active users Y * : CPU - % total CPU o : VIO/S - Virt. IO/sec = : %ST - % Stor. util - : BKST - PG steal blk To select graphics - either key in your choice directly in the fields above - or enter '?' in the first position of any field for which you want additional information. A detailed selection menu will then be shown with further explanations. Hitting ENTER without any changes will start graphics creation.
Command ===> F1=Help F4=Top F5=Bot F7=Bkwd F8=Fwd F12=Return
Chapter 2. Navigating through Performance Toolkit for VM 51
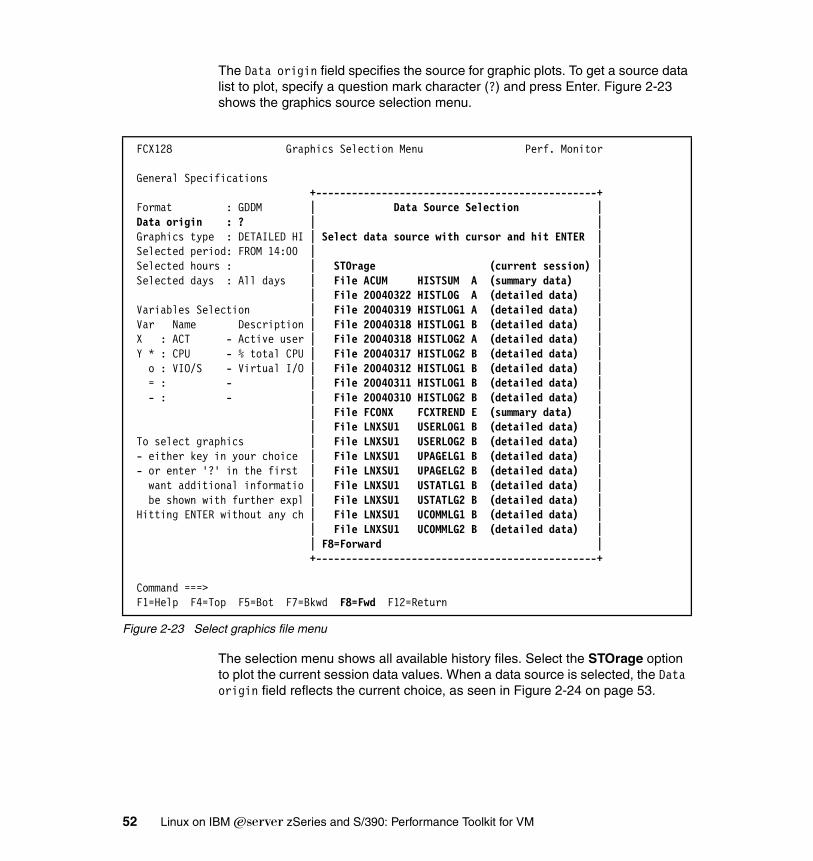
The Data origin field specifies the source for graphic plots. To get a source data list to plot, specify a question mark character (?) and press Enter. Figure 2-23 shows the graphics source selection menu.
Figure 2-23 Select graphics file menu
The selection menu shows all available history files. Select the STOrage option to plot the current session data values. When a data source is selected, the Data origin field reflects the current choice, as seen in Figure 2-24 on page 53.
FCX128 Graphics Selection Menu Perf. Monitor General Specifications +-----------------------------------------------+ Format : GDDM | Data Source Selection | Data origin : ? | | Graphics type : DETAILED HI | Select data source with cursor and hit ENTER | Selected period: FROM 14:00 | | Selected hours : | STOrage (current session) | Selected days : All days | File ACUM HISTSUM A (summary data) | | File 20040322 HISTLOG A (detailed data) | Variables Selection | File 20040319 HISTLOG1 A (detailed data) | Var Name Description | File 20040318 HISTLOG1 B (detailed data) | X : ACT - Active user | File 20040318 HISTLOG2 A (detailed data) | Y * : CPU - % total CPU | File 20040317 HISTLOG2 B (detailed data) | o : VIO/S - Virtual I/O | File 20040312 HISTLOG1 B (detailed data) | = : - | File 20040311 HISTLOG1 B (detailed data) | - : - | File 20040310 HISTLOG2 B (detailed data) | | File FCONX FCXTREND E (summary data) | | File LNXSU1 USERLOG1 B (detailed data) | To select graphics | File LNXSU1 USERLOG2 B (detailed data) | - either key in your choice | File LNXSU1 UPAGELG1 B (detailed data) | - or enter '?' in the first | File LNXSU1 UPAGELG2 B (detailed data) | want additional informatio | File LNXSU1 USTATLG1 B (detailed data) | be shown with further expl | File LNXSU1 USTATLG2 B (detailed data) | Hitting ENTER without any ch | File LNXSU1 UCOMMLG1 B (detailed data) | | File LNXSU1 UCOMMLG2 B (detailed data) | | F8=Forward | +-----------------------------------------------+ Command ===> F1=Help F4=Top F5=Bot F7=Bkwd F8=Fwd F12=Return
52 Linux on IBM Eserver zSeries and S/390: Performance Toolkit for VM
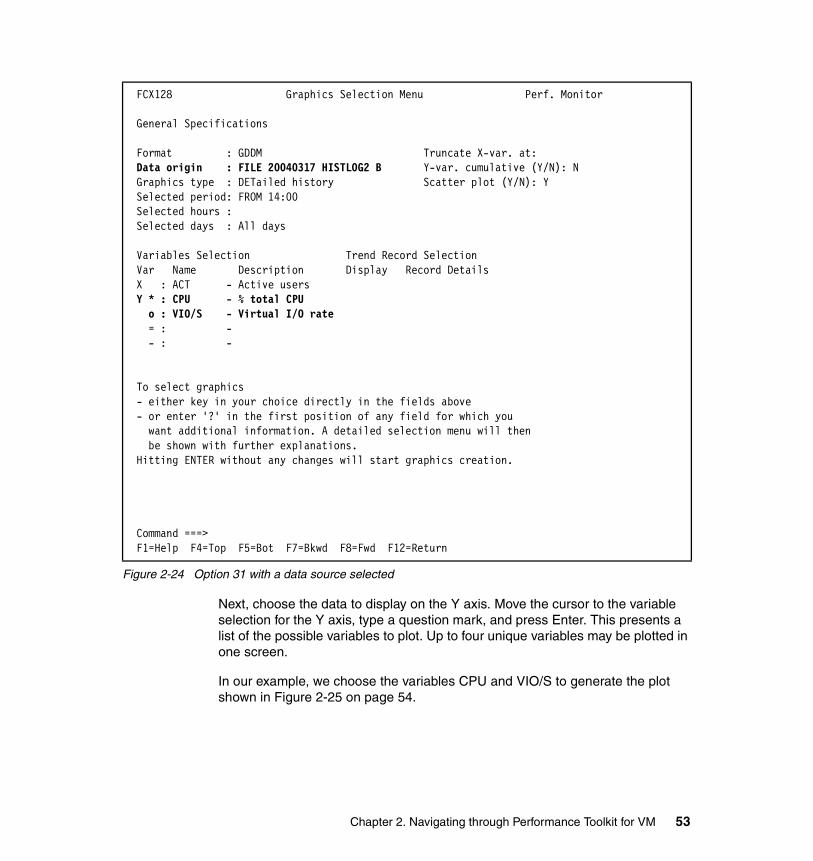
Figure 2-24 Option 31 with a data source selected
Next, choose the data to display on the Y axis. Move the cursor to the variable selection for the Y axis, type a question mark, and press Enter. This presents a list of the possible variables to plot. Up to four unique variables may be plotted in one screen.
In our example, we choose the variables CPU and VIO/S to generate the plot shown in Figure 2-25 on page 54.
FCX128 Graphics Selection Menu Perf. Monitor General Specifications Format : GDDM Truncate X-var. at: Data origin : FILE 20040317 HISTLOG2 B Y-var. cumulative (Y/N): N Graphics type : DETailed history Scatter plot (Y/N): Y Selected period: FROM 14:00 Selected hours : Selected days : All days Variables Selection Trend Record Selection Var Name Description Display Record Details X : ACT - Active users Y * : CPU - % total CPU o : VIO/S - Virtual I/O rate = : - - : - To select graphics - either key in your choice directly in the fields above - or enter '?' in the first position of any field for which you want additional information. A detailed selection menu will then be shown with further explanations. Hitting ENTER without any changes will start graphics creation. Command ===> F1=Help F4=Top F5=Bot F7=Bkwd F8=Fwd F12=Return
Chapter 2. Navigating through Performance Toolkit for VM 53
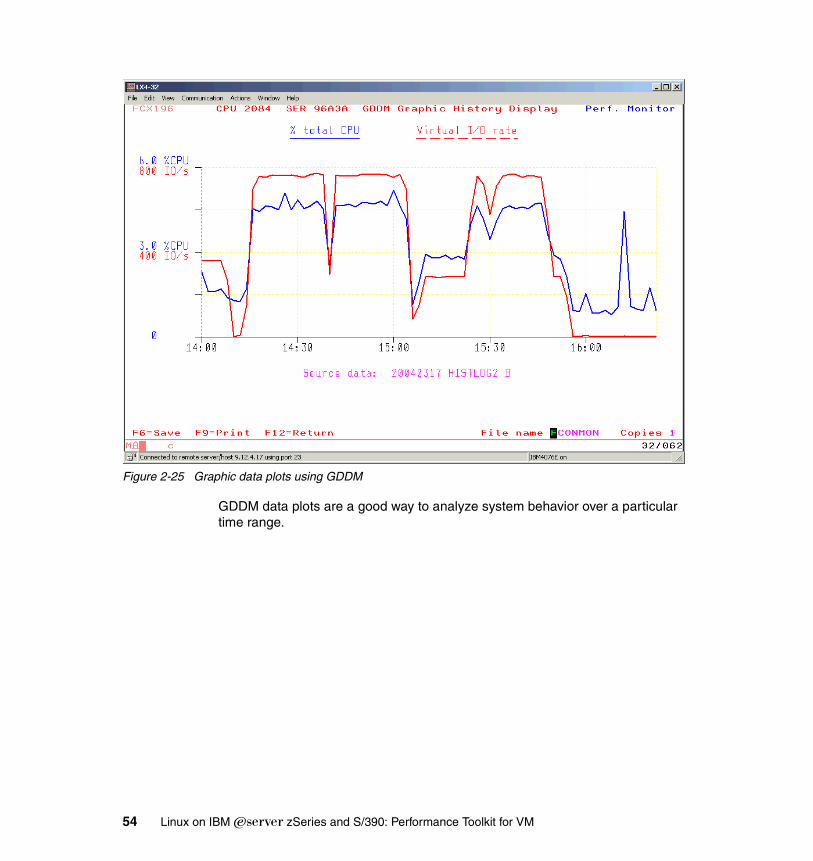
Figure 2-25 Graphic data plots using GDDM
GDDM data plots are a good way to analyze system behavior over a particular time range.
54 Linux on IBM Eserver zSeries and S/390: Performance Toolkit for VM
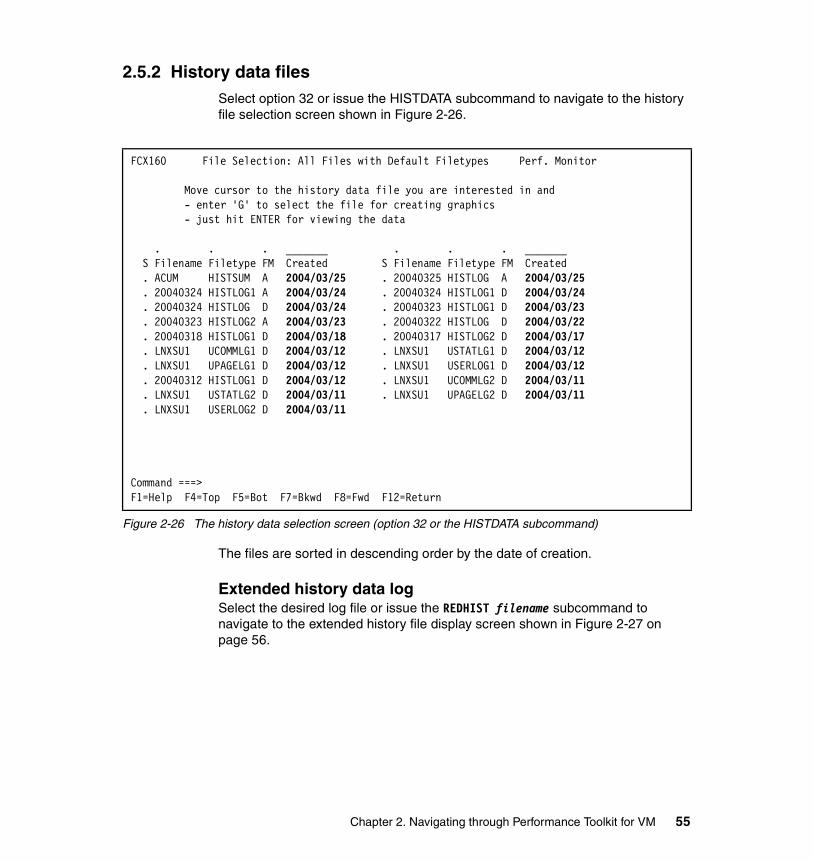
2.5.2 History data filesSelect option 32 or issue the HISTDATA subcommand to navigate to the history file selection screen shown in Figure 2-26.
Figure 2-26 The history data selection screen (option 32 or the HISTDATA subcommand)
The files are sorted in descending order by the date of creation.
Extended history data logSelect the desired log file or issue the REDHIST filename subcommand to navigate to the extended history file display screen shown in Figure 2-27 on page 56.
FCX160 File Selection: All Files with Default Filetypes Perf. Monitor Move cursor to the history data file you are interested in and - enter 'G' to select the file for creating graphics - just hit ENTER for viewing the data . . . _______ . . . _______ S Filename Filetype FM Created S Filename Filetype FM Created . ACUM HISTSUM A 2004/03/25 . 20040325 HISTLOG A 2004/03/25 . 20040324 HISTLOG1 A 2004/03/24 . 20040324 HISTLOG1 D 2004/03/24 . 20040324 HISTLOG D 2004/03/24 . 20040323 HISTLOG1 D 2004/03/23 . 20040323 HISTLOG2 A 2004/03/23 . 20040322 HISTLOG D 2004/03/22 . 20040318 HISTLOG1 D 2004/03/18 . 20040317 HISTLOG2 D 2004/03/17 . LNXSU1 UCOMMLG1 D 2004/03/12 . LNXSU1 USTATLG1 D 2004/03/12 . LNXSU1 UPAGELG1 D 2004/03/12 . LNXSU1 USERLOG1 D 2004/03/12 . 20040312 HISTLOG1 D 2004/03/12 . LNXSU1 UCOMMLG2 D 2004/03/11 . LNXSU1 USTATLG2 D 2004/03/11 . LNXSU1 UPAGELG2 D 2004/03/11 . LNXSU1 USERLOG2 D 2004/03/11
Command ===> F1=Help F4=Top F5=Bot F7=Bkwd F8=Fwd F12=Return
Chapter 2. Navigating through Performance Toolkit for VM 55
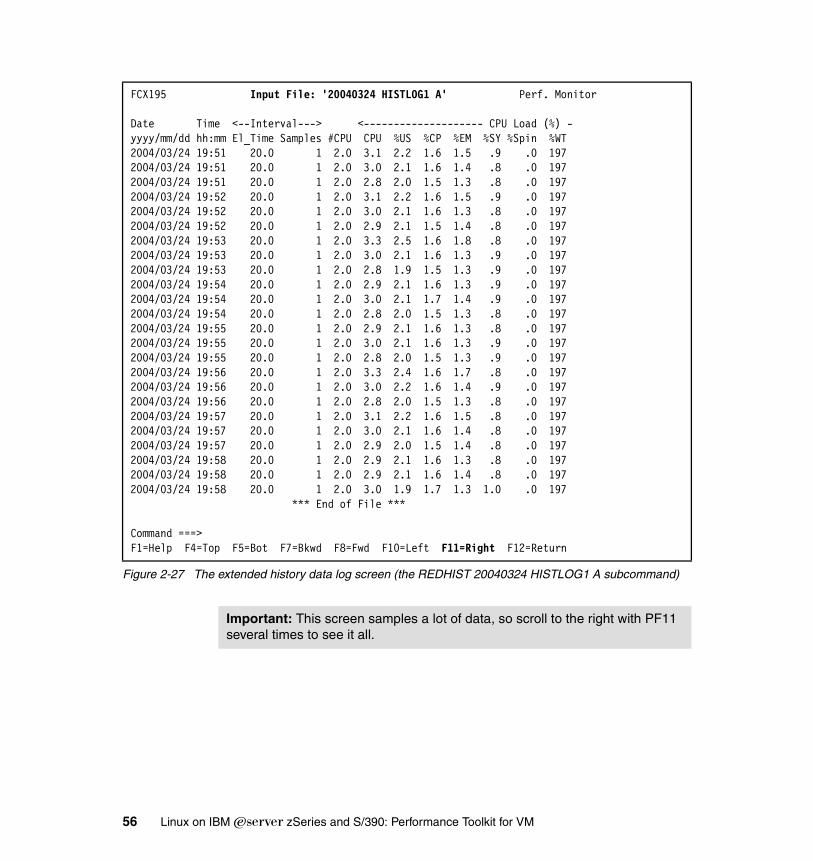
Figure 2-27 The extended history data log screen (the REDHIST 20040324 HISTLOG1 A subcommand)
FCX195 Input File: '20040324 HISTLOG1 A' Perf. Monitor Date Time <--Interval---> <-------------------- CPU Load (%) - yyyy/mm/dd hh:mm El_Time Samples #CPU CPU %US %CP %EM %SY %Spin %WT 2004/03/24 19:51 20.0 1 2.0 3.1 2.2 1.6 1.5 .9 .0 197 2004/03/24 19:51 20.0 1 2.0 3.0 2.1 1.6 1.4 .8 .0 197 2004/03/24 19:51 20.0 1 2.0 2.8 2.0 1.5 1.3 .8 .0 197 2004/03/24 19:52 20.0 1 2.0 3.1 2.2 1.6 1.5 .9 .0 197 2004/03/24 19:52 20.0 1 2.0 3.0 2.1 1.6 1.3 .8 .0 197 2004/03/24 19:52 20.0 1 2.0 2.9 2.1 1.5 1.4 .8 .0 197 2004/03/24 19:53 20.0 1 2.0 3.3 2.5 1.6 1.8 .8 .0 197 2004/03/24 19:53 20.0 1 2.0 3.0 2.1 1.6 1.3 .9 .0 197 2004/03/24 19:53 20.0 1 2.0 2.8 1.9 1.5 1.3 .9 .0 197 2004/03/24 19:54 20.0 1 2.0 2.9 2.1 1.6 1.3 .9 .0 197 2004/03/24 19:54 20.0 1 2.0 3.0 2.1 1.7 1.4 .9 .0 197 2004/03/24 19:54 20.0 1 2.0 2.8 2.0 1.5 1.3 .8 .0 197 2004/03/24 19:55 20.0 1 2.0 2.9 2.1 1.6 1.3 .8 .0 197 2004/03/24 19:55 20.0 1 2.0 3.0 2.1 1.6 1.3 .9 .0 197 2004/03/24 19:55 20.0 1 2.0 2.8 2.0 1.5 1.3 .9 .0 197 2004/03/24 19:56 20.0 1 2.0 3.3 2.4 1.6 1.7 .8 .0 197 2004/03/24 19:56 20.0 1 2.0 3.0 2.2 1.6 1.4 .9 .0 197 2004/03/24 19:56 20.0 1 2.0 2.8 2.0 1.5 1.3 .8 .0 197 2004/03/24 19:57 20.0 1 2.0 3.1 2.2 1.6 1.5 .8 .0 197 2004/03/24 19:57 20.0 1 2.0 3.0 2.1 1.6 1.4 .8 .0 197 2004/03/24 19:57 20.0 1 2.0 2.9 2.0 1.5 1.4 .8 .0 197 2004/03/24 19:58 20.0 1 2.0 2.9 2.1 1.6 1.3 .8 .0 197 2004/03/24 19:58 20.0 1 2.0 2.9 2.1 1.6 1.4 .8 .0 197 2004/03/24 19:58 20.0 1 2.0 3.0 1.9 1.7 1.3 1.0 .0 197 *** End of File *** Command ===> F1=Help F4=Top F5=Bot F7=Bkwd F8=Fwd F10=Left F11=Right F12=Return
Important: This screen samples a lot of data, so scroll to the right with PF11 several times to see it all.
56 Linux on IBM Eserver zSeries and S/390: Performance Toolkit for VM
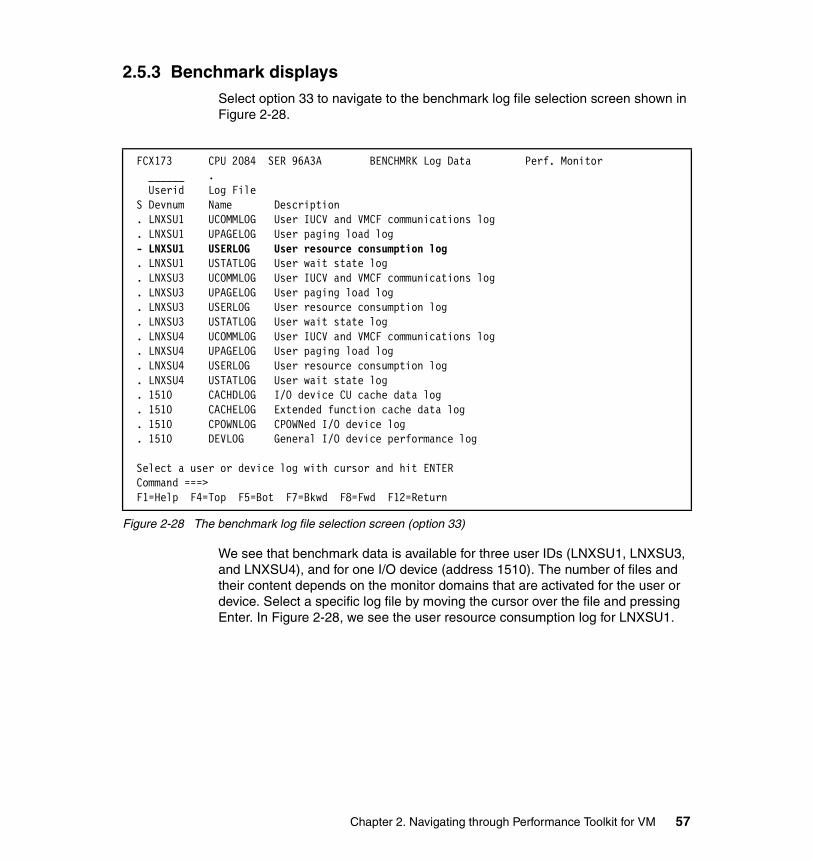
2.5.3 Benchmark displaysSelect option 33 to navigate to the benchmark log file selection screen shown in Figure 2-28.
Figure 2-28 The benchmark log file selection screen (option 33)
We see that benchmark data is available for three user IDs (LNXSU1, LNXSU3, and LNXSU4), and for one I/O device (address 1510). The number of files and their content depends on the monitor domains that are activated for the user or device. Select a specific log file by moving the cursor over the file and pressing Enter. In Figure 2-28, we see the user resource consumption log for LNXSU1.
FCX173 CPU 2084 SER 96A3A BENCHMRK Log Data Perf. Monitor ______ . Userid Log File S Devnum Name Description . LNXSU1 UCOMMLOG User IUCV and VMCF communications log . LNXSU1 UPAGELOG User paging load log - LNXSU1 USERLOG User resource consumption log . LNXSU1 USTATLOG User wait state log . LNXSU3 UCOMMLOG User IUCV and VMCF communications log . LNXSU3 UPAGELOG User paging load log . LNXSU3 USERLOG User resource consumption log . LNXSU3 USTATLOG User wait state log . LNXSU4 UCOMMLOG User IUCV and VMCF communications log . LNXSU4 UPAGELOG User paging load log . LNXSU4 USERLOG User resource consumption log . LNXSU4 USTATLOG User wait state log . 1510 CACHDLOG I/O device CU cache data log . 1510 CACHELOG Extended function cache data log . 1510 CPOWNLOG CPOWNed I/O device log . 1510 DEVLOG General I/O device performance log Select a user or device log with cursor and hit ENTER Command ===> F1=Help F4=Top F5=Bot F7=Bkwd F8=Fwd F12=Return
Chapter 2. Navigating through Performance Toolkit for VM 57
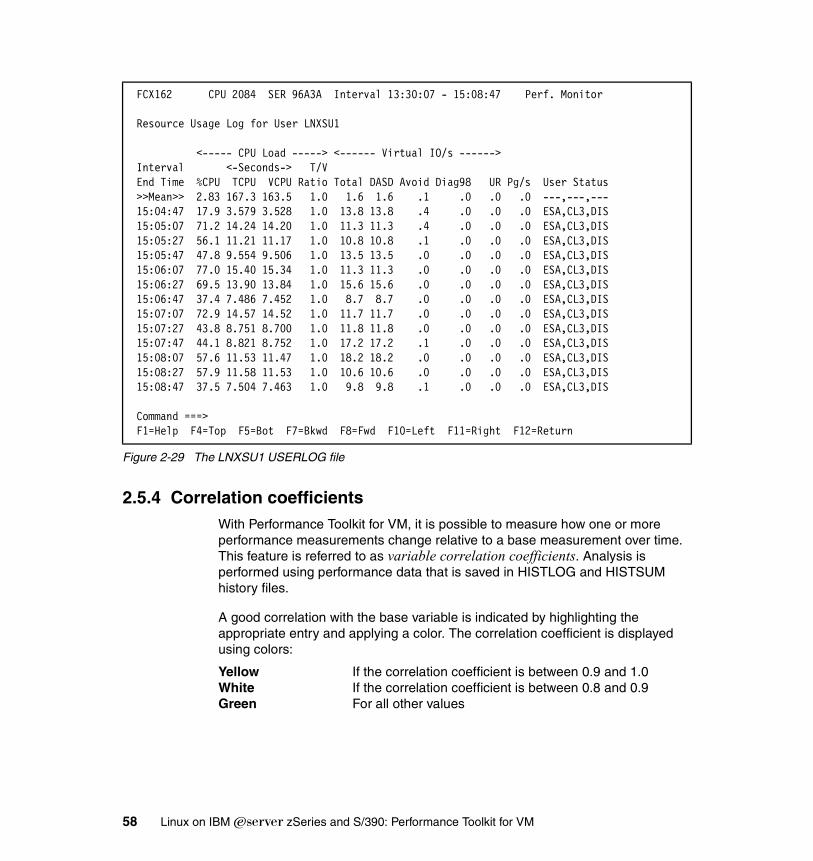
Figure 2-29 The LNXSU1 USERLOG file
2.5.4 Correlation coefficientsWith Performance Toolkit for VM, it is possible to measure how one or more performance measurements change relative to a base measurement over time. This feature is referred to as variable correlation coefficients. Analysis is performed using performance data that is saved in HISTLOG and HISTSUM history files.
A good correlation with the base variable is indicated by highlighting the appropriate entry and applying a color. The correlation coefficient is displayed using colors:
Yellow If the correlation coefficient is between 0.9 and 1.0White If the correlation coefficient is between 0.8 and 0.9Green For all other values
FCX162 CPU 2084 SER 96A3A Interval 13:30:07 - 15:08:47 Perf. Monitor Resource Usage Log for User LNXSU1 <----- CPU Load -----> <------ Virtual IO/s ------> Interval <-Seconds-> T/V End Time %CPU TCPU VCPU Ratio Total DASD Avoid Diag98 UR Pg/s User Status >>Mean>> 2.83 167.3 163.5 1.0 1.6 1.6 .1 .0 .0 .0 ---,---,--- 15:04:47 17.9 3.579 3.528 1.0 13.8 13.8 .4 .0 .0 .0 ESA,CL3,DIS 15:05:07 71.2 14.24 14.20 1.0 11.3 11.3 .4 .0 .0 .0 ESA,CL3,DIS 15:05:27 56.1 11.21 11.17 1.0 10.8 10.8 .1 .0 .0 .0 ESA,CL3,DIS 15:05:47 47.8 9.554 9.506 1.0 13.5 13.5 .0 .0 .0 .0 ESA,CL3,DIS 15:06:07 77.0 15.40 15.34 1.0 11.3 11.3 .0 .0 .0 .0 ESA,CL3,DIS 15:06:27 69.5 13.90 13.84 1.0 15.6 15.6 .0 .0 .0 .0 ESA,CL3,DIS 15:06:47 37.4 7.486 7.452 1.0 8.7 8.7 .0 .0 .0 .0 ESA,CL3,DIS 15:07:07 72.9 14.57 14.52 1.0 11.7 11.7 .0 .0 .0 .0 ESA,CL3,DIS 15:07:27 43.8 8.751 8.700 1.0 11.8 11.8 .0 .0 .0 .0 ESA,CL3,DIS 15:07:47 44.1 8.821 8.752 1.0 17.2 17.2 .1 .0 .0 .0 ESA,CL3,DIS 15:08:07 57.6 11.53 11.47 1.0 18.2 18.2 .0 .0 .0 .0 ESA,CL3,DIS 15:08:27 57.9 11.58 11.53 1.0 10.6 10.6 .0 .0 .0 .0 ESA,CL3,DIS 15:08:47 37.5 7.504 7.463 1.0 9.8 9.8 .1 .0 .0 .0 ESA,CL3,DIS Command ===> F1=Help F4=Top F5=Bot F7=Bkwd F8=Fwd F10=Left F11=Right F12=Return
58 Linux on IBM Eserver zSeries and S/390: Performance Toolkit for VM
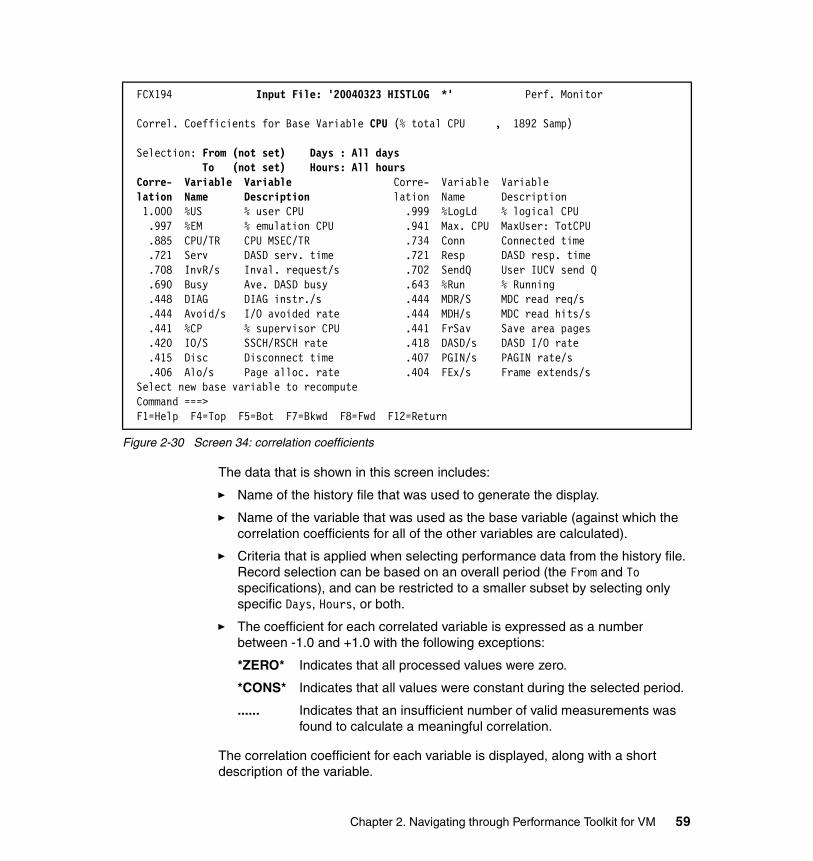
Figure 2-30 Screen 34: correlation coefficients
The data that is shown in this screen includes:
� Name of the history file that was used to generate the display.
� Name of the variable that was used as the base variable (against which the correlation coefficients for all of the other variables are calculated).
� Criteria that is applied when selecting performance data from the history file. Record selection can be based on an overall period (the From and To specifications), and can be restricted to a smaller subset by selecting only specific Days, Hours, or both.
� The coefficient for each correlated variable is expressed as a number between -1.0 and +1.0 with the following exceptions:
*ZERO* Indicates that all processed values were zero.
*CONS* Indicates that all values were constant during the selected period.
...... Indicates that an insufficient number of valid measurements was found to calculate a meaningful correlation.
The correlation coefficient for each variable is displayed, along with a short description of the variable.
FCX194 Input File: '20040323 HISTLOG *' Perf. Monitor Correl. Coefficients for Base Variable CPU (% total CPU , 1892 Samp) Selection: From (not set) Days : All days To (not set) Hours: All hours Corre- Variable Variable Corre- Variable Variable lation Name Description lation Name Description 1.000 %US % user CPU .999 %LogLd % logical CPU .997 %EM % emulation CPU .941 Max. CPU MaxUser: TotCPU .885 CPU/TR CPU MSEC/TR .734 Conn Connected time .721 Serv DASD serv. time .721 Resp DASD resp. time .708 InvR/s Inval. request/s .702 SendQ User IUCV send Q .690 Busy Ave. DASD busy .643 %Run % Running .448 DIAG DIAG instr./s .444 MDR/S MDC read req/s .444 Avoid/s I/O avoided rate .444 MDH/s MDC read hits/s .441 %CP % supervisor CPU .441 FrSav Save area pages .420 IO/S SSCH/RSCH rate .418 DASD/s DASD I/O rate .415 Disc Disconnect time .407 PGIN/s PAGIN rate/s .406 Alo/s Page alloc. rate .404 FEx/s Frame extends/s Select new base variable to recompute Command ===> F1=Help F4=Top F5=Bot F7=Bkwd F8=Fwd F12=Return
Chapter 2. Navigating through Performance Toolkit for VM 59
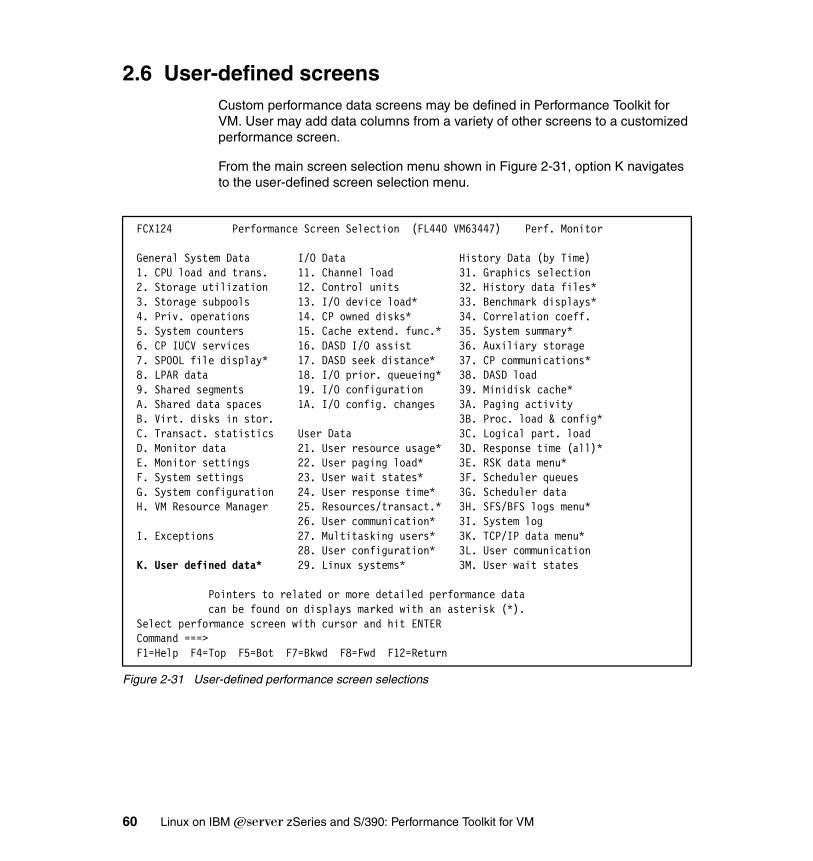
2.6 User-defined screensCustom performance data screens may be defined in Performance Toolkit for VM. User may add data columns from a variety of other screens to a customized performance screen.
From the main screen selection menu shown in Figure 2-31, option K navigates to the user-defined screen selection menu.
Figure 2-31 User-defined performance screen selections
FCX124 Performance Screen Selection (FL440 VM63447) Perf. Monitor General System Data I/O Data History Data (by Time) 1. CPU load and trans. 11. Channel load 31. Graphics selection 2. Storage utilization 12. Control units 32. History data files* 3. Storage subpools 13. I/O device load* 33. Benchmark displays* 4. Priv. operations 14. CP owned disks* 34. Correlation coeff. 5. System counters 15. Cache extend. func.* 35. System summary* 6. CP IUCV services 16. DASD I/O assist 36. Auxiliary storage 7. SPOOL file display* 17. DASD seek distance* 37. CP communications* 8. LPAR data 18. I/O prior. queueing* 38. DASD load 9. Shared segments 19. I/O configuration 39. Minidisk cache* A. Shared data spaces 1A. I/O config. changes 3A. Paging activity B. Virt. disks in stor. 3B. Proc. load & config* C. Transact. statistics User Data 3C. Logical part. load D. Monitor data 21. User resource usage* 3D. Response time (all)* E. Monitor settings 22. User paging load* 3E. RSK data menu* F. System settings 23. User wait states* 3F. Scheduler queues G. System configuration 24. User response time* 3G. Scheduler data H. VM Resource Manager 25. Resources/transact.* 3H. SFS/BFS logs menu* 26. User communication* 3I. System log I. Exceptions 27. Multitasking users* 3K. TCP/IP data menu* 28. User configuration* 3L. User communication K. User defined data* 29. Linux systems* 3M. User wait states Pointers to related or more detailed performance data can be found on displays marked with an asterisk (*). Select performance screen with cursor and hit ENTER Command ===> F1=Help F4=Top F5=Bot F7=Bkwd F8=Fwd F12=Return
60 Linux on IBM Eserver zSeries and S/390: Performance Toolkit for VM
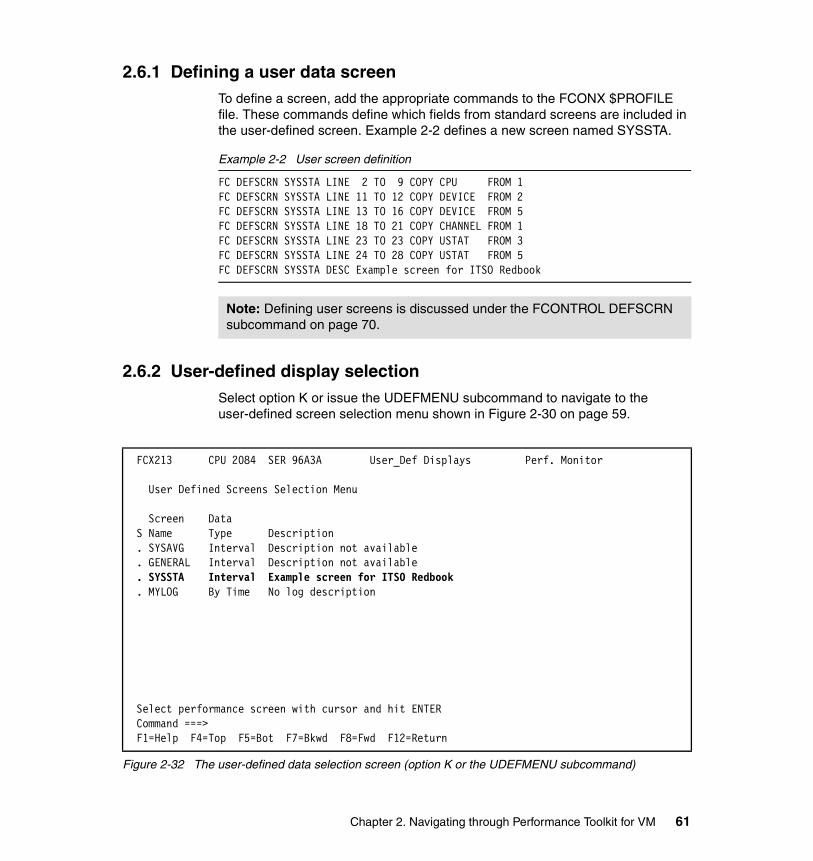
2.6.1 Defining a user data screenTo define a screen, add the appropriate commands to the FCONX $PROFILE file. These commands define which fields from standard screens are included in the user-defined screen. Example 2-2 defines a new screen named SYSSTA.
Example 2-2 User screen definition
FC DEFSCRN SYSSTA LINE 2 TO 9 COPY CPU FROM 1 FC DEFSCRN SYSSTA LINE 11 TO 12 COPY DEVICE FROM 2 FC DEFSCRN SYSSTA LINE 13 TO 16 COPY DEVICE FROM 5 FC DEFSCRN SYSSTA LINE 18 TO 21 COPY CHANNEL FROM 1 FC DEFSCRN SYSSTA LINE 23 TO 23 COPY USTAT FROM 3 FC DEFSCRN SYSSTA LINE 24 TO 28 COPY USTAT FROM 5 FC DEFSCRN SYSSTA DESC Example screen for ITSO Redbook
2.6.2 User-defined display selectionSelect option K or issue the UDEFMENU subcommand to navigate to the user-defined screen selection menu shown in Figure 2-30 on page 59.
Figure 2-32 The user-defined data selection screen (option K or the UDEFMENU subcommand)
Note: Defining user screens is discussed under the FCONTROL DEFSCRN subcommand on page 70.
FCX213 CPU 2084 SER 96A3A User_Def Displays Perf. Monitor User Defined Screens Selection Menu Screen Data S Name Type Description . SYSAVG Interval Description not available . GENERAL Interval Description not available . SYSSTA Interval Example screen for ITSO Redbook . MYLOG By Time No log description
Select performance screen with cursor and hit ENTER Command ===> F1=Help F4=Top F5=Bot F7=Bkwd F8=Fwd F12=Return
Chapter 2. Navigating through Performance Toolkit for VM 61
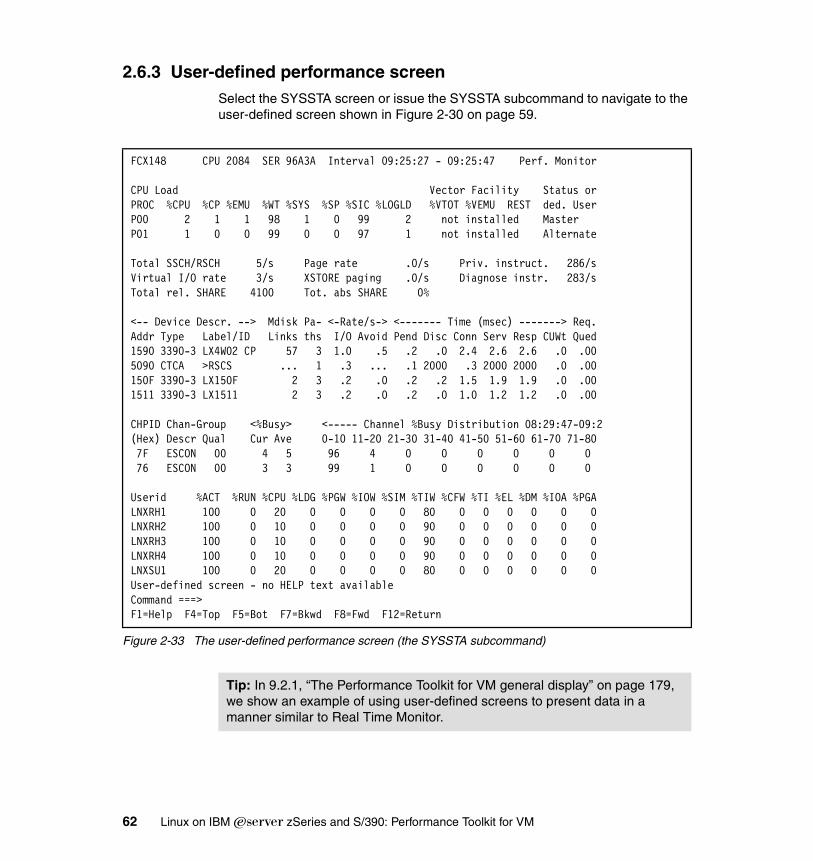
2.6.3 User-defined performance screenSelect the SYSSTA screen or issue the SYSSTA subcommand to navigate to the user-defined screen shown in Figure 2-30 on page 59.
Figure 2-33 The user-defined performance screen (the SYSSTA subcommand)
FCX148 CPU 2084 SER 96A3A Interval 09:25:27 - 09:25:47 Perf. Monitor CPU Load Vector Facility Status or PROC %CPU %CP %EMU %WT %SYS %SP %SIC %LOGLD %VTOT %VEMU REST ded. User P00 2 1 1 98 1 0 99 2 not installed Master P01 1 0 0 99 0 0 97 1 not installed Alternate Total SSCH/RSCH 5/s Page rate .0/s Priv. instruct. 286/s Virtual I/O rate 3/s XSTORE paging .0/s Diagnose instr. 283/s Total rel. SHARE 4100 Tot. abs SHARE 0% <-- Device Descr. --> Mdisk Pa- <-Rate/s-> <------- Time (msec) -------> Req. Addr Type Label/ID Links ths I/O Avoid Pend Disc Conn Serv Resp CUWt Qued 1590 3390-3 LX4W02 CP 57 3 1.0 .5 .2 .0 2.4 2.6 2.6 .0 .00 5090 CTCA >RSCS ... 1 .3 ... .1 2000 .3 2000 2000 .0 .00 150F 3390-3 LX150F 2 3 .2 .0 .2 .2 1.5 1.9 1.9 .0 .00 1511 3390-3 LX1511 2 3 .2 .0 .2 .0 1.0 1.2 1.2 .0 .00 CHPID Chan-Group <%Busy> <----- Channel %Busy Distribution 08:29:47-09:2(Hex) Descr Qual Cur Ave 0-10 11-20 21-30 31-40 41-50 51-60 61-70 71-80 7F ESCON 00 4 5 96 4 0 0 0 0 0 0 76 ESCON 00 3 3 99 1 0 0 0 0 0 0 Userid %ACT %RUN %CPU %LDG %PGW %IOW %SIM %TIW %CFW %TI %EL %DM %IOA %PGA LNXRH1 100 0 20 0 0 0 0 80 0 0 0 0 0 0 LNXRH2 100 0 10 0 0 0 0 90 0 0 0 0 0 0 LNXRH3 100 0 10 0 0 0 0 90 0 0 0 0 0 0 LNXRH4 100 0 10 0 0 0 0 90 0 0 0 0 0 0 LNXSU1 100 0 20 0 0 0 0 80 0 0 0 0 0 0 User-defined screen - no HELP text available Command ===> F1=Help F4=Top F5=Bot F7=Bkwd F8=Fwd F12=Return
Tip: In 9.2.1, “The Performance Toolkit for VM general display” on page 179, we show an example of using user-defined screens to present data in a manner similar to Real Time Monitor.
62 Linux on IBM Eserver zSeries and S/390: Performance Toolkit for VM
2.7 Using the Web interfaceThe Web interface of Performance Toolkit for VM is intended to provide a graphical user interface in a standard Web browser. This enables access to Performance Toolkit for VM with a minimum of prerequisites.
The interface is designed to work directly with the Store and Forward (S&F) logic implemented for APPC/VM data retrieval sessions. Any PERFSVM virtual machine that is configured as an S&F server can act as a Web server for Performance Toolkit for VM performance (provided it has access to TCP/IP). Web clients connect to such the Web server and receive response similar to the displays shown when connected using APPC/VM.
We discuss the Web interface for Performance Toolkit for VM in 4.3, “Performance Toolkit for VM Web interface” on page 95.
Note: In Chapter 4, “Remote access and monitoring” on page 89, we discuss how to implement the APPC interface to Performance Toolkit for VM.
Chapter 2. Navigating through Performance Toolkit for VM 63
64 Linux on IBM Eserver zSeries and S/390: Performance Toolkit for VM
Chapter 3. Configuring Performance Toolkit for VM
This chapter covers configuration of Performance Toolkit for VM. We discuss:
� Performance Toolkit for VM installation
� Performance Toolkit for VM control files
� Sample PROFILE EXEC for PERFSVM
� Performance Toolkit for VM operation
� Tailoring Performance Toolkit for VM
� Enabling remote access and monitoring
� Enabling data collection for Linux guests
3
© Copyright IBM Corp. 2004. All rights reserved. 65
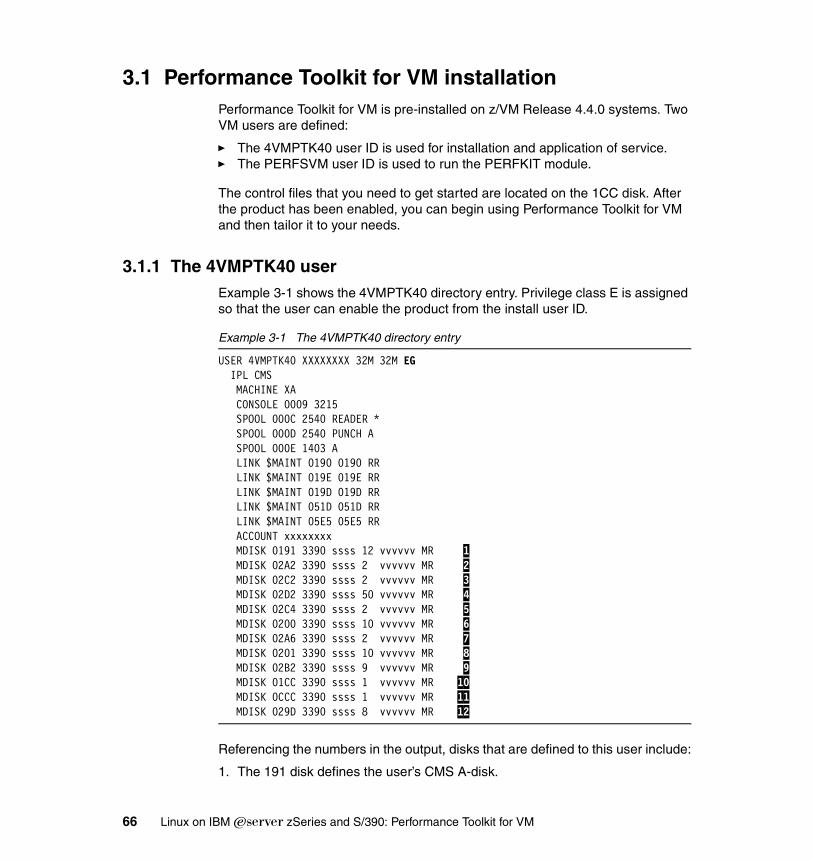
3.1 Performance Toolkit for VM installationPerformance Toolkit for VM is pre-installed on z/VM Release 4.4.0 systems. Two VM users are defined:
� The 4VMPTK40 user ID is used for installation and application of service. � The PERFSVM user ID is used to run the PERFKIT module.
The control files that you need to get started are located on the 1CC disk. After the product has been enabled, you can begin using Performance Toolkit for VM and then tailor it to your needs.
3.1.1 The 4VMPTK40 userExample 3-1 shows the 4VMPTK40 directory entry. Privilege class E is assigned so that the user can enable the product from the install user ID.
Example 3-1 The 4VMPTK40 directory entry
USER 4VMPTK40 XXXXXXXX 32M 32M EG IPL CMS MACHINE XA CONSOLE 0009 3215 SPOOL 000C 2540 READER * SPOOL 000D 2540 PUNCH A SPOOL 000E 1403 A LINK $MAINT 0190 0190 RR LINK $MAINT 019E 019E RR LINK $MAINT 019D 019D RR LINK $MAINT 051D 051D RR LINK $MAINT 05E5 05E5 RR ACCOUNT xxxxxxxx MDISK 0191 3390 ssss 12 vvvvvv MR 1 MDISK 02A2 3390 ssss 2 vvvvvv MR 2 MDISK 02C2 3390 ssss 2 vvvvvv MR 3 MDISK 02D2 3390 ssss 50 vvvvvv MR 4 MDISK 02C4 3390 ssss 2 vvvvvv MR 5 MDISK 0200 3390 ssss 10 vvvvvv MR 6 MDISK 02A6 3390 ssss 2 vvvvvv MR 7 MDISK 0201 3390 ssss 10 vvvvvv MR 8 MDISK 02B2 3390 ssss 9 vvvvvv MR 9 MDISK 01CC 3390 ssss 1 vvvvvv MR 10 MDISK 0CCC 3390 ssss 1 vvvvvv MR 11 MDISK 029D 3390 ssss 8 vvvvvv MR 12
Referencing the numbers in the output, disks that are defined to this user include:
1. The 191 disk defines the user’s CMS A-disk.
66 Linux on IBM Eserver zSeries and S/390: Performance Toolkit for VM
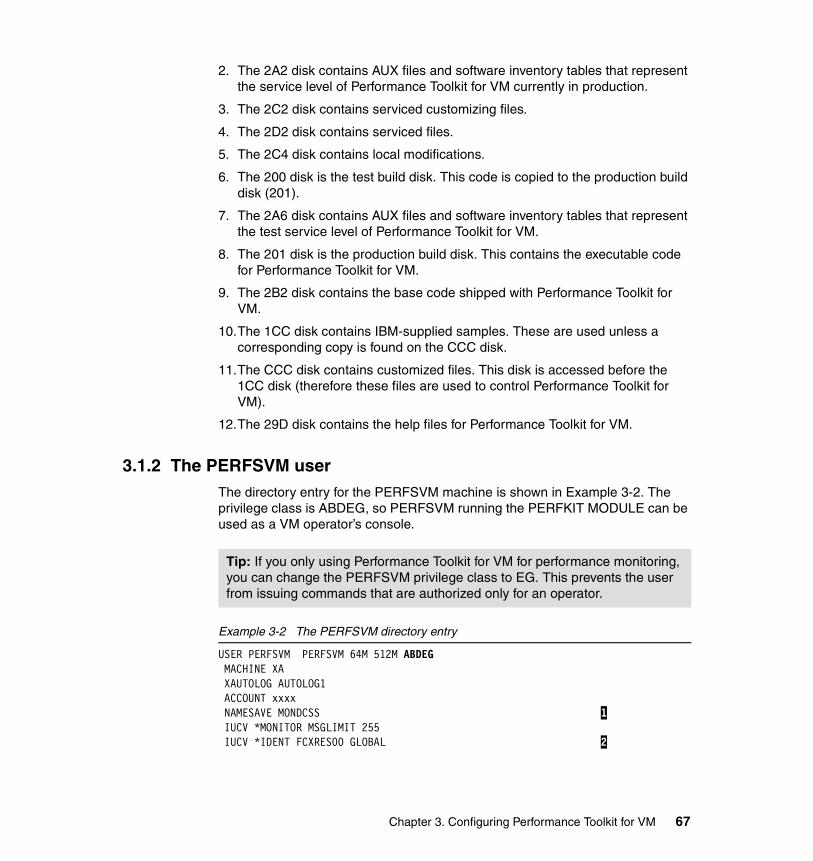
2. The 2A2 disk contains AUX files and software inventory tables that represent the service level of Performance Toolkit for VM currently in production.
3. The 2C2 disk contains serviced customizing files.
4. The 2D2 disk contains serviced files.
5. The 2C4 disk contains local modifications.
6. The 200 disk is the test build disk. This code is copied to the production build disk (201).
7. The 2A6 disk contains AUX files and software inventory tables that represent the test service level of Performance Toolkit for VM.
8. The 201 disk is the production build disk. This contains the executable code for Performance Toolkit for VM.
9. The 2B2 disk contains the base code shipped with Performance Toolkit for VM.
10.The 1CC disk contains IBM-supplied samples. These are used unless a corresponding copy is found on the CCC disk.
11.The CCC disk contains customized files. This disk is accessed before the 1CC disk (therefore these files are used to control Performance Toolkit for VM).
12.The 29D disk contains the help files for Performance Toolkit for VM.
3.1.2 The PERFSVM userThe directory entry for the PERFSVM machine is shown in Example 3-2. The privilege class is ABDEG, so PERFSVM running the PERFKIT MODULE can be used as a VM operator’s console.
Example 3-2 The PERFSVM directory entry
USER PERFSVM PERFSVM 64M 512M ABDEG MACHINE XA XAUTOLOG AUTOLOG1 ACCOUNT xxxx NAMESAVE MONDCSS 1 IUCV *MONITOR MSGLIMIT 255 IUCV *IDENT FCXRES00 GLOBAL 2
Tip: If you only using Performance Toolkit for VM for performance monitoring, you can change the PERFSVM privilege class to EG. This prevents the user from issuing commands that are authorized only for an operator.
Chapter 3. Configuring Performance Toolkit for VM 67
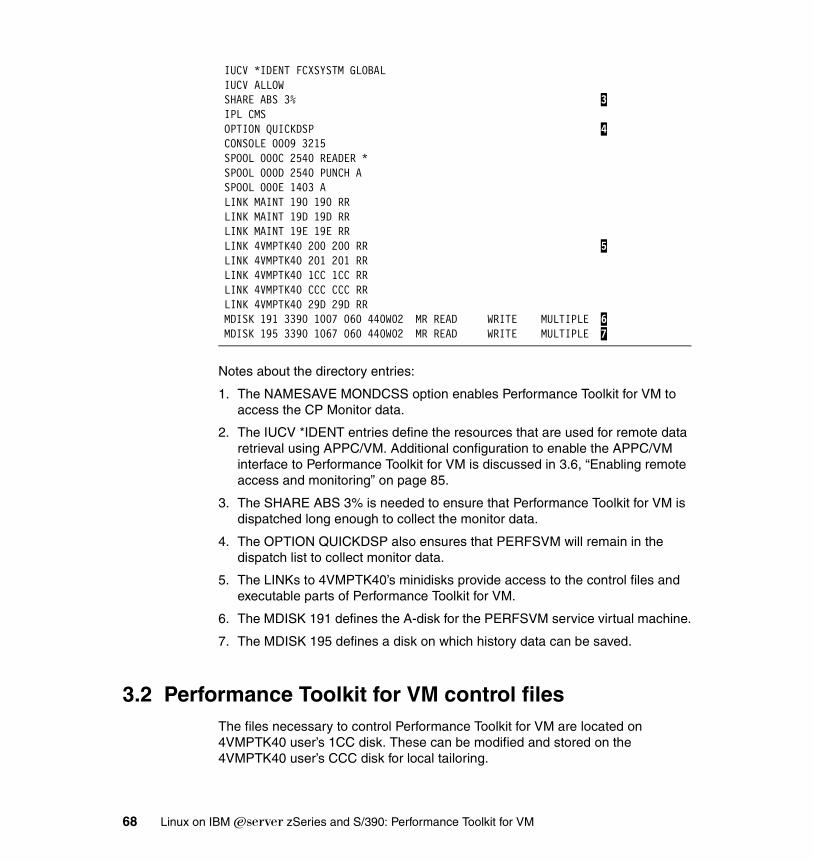
IUCV *IDENT FCXSYSTM GLOBAL IUCV ALLOW SHARE ABS 3% 3 IPL CMS OPTION QUICKDSP 4 CONSOLE 0009 3215 SPOOL 000C 2540 READER * SPOOL 000D 2540 PUNCH A SPOOL 000E 1403 A LINK MAINT 190 190 RR LINK MAINT 19D 19D RR LINK MAINT 19E 19E RR LINK 4VMPTK40 200 200 RR 5 LINK 4VMPTK40 201 201 RR LINK 4VMPTK40 1CC 1CC RR LINK 4VMPTK40 CCC CCC RR LINK 4VMPTK40 29D 29D RR MDISK 191 3390 1007 060 440W02 MR READ WRITE MULTIPLE 6 MDISK 195 3390 1067 060 440W02 MR READ WRITE MULTIPLE 7
Notes about the directory entries:
1. The NAMESAVE MONDCSS option enables Performance Toolkit for VM to access the CP Monitor data.
2. The IUCV *IDENT entries define the resources that are used for remote data retrieval using APPC/VM. Additional configuration to enable the APPC/VM interface to Performance Toolkit for VM is discussed in 3.6, “Enabling remote access and monitoring” on page 85.
3. The SHARE ABS 3% is needed to ensure that Performance Toolkit for VM is dispatched long enough to collect the monitor data.
4. The OPTION QUICKDSP also ensures that PERFSVM will remain in the dispatch list to collect monitor data.
5. The LINKs to 4VMPTK40’s minidisks provide access to the control files and executable parts of Performance Toolkit for VM.
6. The MDISK 191 defines the A-disk for the PERFSVM service virtual machine.
7. The MDISK 195 defines a disk on which history data can be saved.
3.2 Performance Toolkit for VM control filesThe files necessary to control Performance Toolkit for VM are located on 4VMPTK40 user’s 1CC disk. These can be modified and stored on the 4VMPTK40 user’s CCC disk for local tailoring.
68 Linux on IBM Eserver zSeries and S/390: Performance Toolkit for VM
3.2.1 FCONX $PROFILEThe FCONX $PROFILE file contains Performance Toolkit for VM commands to set up and control Performance Toolkit for VM operation. These commands may be entered directly on the command line or from the FCONX $PROFILE.
Descriptions of Performance Toolkit for VM commands are found in z/VM: Performance Toolkit, SC24-6062. The sample FCONX $PROFILE that is distributed with Performance Toolkit for VM is shown in “The sample FCONX $PROFILE” on page 212.
The FCONTROL subcommandPerformance Toolkit for VM can be tailored using the FCONTROL subcommand. Changes are typically added to the FCONX $PROFILE control file. Options to the FCONTROL subcommand (abbreviated as FC) include:
� ACTMSG
This defines the number of CP action messages that are left pending at the top of the screen. For details about Performance Toolkit for VM screen layout, see 1.3, “Basic mode” on page 5.
� BENCHMRK
This identifies devices or users for which detailed by-time logs are constructed (known as benchmarked). To get benchmark data for device 550 and user PERFSVM, use:
FC BENCHMRK DEVICE 550 FILE 08:00 TO 17:00FC BENCHMRK USER PERFSVM
For more about using benchmark performance data, see 1.9, “Benchmark data analysis” on page 16.
� COLOR
This specifies extended color and highlighting for fields that are displayed by Performance Toolkit for VM. Allowed colors include:
– BLUE– RED– PINK– GREEN– TURQUOIS– YELLOW– WHITE
Note: Benchmark files take additional space on the PERFSVM 191 disk.
Chapter 3. Configuring Performance Toolkit for VM 69
BLINK, REVVIDEO, and UNDERLINE may also be specified for each color. For example, to set the input area to white with underlining, use:
FC COLOR INAREA WHITE UNDER
� DEFLOG
This defines a new performance log screen based on fields from existing performance display screens. For example, to create a new data log named Sample consisting of six columns from the standard SYSTEM display, use:
FC DEFLOG MYLOG H1 Sample log with some fields copied from SYSTEM screenFC DEFLOG MYLOG COL 12 LEN 5 COPY SYSTEM LINE 12 COL 34 NAME SieExFC DEFLOG MYLOG COL 18 LEN 5 COPY SYSTEM LINE 12 COL 75 NAME SieInterFC DEFLOG MYLOG COL 25 LEN 13 COPY SYSTEM LINE 25 COL 67 NAME <-N0XSTOR>FC DEFLOG MYLOG COL 39 LEN 13 COPY SYSTEM LINE 26 COL 26 NAME <-X-Aloc->FC DEFLOG MYLOG COL 53 LEN 13 COPY SYSTEM LINE 26 COL 67 NAME <XST-Rel>FC DEFLOG MYLOG COL 67 LEN 13 COPY SYSTEM LINE 18 COL 26 NAME <AV_L_Req>
� DEFSCRN
This defines a new performance screen using parts of other screens. For example, to create a display named SYSTSUM consisting of six fields (one from the CPU display, two from the DEVICE display, one from the CHANNEL display, and two from the USER display), use:
FC DEFSCRN SYSTSUM LINE 1 ‘General System Data’FC DEFSCRN SYSTSUM LINE 2 TO 9 COPY CPU FROM 1FC DEFSCRN SYSTSUM LINE 11 TO 12 COPY DEVICE FROM 2FC DEFSCRN SYSTSUM LINE 13 TO 16 COPY DEVICE FROM 5FC DEFSCRN SYSTSUM LINE 18 TO 21 COPY CHANNEL FROM 1FC DEFSCRN SYSTSUM LINE 23 TO 23 COPY USER FROM 4FC DEFSCRN SYSTSUM LINE 24 TO 27 COPY USER FROM 6
� GDDMSPEC
This defines colors and patterns for Graphical Data Display Manager (GDDM) graphs. For example, to customize the four available Y-axis variables, use:
FC GDDMSPEC VAR1 COL YELLOW PAT 5FC GDDMSPEC VAR2 COL TURQUOIS PAT 14FC GDDMSPEC VAR3 COL ORANGE PAT 12FC GDDMSPEC VAR4 COL GREEN PAT 9
For details about using GDDM graphics, see 2.5.1, “Graphics selection” on page 51.
Note: If GDDM is not installed, simple plots are displayed. Graphics are also available from the Web interface and do not require GDDM.
70 Linux on IBM Eserver zSeries and S/390: Performance Toolkit for VM
� MONCOLL
This provides options to control monitor data collection:
– REDISP sets the number of lines that are reserved during initialization for use as performance redisplay buffer. For example, to reserve 720 lines for the redisplay buffer, use:
FC MONCOLL REDISP 720
– CPMON controls whether the monitor data is collected from the MONDCSS buffer or from disk. For example, to indicate that performance data is to be read from the MONFILE DATA file on the 191 B-disk, use:
FC MONCOLL CPMON DISK ON MONWRITE 191 B MONFILE DATA
For details about how Performance Toolkit for VM collects monitor records, see “VM Monitor facility overview” on page 206.
– RESET specifies the time of the day Performance Toolkit for VM resets data and optionally creates printed reports and trend data. For example, to reset system counters at midnight, 08:30, 11:30, 13:30, and 16:30, use:
FC MONCOLL RESET 00:00 08:30 11:30 13:30 16:30
– PERFLOG controls disposition of general performance data from the REDISP or REDHIST displays. For example, to save performance data written to the redisplay screen between the hours of 06:00 and 19:59 to disk, use:
FC MONCOLL PERFLOG ON 06:00 19:59
– VMCF activates the Virtual Machine Communication Facility (VMCF) interface that allows other users to view data from the PERFSVM machine. For example, to enable VMCF, use:
FC MONCOLL VMCF ON
For details on using the VMCF interface, see Chapter 4, “Remote access and monitoring” on page 89.
– WEBSERV controls access to the PERFSVM virtual machine from the Internet. It defines the TCP/IP machine, TCP/IP port number, and user validation method used for Web access. For example, to activate the Web
Note: Data is written to disk using the MONWRITE utility.
Note: Data is saved to a file name of the form mmddyy PERFLOG A. Up to three versions of the file are retained, using filetypes PREFLOG, PERFLOG1, and PERFLOG2.
Chapter 3. Configuring Performance Toolkit for VM 71
Server function using TCP/IP port 81 with RACF® user authentication, use:
FC MONCOLL WEBSERV ON TCPIP TCPIP 81 IDTEST RACF
For details, see 4.3, “Performance Toolkit for VM Web interface” on page 95.
� FORCEUSR
This provides the ability to detect and optionally handle users who may be looping and therefore expending excessive system resources. For example, to exclude the users OP, VTAM®*, VSCS*, RACF, and RSCS from being monitored and forced off, use:
FC FORCEUSR EXCLUDE OP VTAM* VSCS* RACF RSCS
� LIMIT
This defines thresholds for performance indicators. Messages are issued when these limits are exceeded (providing a warning that there may be performance problems on your system). For example, to set a threshold for normalized CPU load to 90% in a one-minute interval, use:
FC LIMIT NORMCPU 90 1/1 5/10 WEIGHT 1
For details about threshold monitoring, see 1.10, “Threshold monitoring” on page 17.
� MAINTID
This specifies the user ID to receive dumps in case of an abend of the PERFKIT module. For example, to send a dump to the MAINT user on VM system MYNODE, use:
FC MAINTID MAINT AT MYNODE
� MAXREC
This defines the number of records that are written to the CONLOG before issuing an intermediate close. The CONLOG may be incomplete after a VM system restart. For example, to retain 12 records in the CONLOG, use:
FC MAXREC 12
Note: Care must be taken when using this capability. You could force a user ID that is needed for system operation such as RSCS. Or you could force a user and cause a loss of data.
Note: Setting this value too low increases general overhead because the I/O will be done more frequently.
72 Linux on IBM Eserver zSeries and S/390: Performance Toolkit for VM
� MINPATHS
This defines the minimum number of channel paths to be active to selected I/O devices. A warning message is issued if the number of paths falls below this number. For example, to set the minimum channel paths to 2 for devices 600 through 61F, use:
FC MINPATHS 2 TO 600-61F LIMIT 0/60 WEIGHT 10
� MONCACHE
This defines the expected cache status for selected disks. A warning message is issued when the current status does not match the expected status. The status field in the CACHEXT display is set to red with reverse video to highlight the problem. For example, to activate general cache status and deactivate DASD fast write status for devices 720 through 724, use:
FC MONCACHE 720-724 AD* LIMIT 0/60 WEIGHT 10
� MSGCLEAR
This specifies whether CP and Performance Toolkit for VM messages are to be kept on the display when the screen is cleared by the CP CLEAR command, CLEAR PF-key, or PA2-key. For example, to clear all messages use:
FC MSGCLEAR ALL
� MSGWAIT
This specifies how many minutes a message to the operator is left pending before additional notification is given. For example, to define a five-minute delay, use:
FC MSGWAIT 5
� NUMBERS
This controls whether line numbers are to be shown on the left of the operators screen. For example, to disable line numbers, use:
FC NUMBERS OFF
� PFKEY
This defines program function keys for basic mode and performance monitor mode. For example, to define the HELP command to the PF1 key, use:
FC PFKEY SET 1 FUNCTION HELP
� PROCESS
This enables special processing for VM and Performance Toolkit for VM messages. Messages can be ignored and not displayed, be re-routed to another virtual machine, or cause a program to be stacked for execution. For
Chapter 3. Configuring Performance Toolkit for VM 73
example, to process all CP messages from the RSCS service machine by displaying the message without the header, use:
FC PROCESS CPMSG * ‘FROM RSCS’ DISP CPMSGN
See z/VM: Performance Toolkit, SC24-6062 for more details.
� RMTLINES
This controls the number of data lines that are retrieved in remote performance data mode. For example, to retrieve 50 lines, use:
FC RMTLINES 50
� SCROLL
This changes the timing for the basic mode console scrolling. For example, to scroll when 12 lines are received, use:
FC SCROLL AUTO 12
� SEARCH
This defines the command search order that is used when a non-Performance Toolkit for VM command is entered without a CP or CMS prefix. For example, to search CP first then search CMS, use:
FC SEARCH CPCMS
� SECUSER
This tells Performance Toolkit for VM to act as a secondary console for another virtual machine. For example, to disable the secondary console function, use:
FC SECUSER OFF
� SETEVENT
This enables execution of timer-driven events. It is primarily intended to help in automating tasks that are related to the PERFSVM machine. For example, to send a message to yourself at noon on weekdays, use:
FC SETEVENT M-F 12:00 CP MSG * It is now 12:00h
� SETTINGS
This controls the defaults for collection and identification of history and for by-time performance data. For example, to change the system name on your reports, use:
FC SETTINGS SYSTEM This is a performance report for system XYZ
74 Linux on IBM Eserver zSeries and S/390: Performance Toolkit for VM
� UCLASS
This enables groups of users for which separate averages are calculated to be defined. For example, to include your Linux machines in a class called LINUX, use:
FC UCLASS LNX* LINUX
� UPDTCMS
This determines how the screen is updated when a CMS command is executed. For example, to only update the screen after a CMS command has ended, use:
FC UPDTCMS DELAYED
� UPDTSCRN
This specifies whether console output lines are unstacked and inserted into the basic mode screen in any mode or only in basic mode. For example, to have PERFKIT unstack console output no matter what mode you are in, use:
FC UPDTSCRN ANYMODE
� USERBOTL
This defines the bottom line of the basic mode screen or the initial FCONRMT screen. For example, to change the line to just use Fn for function keys, use:
FC USERBOTL BASIC F1:Help F2:Redisplay F3:Quit F12:Return
� USERHDR
This defines the top line that is displayed when no other commands or displays need to overlay it:
FC USERHDR Performance Toolkit for VM
� USERVAR
This enables definition of variables based on performance data fields for use in graphics or plots. For example, to create a variable called USERCP to display CP overhead that can be attributed to a user, use:
FC USERVAR SET ESA USERCP = %CP - %SY.
� USRLIMIT
This enables you to set thresholds for user resource consumption, and optionally reduce the offending user’s relative share automatically:
FC USRLIMIT * %CPU 30 5/10 WEIGHT 10
Additional commands to customize performance dataA set of commands is included as comments at the end of the FCONX $PROFILE that can be used to set the sort order for several commonly used displays. These are shown in Figure 3-1 on page 76.
Chapter 3. Configuring Performance Toolkit for VM 75
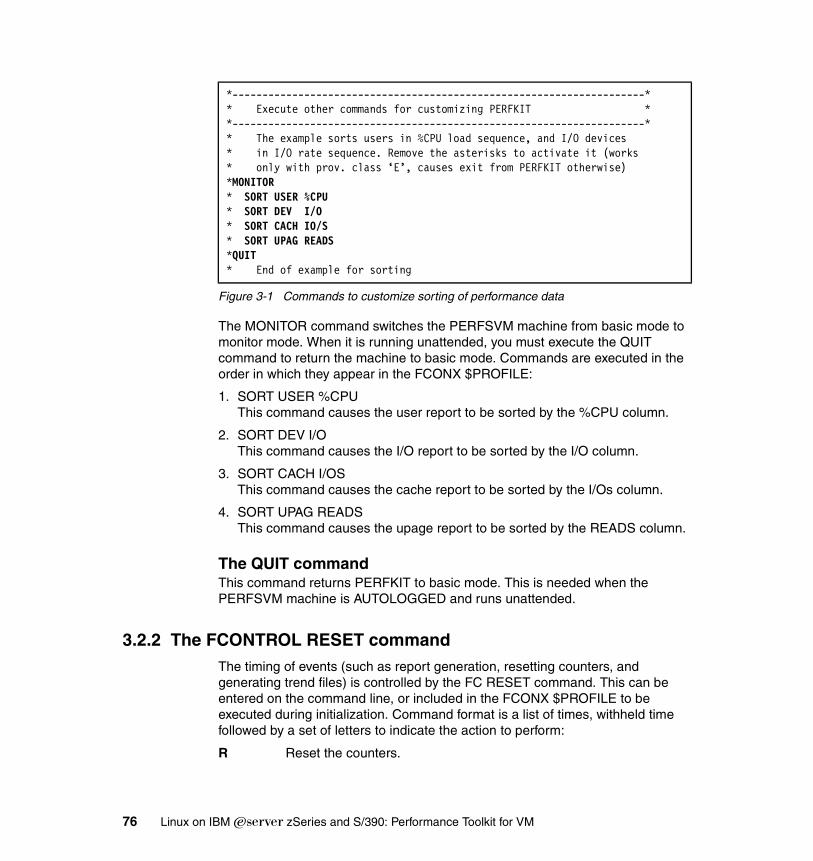
Figure 3-1 Commands to customize sorting of performance data
The MONITOR command switches the PERFSVM machine from basic mode to monitor mode. When it is running unattended, you must execute the QUIT command to return the machine to basic mode. Commands are executed in the order in which they appear in the FCONX $PROFILE:
1. SORT USER %CPU This command causes the user report to be sorted by the %CPU column.
2. SORT DEV I/O This command causes the I/O report to be sorted by the I/O column.
3. SORT CACH I/OS This command causes the cache report to be sorted by the I/Os column.
4. SORT UPAG READS This command causes the upage report to be sorted by the READS column.
The QUIT commandThis command returns PERFKIT to basic mode. This is needed when the PERFSVM machine is AUTOLOGGED and runs unattended.
3.2.2 The FCONTROL RESET commandThe timing of events (such as report generation, resetting counters, and generating trend files) is controlled by the FC RESET command. This can be entered on the command line, or included in the FCONX $PROFILE to be executed during initialization. Command format is a list of times, withheld time followed by a set of letters to indicate the action to perform:
R Reset the counters.
*---------------------------------------------------------------------** Execute other commands for customizing PERFKIT **---------------------------------------------------------------------** The example sorts users in %CPU load sequence, and I/O devices* in I/O rate sequence. Remove the asterisks to activate it (works* only with prov. class ‘E’, causes exit from PERFKIT otherwise)*MONITOR* SORT USER %CPU* SORT DEV I/O* SORT CACH IO/S* SORT UPAG READS*QUIT* End of example for sorting
76 Linux on IBM Eserver zSeries and S/390: Performance Toolkit for VM
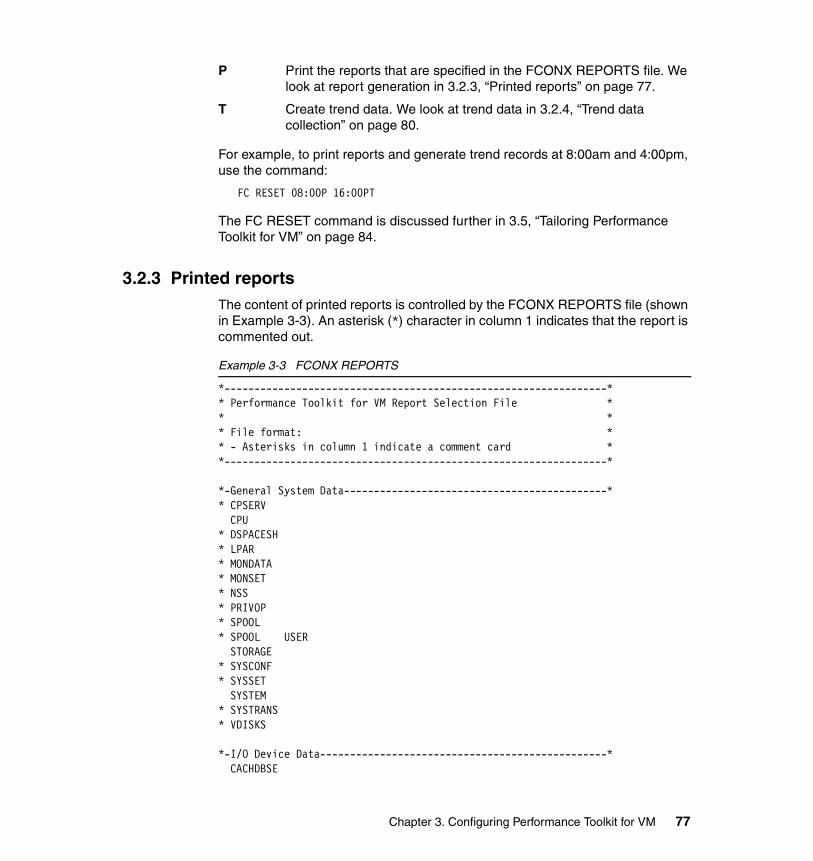
P Print the reports that are specified in the FCONX REPORTS file. We look at report generation in 3.2.3, “Printed reports” on page 77.
T Create trend data. We look at trend data in 3.2.4, “Trend data collection” on page 80.
For example, to print reports and generate trend records at 8:00am and 4:00pm, use the command:
FC RESET 08:00P 16:00PT
The FC RESET command is discussed further in 3.5, “Tailoring Performance Toolkit for VM” on page 84.
3.2.3 Printed reportsThe content of printed reports is controlled by the FCONX REPORTS file (shown in Example 3-3). An asterisk (*) character in column 1 indicates that the report is commented out.
Example 3-3 FCONX REPORTS
*----------------------------------------------------------------** Performance Toolkit for VM Report Selection File ** ** File format: ** - Asterisks in column 1 indicate a comment card **----------------------------------------------------------------*
*-General System Data--------------------------------------------** CPSERV CPU* DSPACESH* LPAR* MONDATA* MONSET* NSS* PRIVOP* SPOOL* SPOOL USER STORAGE* SYSCONF* SYSSET SYSTEM* SYSTRANS* VDISKS
*-I/O Device Data------------------------------------------------* CACHDBSE
Chapter 3. Configuring Performance Toolkit for VM 77
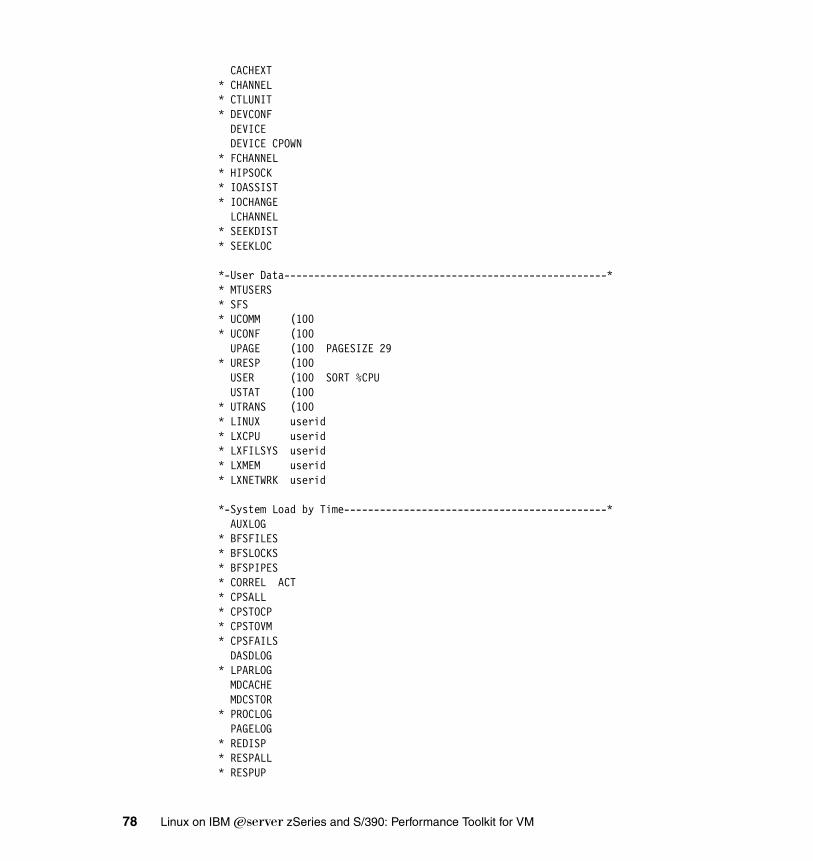
CACHEXT* CHANNEL* CTLUNIT* DEVCONF DEVICE DEVICE CPOWN* FCHANNEL* HIPSOCK* IOASSIST* IOCHANGE LCHANNEL* SEEKDIST* SEEKLOC
*-User Data------------------------------------------------------** MTUSERS* SFS* UCOMM (100* UCONF (100 UPAGE (100 PAGESIZE 29* URESP (100 USER (100 SORT %CPU USTAT (100* UTRANS (100* LINUX userid* LXCPU userid* LXFILSYS userid* LXMEM userid* LXNETWRK userid
*-System Load by Time--------------------------------------------* AUXLOG* BFSFILES* BFSLOCKS* BFSPIPES* CORREL ACT* CPSALL* CPSTOCP* CPSTOVM* CPSFAILS DASDLOG* LPARLOG MDCACHE MDCSTOR* PROCLOG PAGELOG* REDISP* RESPALL* RESPUP
78 Linux on IBM Eserver zSeries and S/390: Performance Toolkit for VM
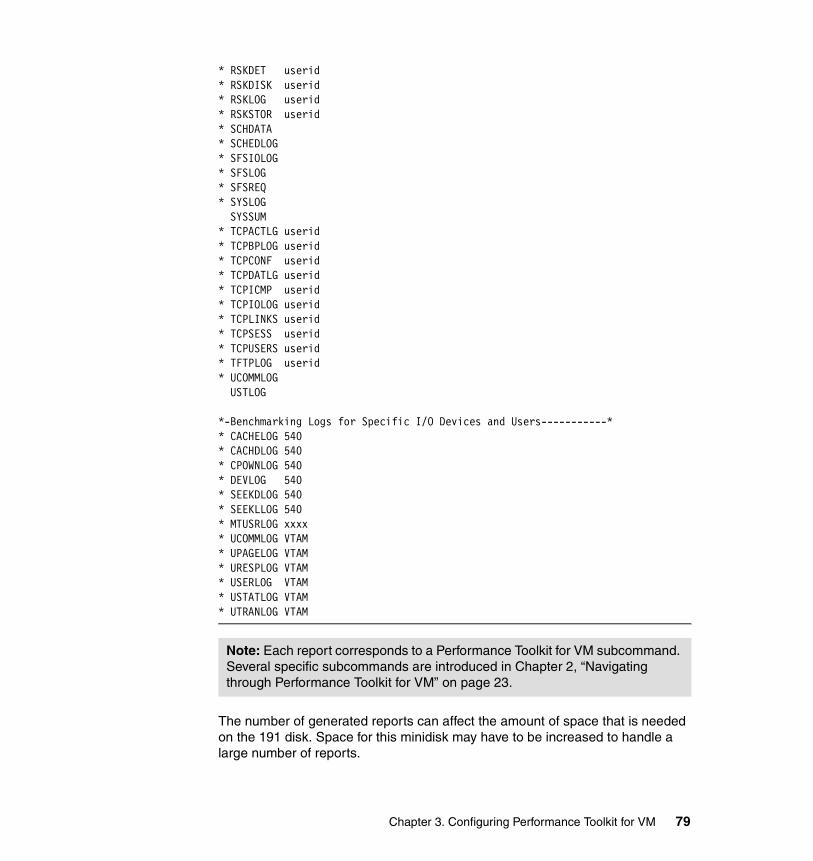
* RSKDET userid* RSKDISK userid* RSKLOG userid* RSKSTOR userid* SCHDATA* SCHEDLOG* SFSIOLOG* SFSLOG* SFSREQ* SYSLOG SYSSUM* TCPACTLG userid* TCPBPLOG userid* TCPCONF userid* TCPDATLG userid* TCPICMP userid* TCPIOLOG userid* TCPLINKS userid* TCPSESS userid* TCPUSERS userid* TFTPLOG userid* UCOMMLOG USTLOG
*-Benchmarking Logs for Specific I/O Devices and Users-----------** CACHELOG 540* CACHDLOG 540* CPOWNLOG 540* DEVLOG 540* SEEKDLOG 540* SEEKLLOG 540* MTUSRLOG xxxx* UCOMMLOG VTAM* UPAGELOG VTAM* URESPLOG VTAM* USERLOG VTAM* USTATLOG VTAM* UTRANLOG VTAM
The number of generated reports can affect the amount of space that is needed on the 191 disk. Space for this minidisk may have to be increased to handle a large number of reports.
Note: Each report corresponds to a Performance Toolkit for VM subcommand. Several specific subcommands are introduced in Chapter 2, “Navigating through Performance Toolkit for VM” on page 23.
Chapter 3. Configuring Performance Toolkit for VM 79
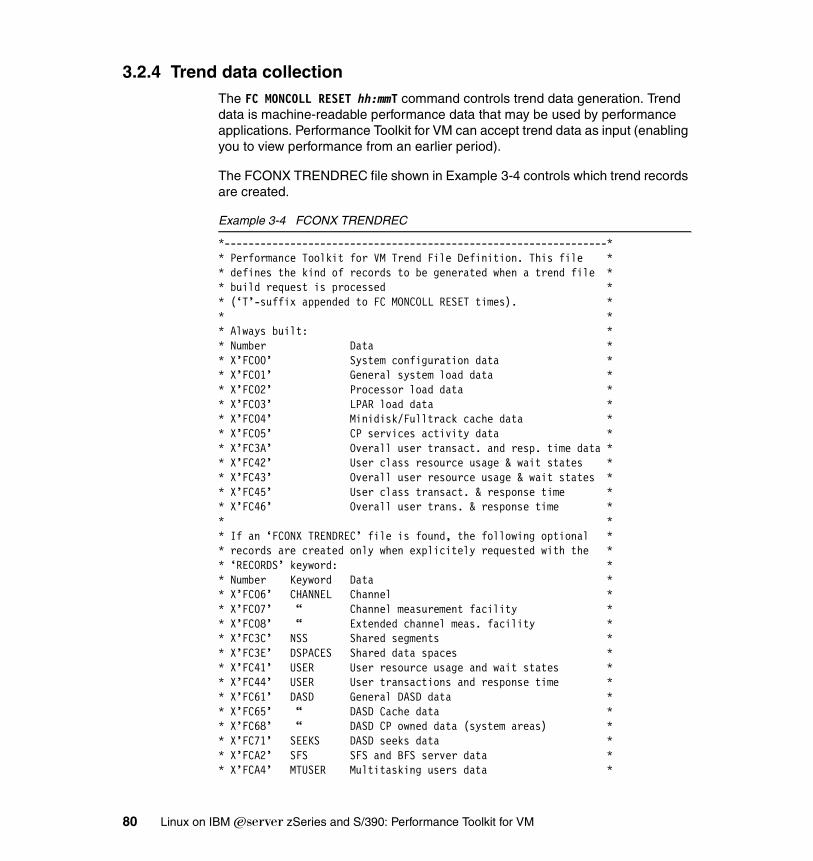
3.2.4 Trend data collectionThe FC MONCOLL RESET hh:mmT command controls trend data generation. Trend data is machine-readable performance data that may be used by performance applications. Performance Toolkit for VM can accept trend data as input (enabling you to view performance from an earlier period).
The FCONX TRENDREC file shown in Example 3-4 controls which trend records are created.
Example 3-4 FCONX TRENDREC
*----------------------------------------------------------------** Performance Toolkit for VM Trend File Definition. This file ** defines the kind of records to be generated when a trend file ** build request is processed ** (‘T’-suffix appended to FC MONCOLL RESET times). ** ** Always built: ** Number Data ** X’FC00’ System configuration data ** X’FC01’ General system load data ** X’FC02’ Processor load data ** X’FC03’ LPAR load data ** X’FC04’ Minidisk/Fulltrack cache data ** X’FC05’ CP services activity data ** X’FC3A’ Overall user transact. and resp. time data ** X’FC42’ User class resource usage & wait states ** X’FC43’ Overall user resource usage & wait states ** X’FC45’ User class transact. & response time ** X’FC46’ Overall user trans. & response time ** ** If an ‘FCONX TRENDREC’ file is found, the following optional ** records are created only when explicitely requested with the ** ‘RECORDS’ keyword: ** Number Keyword Data ** X’FC06’ CHANNEL Channel ** X’FC07’ “ Channel measurement facility ** X’FC08’ “ Extended channel meas. facility ** X’FC3C’ NSS Shared segments ** X’FC3E’ DSPACES Shared data spaces ** X’FC41’ USER User resource usage and wait states ** X’FC44’ USER User transactions and response time ** X’FC61’ DASD General DASD data ** X’FC65’ “ DASD Cache data ** X’FC68’ “ DASD CP owned data (system areas) ** X’FC71’ SEEKS DASD seeks data ** X’FCA2’ SFS SFS and BFS server data ** X’FCA4’ MTUSER Multitasking users data *
80 Linux on IBM Eserver zSeries and S/390: Performance Toolkit for VM
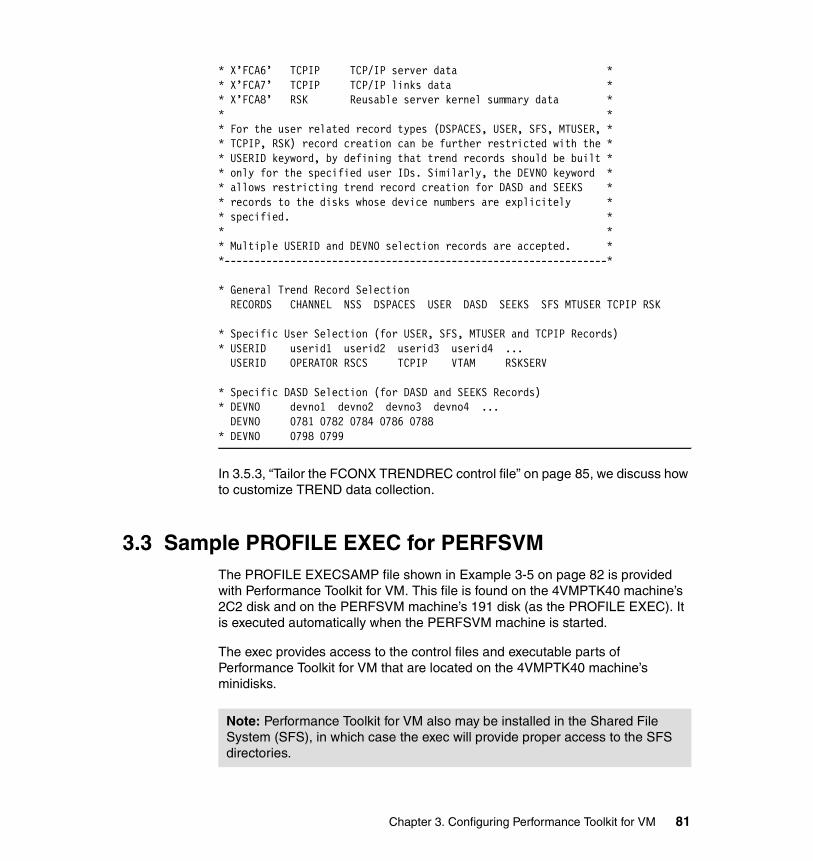
* X’FCA6’ TCPIP TCP/IP server data ** X’FCA7’ TCPIP TCP/IP links data ** X’FCA8’ RSK Reusable server kernel summary data ** ** For the user related record types (DSPACES, USER, SFS, MTUSER, ** TCPIP, RSK) record creation can be further restricted with the ** USERID keyword, by defining that trend records should be built ** only for the specified user IDs. Similarly, the DEVNO keyword ** allows restricting trend record creation for DASD and SEEKS ** records to the disks whose device numbers are explicitely ** specified. ** ** Multiple USERID and DEVNO selection records are accepted. **----------------------------------------------------------------*
* General Trend Record Selection RECORDS CHANNEL NSS DSPACES USER DASD SEEKS SFS MTUSER TCPIP RSK
* Specific User Selection (for USER, SFS, MTUSER and TCPIP Records)* USERID userid1 userid2 userid3 userid4 ... USERID OPERATOR RSCS TCPIP VTAM RSKSERV
* Specific DASD Selection (for DASD and SEEKS Records)* DEVNO devno1 devno2 devno3 devno4 ... DEVNO 0781 0782 0784 0786 0788* DEVNO 0798 0799
In 3.5.3, “Tailor the FCONX TRENDREC control file” on page 85, we discuss how to customize TREND data collection.
3.3 Sample PROFILE EXEC for PERFSVMThe PROFILE EXECSAMP file shown in Example 3-5 on page 82 is provided with Performance Toolkit for VM. This file is found on the 4VMPTK40 machine’s 2C2 disk and on the PERFSVM machine’s 191 disk (as the PROFILE EXEC). It is executed automatically when the PERFSVM machine is started.
The exec provides access to the control files and executable parts of Performance Toolkit for VM that are located on the 4VMPTK40 machine’s minidisks.
Note: Performance Toolkit for VM also may be installed in the Shared File System (SFS), in which case the exec will provide proper access to the SFS directories.
Chapter 3. Configuring Performance Toolkit for VM 81
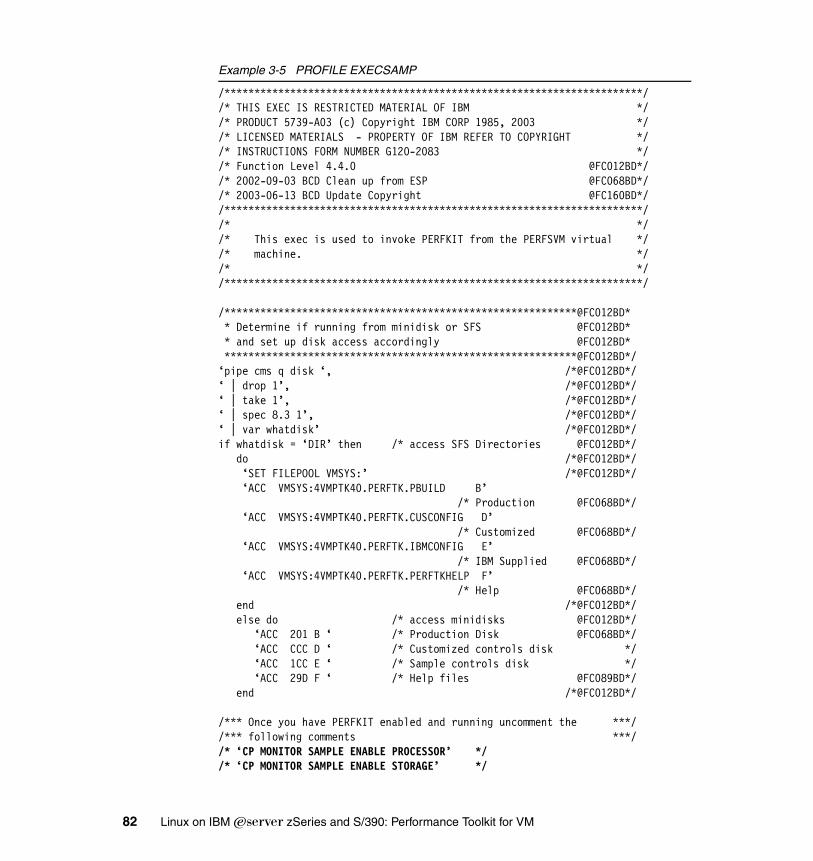
Example 3-5 PROFILE EXECSAMP
/**********************************************************************//* THIS EXEC IS RESTRICTED MATERIAL OF IBM *//* PRODUCT 5739-A03 (c) Copyright IBM CORP 1985, 2003 *//* LICENSED MATERIALS - PROPERTY OF IBM REFER TO COPYRIGHT *//* INSTRUCTIONS FORM NUMBER G120-2083 *//* Function Level 4.4.0 @FC012BD*//* 2002-09-03 BCD Clean up from ESP @FC068BD*//* 2003-06-13 BCD Update Copyright @FC160BD*//**********************************************************************//* *//* This exec is used to invoke PERFKIT from the PERFSVM virtual *//* machine. *//* *//**********************************************************************/
/***********************************************************@FC012BD* * Determine if running from minidisk or SFS @FC012BD* * and set up disk access accordingly @FC012BD* ***********************************************************@FC012BD*/‘pipe cms q disk ‘, /*@FC012BD*/‘ | drop 1’, /*@FC012BD*/‘ | take 1’, /*@FC012BD*/‘ | spec 8.3 1’, /*@FC012BD*/‘ | var whatdisk’ /*@FC012BD*/if whatdisk = ‘DIR’ then /* access SFS Directories @FC012BD*/ do /*@FC012BD*/ ‘SET FILEPOOL VMSYS:’ /*@FC012BD*/ ‘ACC VMSYS:4VMPTK40.PERFTK.PBUILD B’ /* Production @FC068BD*/ ‘ACC VMSYS:4VMPTK40.PERFTK.CUSCONFIG D’ /* Customized @FC068BD*/ ‘ACC VMSYS:4VMPTK40.PERFTK.IBMCONFIG E’ /* IBM Supplied @FC068BD*/ ‘ACC VMSYS:4VMPTK40.PERFTK.PERFTKHELP F’ /* Help @FC068BD*/ end /*@FC012BD*/ else do /* access minidisks @FC012BD*/ ‘ACC 201 B ‘ /* Production Disk @FC068BD*/ ‘ACC CCC D ‘ /* Customized controls disk */ ‘ACC 1CC E ‘ /* Sample controls disk */ ‘ACC 29D F ‘ /* Help files @FC089BD*/ end /*@FC012BD*/
/*** Once you have PERFKIT enabled and running uncomment the ***//*** following comments ***//* ‘CP MONITOR SAMPLE ENABLE PROCESSOR’ *//* ‘CP MONITOR SAMPLE ENABLE STORAGE’ */
82 Linux on IBM Eserver zSeries and S/390: Performance Toolkit for VM
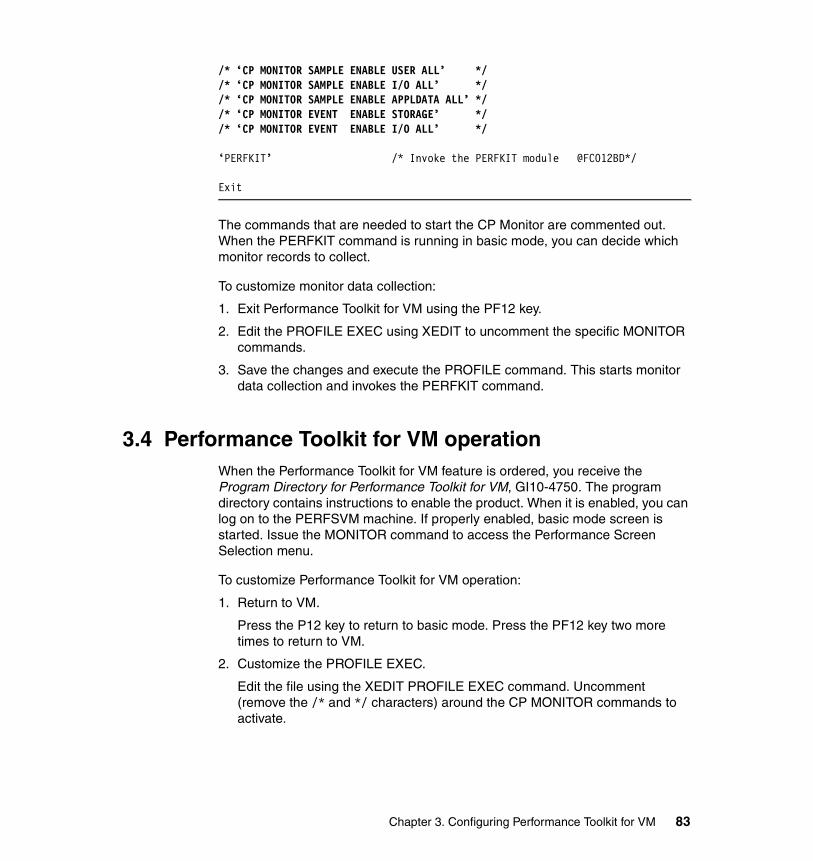
/* ‘CP MONITOR SAMPLE ENABLE USER ALL’ *//* ‘CP MONITOR SAMPLE ENABLE I/O ALL’ *//* ‘CP MONITOR SAMPLE ENABLE APPLDATA ALL’ *//* ‘CP MONITOR EVENT ENABLE STORAGE’ *//* ‘CP MONITOR EVENT ENABLE I/O ALL’ */
‘PERFKIT’ /* Invoke the PERFKIT module @FC012BD*/
Exit
The commands that are needed to start the CP Monitor are commented out. When the PERFKIT command is running in basic mode, you can decide which monitor records to collect.
To customize monitor data collection:
1. Exit Performance Toolkit for VM using the PF12 key.
2. Edit the PROFILE EXEC using XEDIT to uncomment the specific MONITOR commands.
3. Save the changes and execute the PROFILE command. This starts monitor data collection and invokes the PERFKIT command.
3.4 Performance Toolkit for VM operationWhen the Performance Toolkit for VM feature is ordered, you receive the Program Directory for Performance Toolkit for VM, GI10-4750. The program directory contains instructions to enable the product. When it is enabled, you can log on to the PERFSVM machine. If properly enabled, basic mode screen is started. Issue the MONITOR command to access the Performance Screen Selection menu.
To customize Performance Toolkit for VM operation:
1. Return to VM.
Press the P12 key to return to basic mode. Press the PF12 key two more times to return to VM.
2. Customize the PROFILE EXEC.
Edit the file using the XEDIT PROFILE EXEC command. Uncomment (remove the /* and */ characters) around the CP MONITOR commands to activate.
Chapter 3. Configuring Performance Toolkit for VM 83
After all changes are made, issue the FFILE command to save the file.
3. Execute the new profile.
Issue the PROFILE command to run the PROFILE EXEC. This starts monitor data collection and executes the PERFKIT MODULE.
When navigating through performance screens, press the PF12 key to return to the selection screen. From the selection screen, PF12 returns to basic mode. In basic mode, enter the DISC command to disconnect and leave the PERFSVM machine running. Now you can tailor the controls to meet your needs.
3.5 Tailoring Performance Toolkit for VMWhile the Performance Toolkit for VM is running, it accesses and stores monitor data in internal tables. When a screen is requested, it accesses the required data and displays it on the screen. When the FC MONCOLL RESET times are reached, it can create reports that are ready for printing, and history data is collected in FCXTREND files.
You can designate which printed reports and trend data are generated by Performance Toolkit for VM. Control files on the 4VMPTK40 user’s minidisks define both the time and type of collected or reported data. To customize reports and trend data:
� Tailor the FCONX $PROFILE control file.� Tailor the FCONX REPORTS control file.� Tailor the FCONX TRENDREC control file.
Note: The CP MONITOR SAMPLE ENABLE APPLDATA ALL command is needed to view data from applications such as TCP/IP; other commands provide data about the system operation.
Note: After the MONITOR command is executed, two monitor intervals must pass before monitor data is available. Selections on the Performance Screen Selection menu are highlighted as data becomes available.
84 Linux on IBM Eserver zSeries and S/390: Performance Toolkit for VM
3.5.1 Tailor the FCONX $PROFILE control fileCopy the FCONX $PROFILE from the 4VMPTK40 user’s 1CC disk to its CCC disk. Edit the copy on the CCC disk, customizing the FC MONCOLL RESET command.
3.5.2 Tailor the FCONX REPORTS control file Copy the FCONX REPORTS file from the 1CC to the CCC disk. Edit the copy on the CCC disk, selecting the reports for Performance Toolkit for VM to produce.
3.5.3 Tailor the FCONX TRENDREC control fileCopy the FCONX FCXTREND file from the 1CC disk to the CCC disk (renaming the file to FCONX TRENDREC). Edit the FCONX TRENDREC file, selecting the trend records that are to be produced.
3.6 Enabling remote access and monitoringPerformance Toolkit for VM can be accessed from remote z/VM systems. In addition, an instance of Performance Toolkit for VM can monitor remote z/VM systems. In Chapter 4, “Remote access and monitoring” on page 89, we discuss remote access to Performance Toolkit for VM in detail.
To enabled and configure remote access and monitoring:
� Create the FCONRMT AUTHORIZ control file.� Create the FCONRMT SYSTEMS control file.
Tip: If you want reporting by shift, change the entry to:
FC MONCOLL RESET 00:00PT 08:00PT 16:00PT
This creates reports and trend data at midnight, 08:00 (8AM), and 16:00 (4PM).
Note: Trend records can be used later to examine system performance trends.
Chapter 3. Configuring Performance Toolkit for VM 85
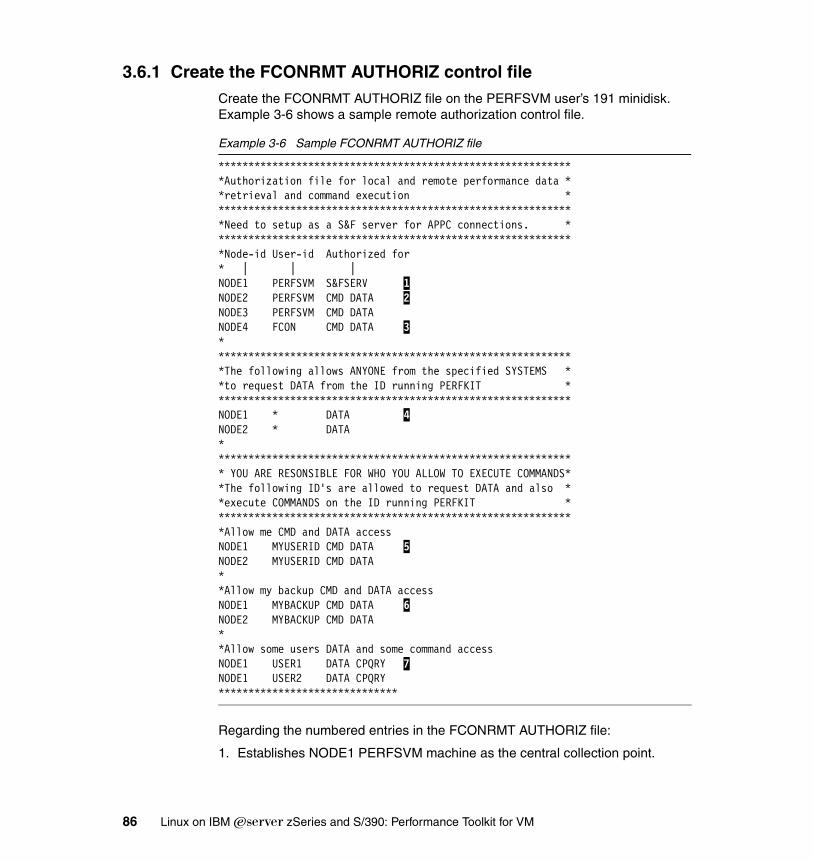
3.6.1 Create the FCONRMT AUTHORIZ control fileCreate the FCONRMT AUTHORIZ file on the PERFSVM user’s 191 minidisk. Example 3-6 shows a sample remote authorization control file.
Example 3-6 Sample FCONRMT AUTHORIZ file
*********************************************************** *Authorization file for local and remote performance data * *retrieval and command execution * *********************************************************** *Need to setup as a S&F server for APPC connections. * *********************************************************** *Node-id User-id Authorized for * | | | NODE1 PERFSVM S&FSERV 1 NODE2 PERFSVM CMD DATA 2 NODE3 PERFSVM CMD DATA NODE4 FCON CMD DATA 3 * *********************************************************** *The following allows ANYONE from the specified SYSTEMS * *to request DATA from the ID running PERFKIT * *********************************************************** NODE1 * DATA 4 NODE2 * DATA * ************************************************************ YOU ARE RESONSIBLE FOR WHO YOU ALLOW TO EXECUTE COMMANDS**The following ID's are allowed to request DATA and also **execute COMMANDS on the ID running PERFKIT *************************************************************Allow me CMD and DATA access NODE1 MYUSERID CMD DATA 5 NODE2 MYUSERID CMD DATA * *Allow my backup CMD and DATA access NODE1 MYBACKUP CMD DATA 6 NODE2 MYBACKUP CMD DATA * *Allow some users DATA and some command access NODE1 USER1 DATA CPQRY 7 NODE1 USER2 DATA CPQRY ******************************
Regarding the numbered entries in the FCONRMT AUTHORIZ file:
1. Establishes NODE1 PERFSVM machine as the central collection point.
86 Linux on IBM Eserver zSeries and S/390: Performance Toolkit for VM

2. Enables NODE2 and NODE3 to access data and execute commands on the NODE1 PERFSVM user ID.
3. Enables the FCON machine on NODE4 (probably running FCON/ESA) data and command authority.
4. Enables all users on NODE1 and NODE2 to access performance data from the PERFSVM user ID.
5. Enables MYUSERID to access data and execute commands on the PERFSVM user ID.
6. Gives user MYBACKUP CMD and DATA authority.
7. Gives USER1 and USER2 CPQRY and DATA authority. CPQRY authority enables key users to submit the CP INDICATE and CP QUERY commands.
3.6.2 Create the FCONRMT SYSTEMS control fileAn instance of Performance Toolkit for VM can monitor up to 20 remote z/VM systems. Each remote system needs an FCONRMT SYSTEMS file on the PERFSVM user’s 191 disk. A sample FCONRMT SYSTEMS file is shown in Example 3-7.
Example 3-7 The FCONRMT SYSTEMS file
************************************************************ System Definition File for Remote Monitoring *************************************************************Node-ID PERFKIT-ID VMTYPE APPEND Nickname NODE1 PERFSVM z/VM_440 N NODE2 PERFSVM z/VM_440 NNODE3 PERFSVM z/VM_440 N FCXRES03 NODE4 FCONX ESA
Note: Care must be taken when giving a user CMD authority. CMD authorization allows any command the PERFSVM user can execute to be issued from any user with CMD authority.
Note: The FCONRMT AUTHORIZ file may be edited from basic mode. To make changes take effect, use the FC RELOAD AUTHORIZ command to refresh the in storage copy.
Chapter 3. Configuring Performance Toolkit for VM 87
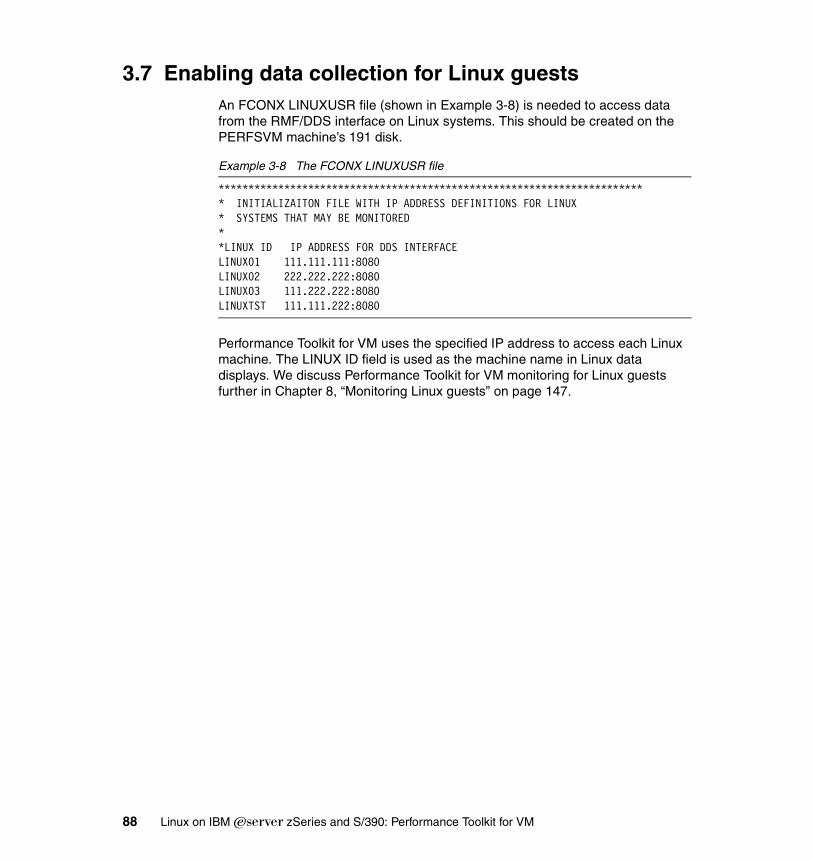
3.7 Enabling data collection for Linux guestsAn FCONX LINUXUSR file (shown in Example 3-8) is needed to access data from the RMF/DDS interface on Linux systems. This should be created on the PERFSVM machine’s 191 disk.
Example 3-8 The FCONX LINUXUSR file
************************************************************************ INITIALIZAITON FILE WITH IP ADDRESS DEFINITIONS FOR LINUX * SYSTEMS THAT MAY BE MONITORED * *LINUX ID IP ADDRESS FOR DDS INTERFACE LINUX01 111.111.111:8080 LINUX02 222.222.222:8080 LINUX03 111.222.222:8080 LINUXTST 111.111.222:8080
Performance Toolkit for VM uses the specified IP address to access each Linux machine. The LINUX ID field is used as the machine name in Linux data displays. We discuss Performance Toolkit for VM monitoring for Linux guests further in Chapter 8, “Monitoring Linux guests” on page 147.
88 Linux on IBM Eserver zSeries and S/390: Performance Toolkit for VM
Chapter 4. Remote access and monitoring
In this chapter, we describe monitoring remote z/VM systems using Performance Toolkit for VM. Topics include:
� Remote monitoring with Performance Toolkit for VM
� APPC/VM interface to Performance Toolkit for VM
� Performance Toolkit for VM Web interface
4
© Copyright IBM Corp. 2004. All rights reserved. 89
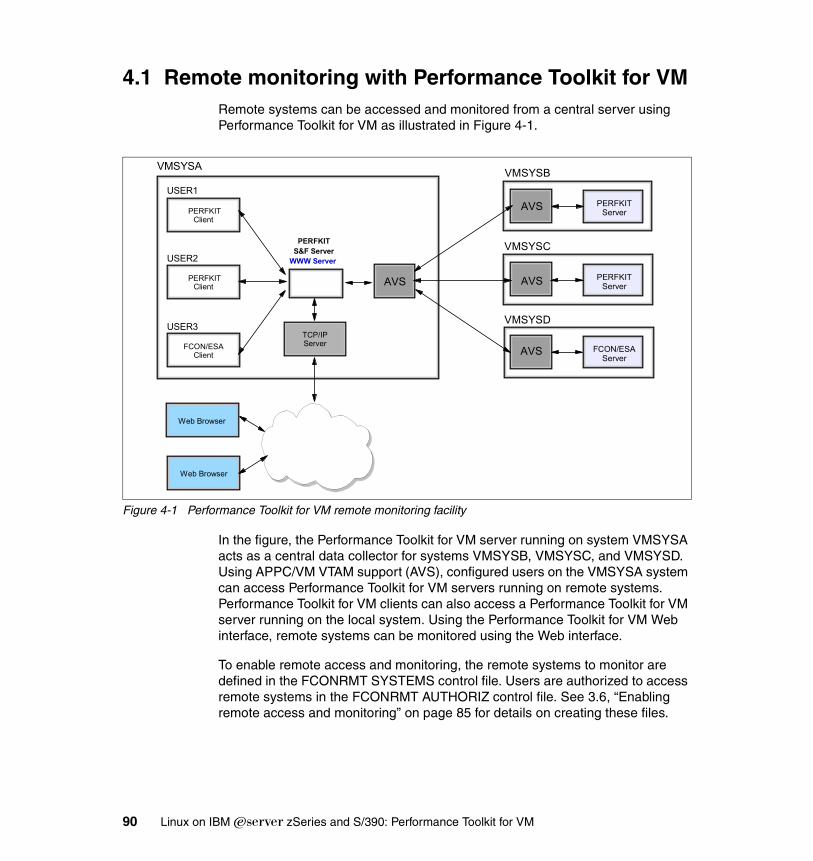
4.1 Remote monitoring with Performance Toolkit for VMRemote systems can be accessed and monitored from a central server using Performance Toolkit for VM as illustrated in Figure 4-1.
Figure 4-1 Performance Toolkit for VM remote monitoring facility
In the figure, the Performance Toolkit for VM server running on system VMSYSA acts as a central data collector for systems VMSYSB, VMSYSC, and VMSYSD. Using APPC/VM VTAM support (AVS), configured users on the VMSYSA system can access Performance Toolkit for VM servers running on remote systems. Performance Toolkit for VM clients can also access a Performance Toolkit for VM server running on the local system. Using the Performance Toolkit for VM Web interface, remote systems can be monitored using the Web interface.
To enable remote access and monitoring, the remote systems to monitor are defined in the FCONRMT SYSTEMS control file. Users are authorized to access remote systems in the FCONRMT AUTHORIZ control file. See 3.6, “Enabling remote access and monitoring” on page 85 for details on creating these files.
USER1
USER2
USER3
PERFKITClient
PERFKITClient
FCON/ESAClient
AVS
VMSYSA
TCP/IPServer
Web Browser
Web Browser
PERFKIT S&F ServerWWW Server
VMSYSB
VMSYSC
VMSYSD
PERFKITServer
PERFKITServer
FCON/ESAServer
AVS
AVS
AVS
90 Linux on IBM Eserver zSeries and S/390: Performance Toolkit for VM
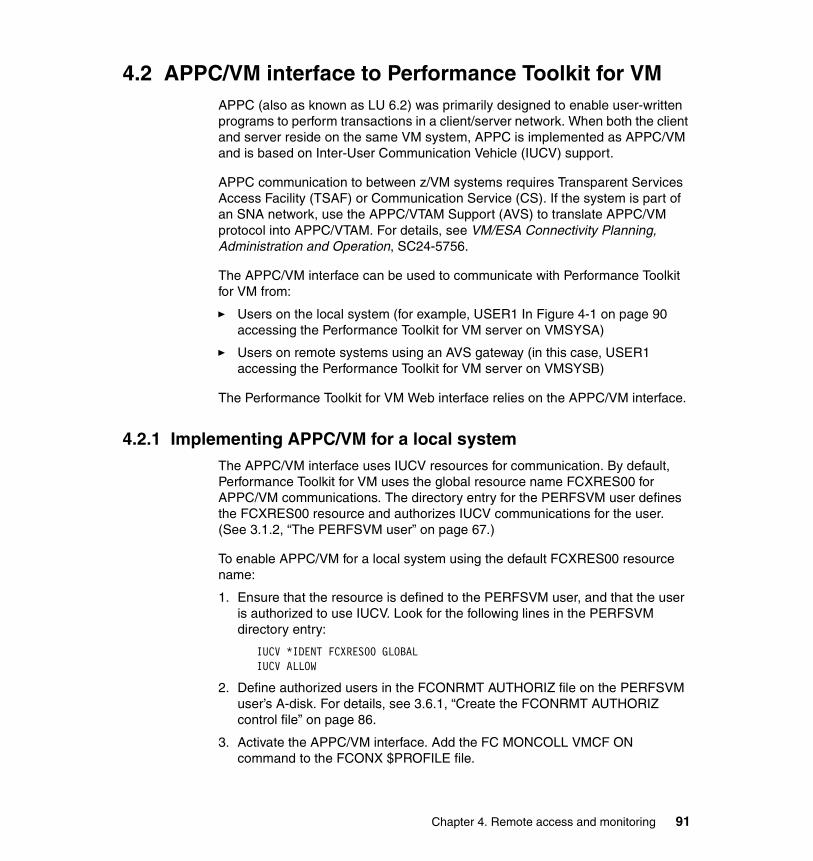
4.2 APPC/VM interface to Performance Toolkit for VMAPPC (also as known as LU 6.2) was primarily designed to enable user-written programs to perform transactions in a client/server network. When both the client and server reside on the same VM system, APPC is implemented as APPC/VM and is based on Inter-User Communication Vehicle (IUCV) support.
APPC communication to between z/VM systems requires Transparent Services Access Facility (TSAF) or Communication Service (CS). If the system is part of an SNA network, use the APPC/VTAM Support (AVS) to translate APPC/VM protocol into APPC/VTAM. For details, see VM/ESA Connectivity Planning, Administration and Operation, SC24-5756.
The APPC/VM interface can be used to communicate with Performance Toolkit for VM from:
� Users on the local system (for example, USER1 In Figure 4-1 on page 90 accessing the Performance Toolkit for VM server on VMSYSA)
� Users on remote systems using an AVS gateway (in this case, USER1 accessing the Performance Toolkit for VM server on VMSYSB)
The Performance Toolkit for VM Web interface relies on the APPC/VM interface.
4.2.1 Implementing APPC/VM for a local systemThe APPC/VM interface uses IUCV resources for communication. By default, Performance Toolkit for VM uses the global resource name FCXRES00 for APPC/VM communications. The directory entry for the PERFSVM user defines the FCXRES00 resource and authorizes IUCV communications for the user. (See 3.1.2, “The PERFSVM user” on page 67.)
To enable APPC/VM for a local system using the default FCXRES00 resource name:
1. Ensure that the resource is defined to the PERFSVM user, and that the user is authorized to use IUCV. Look for the following lines in the PERFSVM directory entry:
IUCV *IDENT FCXRES00 GLOBALIUCV ALLOW
2. Define authorized users in the FCONRMT AUTHORIZ file on the PERFSVM user’s A-disk. For details, see 3.6.1, “Create the FCONRMT AUTHORIZ control file” on page 86.
3. Activate the APPC/VM interface. Add the FC MONCOLL VMCF ON command to the FCONX $PROFILE file.
Chapter 4. Remote access and monitoring 91
When Performance Toolkit for VM is started, look for the message:
FCXAPP530O Connected to *IDENT for resource FCXRES00
This indicates that APPC/VM has been configured successfully. Error messages that are related to resource FCXSYSTM can be ignored. (This resource is used for communicating to remote systems.) If changes are made to the FCONRMT AUTHORIZ file, changes can be activated using the FC RELOAD AUTHORIZ command.
To establish a connection to the default FCXRES00 global resource, issue the FCONAPPC command from Performance Toolkit for VM basic mode.
4.2.2 Using an alternate resource nameAn alternate resource name may be used instead of the default FCXRES00 name. Because APPC/VM relies on unique global resource names, an alternate name is required for each Performance Toolkit for VM IUCV resource. To use an alternate resource name:
� Use a unique resource name in each PERFSVM user directory entry in place of the FCXRES00 name:
IUCV *IDENT FCXRES01 GLOBALIUCV ALLOW
� Map the new resource name to FCXRES00. In the SCOMDIR NAMES file, add the lines:
:NICK.FCXRES00 :LUNAME.*IDENT:TPN.FCXRES01:SCEURITY.SAME
Follow the steps that are listed in 4.2.1, “Implementing APPC/VM for a local system” on page 91 to activate the APPC/VM interface. Look for a message that the new resource name is connected to *IDENT as an indication of success.
Use the FCONAPPC command (issued from Performance Toolkit for VM basic mode) to connect to the remote resource.
Note: In this example, we use FCXRES01 as an alternate resource name.
92 Linux on IBM Eserver zSeries and S/390: Performance Toolkit for VM
4.2.3 Implementing APPC/VM for remote systems The APPC/VM interface can enable remote users to access Performance Toolkit for VM as illustrated in Figure 4-2.
Figure 4-2 Accessing Performance Toolkit for VM from a remote system
Remote connections exist only between PERFSVM server machines. Users connect to the FCXSYSTM resource of their local PERFSVM machine. To access the Performance Toolkit for VM running on VMSYSB, USER1 on VMSYSA issues the FCONAPPC FCXSYSTM command. This connects USER1 to the FCXSYSTM resource on VMSYSA.
The APPC/VM interface that is managing the FCXSYSTM resource then presents a menu with a list of all remote systems. If VMSYSB is selected, a special Store and Forward connection request is generated by the PERFSVM machine on VMSYSA. The request is forwarded to the global resource for VMSYSB (FCXRES0B in the figure).
The PERFSVM machine on VMSYSB validates the request and verifies that PERFSVM is authorized to act as a Store and Forward server. A check is also performed to ensure that USER1 on VMSYSA is authorized for performance data retrieval. If authorized, USER1 can access VMSYSB just like a direct APPC/VM connection. The Store and Forward logic is completely transparent to the end user.
VMSYSA
PERFSVM AVS
USER1 USER2
FCXSYSTM
FCXRES0A
VMSYSB
PERFSVMAVS
USER4USER3
FCXRES0B
FCXSYSTM
Chapter 4. Remote access and monitoring 93
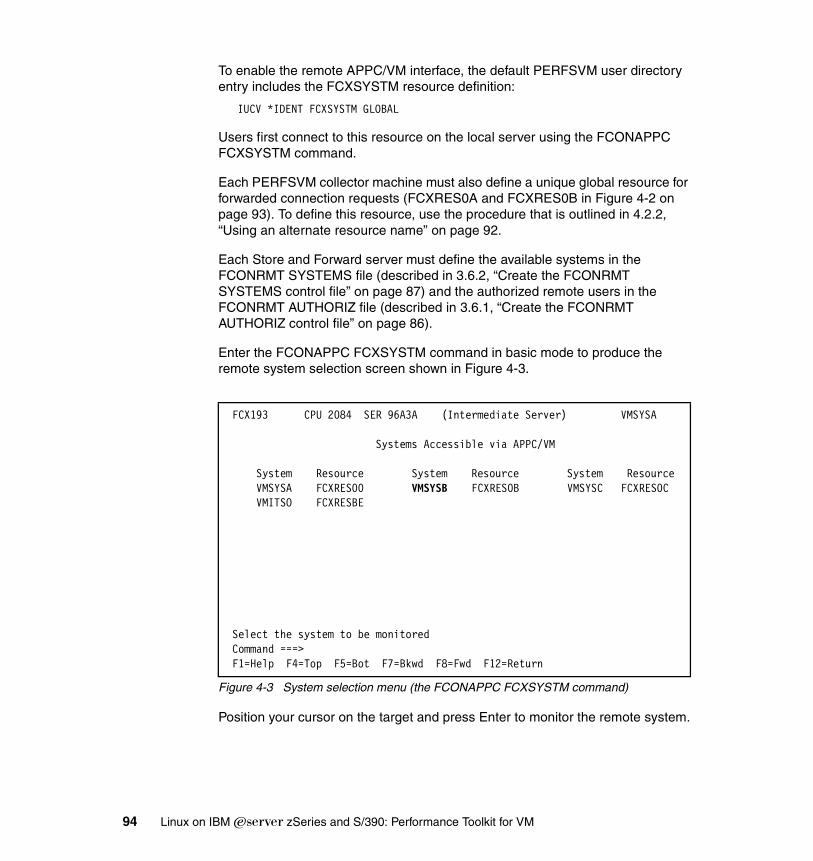
To enable the remote APPC/VM interface, the default PERFSVM user directory entry includes the FCXSYSTM resource definition:
IUCV *IDENT FCXSYSTM GLOBAL
Users first connect to this resource on the local server using the FCONAPPC FCXSYSTM command.
Each PERFSVM collector machine must also define a unique global resource for forwarded connection requests (FCXRES0A and FCXRES0B in Figure 4-2 on page 93). To define this resource, use the procedure that is outlined in 4.2.2, “Using an alternate resource name” on page 92.
Each Store and Forward server must define the available systems in the FCONRMT SYSTEMS file (described in 3.6.2, “Create the FCONRMT SYSTEMS control file” on page 87) and the authorized remote users in the FCONRMT AUTHORIZ file (described in 3.6.1, “Create the FCONRMT AUTHORIZ control file” on page 86).
Enter the FCONAPPC FCXSYSTM command in basic mode to produce the remote system selection screen shown in Figure 4-3.
Figure 4-3 System selection menu (the FCONAPPC FCXSYSTM command)
Position your cursor on the target and press Enter to monitor the remote system.
FCX193 CPU 2084 SER 96A3A (Intermediate Server) VMSYSA
Systems Accessible via APPC/VM
System Resource System Resource System Resource VMSYSA FCXRES00 VMSYSB FCXRES0B VMSYSC FCXRES0C VMITSO FCXRESBE
Select the system to be monitored Command ===> F1=Help F4=Top F5=Bot F7=Bkwd F8=Fwd F12=Return
94 Linux on IBM Eserver zSeries and S/390: Performance Toolkit for VM
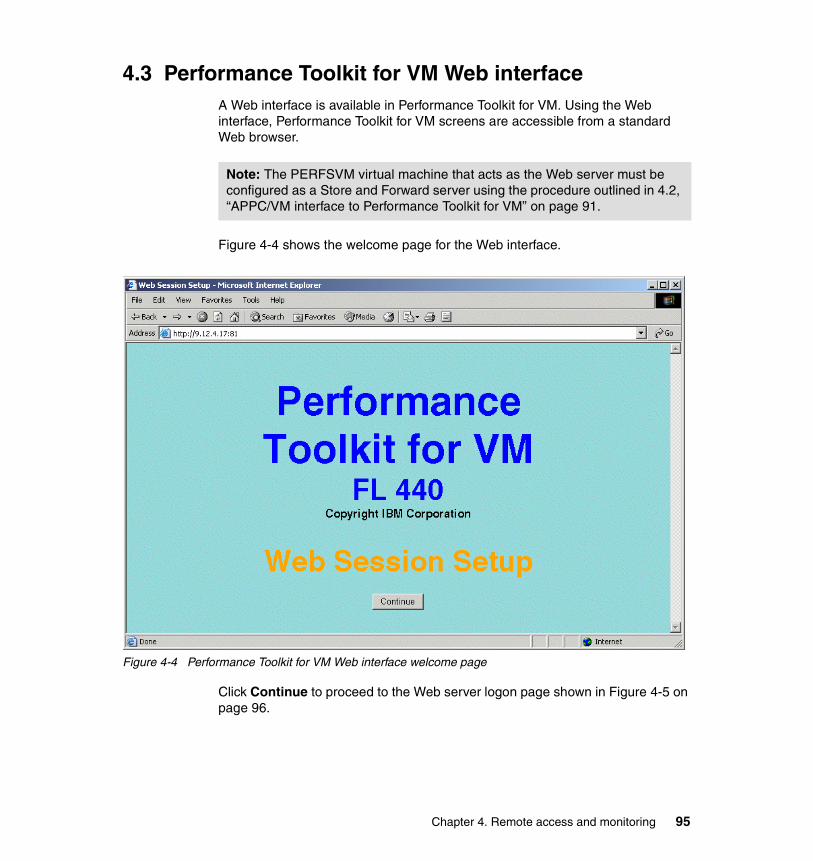
4.3 Performance Toolkit for VM Web interfaceA Web interface is available in Performance Toolkit for VM. Using the Web interface, Performance Toolkit for VM screens are accessible from a standard Web browser.
Figure 4-4 shows the welcome page for the Web interface.
Figure 4-4 Performance Toolkit for VM Web interface welcome page
Click Continue to proceed to the Web server logon page shown in Figure 4-5 on page 96.
Note: The PERFSVM virtual machine that acts as the Web server must be configured as a Store and Forward server using the procedure outlined in 4.2, “APPC/VM interface to Performance Toolkit for VM” on page 91.
Chapter 4. Remote access and monitoring 95
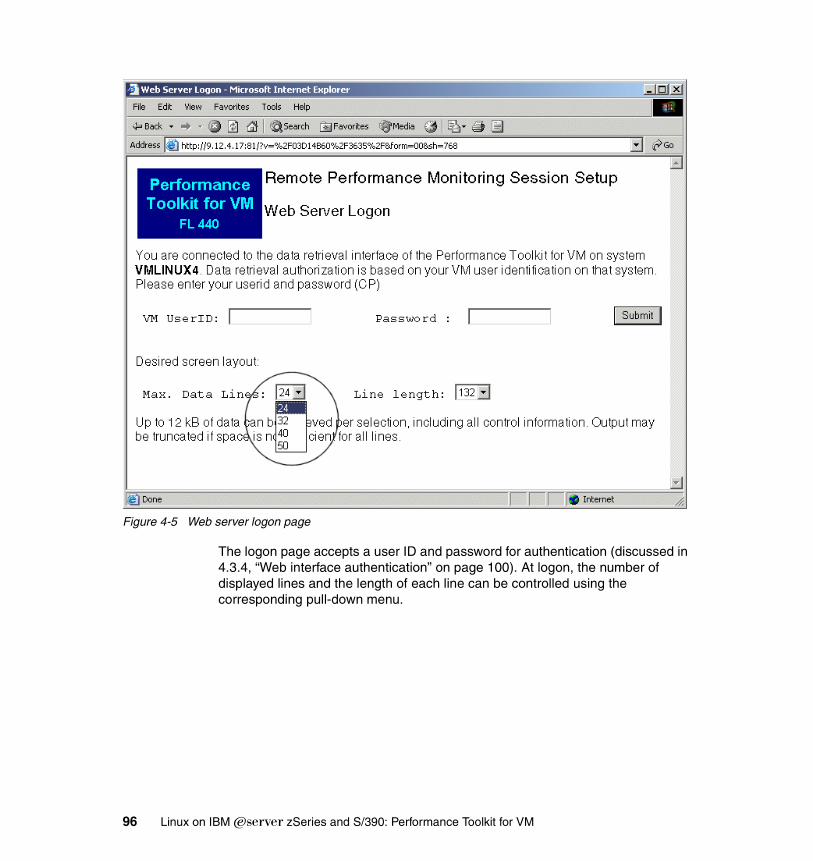
Figure 4-5 Web server logon page
The logon page accepts a user ID and password for authentication (discussed in 4.3.4, “Web interface authentication” on page 100). At logon, the number of displayed lines and the length of each line can be controlled using the corresponding pull-down menu.
96 Linux on IBM Eserver zSeries and S/390: Performance Toolkit for VM
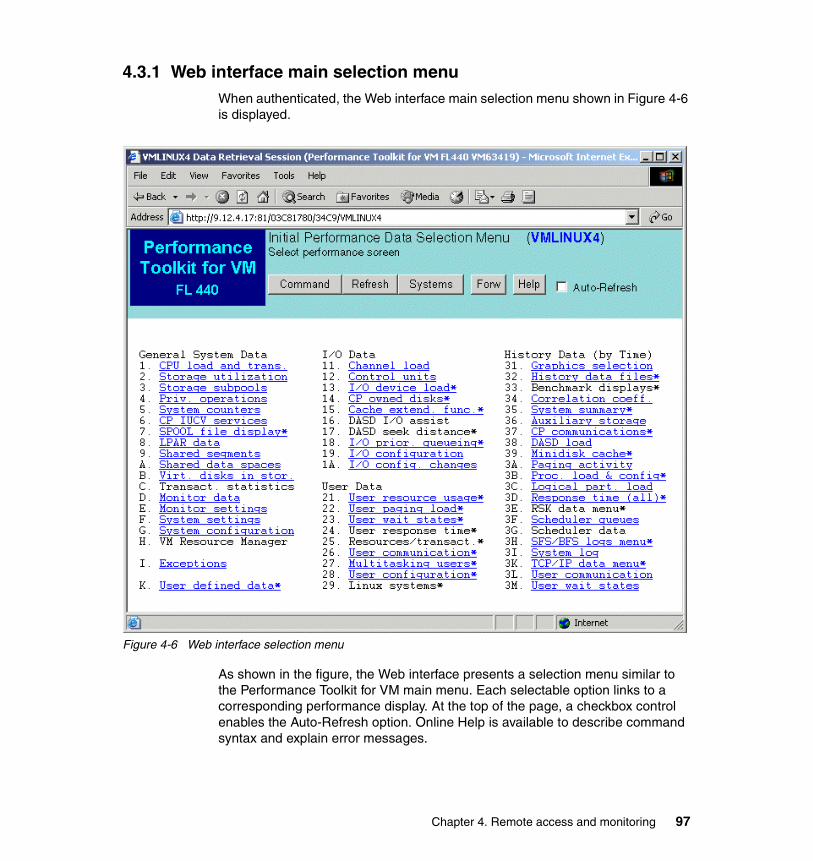
4.3.1 Web interface main selection menuWhen authenticated, the Web interface main selection menu shown in Figure 4-6 is displayed.
Figure 4-6 Web interface selection menu
As shown in the figure, the Web interface presents a selection menu similar to the Performance Toolkit for VM main menu. Each selectable option links to a corresponding performance display. At the top of the page, a checkbox control enables the Auto-Refresh option. Online Help is available to describe command syntax and explain error messages.
Chapter 4. Remote access and monitoring 97
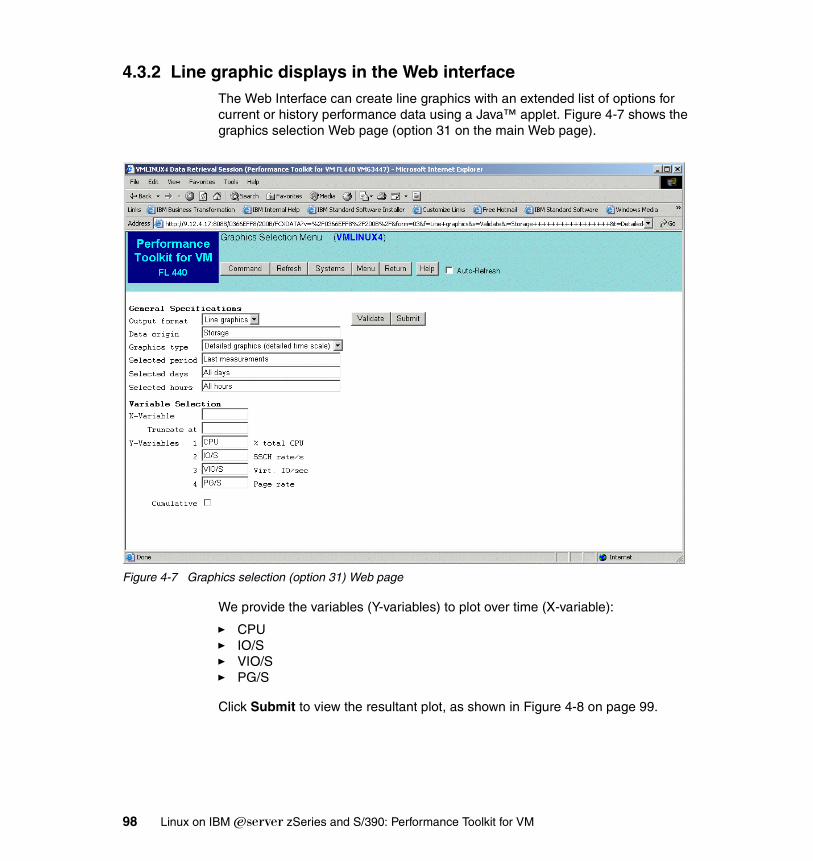
4.3.2 Line graphic displays in the Web interfaceThe Web Interface can create line graphics with an extended list of options for current or history performance data using a Java™ applet. Figure 4-7 shows the graphics selection Web page (option 31 on the main Web page).
Figure 4-7 Graphics selection (option 31) Web page
We provide the variables (Y-variables) to plot over time (X-variable):
� CPU� IO/S� VIO/S� PG/S
Click Submit to view the resultant plot, as shown in Figure 4-8 on page 99.
98 Linux on IBM Eserver zSeries and S/390: Performance Toolkit for VM
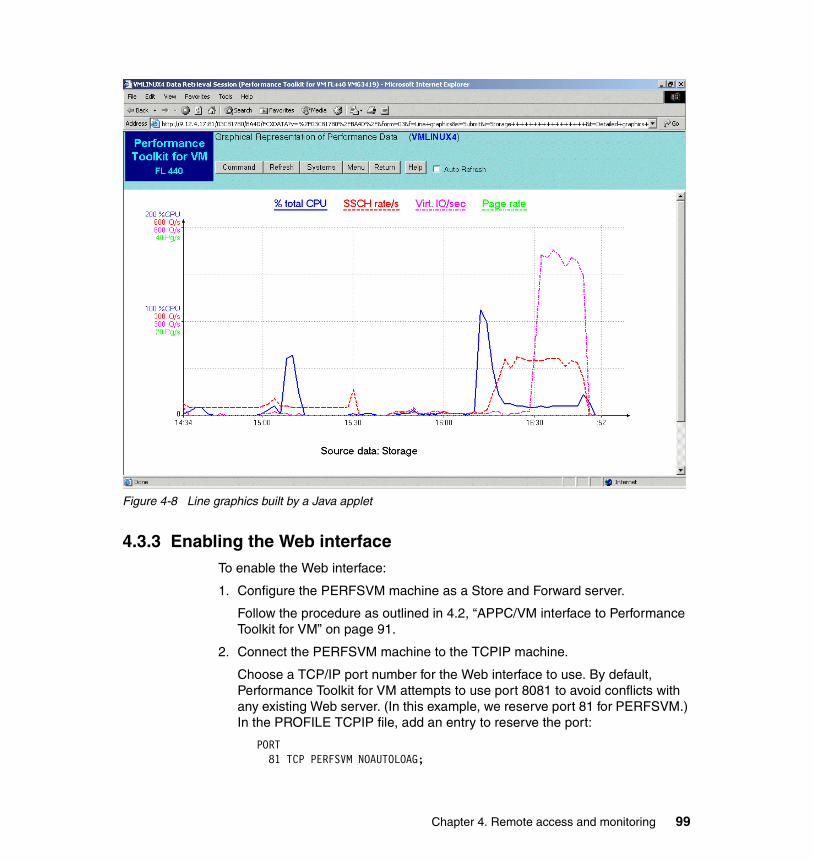
Figure 4-8 Line graphics built by a Java applet
4.3.3 Enabling the Web interfaceTo enable the Web interface:
1. Configure the PERFSVM machine as a Store and Forward server.
Follow the procedure as outlined in 4.2, “APPC/VM interface to Performance Toolkit for VM” on page 91.
2. Connect the PERFSVM machine to the TCPIP machine.
Choose a TCP/IP port number for the Web interface to use. By default, Performance Toolkit for VM attempts to use port 8081 to avoid conflicts with any existing Web server. (In this example, we reserve port 81 for PERFSVM.) In the PROFILE TCPIP file, add an entry to reserve the port:
PORT81 TCP PERFSVM NOAUTOLOAG;
Chapter 4. Remote access and monitoring 99
3. Select a user authentication method and activate the interface.
Several Web interface authentication methods are available, and we discuss these in 4.3.4, “Web interface authentication” on page 100. To activate the Web interface, add the specific FC MONCOLL WEBSERV ON command for your authentication method to the FCONX $PROFILE of the PERFSVM machine. When the PERFSVM and TCPIP machines are restarted, you should see messages similar to:
FCXAPP530I Connected to *IDENT for resource FCXRES00FCXTCP571I Connected to TCP/IP server TCPIP on path 0003FCXTCP575I Host IP address is 9.12.4.17:00081
To access Performance Toolkit for VM from the Web interface, access the URL for configured interface from a Web browser:
http://9.12.4.17:81
4.3.4 Web interface authenticationWeb interface authentication is controlled using the IDTEST option of the FC MONCOLL WEBSERV command. Users may be authenticated using one of several methods:
� Standard VM user ID and password
By default, the Web interface expects user logon to use normal VM user IDs and passwords. To enable standard VM user ID authentication, use the command:
FC MONCOLL WEBSERV ON TCPIP TCPIP 81 IDTEST CP
� RACF authentication
With this method, the user ID and password are verified by RACF or the installed External Security Manager (ESM). To enable RACF authentication, use:
FC MONCOLL WEBSERV ON TCPIP TCPIP 81 IDTEST RACF
� FCONRMT PASSFILE authentication
User ID and password combinations can be specified in a separate password file on one of the PERFSVM minidisks. In this case, user IDs are defined only to the PERFSVM virtual machine. A compromised user ID and password allows an intruder access to performance data, but not to VM logon (as long as the defined user IDs do not exist as VM users). Figure 4-9 on page 101
Important: Do not use this method if clients outside your private network can access the Web interface.
100 Linux on IBM Eserver zSeries and S/390: Performance Toolkit for VM
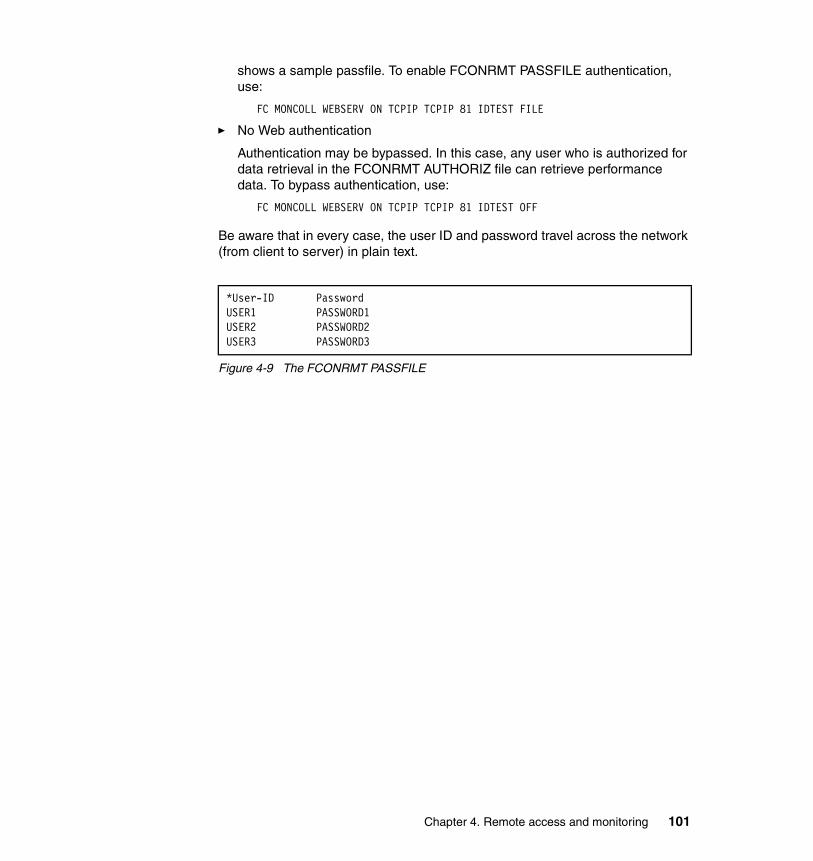
shows a sample passfile. To enable FCONRMT PASSFILE authentication, use:
FC MONCOLL WEBSERV ON TCPIP TCPIP 81 IDTEST FILE
� No Web authentication
Authentication may be bypassed. In this case, any user who is authorized for data retrieval in the FCONRMT AUTHORIZ file can retrieve performance data. To bypass authentication, use:
FC MONCOLL WEBSERV ON TCPIP TCPIP 81 IDTEST OFF
Be aware that in every case, the user ID and password travel across the network (from client to server) in plain text.
Figure 4-9 The FCONRMT PASSFILE
*User-ID PasswordUSER1 PASSWORD1USER2 PASSWORD2USER3 PASSWORD3
Chapter 4. Remote access and monitoring 101

102 Linux on IBM Eserver zSeries and S/390: Performance Toolkit for VM

Chapter 5. Understanding z/VM configuration
In this chapter we describe how to view the z/VM system configuration using Performance Toolkit for VM. We look at some of the important screens that show general VM configuration and monitoring data. We discuss:
� Commands to use for configuration information
� System configuration screen
� Storage layout
� System settings
� System counters
� Monitor settings
� I/O configuration
� Page and spool allocation
� Spool file usage
� User paging utilization
� Virtual disks in storage
5
© Copyright IBM Corp. 2004. All rights reserved. 103
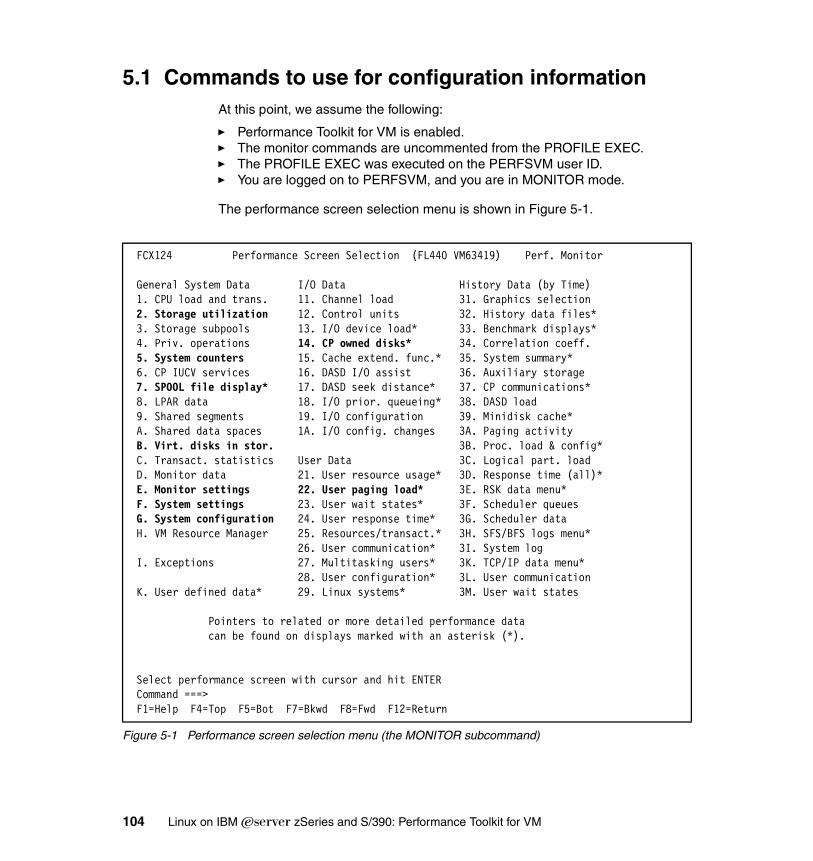
5.1 Commands to use for configuration informationAt this point, we assume the following:
� Performance Toolkit for VM is enabled.� The monitor commands are uncommented from the PROFILE EXEC.� The PROFILE EXEC was executed on the PERFSVM user ID.� You are logged on to PERFSVM, and you are in MONITOR mode.
The performance screen selection menu is shown in Figure 5-1.
Figure 5-1 Performance screen selection menu (the MONITOR subcommand)
FCX124 Performance Screen Selection (FL440 VM63419) Perf. Monitor General System Data I/O Data History Data (by Time) 1. CPU load and trans. 11. Channel load 31. Graphics selection 2. Storage utilization 12. Control units 32. History data files* 3. Storage subpools 13. I/O device load* 33. Benchmark displays* 4. Priv. operations 14. CP owned disks* 34. Correlation coeff. 5. System counters 15. Cache extend. func.* 35. System summary* 6. CP IUCV services 16. DASD I/O assist 36. Auxiliary storage 7. SPOOL file display* 17. DASD seek distance* 37. CP communications* 8. LPAR data 18. I/O prior. queueing* 38. DASD load 9. Shared segments 19. I/O configuration 39. Minidisk cache* A. Shared data spaces 1A. I/O config. changes 3A. Paging activity B. Virt. disks in stor. 3B. Proc. load & config* C. Transact. statistics User Data 3C. Logical part. load D. Monitor data 21. User resource usage* 3D. Response time (all)* E. Monitor settings 22. User paging load* 3E. RSK data menu* F. System settings 23. User wait states* 3F. Scheduler queues G. System configuration 24. User response time* 3G. Scheduler data H. VM Resource Manager 25. Resources/transact.* 3H. SFS/BFS logs menu* 26. User communication* 3I. System log I. Exceptions 27. Multitasking users* 3K. TCP/IP data menu* 28. User configuration* 3L. User communication K. User defined data* 29. Linux systems* 3M. User wait states Pointers to related or more detailed performance data can be found on displays marked with an asterisk (*). Select performance screen with cursor and hit ENTER Command ===> F1=Help F4=Top F5=Bot F7=Bkwd F8=Fwd F12=Return
104 Linux on IBM Eserver zSeries and S/390: Performance Toolkit for VM
From here, you can select a display by typing in the number or letter that is shown in the menu, or by placing your cursor anywhere on the desired display. You can also enter the subcommands directly:
� SYSCONF displays the system configuration (option G) as discussed in 5.2, “System configuration screen” on page 105.
� STORAGE displays storage layout (option 2) as discussed in 5.3, “Storage layout” on page 107.
� SYSSET displays the current system resources manager (SRM) settings (option F) as discussed in 5.4, “System settings” on page 109.
� SYSTEM displays system counters (option 5) as discussed in 5.5, “System counters” on page 113.
� MONSET displays which monitor types and domains are enabled (option E) as discussed in 5.6, “Monitor settings” on page 115.
� DEVCONF displays devices visible to z/VM (option 13) as discussed in 5.7, “I/O configuration” on page 116.
� DEVICE CPOWNED displays DASD with special areas, such as page and spool (option 14), as discussed in 5.8, “Page and spool allocation” on page 119.
� SPOOL displays spool files (option 7) as discussed in 5.9, “Spool file usage” on page 121.
� UPAGE displays how many pages reside in expanded storage (XSTORE) and DASD (option 22) as discussed in 5.10, “User paging utilization” on page 122.
� VDISKS displays virtual disk usage (option B) as discussed in 5.11, “Virtual disks in storage” on page 123.
Press PF12 to return to the main menu. You can also enter RETURN or MENU commands. Pressing PF1 opens online help. Scroll down to performance monitor commands for a complete list of the valid subcommands; then scroll to the desired command, place your cursor on it, and press Enter.
5.2 System configuration screenAfter entering the SYSCONF command (or selecting G), we navigate to the system configuration screen shown in Figure 5-2 on page 106.
Note: All of the number and letter selections in the following sections refer to menu items on the monitor selection menu shown in Figure 5-1 on page 104.
Chapter 5. Understanding z/VM configuration 105
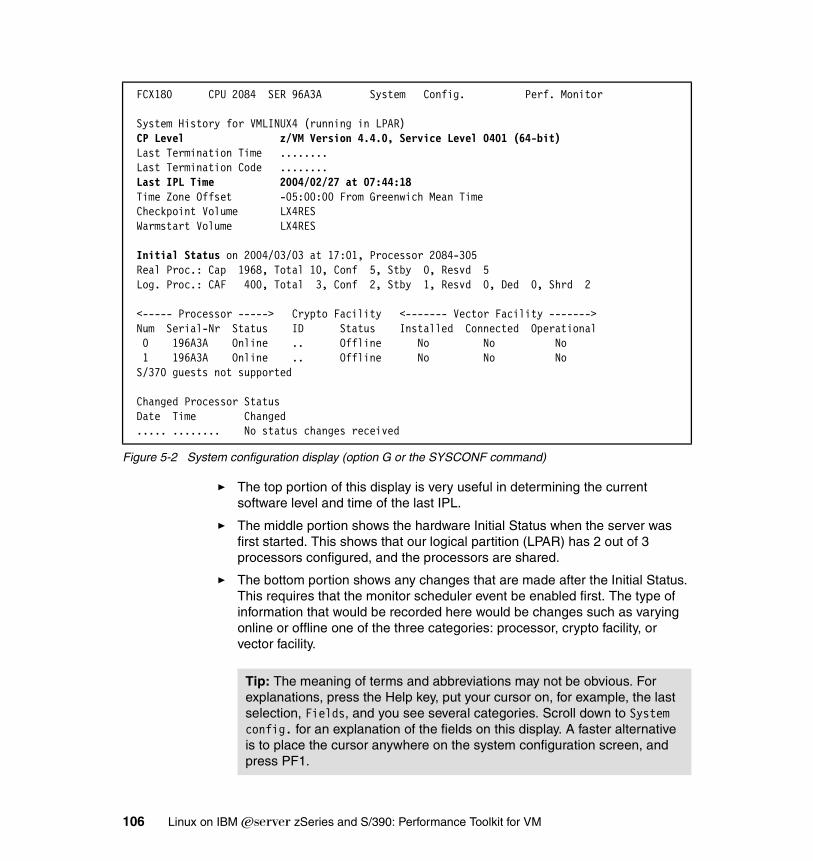
Figure 5-2 System configuration display (option G or the SYSCONF command)
� The top portion of this display is very useful in determining the current software level and time of the last IPL.
� The middle portion shows the hardware Initial Status when the server was first started. This shows that our logical partition (LPAR) has 2 out of 3 processors configured, and the processors are shared.
� The bottom portion shows any changes that are made after the Initial Status. This requires that the monitor scheduler event be enabled first. The type of information that would be recorded here would be changes such as varying online or offline one of the three categories: processor, crypto facility, or vector facility.
FCX180 CPU 2084 SER 96A3A System Config. Perf. Monitor System History for VMLINUX4 (running in LPAR) CP Level z/VM Version 4.4.0, Service Level 0401 (64-bit) Last Termination Time ........ Last Termination Code ........ Last IPL Time 2004/02/27 at 07:44:18 Time Zone Offset -05:00:00 From Greenwich Mean Time Checkpoint Volume LX4RES Warmstart Volume LX4RES Initial Status on 2004/03/03 at 17:01, Processor 2084-305 Real Proc.: Cap 1968, Total 10, Conf 5, Stby 0, Resvd 5 Log. Proc.: CAF 400, Total 3, Conf 2, Stby 1, Resvd 0, Ded 0, Shrd 2 <----- Processor -----> Crypto Facility <------- Vector Facility -------> Num Serial-Nr Status ID Status Installed Connected Operational 0 196A3A Online .. Offline No No No 1 196A3A Online .. Offline No No No S/370 guests not supported Changed Processor Status Date Time Changed ..... ........ No status changes received
Tip: The meaning of terms and abbreviations may not be obvious. For explanations, press the Help key, put your cursor on, for example, the last selection, Fields, and you see several categories. Scroll down to System config. for an explanation of the fields on this display. A faster alternative is to place the cursor anywhere on the system configuration screen, and press PF1.
106 Linux on IBM Eserver zSeries and S/390: Performance Toolkit for VM
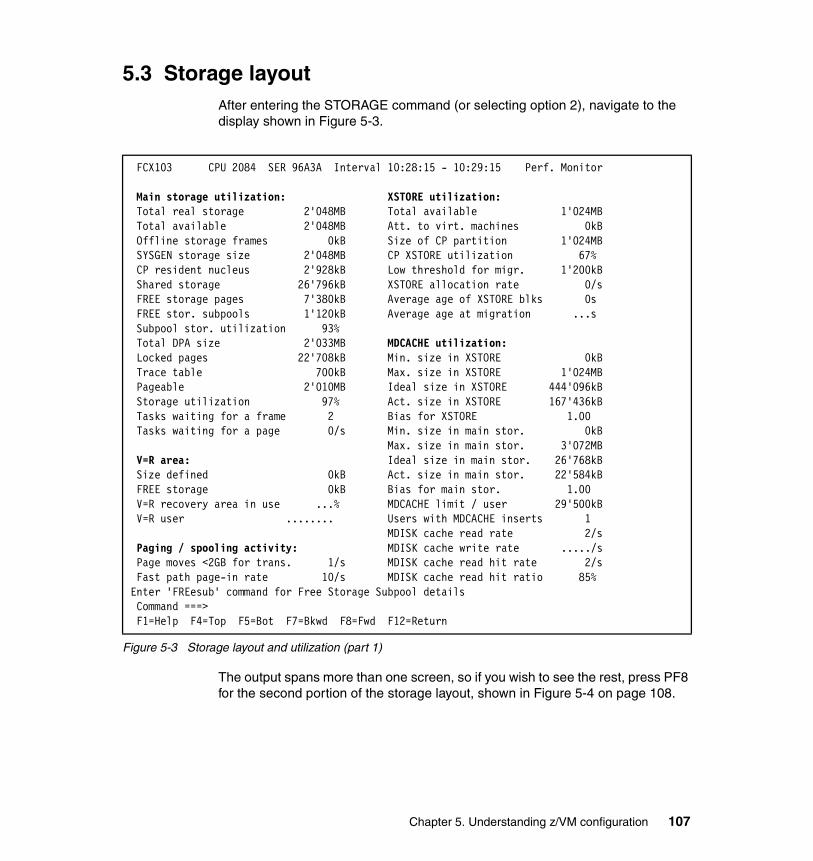
5.3 Storage layoutAfter entering the STORAGE command (or selecting option 2), navigate to the display shown in Figure 5-3.
Figure 5-3 Storage layout and utilization (part 1)
The output spans more than one screen, so if you wish to see the rest, press PF8 for the second portion of the storage layout, shown in Figure 5-4 on page 108.
FCX103 CPU 2084 SER 96A3A Interval 10:28:15 - 10:29:15 Perf. Monitor Main storage utilization: XSTORE utilization: Total real storage 2'048MB Total available 1'024MB Total available 2'048MB Att. to virt. machines 0kB Offline storage frames 0kB Size of CP partition 1'024MB SYSGEN storage size 2'048MB CP XSTORE utilization 67% CP resident nucleus 2'928kB Low threshold for migr. 1'200kB Shared storage 26'796kB XSTORE allocation rate 0/s FREE storage pages 7'380kB Average age of XSTORE blks 0s FREE stor. subpools 1'120kB Average age at migration ...s Subpool stor. utilization 93% Total DPA size 2'033MB MDCACHE utilization: Locked pages 22'708kB Min. size in XSTORE 0kB Trace table 700kB Max. size in XSTORE 1'024MB Pageable 2'010MB Ideal size in XSTORE 444'096kB Storage utilization 97% Act. size in XSTORE 167'436kB Tasks waiting for a frame 2 Bias for XSTORE 1.00 Tasks waiting for a page 0/s Min. size in main stor. 0kB Max. size in main stor. 3'072MB V=R area: Ideal size in main stor. 26'768kB Size defined 0kB Act. size in main stor. 22'584kB FREE storage 0kB Bias for main stor. 1.00 V=R recovery area in use ...% MDCACHE limit / user 29'500kB V=R user ........ Users with MDCACHE inserts 1 MDISK cache read rate 2/s Paging / spooling activity: MDISK cache write rate ...../s Page moves <2GB for trans. 1/s MDISK cache read hit rate 2/s Fast path page-in rate 10/s MDISK cache read hit ratio 85% Enter 'FREesub' command for Free Storage Subpool details Command ===> F1=Help F4=Top F5=Bot F7=Bkwd F8=Fwd F12=Return
Chapter 5. Understanding z/VM configuration 107
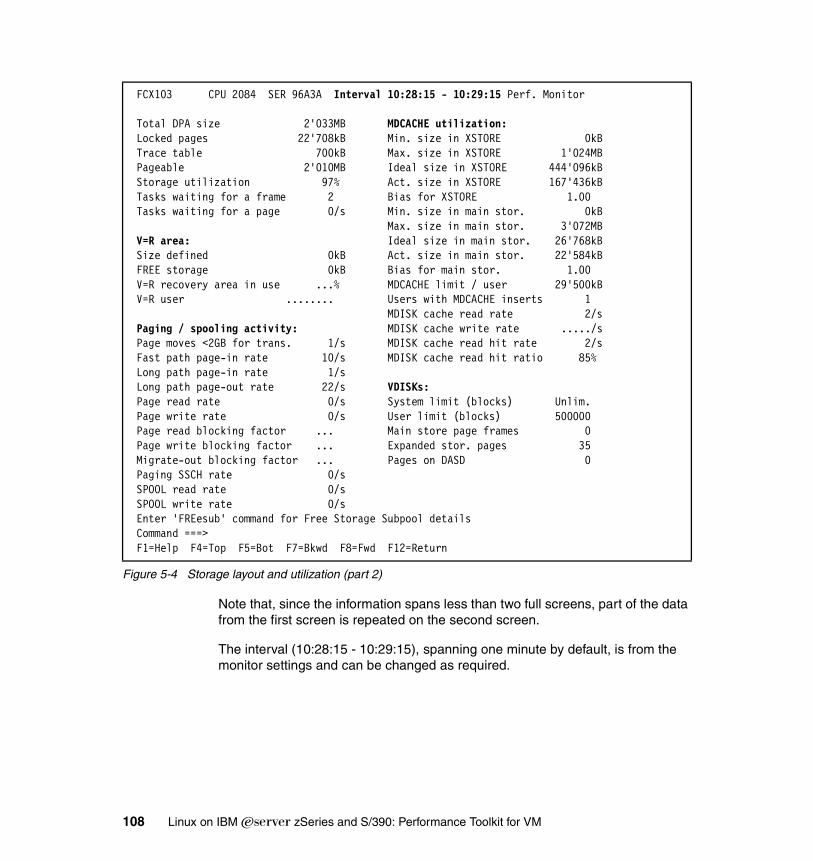
Figure 5-4 Storage layout and utilization (part 2)
Note that, since the information spans less than two full screens, part of the data from the first screen is repeated on the second screen.
The interval (10:28:15 - 10:29:15), spanning one minute by default, is from the monitor settings and can be changed as required.
FCX103 CPU 2084 SER 96A3A Interval 10:28:15 - 10:29:15 Perf. Monitor Total DPA size 2'033MB MDCACHE utilization: Locked pages 22'708kB Min. size in XSTORE 0kB Trace table 700kB Max. size in XSTORE 1'024MB Pageable 2'010MB Ideal size in XSTORE 444'096kB Storage utilization 97% Act. size in XSTORE 167'436kB Tasks waiting for a frame 2 Bias for XSTORE 1.00 Tasks waiting for a page 0/s Min. size in main stor. 0kB Max. size in main stor. 3'072MB V=R area: Ideal size in main stor. 26'768kB Size defined 0kB Act. size in main stor. 22'584kB FREE storage 0kB Bias for main stor. 1.00 V=R recovery area in use ...% MDCACHE limit / user 29'500kB V=R user ........ Users with MDCACHE inserts 1 MDISK cache read rate 2/s Paging / spooling activity: MDISK cache write rate ...../s Page moves <2GB for trans. 1/s MDISK cache read hit rate 2/s Fast path page-in rate 10/s MDISK cache read hit ratio 85% Long path page-in rate 1/s Long path page-out rate 22/s VDISKs: Page read rate 0/s System limit (blocks) Unlim. Page write rate 0/s User limit (blocks) 500000 Page read blocking factor ... Main store page frames 0 Page write blocking factor ... Expanded stor. pages 35 Migrate-out blocking factor ... Pages on DASD 0 Paging SSCH rate 0/s SPOOL read rate 0/s SPOOL write rate 0/s Enter 'FREesub' command for Free Storage Subpool details Command ===> F1=Help F4=Top F5=Bot F7=Bkwd F8=Fwd F12=Return
108 Linux on IBM Eserver zSeries and S/390: Performance Toolkit for VM
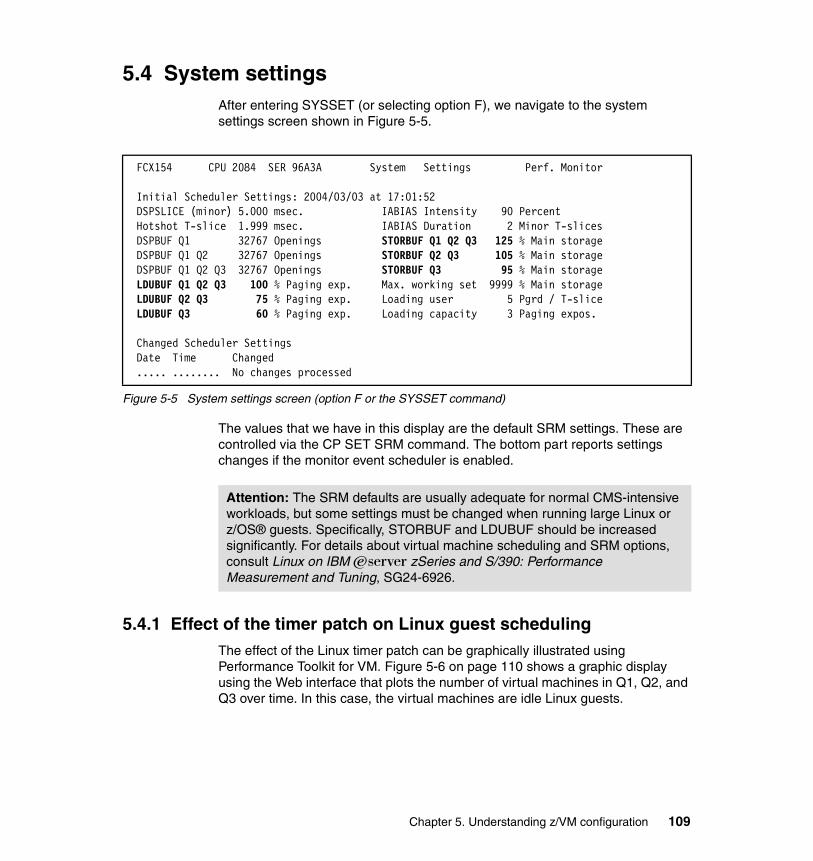
5.4 System settingsAfter entering SYSSET (or selecting option F), we navigate to the system settings screen shown in Figure 5-5.
Figure 5-5 System settings screen (option F or the SYSSET command)
The values that we have in this display are the default SRM settings. These are controlled via the CP SET SRM command. The bottom part reports settings changes if the monitor event scheduler is enabled.
5.4.1 Effect of the timer patch on Linux guest schedulingThe effect of the Linux timer patch can be graphically illustrated using Performance Toolkit for VM. Figure 5-6 on page 110 shows a graphic display using the Web interface that plots the number of virtual machines in Q1, Q2, and Q3 over time. In this case, the virtual machines are idle Linux guests.
FCX154 CPU 2084 SER 96A3A System Settings Perf. Monitor Initial Scheduler Settings: 2004/03/03 at 17:01:52 DSPSLICE (minor) 5.000 msec. IABIAS Intensity 90 Percent Hotshot T-slice 1.999 msec. IABIAS Duration 2 Minor T-slices DSPBUF Q1 32767 Openings STORBUF Q1 Q2 Q3 125 % Main storage DSPBUF Q1 Q2 32767 Openings STORBUF Q2 Q3 105 % Main storage DSPBUF Q1 Q2 Q3 32767 Openings STORBUF Q3 95 % Main storage LDUBUF Q1 Q2 Q3 100 % Paging exp. Max. working set 9999 % Main storage LDUBUF Q2 Q3 75 % Paging exp. Loading user 5 Pgrd / T-slice LDUBUF Q3 60 % Paging exp. Loading capacity 3 Paging expos. Changed Scheduler Settings Date Time Changed ..... ........ No changes processed
Attention: The SRM defaults are usually adequate for normal CMS-intensive workloads, but some settings must be changed when running large Linux or z/OS® guests. Specifically, STORBUF and LDUBUF should be increased significantly. For details about virtual machine scheduling and SRM options, consult Linux on IBM ̂zSeries and S/390: Performance Measurement and Tuning, SG24-6926.
Chapter 5. Understanding z/VM configuration 109
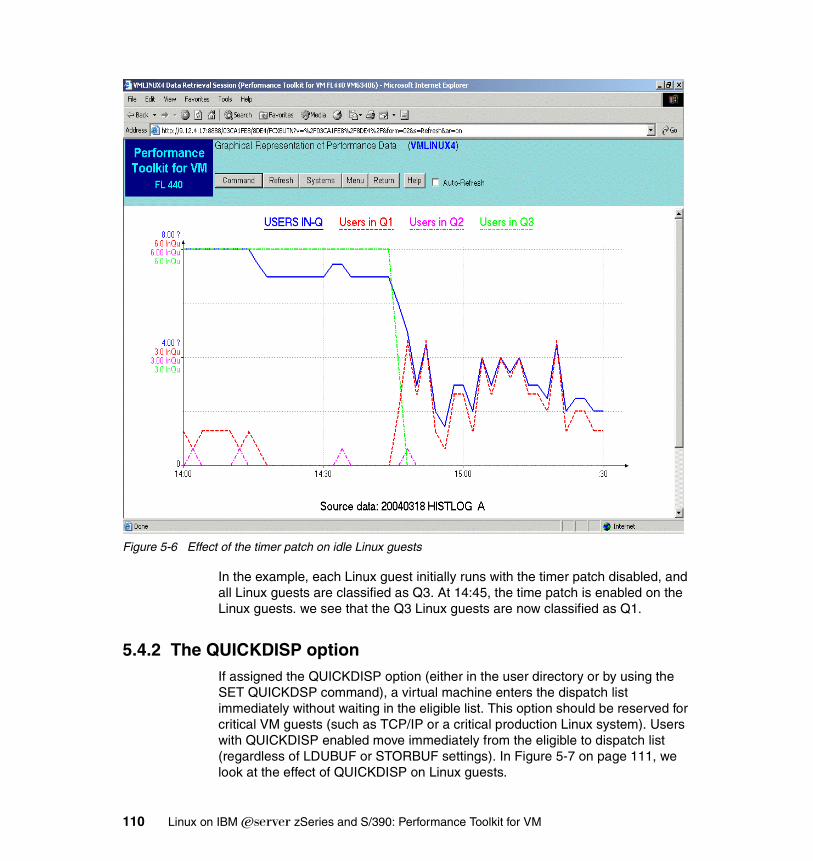
Figure 5-6 Effect of the timer patch on idle Linux guests
In the example, each Linux guest initially runs with the timer patch disabled, and all Linux guests are classified as Q3. At 14:45, the time patch is enabled on the Linux guests. we see that the Q3 Linux guests are now classified as Q1.
5.4.2 The QUICKDISP optionIf assigned the QUICKDISP option (either in the user directory or by using the SET QUICKDSP command), a virtual machine enters the dispatch list immediately without waiting in the eligible list. This option should be reserved for critical VM guests (such as TCP/IP or a critical production Linux system). Users with QUICKDISP enabled move immediately from the eligible to dispatch list (regardless of LDUBUF or STORBUF settings). In Figure 5-7 on page 111, we look at the effect of QUICKDISP on Linux guests.
110 Linux on IBM Eserver zSeries and S/390: Performance Toolkit for VM
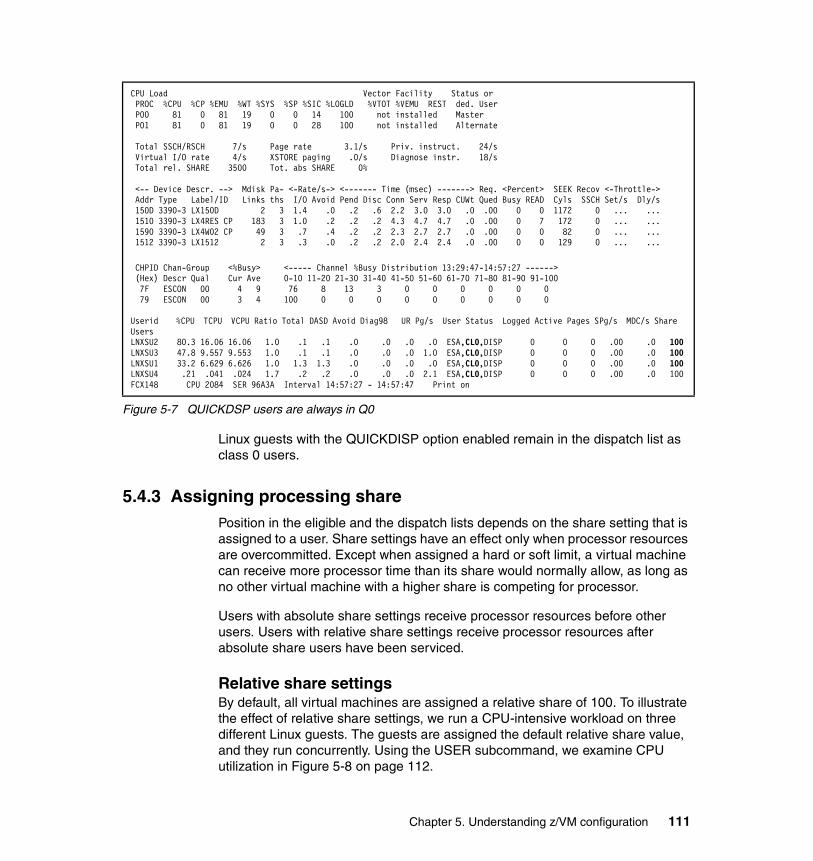
Figure 5-7 QUICKDSP users are always in Q0
Linux guests with the QUICKDISP option enabled remain in the dispatch list as class 0 users.
5.4.3 Assigning processing sharePosition in the eligible and the dispatch lists depends on the share setting that is assigned to a user. Share settings have an effect only when processor resources are overcommitted. Except when assigned a hard or soft limit, a virtual machine can receive more processor time than its share would normally allow, as long as no other virtual machine with a higher share is competing for processor.
Users with absolute share settings receive processor resources before other users. Users with relative share settings receive processor resources after absolute share users have been serviced.
Relative share settingsBy default, all virtual machines are assigned a relative share of 100. To illustrate the effect of relative share settings, we run a CPU-intensive workload on three different Linux guests. The guests are assigned the default relative share value, and they run concurrently. Using the USER subcommand, we examine CPU utilization in Figure 5-8 on page 112.
CPU Load Vector Facility Status or PROC %CPU %CP %EMU %WT %SYS %SP %SIC %LOGLD %VTOT %VEMU REST ded. User P00 81 0 81 19 0 0 14 100 not installed Master P01 81 0 81 19 0 0 28 100 not installed Alternate Total SSCH/RSCH 7/s Page rate 3.1/s Priv. instruct. 24/s Virtual I/O rate 4/s XSTORE paging .0/s Diagnose instr. 18/s Total rel. SHARE 3500 Tot. abs SHARE 0% <-- Device Descr. --> Mdisk Pa- <-Rate/s-> <------- Time (msec) -------> Req. <Percent> SEEK Recov <-Throttle-> Addr Type Label/ID Links ths I/O Avoid Pend Disc Conn Serv Resp CUWt Qued Busy READ Cyls SSCH Set/s Dly/s 150D 3390-3 LX150D 2 3 1.4 .0 .2 .6 2.2 3.0 3.0 .0 .00 0 0 1172 0 ... ... 1510 3390-3 LX4RES CP 183 3 1.0 .2 .2 .2 4.3 4.7 4.7 .0 .00 0 7 172 0 ... ... 1590 3390-3 LX4W02 CP 49 3 .7 .4 .2 .2 2.3 2.7 2.7 .0 .00 0 0 82 0 ... ... 1512 3390-3 LX1512 2 3 .3 .0 .2 .2 2.0 2.4 2.4 .0 .00 0 0 129 0 ... ... CHPID Chan-Group <%Busy> <----- Channel %Busy Distribution 13:29:47-14:57:27 ------> (Hex) Descr Qual Cur Ave 0-10 11-20 21-30 31-40 41-50 51-60 61-70 71-80 81-90 91-100 7F ESCON 00 4 9 76 8 13 3 0 0 0 0 0 0 79 ESCON 00 3 4 100 0 0 0 0 0 0 0 0 0
Userid %CPU TCPU VCPU Ratio Total DASD Avoid Diag98 UR Pg/s User Status Logged Active Pages SPg/s MDC/s Share UsersLNXSU2 80.3 16.06 16.06 1.0 .1 .1 .0 .0 .0 .0 ESA,CL0,DISP 0 0 0 .00 .0 100LNXSU3 47.8 9.557 9.553 1.0 .1 .1 .0 .0 .0 1.0 ESA,CL0,DISP 0 0 0 .00 .0 100LNXSU1 33.2 6.629 6.626 1.0 1.3 1.3 .0 .0 .0 .0 ESA,CL0,DISP 0 0 0 .00 .0 100LNXSU4 .21 .041 .024 1.7 .2 .2 .0 .0 .0 2.1 ESA,CL0,DISP 0 0 0 .00 .0 100FCX148 CPU 2084 SER 96A3A Interval 14:57:27 - 14:57:47 Print on
Chapter 5. Understanding z/VM configuration 111
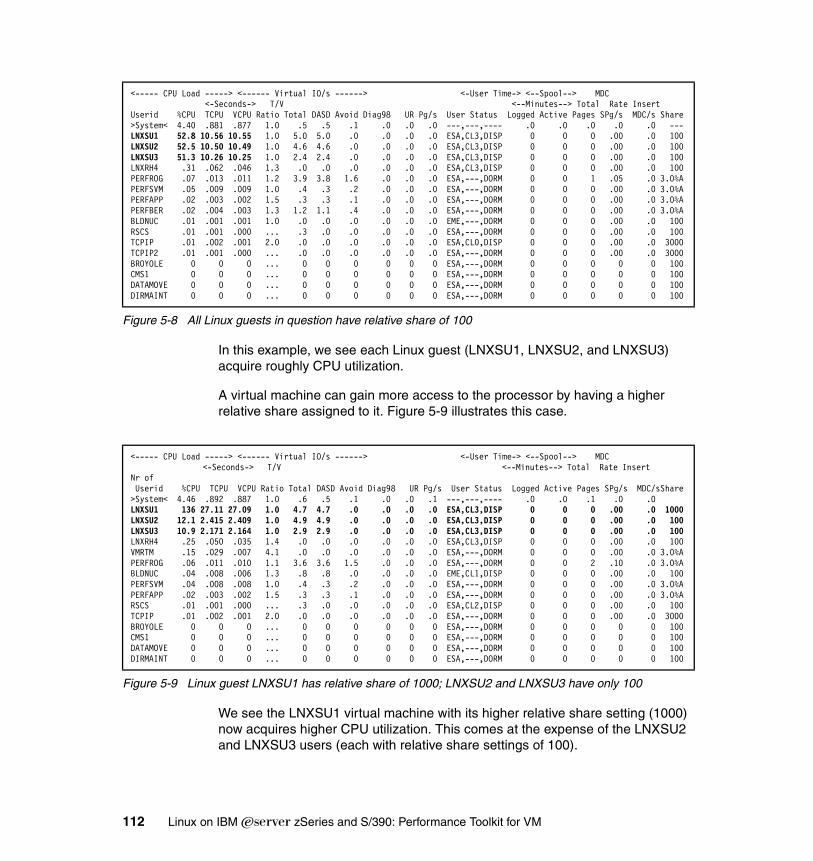
Figure 5-8 All Linux guests in question have relative share of 100
In this example, we see each Linux guest (LNXSU1, LNXSU2, and LNXSU3) acquire roughly CPU utilization.
A virtual machine can gain more access to the processor by having a higher relative share assigned to it. Figure 5-9 illustrates this case.
Figure 5-9 Linux guest LNXSU1 has relative share of 1000; LNXSU2 and LNXSU3 have only 100
We see the LNXSU1 virtual machine with its higher relative share setting (1000) now acquires higher CPU utilization. This comes at the expense of the LNXSU2 and LNXSU3 users (each with relative share settings of 100).
<----- CPU Load -----> <------ Virtual IO/s ------> <-User Time-> <--Spool--> MDC <-Seconds-> T/V <--Minutes--> Total Rate Insert Userid %CPU TCPU VCPU Ratio Total DASD Avoid Diag98 UR Pg/s User Status Logged Active Pages SPg/s MDC/s Share>System< 4.40 .881 .877 1.0 .5 .5 .1 .0 .0 .0 ---,---,---- .0 .0 .0 .0 .0 ---LNXSU1 52.8 10.56 10.55 1.0 5.0 5.0 .0 .0 .0 .0 ESA,CL3,DISP 0 0 0 .00 .0 100LNXSU2 52.5 10.50 10.49 1.0 4.6 4.6 .0 .0 .0 .0 ESA,CL3,DISP 0 0 0 .00 .0 100LNXSU3 51.3 10.26 10.25 1.0 2.4 2.4 .0 .0 .0 .0 ESA,CL3,DISP 0 0 0 .00 .0 100LNXRH4 .31 .062 .046 1.3 .0 .0 .0 .0 .0 .0 ESA,CL3,DISP 0 0 0 .00 .0 100PERFROG .07 .013 .011 1.2 3.9 3.8 1.6 .0 .0 .0 ESA,---,DORM 0 0 1 .05 .0 3.0%APERFSVM .05 .009 .009 1.0 .4 .3 .2 .0 .0 .0 ESA,---,DORM 0 0 0 .00 .0 3.0%APERFAPP .02 .003 .002 1.5 .3 .3 .1 .0 .0 .0 ESA,---,DORM 0 0 0 .00 .0 3.0%APERFBER .02 .004 .003 1.3 1.2 1.1 .4 .0 .0 .0 ESA,---,DORM 0 0 0 .00 .0 3.0%ABLDNUC .01 .001 .001 1.0 .0 .0 .0 .0 .0 .0 EME,---,DORM 0 0 0 .00 .0 100RSCS .01 .001 .000 ... .3 .0 .0 .0 .0 .0 ESA,---,DORM 0 0 0 .00 .0 100TCPIP .01 .002 .001 2.0 .0 .0 .0 .0 .0 .0 ESA,CL0,DISP 0 0 0 .00 .0 3000TCPIP2 .01 .001 .000 ... .0 .0 .0 .0 .0 .0 ESA,---,DORM 0 0 0 .00 .0 3000BROYOLE 0 0 0 ... 0 0 0 0 0 0 ESA,---,DORM 0 0 0 0 0 100CMS1 0 0 0 ... 0 0 0 0 0 0 ESA,---,DORM 0 0 0 0 0 100DATAMOVE 0 0 0 ... 0 0 0 0 0 0 ESA,---,DORM 0 0 0 0 0 100DIRMAINT 0 0 0 ... 0 0 0 0 0 0 ESA,---,DORM 0 0 0 0 0 100
<----- CPU Load -----> <------ Virtual IO/s ------> <-User Time-> <--Spool--> MDC <-Seconds-> T/V <--Minutes--> Total Rate Insert Nr of Userid %CPU TCPU VCPU Ratio Total DASD Avoid Diag98 UR Pg/s User Status Logged Active Pages SPg/s MDC/sShare>System< 4.46 .892 .887 1.0 .6 .5 .1 .0 .0 .1 ---,---,---- .0 .0 .1 .0 .0 LNXSU1 136 27.11 27.09 1.0 4.7 4.7 .0 .0 .0 .0 ESA,CL3,DISP 0 0 0 .00 .0 1000LNXSU2 12.1 2.415 2.409 1.0 4.9 4.9 .0 .0 .0 .0 ESA,CL3,DISP 0 0 0 .00 .0 100LNXSU3 10.9 2.171 2.164 1.0 2.9 2.9 .0 .0 .0 .0 ESA,CL3,DISP 0 0 0 .00 .0 100LNXRH4 .25 .050 .035 1.4 .0 .0 .0 .0 .0 .0 ESA,CL3,DISP 0 0 0 .00 .0 100VMRTM .15 .029 .007 4.1 .0 .0 .0 .0 .0 .0 ESA,---,DORM 0 0 0 .00 .0 3.0%APERFROG .06 .011 .010 1.1 3.6 3.6 1.5 .0 .0 .0 ESA,---,DORM 0 0 2 .10 .0 3.0%ABLDNUC .04 .008 .006 1.3 .8 .8 .0 .0 .0 .0 EME,CL1,DISP 0 0 0 .00 .0 100PERFSVM .04 .008 .008 1.0 .4 .3 .2 .0 .0 .0 ESA,---,DORM 0 0 0 .00 .0 3.0%APERFAPP .02 .003 .002 1.5 .3 .3 .1 .0 .0 .0 ESA,---,DORM 0 0 0 .00 .0 3.0%ARSCS .01 .001 .000 ... .3 .0 .0 .0 .0 .0 ESA,CL2,DISP 0 0 0 .00 .0 100TCPIP .01 .002 .001 2.0 .0 .0 .0 .0 .0 .0 ESA,---,DORM 0 0 0 .00 .0 3000BROYOLE 0 0 0 ... 0 0 0 0 0 0 ESA,---,DORM 0 0 0 0 0 100CMS1 0 0 0 ... 0 0 0 0 0 0 ESA,---,DORM 0 0 0 0 0 100DATAMOVE 0 0 0 ... 0 0 0 0 0 0 ESA,---,DORM 0 0 0 0 0 100DIRMAINT 0 0 0 ... 0 0 0 0 0 0 ESA,---,DORM 0 0 0 0 0 100
112 Linux on IBM Eserver zSeries and S/390: Performance Toolkit for VM

Absolute share settingsAbsolute share settings guarantee a minimum portion of the total processor resource to a user. When a virtual machine becomes idle, any CPU time with an absolute share also has priority to get the remainder of unused CPU time from virtual machines becoming idle.
Absolute share should be assigned to the few critical users requiring immediate response time. By default, PERFSVM is an absolute share value of 3%.
5.5 System countersFigure 5-10 shows the output from entering the SYSTEM command (or selecting option 5).
Figure 5-10 System counters screen: current values
FCX102 CPU 2084 SER 96A3A Interval 11:12:33 - 11:13:33 Perf. Monitor Operation Count Rate/s Operation Count Rate/s Real SSCH instructions 206 3.4 Real CSCH instructions 0 .0 Real HSCH instructions 0 .0 El. time slice drops 22 .4 SVC instr. simulated 0 .0 SVC interrupts reflectd 0 .0 SVC 76 reflected 0 .0 Diagnose I/O requests 40 .7 FP external call simul. 0 .0 FP partial executions 72 1.2 Fast-path SIGP simulat. 0 .0 FP simul. of Diag.X'44' 0 .0 FP successful x-lates 76 1.3 CCW chains not FP-elig. 0 .0 Fast-path aborts 12 .2 Total FP xlate attempts 88 1.5 Nr. of SIE executions 19961 332 Nr. of SIE intercepts 19894 331 Entries to enabled wait 18277 304 Storage Management Subpool FREE requests 2041 34.0 Total FREE requests 2045 34.1 V=R subpool FREE req. 0 .0 Storage fast clears 92 1.5 Avail. list frame req. 179 3.0 Available list empty 0 .0 Demand scan 1st pass 0 .0 Demand scan 2nd pass 0 .0 Demand scan emergency 0 .0 Demand scan not satisf. 0 .0 System stor. pgs taken 0 .0 Shared stor. pgs taken 0 .0 Dispatch lst pgs stolen 0 .0 Eligible lst pgs stolen 0 .0 Pgs from dormant users 0 .0 Pages taken for FREE 0 .0 Fast PGINs from XSTORE 0 .0 Slow PGINs from XSTORE 0 .0 PGOUTs main to XSTORE 0 .0 No XSTORE available 0 .0 XSTORE allocations 0 .0 XSTORE releases 0 .0 Glbl cycl list searched 0 .0 Migr. target time reset 0 .0 Migr thresh buf increas 0 .0 Migr thresh buf lowered 0 .0 Page migr. from dormant 0 .0 Dormant with page migr. 0 .0
Chapter 5. Understanding z/VM configuration 113
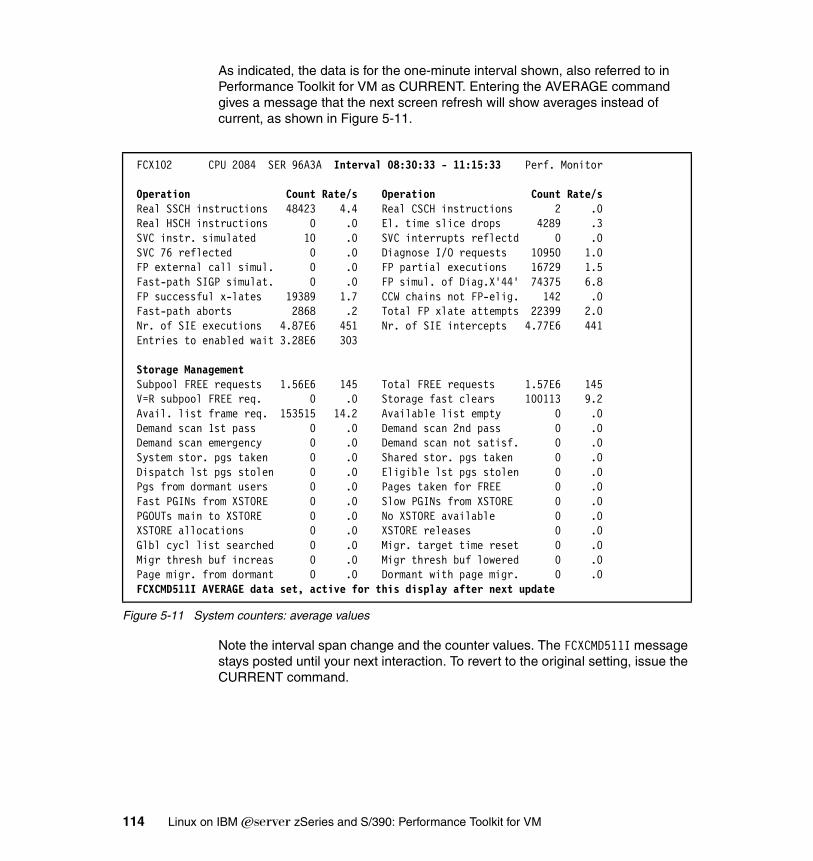
As indicated, the data is for the one-minute interval shown, also referred to in Performance Toolkit for VM as CURRENT. Entering the AVERAGE command gives a message that the next screen refresh will show averages instead of current, as shown in Figure 5-11.
Figure 5-11 System counters: average values
Note the interval span change and the counter values. The FCXCMD511I message stays posted until your next interaction. To revert to the original setting, issue the CURRENT command.
FCX102 CPU 2084 SER 96A3A Interval 08:30:33 - 11:15:33 Perf. Monitor Operation Count Rate/s Operation Count Rate/s Real SSCH instructions 48423 4.4 Real CSCH instructions 2 .0 Real HSCH instructions 0 .0 El. time slice drops 4289 .3 SVC instr. simulated 10 .0 SVC interrupts reflectd 0 .0 SVC 76 reflected 0 .0 Diagnose I/O requests 10950 1.0 FP external call simul. 0 .0 FP partial executions 16729 1.5 Fast-path SIGP simulat. 0 .0 FP simul. of Diag.X'44' 74375 6.8 FP successful x-lates 19389 1.7 CCW chains not FP-elig. 142 .0 Fast-path aborts 2868 .2 Total FP xlate attempts 22399 2.0 Nr. of SIE executions 4.87E6 451 Nr. of SIE intercepts 4.77E6 441 Entries to enabled wait 3.28E6 303 Storage Management Subpool FREE requests 1.56E6 145 Total FREE requests 1.57E6 145 V=R subpool FREE req. 0 .0 Storage fast clears 100113 9.2 Avail. list frame req. 153515 14.2 Available list empty 0 .0 Demand scan 1st pass 0 .0 Demand scan 2nd pass 0 .0 Demand scan emergency 0 .0 Demand scan not satisf. 0 .0 System stor. pgs taken 0 .0 Shared stor. pgs taken 0 .0 Dispatch lst pgs stolen 0 .0 Eligible lst pgs stolen 0 .0 Pgs from dormant users 0 .0 Pages taken for FREE 0 .0 Fast PGINs from XSTORE 0 .0 Slow PGINs from XSTORE 0 .0 PGOUTs main to XSTORE 0 .0 No XSTORE available 0 .0 XSTORE allocations 0 .0 XSTORE releases 0 .0 Glbl cycl list searched 0 .0 Migr. target time reset 0 .0 Migr thresh buf increas 0 .0 Migr thresh buf lowered 0 .0 Page migr. from dormant 0 .0 Dormant with page migr. 0 .0 FCXCMD511I AVERAGE data set, active for this display after next update
114 Linux on IBM Eserver zSeries and S/390: Performance Toolkit for VM
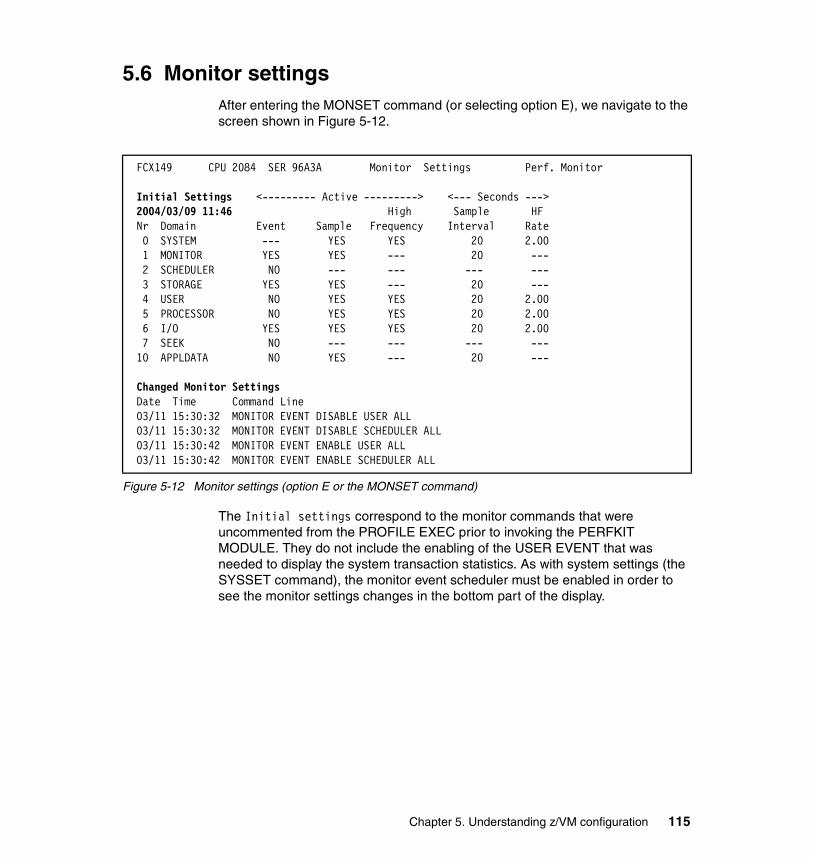
5.6 Monitor settingsAfter entering the MONSET command (or selecting option E), we navigate to the screen shown in Figure 5-12.
Figure 5-12 Monitor settings (option E or the MONSET command)
The Initial settings correspond to the monitor commands that were uncommented from the PROFILE EXEC prior to invoking the PERFKIT MODULE. They do not include the enabling of the USER EVENT that was needed to display the system transaction statistics. As with system settings (the SYSSET command), the monitor event scheduler must be enabled in order to see the monitor settings changes in the bottom part of the display.
FCX149 CPU 2084 SER 96A3A Monitor Settings Perf. Monitor Initial Settings <--------- Active ---------> <--- Seconds ---> 2004/03/09 11:46 High Sample HF Nr Domain Event Sample Frequency Interval Rate 0 SYSTEM --- YES YES 20 2.00 1 MONITOR YES YES --- 20 --- 2 SCHEDULER NO --- --- --- --- 3 STORAGE YES YES --- 20 --- 4 USER NO YES YES 20 2.00 5 PROCESSOR NO YES YES 20 2.00 6 I/O YES YES YES 20 2.00 7 SEEK NO --- --- --- --- 10 APPLDATA NO YES --- 20 --- Changed Monitor Settings Date Time Command Line 03/11 15:30:32 MONITOR EVENT DISABLE USER ALL 03/11 15:30:32 MONITOR EVENT DISABLE SCHEDULER ALL 03/11 15:30:42 MONITOR EVENT ENABLE USER ALL 03/11 15:30:42 MONITOR EVENT ENABLE SCHEDULER ALL
Chapter 5. Understanding z/VM configuration 115
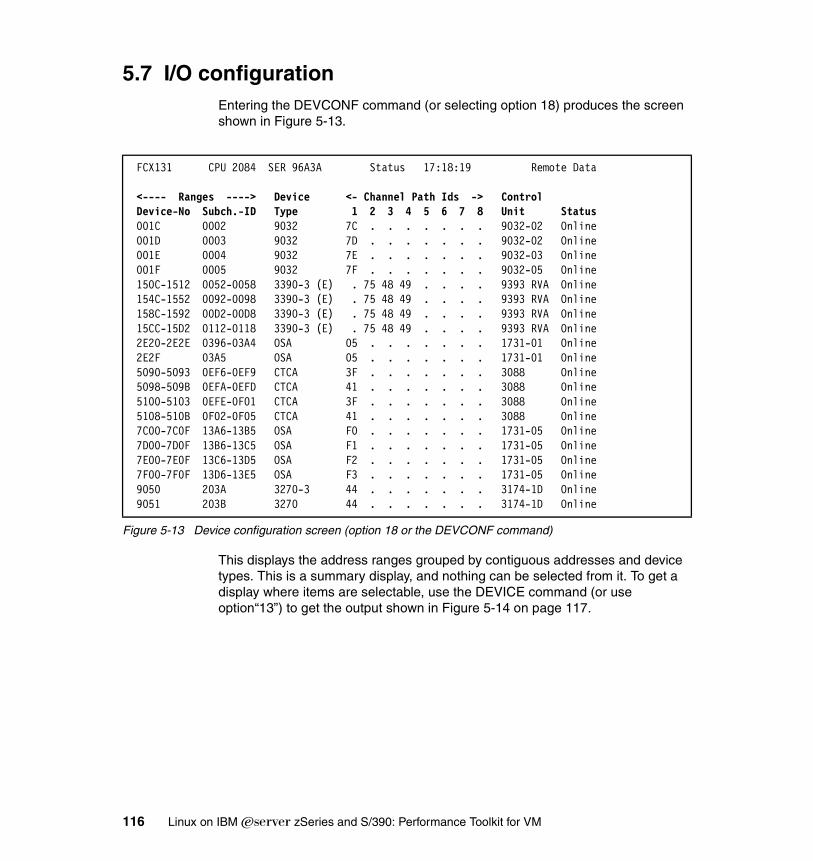
5.7 I/O configurationEntering the DEVCONF command (or selecting option 18) produces the screen shown in Figure 5-13.
Figure 5-13 Device configuration screen (option 18 or the DEVCONF command)
This displays the address ranges grouped by contiguous addresses and device types. This is a summary display, and nothing can be selected from it. To get a display where items are selectable, use the DEVICE command (or use option“13”) to get the output shown in Figure 5-14 on page 117.
FCX131 CPU 2084 SER 96A3A Status 17:18:19 Remote Data <---- Ranges ----> Device <- Channel Path Ids -> Control Device-No Subch.-ID Type 1 2 3 4 5 6 7 8 Unit Status 001C 0002 9032 7C . . . . . . . 9032-02 Online 001D 0003 9032 7D . . . . . . . 9032-02 Online 001E 0004 9032 7E . . . . . . . 9032-03 Online 001F 0005 9032 7F . . . . . . . 9032-05 Online 150C-1512 0052-0058 3390-3 (E) . 75 48 49 . . . . 9393 RVA Online 154C-1552 0092-0098 3390-3 (E) . 75 48 49 . . . . 9393 RVA Online 158C-1592 00D2-00D8 3390-3 (E) . 75 48 49 . . . . 9393 RVA Online 15CC-15D2 0112-0118 3390-3 (E) . 75 48 49 . . . . 9393 RVA Online 2E20-2E2E 0396-03A4 OSA 05 . . . . . . . 1731-01 Online 2E2F 03A5 OSA 05 . . . . . . . 1731-01 Online 5090-5093 0EF6-0EF9 CTCA 3F . . . . . . . 3088 Online 5098-509B 0EFA-0EFD CTCA 41 . . . . . . . 3088 Online 5100-5103 0EFE-0F01 CTCA 3F . . . . . . . 3088 Online 5108-510B 0F02-0F05 CTCA 41 . . . . . . . 3088 Online 7C00-7C0F 13A6-13B5 OSA F0 . . . . . . . 1731-05 Online 7D00-7D0F 13B6-13C5 OSA F1 . . . . . . . 1731-05 Online 7E00-7E0F 13C6-13D5 OSA F2 . . . . . . . 1731-05 Online 7F00-7F0F 13D6-13E5 OSA F3 . . . . . . . 1731-05 Online 9050 203A 3270-3 44 . . . . . . . 3174-1D Online 9051 203B 3270 44 . . . . . . . 3174-1D Online
116 Linux on IBM Eserver zSeries and S/390: Performance Toolkit for VM
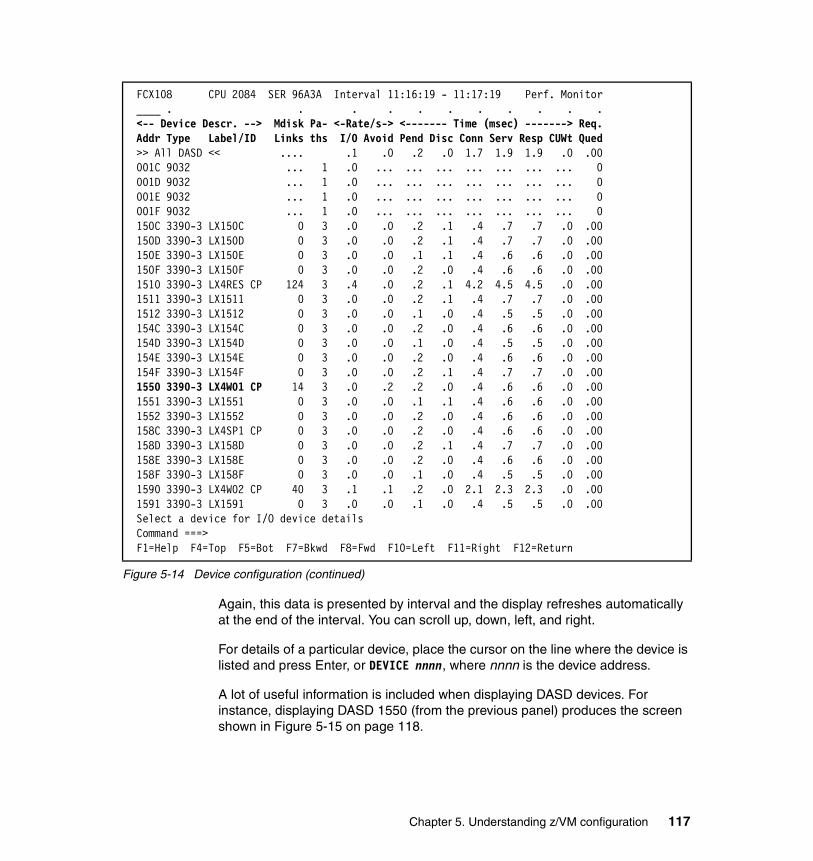
Figure 5-14 Device configuration (continued)
Again, this data is presented by interval and the display refreshes automatically at the end of the interval. You can scroll up, down, left, and right.
For details of a particular device, place the cursor on the line where the device is listed and press Enter, or DEVICE nnnn, where nnnn is the device address.
A lot of useful information is included when displaying DASD devices. For instance, displaying DASD 1550 (from the previous panel) produces the screen shown in Figure 5-15 on page 118.
FCX108 CPU 2084 SER 96A3A Interval 11:16:19 - 11:17:19 Perf. Monitor ____ . . . . . . . . . . . <-- Device Descr. --> Mdisk Pa- <-Rate/s-> <------- Time (msec) -------> Req. Addr Type Label/ID Links ths I/O Avoid Pend Disc Conn Serv Resp CUWt Qued >> All DASD << .... .1 .0 .2 .0 1.7 1.9 1.9 .0 .00 001C 9032 ... 1 .0 ... ... ... ... ... ... ... 0 001D 9032 ... 1 .0 ... ... ... ... ... ... ... 0 001E 9032 ... 1 .0 ... ... ... ... ... ... ... 0 001F 9032 ... 1 .0 ... ... ... ... ... ... ... 0 150C 3390-3 LX150C 0 3 .0 .0 .2 .1 .4 .7 .7 .0 .00 150D 3390-3 LX150D 0 3 .0 .0 .2 .1 .4 .7 .7 .0 .00 150E 3390-3 LX150E 0 3 .0 .0 .1 .1 .4 .6 .6 .0 .00 150F 3390-3 LX150F 0 3 .0 .0 .2 .0 .4 .6 .6 .0 .00 1510 3390-3 LX4RES CP 124 3 .4 .0 .2 .1 4.2 4.5 4.5 .0 .00 1511 3390-3 LX1511 0 3 .0 .0 .2 .1 .4 .7 .7 .0 .00 1512 3390-3 LX1512 0 3 .0 .0 .1 .0 .4 .5 .5 .0 .00 154C 3390-3 LX154C 0 3 .0 .0 .2 .0 .4 .6 .6 .0 .00 154D 3390-3 LX154D 0 3 .0 .0 .1 .0 .4 .5 .5 .0 .00 154E 3390-3 LX154E 0 3 .0 .0 .2 .0 .4 .6 .6 .0 .00 154F 3390-3 LX154F 0 3 .0 .0 .2 .1 .4 .7 .7 .0 .00 1550 3390-3 LX4W01 CP 14 3 .0 .2 .2 .0 .4 .6 .6 .0 .00 1551 3390-3 LX1551 0 3 .0 .0 .1 .1 .4 .6 .6 .0 .00 1552 3390-3 LX1552 0 3 .0 .0 .2 .0 .4 .6 .6 .0 .00 158C 3390-3 LX4SP1 CP 0 3 .0 .0 .2 .0 .4 .6 .6 .0 .00 158D 3390-3 LX158D 0 3 .0 .0 .2 .1 .4 .7 .7 .0 .00 158E 3390-3 LX158E 0 3 .0 .0 .2 .0 .4 .6 .6 .0 .00 158F 3390-3 LX158F 0 3 .0 .0 .1 .0 .4 .5 .5 .0 .00 1590 3390-3 LX4W02 CP 40 3 .1 .1 .2 .0 2.1 2.3 2.3 .0 .00 1591 3390-3 LX1591 0 3 .0 .0 .1 .0 .4 .5 .5 .0 .00 Select a device for I/O device details Command ===> F1=Help F4=Top F5=Bot F7=Bkwd F8=Fwd F10=Left F11=Right F12=Return
Chapter 5. Understanding z/VM configuration 117
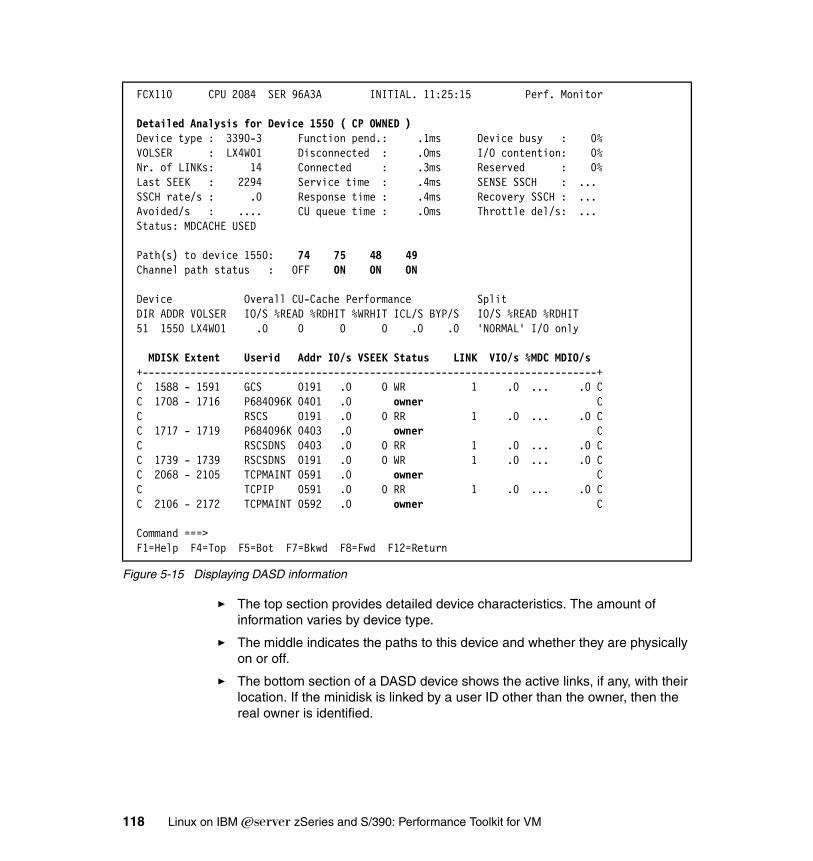
Figure 5-15 Displaying DASD information
� The top section provides detailed device characteristics. The amount of information varies by device type.
� The middle indicates the paths to this device and whether they are physically on or off.
� The bottom section of a DASD device shows the active links, if any, with their location. If the minidisk is linked by a user ID other than the owner, then the real owner is identified.
FCX110 CPU 2084 SER 96A3A INITIAL. 11:25:15 Perf. Monitor Detailed Analysis for Device 1550 ( CP OWNED ) Device type : 3390-3 Function pend.: .1ms Device busy : 0% VOLSER : LX4W01 Disconnected : .0ms I/O contention: 0% Nr. of LINKs: 14 Connected : .3ms Reserved : 0% Last SEEK : 2294 Service time : .4ms SENSE SSCH : ... SSCH rate/s : .0 Response time : .4ms Recovery SSCH : ... Avoided/s : .... CU queue time : .0ms Throttle del/s: ... Status: MDCACHE USED Path(s) to device 1550: 74 75 48 49 Channel path status : OFF ON ON ON Device Overall CU-Cache Performance Split DIR ADDR VOLSER IO/S %READ %RDHIT %WRHIT ICL/S BYP/S IO/S %READ %RDHIT 51 1550 LX4W01 .0 0 0 0 .0 .0 'NORMAL' I/O only MDISK Extent Userid Addr IO/s VSEEK Status LINK VIO/s %MDC MDIO/s +----------------------------------------------------------------------------+ C 1588 - 1591 GCS 0191 .0 0 WR 1 .0 ... .0 C C 1708 - 1716 P684096K 0401 .0 owner C C RSCS 0191 .0 0 RR 1 .0 ... .0 C C 1717 - 1719 P684096K 0403 .0 owner C C RSCSDNS 0403 .0 0 RR 1 .0 ... .0 C C 1739 - 1739 RSCSDNS 0191 .0 0 WR 1 .0 ... .0 C C 2068 - 2105 TCPMAINT 0591 .0 owner C C TCPIP 0591 .0 0 RR 1 .0 ... .0 C C 2106 - 2172 TCPMAINT 0592 .0 owner C Command ===> F1=Help F4=Top F5=Bot F7=Bkwd F8=Fwd F12=Return
118 Linux on IBM Eserver zSeries and S/390: Performance Toolkit for VM
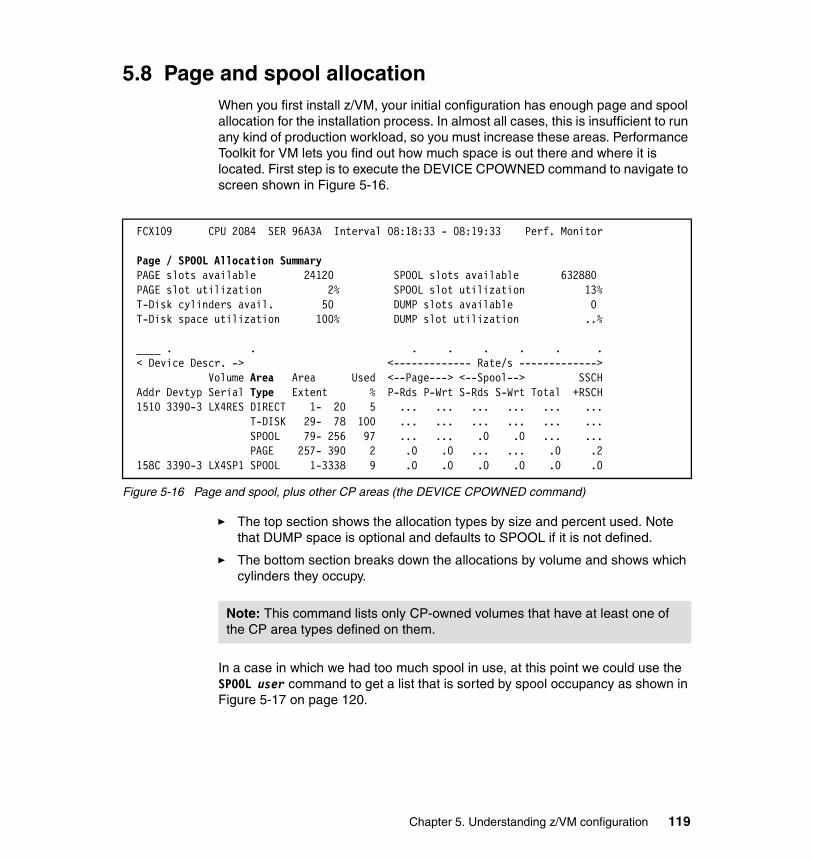
5.8 Page and spool allocationWhen you first install z/VM, your initial configuration has enough page and spool allocation for the installation process. In almost all cases, this is insufficient to run any kind of production workload, so you must increase these areas. Performance Toolkit for VM lets you find out how much space is out there and where it is located. First step is to execute the DEVICE CPOWNED command to navigate to screen shown in Figure 5-16.
Figure 5-16 Page and spool, plus other CP areas (the DEVICE CPOWNED command)
� The top section shows the allocation types by size and percent used. Note that DUMP space is optional and defaults to SPOOL if it is not defined.
� The bottom section breaks down the allocations by volume and shows which cylinders they occupy.
In a case in which we had too much spool in use, at this point we could use the SPOOL user command to get a list that is sorted by spool occupancy as shown in Figure 5-17 on page 120.
FCX109 CPU 2084 SER 96A3A Interval 08:18:33 - 08:19:33 Perf. Monitor Page / SPOOL Allocation Summary PAGE slots available 24120 SPOOL slots available 632880 PAGE slot utilization 2% SPOOL slot utilization 13% T-Disk cylinders avail. 50 DUMP slots available 0 T-Disk space utilization 100% DUMP slot utilization ..% ____ . . . . . . . . < Device Descr. -> <------------- Rate/s -------------> Volume Area Area Used <--Page---> <--Spool--> SSCH Addr Devtyp Serial Type Extent % P-Rds P-Wrt S-Rds S-Wrt Total +RSCH 1510 3390-3 LX4RES DIRECT 1- 20 5 ... ... ... ... ... ... T-DISK 29- 78 100 ... ... ... ... ... ... SPOOL 79- 256 97 ... ... .0 .0 ... ... PAGE 257- 390 2 .0 .0 ... ... .0 .2 158C 3390-3 LX4SP1 SPOOL 1-3338 9 .0 .0 .0 .0 .0 .0
Note: This command lists only CP-owned volumes that have at least one of the CP area types defined on them.
Chapter 5. Understanding z/VM configuration 119
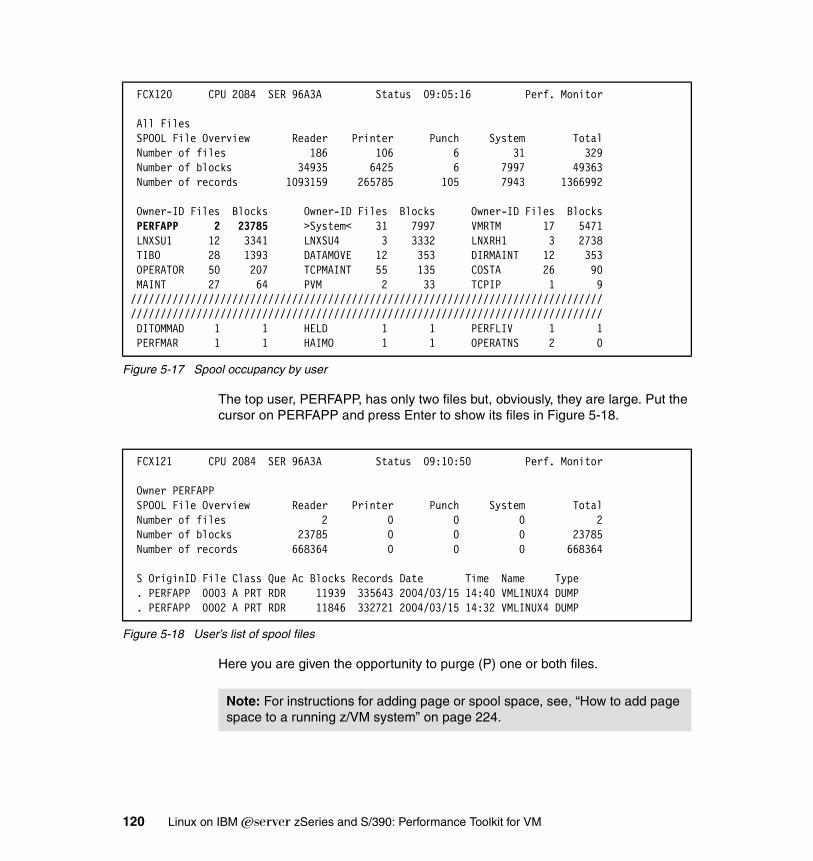
Figure 5-17 Spool occupancy by user
The top user, PERFAPP, has only two files but, obviously, they are large. Put the cursor on PERFAPP and press Enter to show its files in Figure 5-18.
Figure 5-18 User’s list of spool files
Here you are given the opportunity to purge (P) one or both files.
FCX120 CPU 2084 SER 96A3A Status 09:05:16 Perf. Monitor All Files SPOOL File Overview Reader Printer Punch System Total Number of files 186 106 6 31 329 Number of blocks 34935 6425 6 7997 49363 Number of records 1093159 265785 105 7943 1366992 Owner-ID Files Blocks Owner-ID Files Blocks Owner-ID Files Blocks PERFAPP 2 23785 >System< 31 7997 VMRTM 17 5471 LNXSU1 12 3341 LNXSU4 3 3332 LNXRH1 3 2738 TIBO 28 1393 DATAMOVE 12 353 DIRMAINT 12 353 OPERATOR 50 207 TCPMAINT 55 135 COSTA 26 90 MAINT 27 64 PVM 2 33 TCPIP 1 9////////////////////////////////////////////////////////////////////////////////////////////////////////////////////////////////////////////////////////////// DITOMMAD 1 1 HELD 1 1 PERFLIV 1 1 PERFMAR 1 1 HAIMO 1 1 OPERATNS 2 0
FCX121 CPU 2084 SER 96A3A Status 09:10:50 Perf. Monitor Owner PERFAPP SPOOL File Overview Reader Printer Punch System Total Number of files 2 0 0 0 2 Number of blocks 23785 0 0 0 23785 Number of records 668364 0 0 0 668364 S OriginID File Class Que Ac Blocks Records Date Time Name Type . PERFAPP 0003 A PRT RDR 11939 335643 2004/03/15 14:40 VMLINUX4 DUMP . PERFAPP 0002 A PRT RDR 11846 332721 2004/03/15 14:32 VMLINUX4 DUMP
Note: For instructions for adding page or spool space, see, “How to add page space to a running z/VM system” on page 224.
120 Linux on IBM Eserver zSeries and S/390: Performance Toolkit for VM
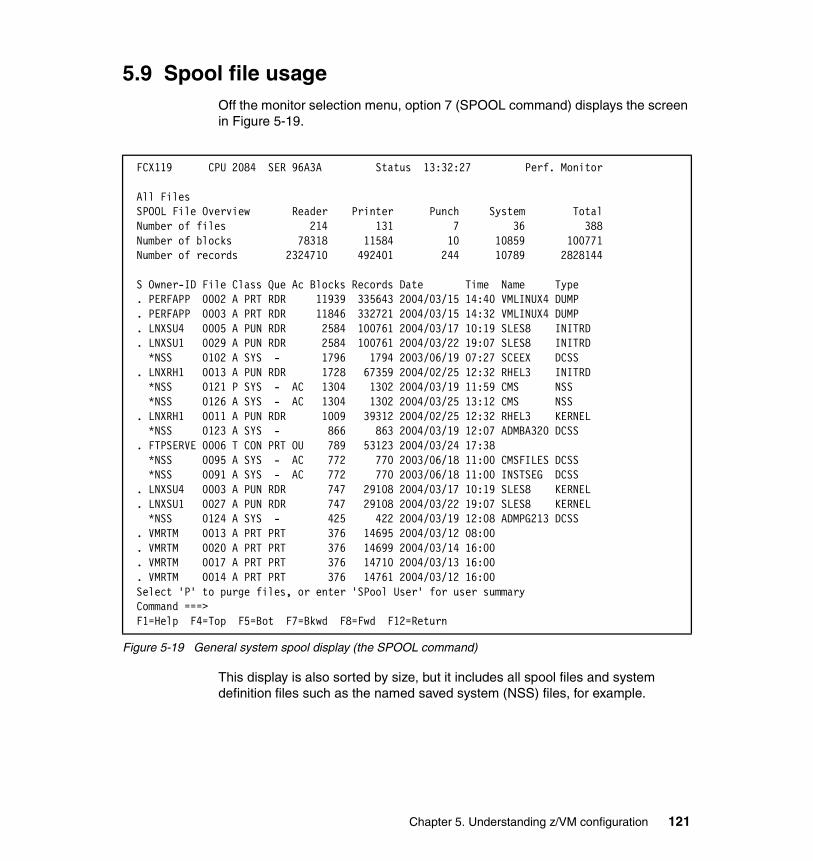
5.9 Spool file usageOff the monitor selection menu, option 7 (SPOOL command) displays the screen in Figure 5-19.
Figure 5-19 General system spool display (the SPOOL command)
This display is also sorted by size, but it includes all spool files and system definition files such as the named saved system (NSS) files, for example.
FCX119 CPU 2084 SER 96A3A Status 13:32:27 Perf. Monitor All Files SPOOL File Overview Reader Printer Punch System Total Number of files 214 131 7 36 388 Number of blocks 78318 11584 10 10859 100771 Number of records 2324710 492401 244 10789 2828144 S Owner-ID File Class Que Ac Blocks Records Date Time Name Type . PERFAPP 0002 A PRT RDR 11939 335643 2004/03/15 14:40 VMLINUX4 DUMP . PERFAPP 0003 A PRT RDR 11846 332721 2004/03/15 14:32 VMLINUX4 DUMP . LNXSU4 0005 A PUN RDR 2584 100761 2004/03/17 10:19 SLES8 INITRD . LNXSU1 0029 A PUN RDR 2584 100761 2004/03/22 19:07 SLES8 INITRD *NSS 0102 A SYS - 1796 1794 2003/06/19 07:27 SCEEX DCSS . LNXRH1 0013 A PUN RDR 1728 67359 2004/02/25 12:32 RHEL3 INITRD *NSS 0121 P SYS - AC 1304 1302 2004/03/19 11:59 CMS NSS *NSS 0126 A SYS - AC 1304 1302 2004/03/25 13:12 CMS NSS . LNXRH1 0011 A PUN RDR 1009 39312 2004/02/25 12:32 RHEL3 KERNEL *NSS 0123 A SYS - 866 863 2004/03/19 12:07 ADMBA320 DCSS . FTPSERVE 0006 T CON PRT OU 789 53123 2004/03/24 17:38 *NSS 0095 A SYS - AC 772 770 2003/06/18 11:00 CMSFILES DCSS *NSS 0091 A SYS - AC 772 770 2003/06/18 11:00 INSTSEG DCSS . LNXSU4 0003 A PUN RDR 747 29108 2004/03/17 10:19 SLES8 KERNEL . LNXSU1 0027 A PUN RDR 747 29108 2004/03/22 19:07 SLES8 KERNEL *NSS 0124 A SYS - 425 422 2004/03/19 12:08 ADMPG213 DCSS . VMRTM 0013 A PRT PRT 376 14695 2004/03/12 08:00 . VMRTM 0020 A PRT PRT 376 14699 2004/03/14 16:00 . VMRTM 0017 A PRT PRT 376 14710 2004/03/13 16:00 . VMRTM 0014 A PRT PRT 376 14761 2004/03/12 16:00 Select 'P' to purge files, or enter 'SPool User' for user summary Command ===> F1=Help F4=Top F5=Bot F7=Bkwd F8=Fwd F12=Return
Chapter 5. Understanding z/VM configuration 121
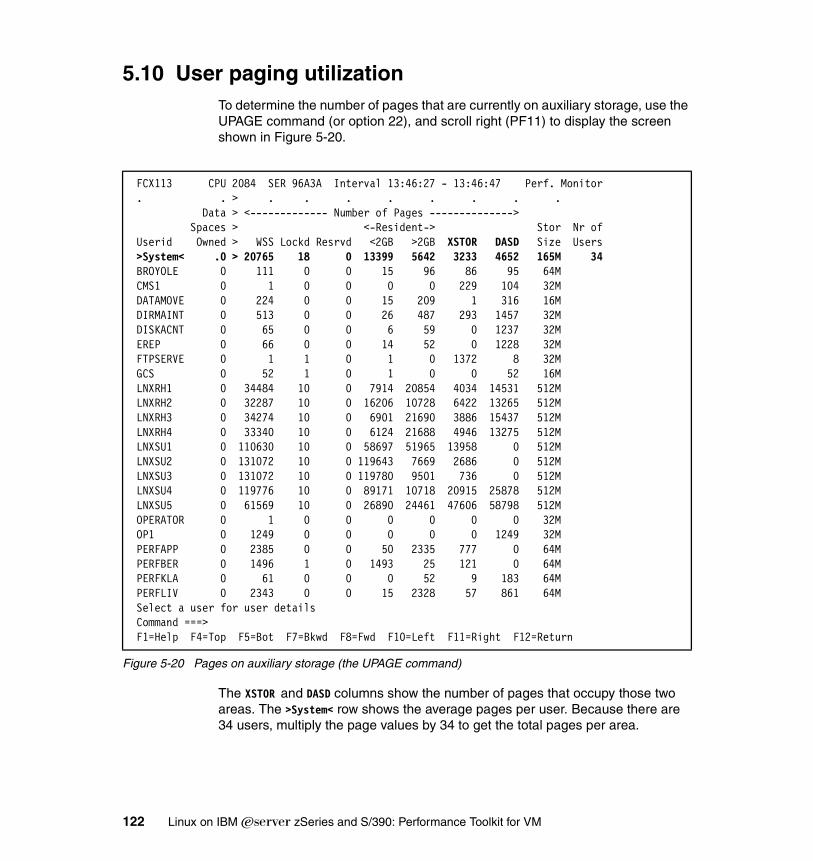
5.10 User paging utilizationTo determine the number of pages that are currently on auxiliary storage, use the UPAGE command (or option 22), and scroll right (PF11) to display the screen shown in Figure 5-20.
Figure 5-20 Pages on auxiliary storage (the UPAGE command)
The XSTOR and DASD columns show the number of pages that occupy those two areas. The >System< row shows the average pages per user. Because there are 34 users, multiply the page values by 34 to get the total pages per area.
FCX113 CPU 2084 SER 96A3A Interval 13:46:27 - 13:46:47 Perf. Monitor . . > . . . . . . . . Data > <------------- Number of Pages --------------> Spaces > <-Resident-> Stor Nr of Userid Owned > WSS Lockd Resrvd <2GB >2GB XSTOR DASD Size Users >System< .0 > 20765 18 0 13399 5642 3233 4652 165M 34 BROYOLE 0 111 0 0 15 96 86 95 64M CMS1 0 1 0 0 0 0 229 104 32M DATAMOVE 0 224 0 0 15 209 1 316 16M DIRMAINT 0 513 0 0 26 487 293 1457 32M DISKACNT 0 65 0 0 6 59 0 1237 32M EREP 0 66 0 0 14 52 0 1228 32M FTPSERVE 0 1 1 0 1 0 1372 8 32M GCS 0 52 1 0 1 0 0 52 16M LNXRH1 0 34484 10 0 7914 20854 4034 14531 512M LNXRH2 0 32287 10 0 16206 10728 6422 13265 512M LNXRH3 0 34274 10 0 6901 21690 3886 15437 512M LNXRH4 0 33340 10 0 6124 21688 4946 13275 512M LNXSU1 0 110630 10 0 58697 51965 13958 0 512M LNXSU2 0 131072 10 0 119643 7669 2686 0 512M LNXSU3 0 131072 10 0 119780 9501 736 0 512M LNXSU4 0 119776 10 0 89171 10718 20915 25878 512M LNXSU5 0 61569 10 0 26890 24461 47606 58798 512M OPERATOR 0 1 0 0 0 0 0 0 32M OP1 0 1249 0 0 0 0 0 1249 32M PERFAPP 0 2385 0 0 50 2335 777 0 64M PERFBER 0 1496 1 0 1493 25 121 0 64M PERFKLA 0 61 0 0 0 52 9 183 64M PERFLIV 0 2343 0 0 15 2328 57 861 64M Select a user for user details Command ===> F1=Help F4=Top F5=Bot F7=Bkwd F8=Fwd F10=Left F11=Right F12=Return
122 Linux on IBM Eserver zSeries and S/390: Performance Toolkit for VM
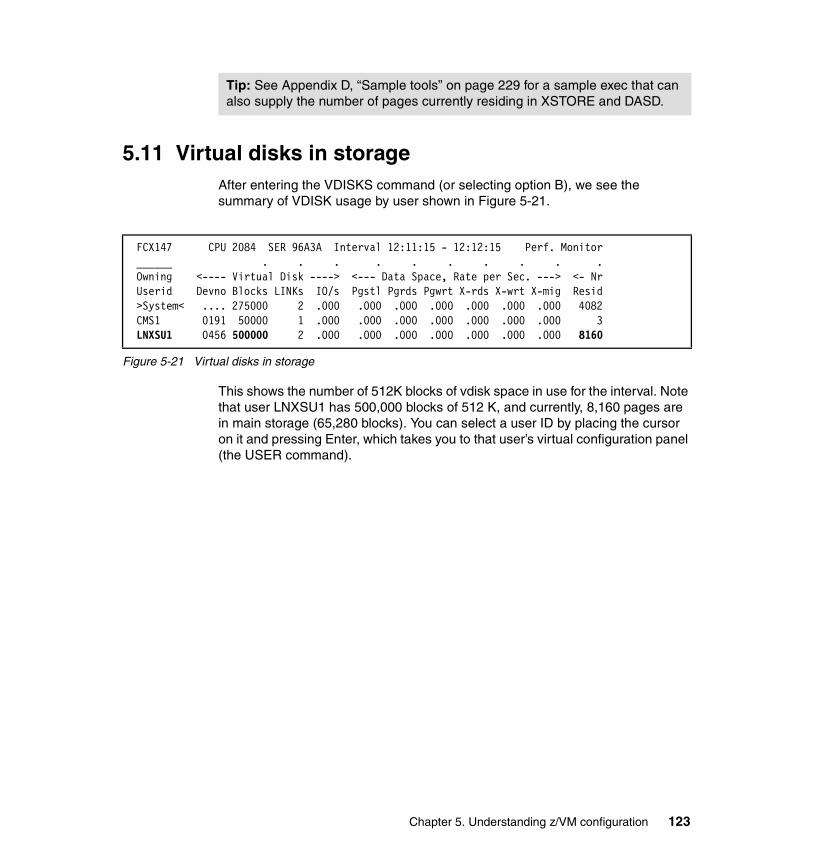
5.11 Virtual disks in storageAfter entering the VDISKS command (or selecting option B), we see the summary of VDISK usage by user shown in Figure 5-21.
Figure 5-21 Virtual disks in storage
This shows the number of 512K blocks of vdisk space in use for the interval. Note that user LNXSU1 has 500,000 blocks of 512 K, and currently, 8,160 pages are in main storage (65,280 blocks). You can select a user ID by placing the cursor on it and pressing Enter, which takes you to that user’s virtual configuration panel (the USER command).
Tip: See Appendix D, “Sample tools” on page 229 for a sample exec that can also supply the number of pages currently residing in XSTORE and DASD.
FCX147 CPU 2084 SER 96A3A Interval 12:11:15 - 12:12:15 Perf. Monitor ______ . . . . . . . . . . Owning <---- Virtual Disk ----> <--- Data Space, Rate per Sec. ---> <- Nr Userid Devno Blocks LINKs IO/s Pgstl Pgrds Pgwrt X-rds X-wrt X-mig Resid >System< .... 275000 2 .000 .000 .000 .000 .000 .000 .000 4082 CMS1 0191 50000 1 .000 .000 .000 .000 .000 .000 .000 3 LNXSU1 0456 500000 2 .000 .000 .000 .000 .000 .000 .000 8160
Chapter 5. Understanding z/VM configuration 123

124 Linux on IBM Eserver zSeries and S/390: Performance Toolkit for VM
Chapter 6. Analyzing I/O and network performance
In this chapter, we discuss Performance Toolkit for VM screens that provide monitoring data that is useful in understanding performance of DASD I/O and network devices. Topics include:
� Analyzing I/O to DASD performance
� Channel monitoring
� Control unit monitoring
� I/O device load
� Analyzing VM TCP/IP data
6
© Copyright IBM Corp. 2004. All rights reserved. 125
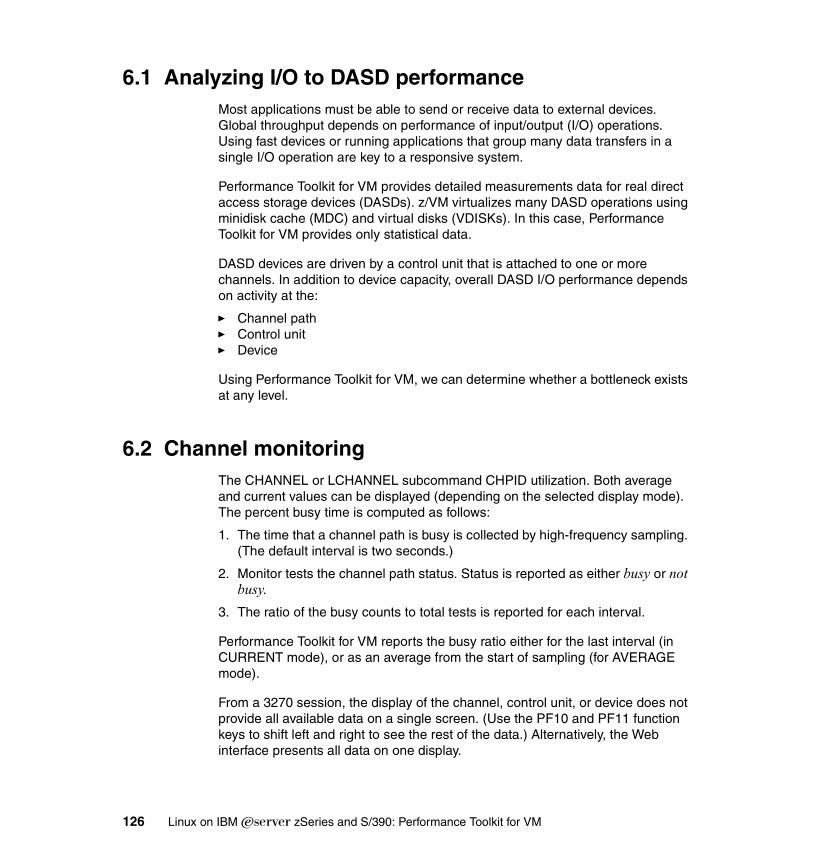
6.1 Analyzing I/O to DASD performanceMost applications must be able to send or receive data to external devices. Global throughput depends on performance of input/output (I/O) operations. Using fast devices or running applications that group many data transfers in a single I/O operation are key to a responsive system.
Performance Toolkit for VM provides detailed measurements data for real direct access storage devices (DASDs). z/VM virtualizes many DASD operations using minidisk cache (MDC) and virtual disks (VDISKs). In this case, Performance Toolkit for VM provides only statistical data.
DASD devices are driven by a control unit that is attached to one or more channels. In addition to device capacity, overall DASD I/O performance depends on activity at the:
� Channel path� Control unit � Device
Using Performance Toolkit for VM, we can determine whether a bottleneck exists at any level.
6.2 Channel monitoringThe CHANNEL or LCHANNEL subcommand CHPID utilization. Both average and current values can be displayed (depending on the selected display mode). The percent busy time is computed as follows:
1. The time that a channel path is busy is collected by high-frequency sampling. (The default interval is two seconds.)
2. Monitor tests the channel path status. Status is reported as either busy or not busy.
3. The ratio of the busy counts to total tests is reported for each interval.
Performance Toolkit for VM reports the busy ratio either for the last interval (in CURRENT mode), or as an average from the start of sampling (for AVERAGE mode).
From a 3270 session, the display of the channel, control unit, or device does not provide all available data on a single screen. (Use the PF10 and PF11 function keys to shift left and right to see the rest of the data.) Alternatively, the Web interface presents all data on one display.
126 Linux on IBM Eserver zSeries and S/390: Performance Toolkit for VM
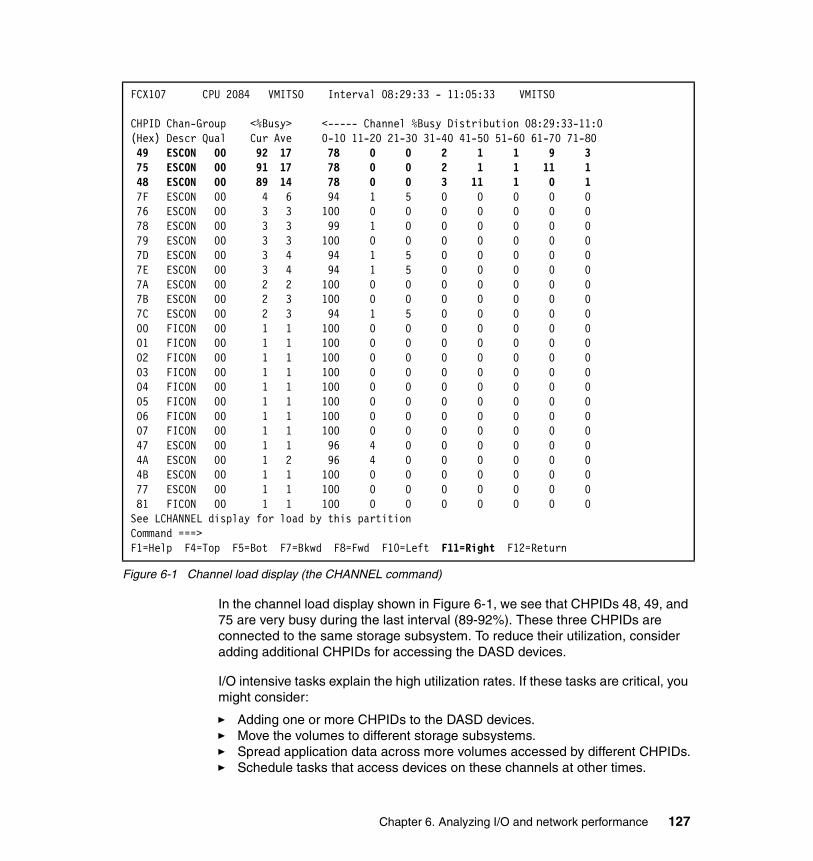
Figure 6-1 Channel load display (the CHANNEL command)
In the channel load display shown in Figure 6-1, we see that CHPIDs 48, 49, and 75 are very busy during the last interval (89-92%). These three CHPIDs are connected to the same storage subsystem. To reduce their utilization, consider adding additional CHPIDs for accessing the DASD devices.
I/O intensive tasks explain the high utilization rates. If these tasks are critical, you might consider:
� Adding one or more CHPIDs to the DASD devices. � Move the volumes to different storage subsystems.� Spread application data across more volumes accessed by different CHPIDs.� Schedule tasks that access devices on these channels at other times.
FCX107 CPU 2084 VMITSO Interval 08:29:33 - 11:05:33 VMITSO CHPID Chan-Group <%Busy> <----- Channel %Busy Distribution 08:29:33-11:0(Hex) Descr Qual Cur Ave 0-10 11-20 21-30 31-40 41-50 51-60 61-70 71-80 49 ESCON 00 92 17 78 0 0 2 1 1 9 3 75 ESCON 00 91 17 78 0 0 2 1 1 11 1 48 ESCON 00 89 14 78 0 0 3 11 1 0 1 7F ESCON 00 4 6 94 1 5 0 0 0 0 0 76 ESCON 00 3 3 100 0 0 0 0 0 0 0 78 ESCON 00 3 3 99 1 0 0 0 0 0 0 79 ESCON 00 3 3 100 0 0 0 0 0 0 0 7D ESCON 00 3 4 94 1 5 0 0 0 0 0 7E ESCON 00 3 4 94 1 5 0 0 0 0 0 7A ESCON 00 2 2 100 0 0 0 0 0 0 0 7B ESCON 00 2 3 100 0 0 0 0 0 0 0 7C ESCON 00 2 3 94 1 5 0 0 0 0 0 00 FICON 00 1 1 100 0 0 0 0 0 0 0 01 FICON 00 1 1 100 0 0 0 0 0 0 0 02 FICON 00 1 1 100 0 0 0 0 0 0 0 03 FICON 00 1 1 100 0 0 0 0 0 0 0 04 FICON 00 1 1 100 0 0 0 0 0 0 0 05 FICON 00 1 1 100 0 0 0 0 0 0 0 06 FICON 00 1 1 100 0 0 0 0 0 0 0 07 FICON 00 1 1 100 0 0 0 0 0 0 0 47 ESCON 00 1 1 96 4 0 0 0 0 0 0 4A ESCON 00 1 2 96 4 0 0 0 0 0 0 4B ESCON 00 1 1 100 0 0 0 0 0 0 0 77 ESCON 00 1 1 100 0 0 0 0 0 0 0 81 FICON 00 1 1 100 0 0 0 0 0 0 0 See LCHANNEL display for load by this partition Command ===> F1=Help F4=Top F5=Bot F7=Bkwd F8=Fwd F10=Left F11=Right F12=Return
Chapter 6. Analyzing I/O and network performance 127
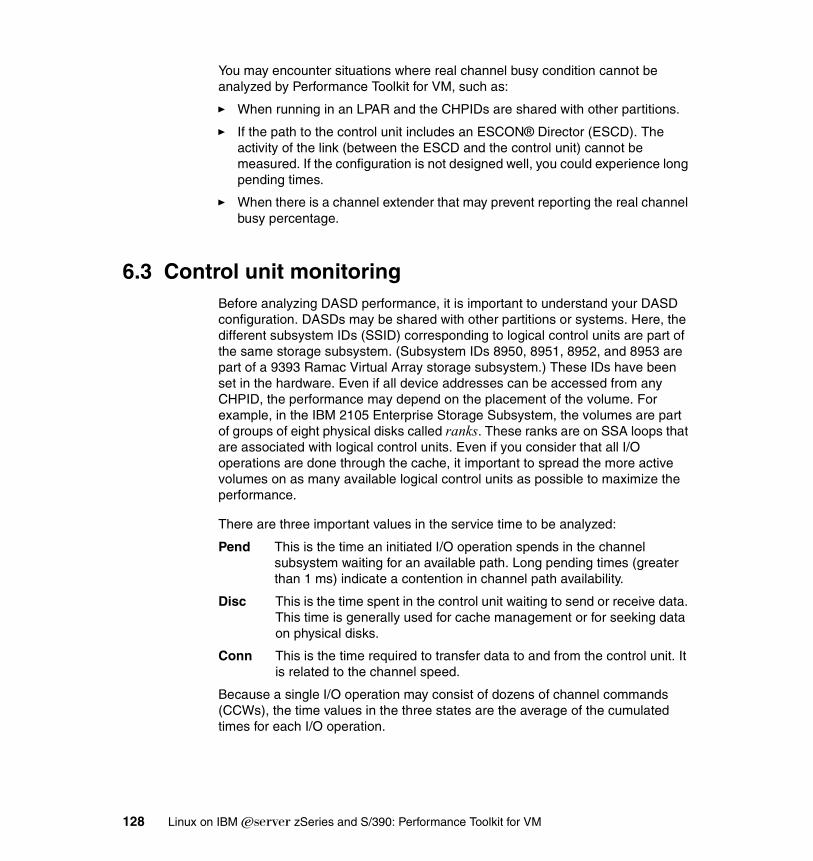
You may encounter situations where real channel busy condition cannot be analyzed by Performance Toolkit for VM, such as:
� When running in an LPAR and the CHPIDs are shared with other partitions.
� If the path to the control unit includes an ESCON® Director (ESCD). The activity of the link (between the ESCD and the control unit) cannot be measured. If the configuration is not designed well, you could experience long pending times.
� When there is a channel extender that may prevent reporting the real channel busy percentage.
6.3 Control unit monitoringBefore analyzing DASD performance, it is important to understand your DASD configuration. DASDs may be shared with other partitions or systems. Here, the different subsystem IDs (SSID) corresponding to logical control units are part of the same storage subsystem. (Subsystem IDs 8950, 8951, 8952, and 8953 are part of a 9393 Ramac Virtual Array storage subsystem.) These IDs have been set in the hardware. Even if all device addresses can be accessed from any CHPID, the performance may depend on the placement of the volume. For example, in the IBM 2105 Enterprise Storage Subsystem, the volumes are part of groups of eight physical disks called ranks. These ranks are on SSA loops that are associated with logical control units. Even if you consider that all I/O operations are done through the cache, it important to spread the more active volumes on as many available logical control units as possible to maximize the performance.
There are three important values in the service time to be analyzed:
Pend This is the time an initiated I/O operation spends in the channel subsystem waiting for an available path. Long pending times (greater than 1 ms) indicate a contention in channel path availability.
Disc This is the time spent in the control unit waiting to send or receive data. This time is generally used for cache management or for seeking data on physical disks.
Conn This is the time required to transfer data to and from the control unit. It is related to the channel speed.
Because a single I/O operation may consist of dozens of channel commands (CCWs), the time values in the three states are the average of the cumulated times for each I/O operation.
128 Linux on IBM Eserver zSeries and S/390: Performance Toolkit for VM
6.3.1 Cache control unit overall performanceControl unit performance data can be obtained by the CTLUNIT subcommand as shown in Figure 6-2.
Figure 6-2 Control unit performance display (the CTLUNIT command)
More data is available using PF11 to view the right side of the screen, as shown in Figure 6-3.
Figure 6-3 Control unit extended cache display
FCX176 CPU 2084 VMITSO Interval 10:59:33 - 11:00:34 VMITSO . . . . . . _____ . . . . . . .Sub- <-----Cache Size------> <----------- DASD Load Data ------------>sys- <Volatile-> <Non-Volat> <--Total--> tem Control <--(MB)---> <--(kB)---> <I/O rates> Pct <----- Time (ms) ------>ID Unit Conf Avail NV-Cf NV-Av Cache SCMBK Busy Pend Disc Conn Serv Resp8950 9393 RV 2048 2048 8192 8192 243.5 240.6 14 .3 .0 3.7 4.0 4.08952 9393 RV 2048 2048 8192 8192 225.6 222.9 14 .3 .5 3.6 4.4 4.48953 9393 RV 2048 2048 8192 8192 220.2 218.2 14 .3 .6 3.6 4.5 4.58911 2105 4096 3273 1049k 1049k 1.2 8.4 0 .2 .0 .1 .3 .38951 9393 RV 2048 2048 8192 8192 .4 .6 0 1.0 .2 2.4 3.6 3.68912 2105 4096 3273 1049k 1049k .3 8.5 0 .2 .0 .1 .3 .38910 2105 4096 3273 1049k 1049k .1 8.5 0 .2 .0 .1 .3 .300F5 9393 RV 2048 1498 8192 8192 .0 .1 0 .1 .0 .3 .4 .48800 9393 RV 2048 2048 8192 8192 .0 .1 0 .2 .0 .4 .6 .6Command ===> F1=Help F4=Top F5=Bot F7=Bkwd F8=Fwd F10=Left F11=Right F12=Return
FCX176 CPU 2084 VMITSO Interval 11:00:33 - 11:01:34 VMITSO . . > . . . . . . . . . . . . .Sub- > ------------> <----------- Cache Utilization Data ------------>sys- > <-Total Rates/s-> <-------- Percentages -------->tem Control >e (ms) ------> Read Read Write </TotWrt> <-----Hits----->ID Unit >Conn Serv Resp N-Seq Seq FW Read %DFW %CFW RdHt Wrt DFW CFW8950 9393 RV 3.7 4.0 4.0 241.0 .0 1.7 99 100 0 100 98 98 ..8952 9393 RV 3.6 4.4 4.4 78.9 .0 171.7 31 100 0 100 100 100 ..8953 9393 RV 3.6 4.5 4.5 60.1 .0 162.9 27 100 0 100 100 100 ..8911 2105 .1 .3 .3 .0 .0 1.2 0 100 0 .. 100 100 ..8951 9393 RV 1.1 1.7 1.7 .0 .0 .0 0 100 0 .. 100 100 ..8912 2105 .1 .3 .3 .0 .0 1.2 0 100 0 .. 100 100 ..8910 2105 .1 .3 .3 .0 .0 .0 .. .. .. .. .. .. ..00F5 9393 RV .3 .4 .4 .0 .0 .0 .. .. .. .. .. .. ..8800 9393 RV .4 .6 .6 .0 .0 .0 .. .. .. .. .. .. ..Command ===> F1=Help F4=Top F5=Bot F7=Bkwd F8=Fwd F10=Left F11=Right F12=Return
Chapter 6. Analyzing I/O and network performance 129
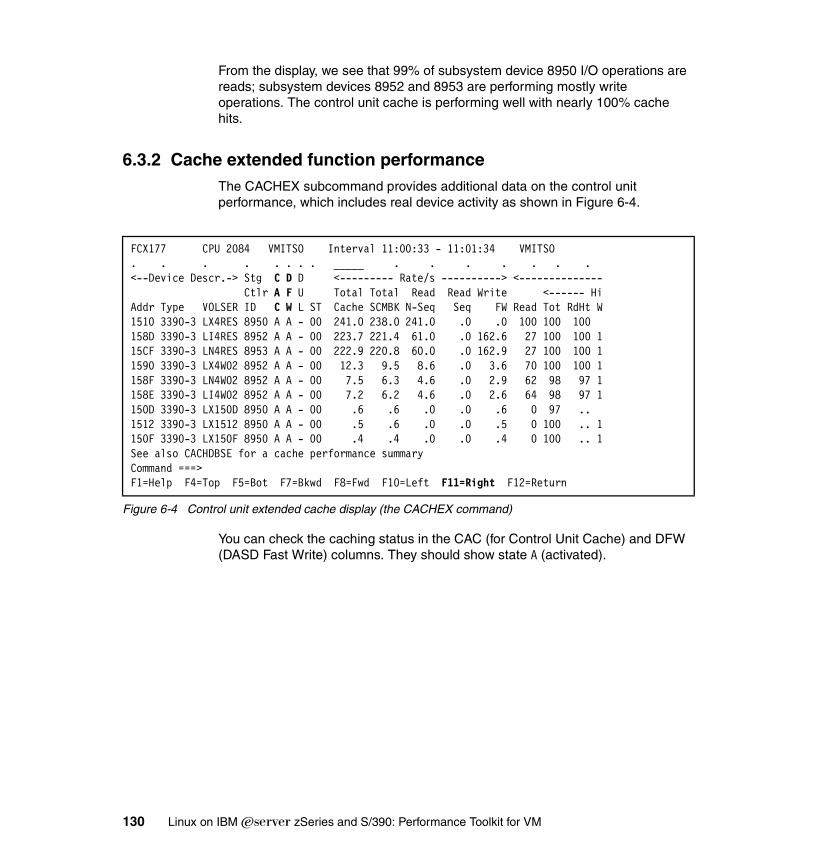
From the display, we see that 99% of subsystem device 8950 I/O operations are reads; subsystem devices 8952 and 8953 are performing mostly write operations. The control unit cache is performing well with nearly 100% cache hits.
6.3.2 Cache extended function performanceThe CACHEX subcommand provides additional data on the control unit performance, which includes real device activity as shown in Figure 6-4.
Figure 6-4 Control unit extended cache display (the CACHEX command)
You can check the caching status in the CAC (for Control Unit Cache) and DFW (DASD Fast Write) columns. They should show state A (activated).
FCX177 CPU 2084 VMITSO Interval 11:00:33 - 11:01:34 VMITSO . . . . . . . . _____ . . . . . . . <--Device Descr.-> Stg C D D <--------- Rate/s ----------> <-------------- Ctlr A F U Total Total Read Read Write <------ HiAddr Type VOLSER ID C W L ST Cache SCMBK N-Seq Seq FW Read Tot RdHt W1510 3390-3 LX4RES 8950 A A - 00 241.0 238.0 241.0 .0 .0 100 100 100 158D 3390-3 LI4RES 8952 A A - 00 223.7 221.4 61.0 .0 162.6 27 100 100 115CF 3390-3 LN4RES 8953 A A - 00 222.9 220.8 60.0 .0 162.9 27 100 100 11590 3390-3 LX4W02 8952 A A - 00 12.3 9.5 8.6 .0 3.6 70 100 100 1158F 3390-3 LN4W02 8952 A A - 00 7.5 6.3 4.6 .0 2.9 62 98 97 1158E 3390-3 LI4W02 8952 A A - 00 7.2 6.2 4.6 .0 2.6 64 98 97 1150D 3390-3 LX150D 8950 A A - 00 .6 .6 .0 .0 .6 0 97 .. 1512 3390-3 LX1512 8950 A A - 00 .5 .6 .0 .0 .5 0 100 .. 1150F 3390-3 LX150F 8950 A A - 00 .4 .4 .0 .0 .4 0 100 .. 1See also CACHDBSE for a cache performance summary Command ===> F1=Help F4=Top F5=Bot F7=Bkwd F8=Fwd F10=Left F11=Right F12=Return
130 Linux on IBM Eserver zSeries and S/390: Performance Toolkit for VM
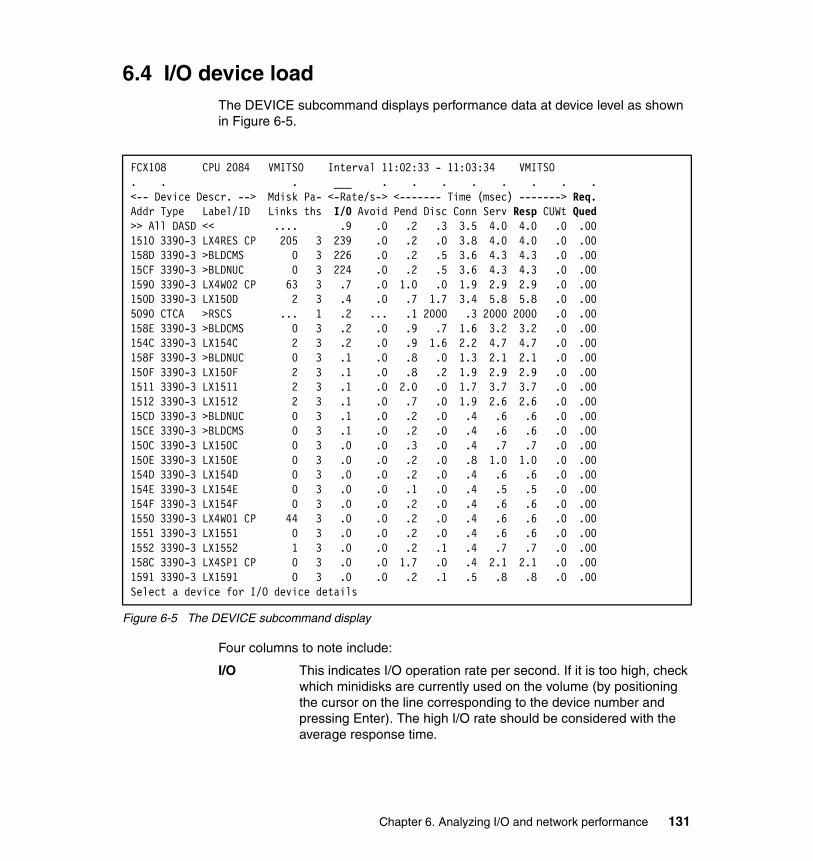
6.4 I/O device loadThe DEVICE subcommand displays performance data at device level as shown in Figure 6-5.
Figure 6-5 The DEVICE subcommand display
Four columns to note include:
I/O This indicates I/O operation rate per second. If it is too high, check which minidisks are currently used on the volume (by positioning the cursor on the line corresponding to the device number and pressing Enter). The high I/O rate should be considered with the average response time.
FCX108 CPU 2084 VMITSO Interval 11:02:33 - 11:03:34 VMITSO . . . ___ . . . . . . . . <-- Device Descr. --> Mdisk Pa- <-Rate/s-> <------- Time (msec) -------> Req. Addr Type Label/ID Links ths I/O Avoid Pend Disc Conn Serv Resp CUWt Qued >> All DASD << .... .9 .0 .2 .3 3.5 4.0 4.0 .0 .00 1510 3390-3 LX4RES CP 205 3 239 .0 .2 .0 3.8 4.0 4.0 .0 .00 158D 3390-3 >BLDCMS 0 3 226 .0 .2 .5 3.6 4.3 4.3 .0 .00 15CF 3390-3 >BLDNUC 0 3 224 .0 .2 .5 3.6 4.3 4.3 .0 .00 1590 3390-3 LX4W02 CP 63 3 .7 .0 1.0 .0 1.9 2.9 2.9 .0 .00 150D 3390-3 LX150D 2 3 .4 .0 .7 1.7 3.4 5.8 5.8 .0 .00 5090 CTCA >RSCS ... 1 .2 ... .1 2000 .3 2000 2000 .0 .00 158E 3390-3 >BLDCMS 0 3 .2 .0 .9 .7 1.6 3.2 3.2 .0 .00 154C 3390-3 LX154C 2 3 .2 .0 .9 1.6 2.2 4.7 4.7 .0 .00 158F 3390-3 >BLDNUC 0 3 .1 .0 .8 .0 1.3 2.1 2.1 .0 .00 150F 3390-3 LX150F 2 3 .1 .0 .8 .2 1.9 2.9 2.9 .0 .00 1511 3390-3 LX1511 2 3 .1 .0 2.0 .0 1.7 3.7 3.7 .0 .00 1512 3390-3 LX1512 2 3 .1 .0 .7 .0 1.9 2.6 2.6 .0 .00 15CD 3390-3 >BLDNUC 0 3 .1 .0 .2 .0 .4 .6 .6 .0 .00 15CE 3390-3 >BLDCMS 0 3 .1 .0 .2 .0 .4 .6 .6 .0 .00 150C 3390-3 LX150C 0 3 .0 .0 .3 .0 .4 .7 .7 .0 .00 150E 3390-3 LX150E 0 3 .0 .0 .2 .0 .8 1.0 1.0 .0 .00 154D 3390-3 LX154D 0 3 .0 .0 .2 .0 .4 .6 .6 .0 .00 154E 3390-3 LX154E 0 3 .0 .0 .1 .0 .4 .5 .5 .0 .00 154F 3390-3 LX154F 0 3 .0 .0 .2 .0 .4 .6 .6 .0 .00 1550 3390-3 LX4W01 CP 44 3 .0 .0 .2 .0 .4 .6 .6 .0 .00 1551 3390-3 LX1551 0 3 .0 .0 .2 .0 .4 .6 .6 .0 .00 1552 3390-3 LX1552 1 3 .0 .0 .2 .1 .4 .7 .7 .0 .00 158C 3390-3 LX4SP1 CP 0 3 .0 .0 1.7 .0 .4 2.1 2.1 .0 .00 1591 3390-3 LX1591 0 3 .0 .0 .2 .1 .5 .8 .8 .0 .00 Select a device for I/O device details
Chapter 6. Analyzing I/O and network performance 131
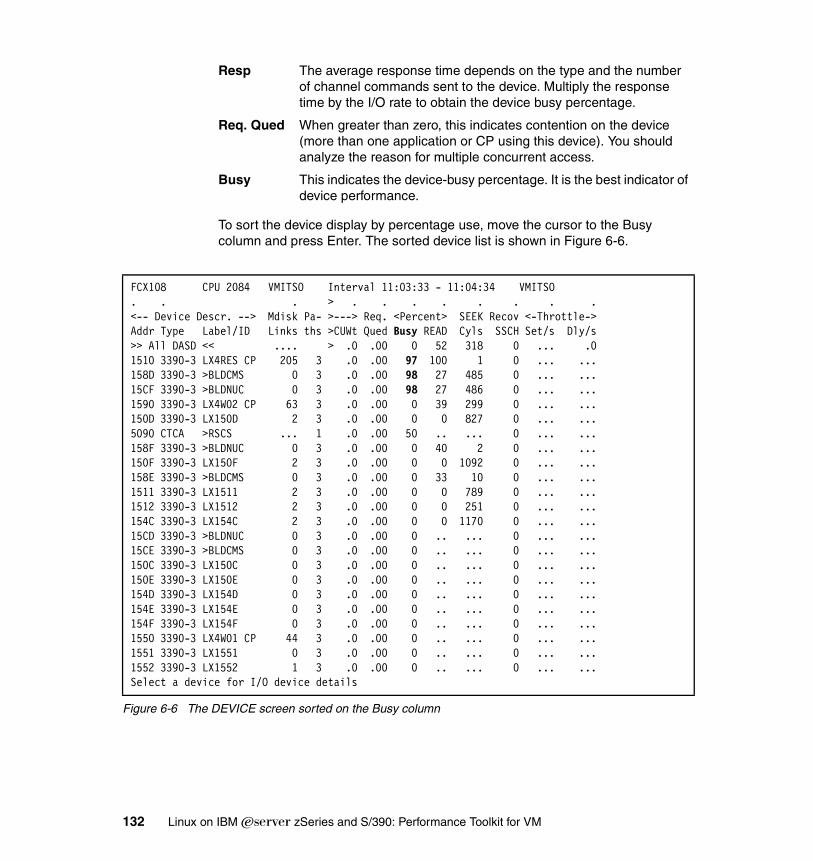
Resp The average response time depends on the type and the number of channel commands sent to the device. Multiply the response time by the I/O rate to obtain the device busy percentage.
Req. Qued When greater than zero, this indicates contention on the device (more than one application or CP using this device). You should analyze the reason for multiple concurrent access.
Busy This indicates the device-busy percentage. It is the best indicator of device performance.
To sort the device display by percentage use, move the cursor to the Busy column and press Enter. The sorted device list is shown in Figure 6-6.
Figure 6-6 The DEVICE screen sorted on the Busy column
FCX108 CPU 2084 VMITSO Interval 11:03:33 - 11:04:34 VMITSO . . . > . . . . . . . .<-- Device Descr. --> Mdisk Pa- >---> Req. <Percent> SEEK Recov <-Throttle->Addr Type Label/ID Links ths >CUWt Qued Busy READ Cyls SSCH Set/s Dly/s>> All DASD << .... > .0 .00 0 52 318 0 ... .01510 3390-3 LX4RES CP 205 3 .0 .00 97 100 1 0 ... ...158D 3390-3 >BLDCMS 0 3 .0 .00 98 27 485 0 ... ...15CF 3390-3 >BLDNUC 0 3 .0 .00 98 27 486 0 ... ...1590 3390-3 LX4W02 CP 63 3 .0 .00 0 39 299 0 ... ...150D 3390-3 LX150D 2 3 .0 .00 0 0 827 0 ... ...5090 CTCA >RSCS ... 1 .0 .00 50 .. ... 0 ... ...158F 3390-3 >BLDNUC 0 3 .0 .00 0 40 2 0 ... ...150F 3390-3 LX150F 2 3 .0 .00 0 0 1092 0 ... ...158E 3390-3 >BLDCMS 0 3 .0 .00 0 33 10 0 ... ...1511 3390-3 LX1511 2 3 .0 .00 0 0 789 0 ... ...1512 3390-3 LX1512 2 3 .0 .00 0 0 251 0 ... ...154C 3390-3 LX154C 2 3 .0 .00 0 0 1170 0 ... ...15CD 3390-3 >BLDNUC 0 3 .0 .00 0 .. ... 0 ... ...15CE 3390-3 >BLDCMS 0 3 .0 .00 0 .. ... 0 ... ...150C 3390-3 LX150C 0 3 .0 .00 0 .. ... 0 ... ...150E 3390-3 LX150E 0 3 .0 .00 0 .. ... 0 ... ...154D 3390-3 LX154D 0 3 .0 .00 0 .. ... 0 ... ...154E 3390-3 LX154E 0 3 .0 .00 0 .. ... 0 ... ...154F 3390-3 LX154F 0 3 .0 .00 0 .. ... 0 ... ...1550 3390-3 LX4W01 CP 44 3 .0 .00 0 .. ... 0 ... ...1551 3390-3 LX1551 0 3 .0 .00 0 .. ... 0 ... ...1552 3390-3 LX1552 1 3 .0 .00 0 .. ... 0 ... ...Select a device for I/O device details
132 Linux on IBM Eserver zSeries and S/390: Performance Toolkit for VM
In this example, three devices are reported as busy:
� Address 1510 is a CP-owned volume containing many minidisks and system areas. To reduce utilization, we can move heavily accessed minidisks to another device.
� Addresses 158D and 15CF are dedicated to guests. In this case, we must analyze how the guest accesses the device in order to reduce utilization.
For detailed device information, use the DEVICE 1510 subcommand. The screen is shown in Figure 6-7 on page 134.
Chapter 6. Analyzing I/O and network performance 133
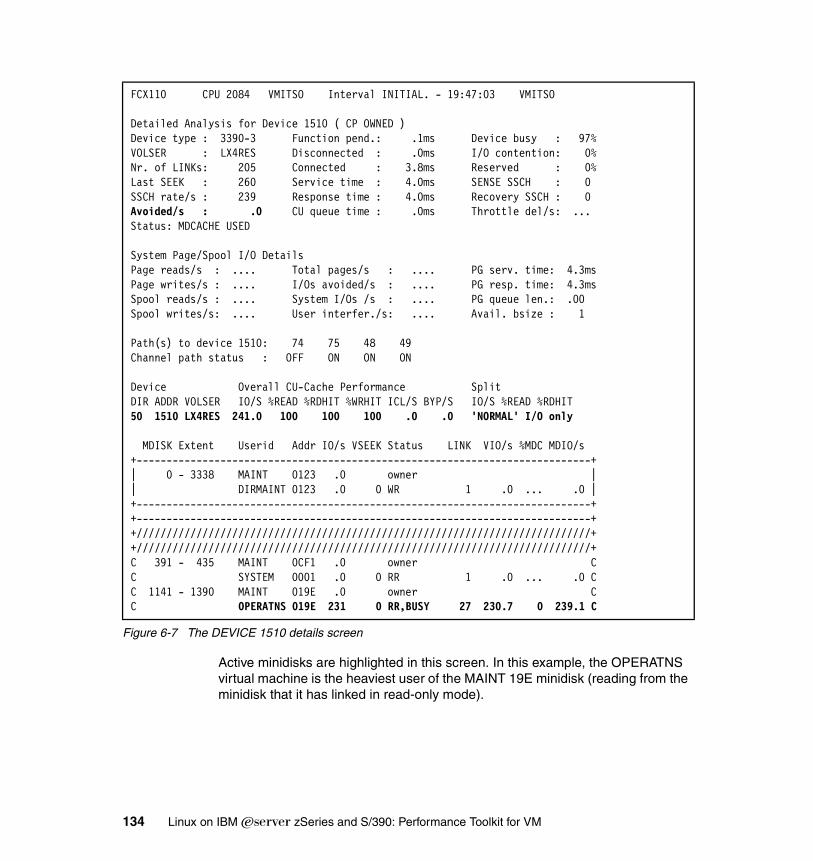
Figure 6-7 The DEVICE 1510 details screen
Active minidisks are highlighted in this screen. In this example, the OPERATNS virtual machine is the heaviest user of the MAINT 19E minidisk (reading from the minidisk that it has linked in read-only mode).
FCX110 CPU 2084 VMITSO Interval INITIAL. - 19:47:03 VMITSO Detailed Analysis for Device 1510 ( CP OWNED ) Device type : 3390-3 Function pend.: .1ms Device busy : 97% VOLSER : LX4RES Disconnected : .0ms I/O contention: 0% Nr. of LINKs: 205 Connected : 3.8ms Reserved : 0% Last SEEK : 260 Service time : 4.0ms SENSE SSCH : 0 SSCH rate/s : 239 Response time : 4.0ms Recovery SSCH : 0 Avoided/s : .0 CU queue time : .0ms Throttle del/s: ... Status: MDCACHE USED System Page/Spool I/O Details Page reads/s : .... Total pages/s : .... PG serv. time: 4.3ms Page writes/s : .... I/Os avoided/s : .... PG resp. time: 4.3ms Spool reads/s : .... System I/Os /s : .... PG queue len.: .00 Spool writes/s: .... User interfer./s: .... Avail. bsize : 1 Path(s) to device 1510: 74 75 48 49 Channel path status : OFF ON ON ON Device Overall CU-Cache Performance Split DIR ADDR VOLSER IO/S %READ %RDHIT %WRHIT ICL/S BYP/S IO/S %READ %RDHIT 50 1510 LX4RES 241.0 100 100 100 .0 .0 'NORMAL' I/O only MDISK Extent Userid Addr IO/s VSEEK Status LINK VIO/s %MDC MDIO/s +----------------------------------------------------------------------------+ | 0 - 3338 MAINT 0123 .0 owner | | DIRMAINT 0123 .0 0 WR 1 .0 ... .0 | +----------------------------------------------------------------------------+ +----------------------------------------------------------------------------+ +////////////////////////////////////////////////////////////////////////////+ +////////////////////////////////////////////////////////////////////////////+ C 391 - 435 MAINT 0CF1 .0 owner C C SYSTEM 0001 .0 0 RR 1 .0 ... .0 C C 1141 - 1390 MAINT 019E .0 owner C C OPERATNS 019E 231 0 RR,BUSY 27 230.7 0 239.1 C
134 Linux on IBM Eserver zSeries and S/390: Performance Toolkit for VM
6.4.1 Minidisk cacheMinidisk cache (MDC), a feature of z/VM, can provide a significant I/O performance improvement. MDC uses real or expanded memory to cache data for virtual I/O operations (and thus avoid real I/O to DASD). MDC trades increased use of real and expanded memory for decreased DASD I/O.
MDC can be set on or off at the minidisk, volume, or system level using the CP SET MDCACHE command. MDC can be set to use 4 K record caching or normal full track caching. Full track caching is the default when MDC is set on without a parameter.
In the previous example, all I/O operations are all reads. In this case, no I/O operations have been fulfilled from the MDC (as indicated by the zero value in the Avoided/s field). In Figure 6-8 on page 136, we enable MDC and re-run the test.
Important: We recommend using record MDC caching.
Chapter 6. Analyzing I/O and network performance 135
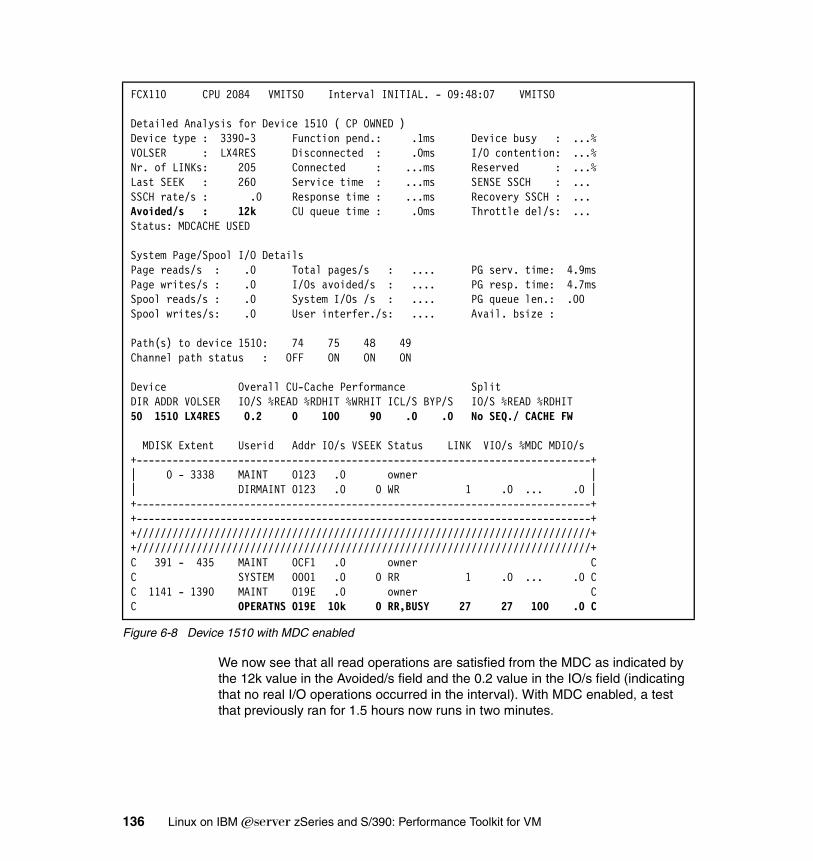
Figure 6-8 Device 1510 with MDC enabled
We now see that all read operations are satisfied from the MDC as indicated by the 12k value in the Avoided/s field and the 0.2 value in the IO/s field (indicating that no real I/O operations occurred in the interval). With MDC enabled, a test that previously ran for 1.5 hours now runs in two minutes.
FCX110 CPU 2084 VMITSO Interval INITIAL. - 09:48:07 VMITSO Detailed Analysis for Device 1510 ( CP OWNED ) Device type : 3390-3 Function pend.: .1ms Device busy : ...% VOLSER : LX4RES Disconnected : .0ms I/O contention: ...% Nr. of LINKs: 205 Connected : ...ms Reserved : ...% Last SEEK : 260 Service time : ...ms SENSE SSCH : ... SSCH rate/s : .0 Response time : ...ms Recovery SSCH : ... Avoided/s : 12k CU queue time : .0ms Throttle del/s: ... Status: MDCACHE USED System Page/Spool I/O Details Page reads/s : .0 Total pages/s : .... PG serv. time: 4.9ms Page writes/s : .0 I/Os avoided/s : .... PG resp. time: 4.7ms Spool reads/s : .0 System I/Os /s : .... PG queue len.: .00 Spool writes/s: .0 User interfer./s: .... Avail. bsize : Path(s) to device 1510: 74 75 48 49 Channel path status : OFF ON ON ON Device Overall CU-Cache Performance Split DIR ADDR VOLSER IO/S %READ %RDHIT %WRHIT ICL/S BYP/S IO/S %READ %RDHIT 50 1510 LX4RES 0.2 0 100 90 .0 .0 No SEQ./ CACHE FW MDISK Extent Userid Addr IO/s VSEEK Status LINK VIO/s %MDC MDIO/s +----------------------------------------------------------------------------+ | 0 - 3338 MAINT 0123 .0 owner | | DIRMAINT 0123 .0 0 WR 1 .0 ... .0 | +----------------------------------------------------------------------------+ +----------------------------------------------------------------------------+ +////////////////////////////////////////////////////////////////////////////+ +////////////////////////////////////////////////////////////////////////////+ C 391 - 435 MAINT 0CF1 .0 owner C C SYSTEM 0001 .0 0 RR 1 .0 ... .0 C C 1141 - 1390 MAINT 019E .0 owner C C OPERATNS 019E 10k 0 RR,BUSY 27 27 100 .0 C
136 Linux on IBM Eserver zSeries and S/390: Performance Toolkit for VM
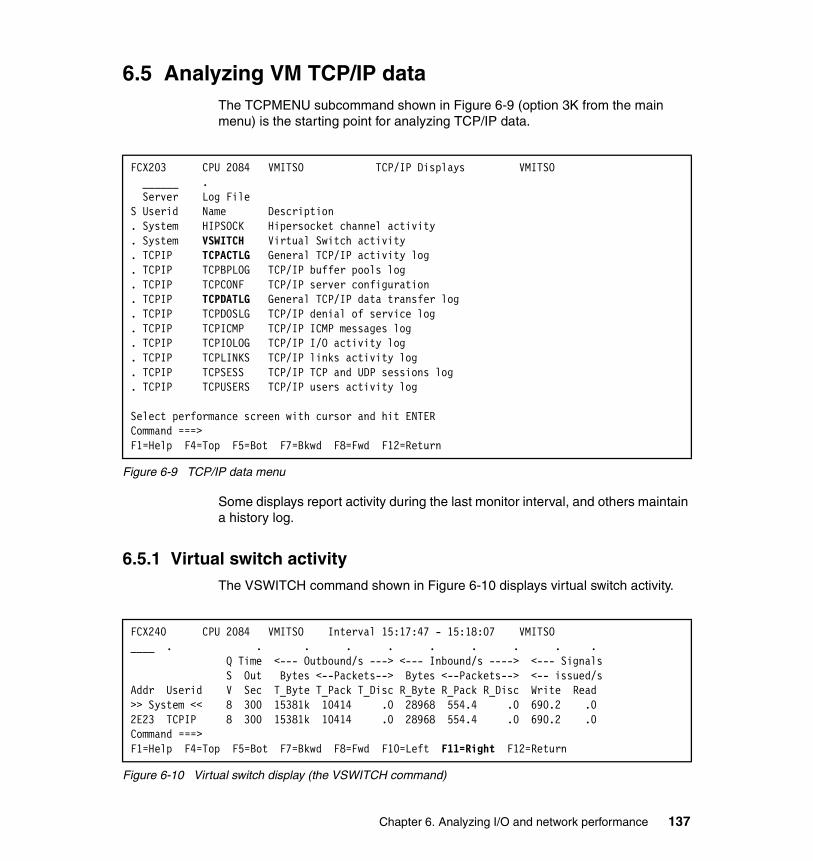
6.5 Analyzing VM TCP/IP dataThe TCPMENU subcommand shown in Figure 6-9 (option 3K from the main menu) is the starting point for analyzing TCP/IP data.
Figure 6-9 TCP/IP data menu
Some displays report activity during the last monitor interval, and others maintain a history log.
6.5.1 Virtual switch activity The VSWITCH command shown in Figure 6-10 displays virtual switch activity.
Figure 6-10 Virtual switch display (the VSWITCH command)
FCX203 CPU 2084 VMITSO TCP/IP Displays VMITSO ______ . Server Log File S Userid Name Description . System HIPSOCK Hipersocket channel activity . System VSWITCH Virtual Switch activity . TCPIP TCPACTLG General TCP/IP activity log . TCPIP TCPBPLOG TCP/IP buffer pools log . TCPIP TCPCONF TCP/IP server configuration . TCPIP TCPDATLG General TCP/IP data transfer log . TCPIP TCPDOSLG TCP/IP denial of service log . TCPIP TCPICMP TCP/IP ICMP messages log . TCPIP TCPIOLOG TCP/IP I/O activity log . TCPIP TCPLINKS TCP/IP links activity log . TCPIP TCPSESS TCP/IP TCP and UDP sessions log . TCPIP TCPUSERS TCP/IP users activity log Select performance screen with cursor and hit ENTER Command ===> F1=Help F4=Top F5=Bot F7=Bkwd F8=Fwd F12=Return
FCX240 CPU 2084 VMITSO Interval 15:17:47 - 15:18:07 VMITSO ____ . . . . . . . . . . Q Time <--- Outbound/s ---> <--- Inbound/s ----> <--- Signals S Out Bytes <--Packets--> Bytes <--Packets--> <-- issued/sAddr Userid V Sec T_Byte T_Pack T_Disc R_Byte R_Pack R_Disc Write Read >> System << 8 300 15381k 10414 .0 28968 554.4 .0 690.2 .0 2E23 TCPIP 8 300 15381k 10414 .0 28968 554.4 .0 690.2 .0 Command ===> F1=Help F4=Top F5=Bot F7=Bkwd F8=Fwd F10=Left F11=Right F12=Return
Chapter 6. Analyzing I/O and network performance 137
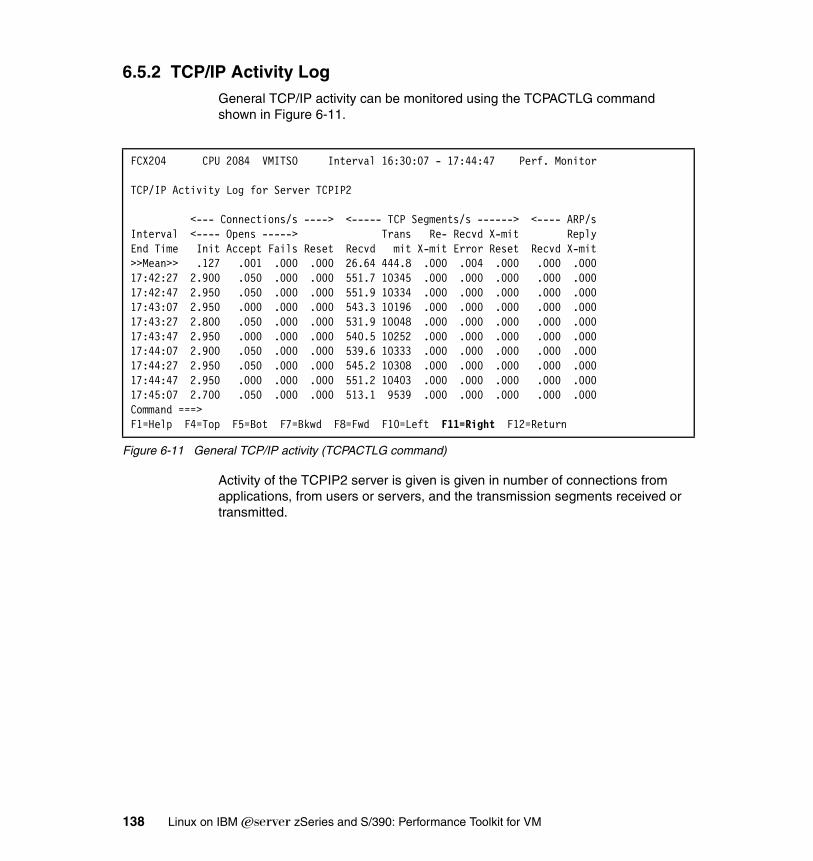
6.5.2 TCP/IP Activity Log General TCP/IP activity can be monitored using the TCPACTLG command shown in Figure 6-11.
Figure 6-11 General TCP/IP activity (TCPACTLG command)
Activity of the TCPIP2 server is given is given in number of connections from applications, from users or servers, and the transmission segments received or transmitted.
FCX204 CPU 2084 VMITSO Interval 16:30:07 - 17:44:47 Perf. Monitor TCP/IP Activity Log for Server TCPIP2 <--- Connections/s ----> <----- TCP Segments/s ------> <---- ARP/sInterval <---- Opens -----> Trans Re- Recvd X-mit ReplyEnd Time Init Accept Fails Reset Recvd mit X-mit Error Reset Recvd X-mit>>Mean>> .127 .001 .000 .000 26.64 444.8 .000 .004 .000 .000 .00017:42:27 2.900 .050 .000 .000 551.7 10345 .000 .000 .000 .000 .000 17:42:47 2.950 .050 .000 .000 551.9 10334 .000 .000 .000 .000 .000 17:43:07 2.950 .000 .000 .000 543.3 10196 .000 .000 .000 .000 .000 17:43:27 2.800 .050 .000 .000 531.9 10048 .000 .000 .000 .000 .000 17:43:47 2.950 .000 .000 .000 540.5 10252 .000 .000 .000 .000 .000 17:44:07 2.900 .050 .000 .000 539.6 10333 .000 .000 .000 .000 .000 17:44:27 2.950 .050 .000 .000 545.2 10308 .000 .000 .000 .000 .000 17:44:47 2.950 .000 .000 .000 551.2 10403 .000 .000 .000 .000 .000 17:45:07 2.700 .050 .000 .000 513.1 9539 .000 .000 .000 .000 .000 Command ===> F1=Help F4=Top F5=Bot F7=Bkwd F8=Fwd F10=Left F11=Right F12=Return
138 Linux on IBM Eserver zSeries and S/390: Performance Toolkit for VM
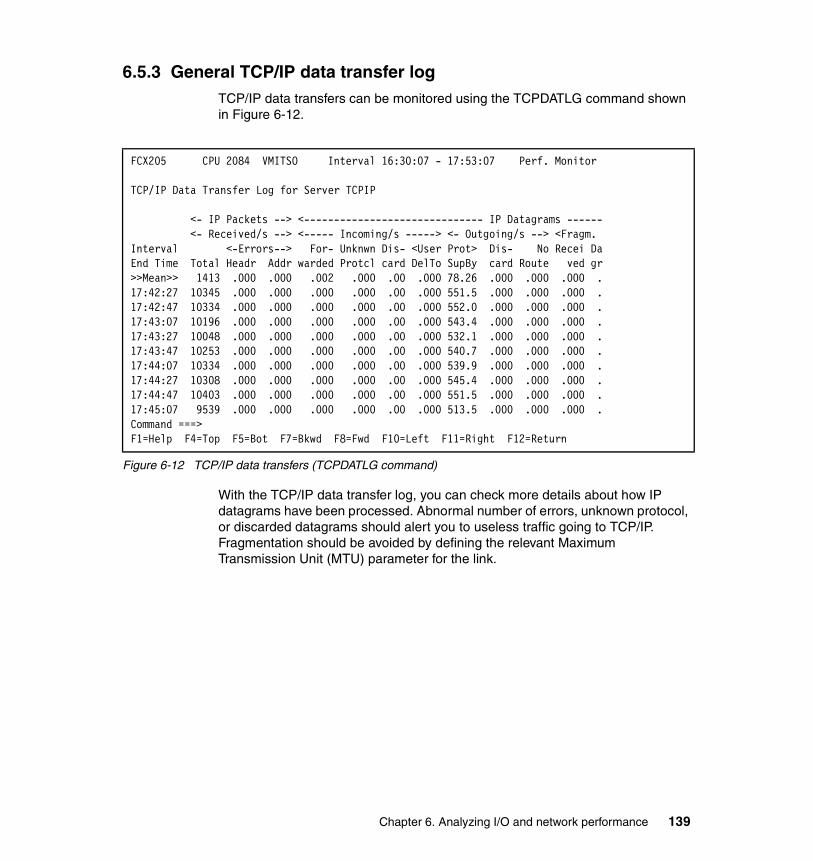
6.5.3 General TCP/IP data transfer log TCP/IP data transfers can be monitored using the TCPDATLG command shown in Figure 6-12.
Figure 6-12 TCP/IP data transfers (TCPDATLG command)
With the TCP/IP data transfer log, you can check more details about how IP datagrams have been processed. Abnormal number of errors, unknown protocol, or discarded datagrams should alert you to useless traffic going to TCP/IP. Fragmentation should be avoided by defining the relevant Maximum Transmission Unit (MTU) parameter for the link.
FCX205 CPU 2084 VMITSO Interval 16:30:07 - 17:53:07 Perf. Monitor TCP/IP Data Transfer Log for Server TCPIP <- IP Packets --> <------------------------------ IP Datagrams ------ <- Received/s --> <----- Incoming/s -----> <- Outgoing/s --> <Fragm. Interval <-Errors--> For- Unknwn Dis- <User Prot> Dis- No Recei DaEnd Time Total Headr Addr warded Protcl card DelTo SupBy card Route ved gr>>Mean>> 1413 .000 .000 .002 .000 .00 .000 78.26 .000 .000 .000 .17:42:27 10345 .000 .000 .000 .000 .00 .000 551.5 .000 .000 .000 .17:42:47 10334 .000 .000 .000 .000 .00 .000 552.0 .000 .000 .000 .17:43:07 10196 .000 .000 .000 .000 .00 .000 543.4 .000 .000 .000 .17:43:27 10048 .000 .000 .000 .000 .00 .000 532.1 .000 .000 .000 .17:43:47 10253 .000 .000 .000 .000 .00 .000 540.7 .000 .000 .000 .17:44:07 10334 .000 .000 .000 .000 .00 .000 539.9 .000 .000 .000 .17:44:27 10308 .000 .000 .000 .000 .00 .000 545.4 .000 .000 .000 .17:44:47 10403 .000 .000 .000 .000 .00 .000 551.5 .000 .000 .000 .17:45:07 9539 .000 .000 .000 .000 .00 .000 513.5 .000 .000 .000 .Command ===> F1=Help F4=Top F5=Bot F7=Bkwd F8=Fwd F10=Left F11=Right F12=Return
Chapter 6. Analyzing I/O and network performance 139

140 Linux on IBM Eserver zSeries and S/390: Performance Toolkit for VM
Chapter 7. Understanding LPAR configuration
In this chapter, we discuss using Performance Toolkit for VM to view the VM LPAR configuration and to obtain LPAR performance data. We discuss:
� LPAR options
� Shared and dedicated processors
� Shared and dedicated channels
� Processor weights
7
© Copyright IBM Corp. 2004. All rights reserved. 141
7.1 Collecting LPAR dataIf your z/VM system runs in a logical partition (LPAR), Performance Toolkit for VM can provide LPAR performance data. Performance data for other defined LPARs is available only if the Global Performance Data Control option has been selected for the image profile on the Hardware Management Console. (This option is enabled by default.)
7.2 Displaying LPAR configuration and activityLPAR configuration and load is obtained using the LPAR or LPARLOG subcommand. Figure 7-1 on page 143 shows the LPAR load screen.
142 Linux on IBM Eserver zSeries and S/390: Performance Toolkit for VM
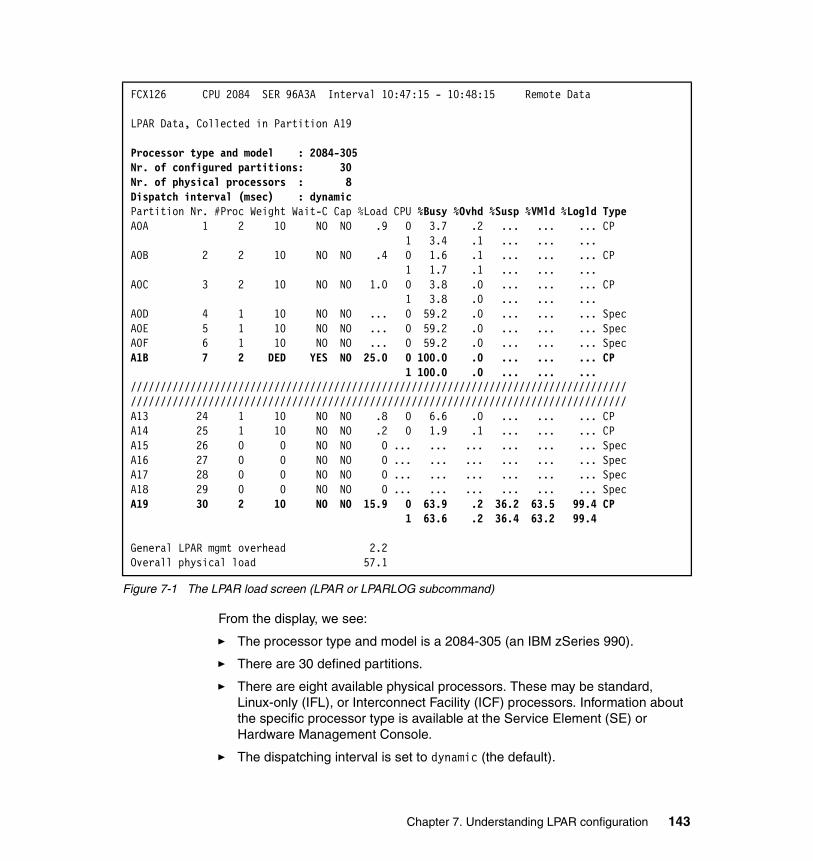
Figure 7-1 The LPAR load screen (LPAR or LPARLOG subcommand)
From the display, we see:
� The processor type and model is a 2084-305 (an IBM zSeries 990).
� There are 30 defined partitions.
� There are eight available physical processors. These may be standard, Linux-only (IFL), or Interconnect Facility (ICF) processors. Information about the specific processor type is available at the Service Element (SE) or Hardware Management Console.
� The dispatching interval is set to dynamic (the default).
FCX126 CPU 2084 SER 96A3A Interval 10:47:15 - 10:48:15 Remote Data LPAR Data, Collected in Partition A19 Processor type and model : 2084-305 Nr. of configured partitions: 30 Nr. of physical processors : 8 Dispatch interval (msec) : dynamic Partition Nr. #Proc Weight Wait-C Cap %Load CPU %Busy %Ovhd %Susp %VMld %Logld TypeA0A 1 2 10 NO NO .9 0 3.7 .2 ... ... ... CP 1 3.4 .1 ... ... ... A0B 2 2 10 NO NO .4 0 1.6 .1 ... ... ... CP 1 1.7 .1 ... ... ... A0C 3 2 10 NO NO 1.0 0 3.8 .0 ... ... ... CP 1 3.8 .0 ... ... ... A0D 4 1 10 NO NO ... 0 59.2 .0 ... ... ... SpecA0E 5 1 10 NO NO ... 0 59.2 .0 ... ... ... SpecA0F 6 1 10 NO NO ... 0 59.2 .0 ... ... ... SpecA1B 7 2 DED YES NO 25.0 0 100.0 .0 ... ... ... CP 1 100.0 .0 ... ... ... //////////////////////////////////////////////////////////////////////////////////////////////////////////////////////////////////////////////////////////////////////A13 24 1 10 NO NO .8 0 6.6 .0 ... ... ... CP A14 25 1 10 NO NO .2 0 1.9 .1 ... ... ... CP A15 26 0 0 NO NO 0 ... ... ... ... ... ... SpecA16 27 0 0 NO NO 0 ... ... ... ... ... ... SpecA17 28 0 0 NO NO 0 ... ... ... ... ... ... SpecA18 29 0 0 NO NO 0 ... ... ... ... ... ... SpecA19 30 2 10 NO NO 15.9 0 63.9 .2 36.2 63.5 99.4 CP 1 63.6 .2 36.4 63.2 99.4 General LPAR mgmt overhead 2.2 Overall physical load 57.1
Chapter 7. Understanding LPAR configuration 143
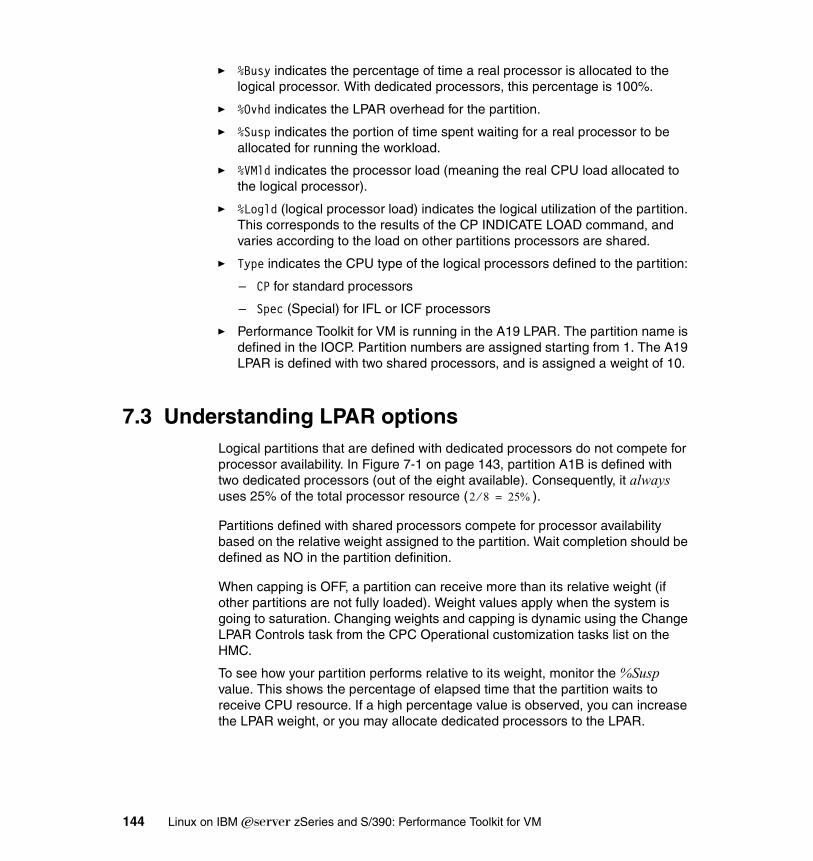
� %Busy indicates the percentage of time a real processor is allocated to the logical processor. With dedicated processors, this percentage is 100%.
� %Ovhd indicates the LPAR overhead for the partition.
� %Susp indicates the portion of time spent waiting for a real processor to be allocated for running the workload.
� %VMld indicates the processor load (meaning the real CPU load allocated to the logical processor).
� %Logld (logical processor load) indicates the logical utilization of the partition. This corresponds to the results of the CP INDICATE LOAD command, and varies according to the load on other partitions processors are shared.
� Type indicates the CPU type of the logical processors defined to the partition:
– CP for standard processors
– Spec (Special) for IFL or ICF processors
� Performance Toolkit for VM is running in the A19 LPAR. The partition name is defined in the IOCP. Partition numbers are assigned starting from 1. The A19 LPAR is defined with two shared processors, and is assigned a weight of 10.
7.3 Understanding LPAR optionsLogical partitions that are defined with dedicated processors do not compete for processor availability. In Figure 7-1 on page 143, partition A1B is defined with two dedicated processors (out of the eight available). Consequently, it always uses 25% of the total processor resource ( ).
Partitions defined with shared processors compete for processor availability based on the relative weight assigned to the partition. Wait completion should be defined as NO in the partition definition.
When capping is OFF, a partition can receive more than its relative weight (if other partitions are not fully loaded). Weight values apply when the system is going to saturation. Changing weights and capping is dynamic using the Change LPAR Controls task from the CPC Operational customization tasks list on the HMC.
To see how your partition performs relative to its weight, monitor the %Susp value. This shows the percentage of elapsed time that the partition waits to receive CPU resource. If a high percentage value is observed, you can increase the LPAR weight, or you may allocate dedicated processors to the LPAR.
2 8⁄ 25%=
144 Linux on IBM Eserver zSeries and S/390: Performance Toolkit for VM
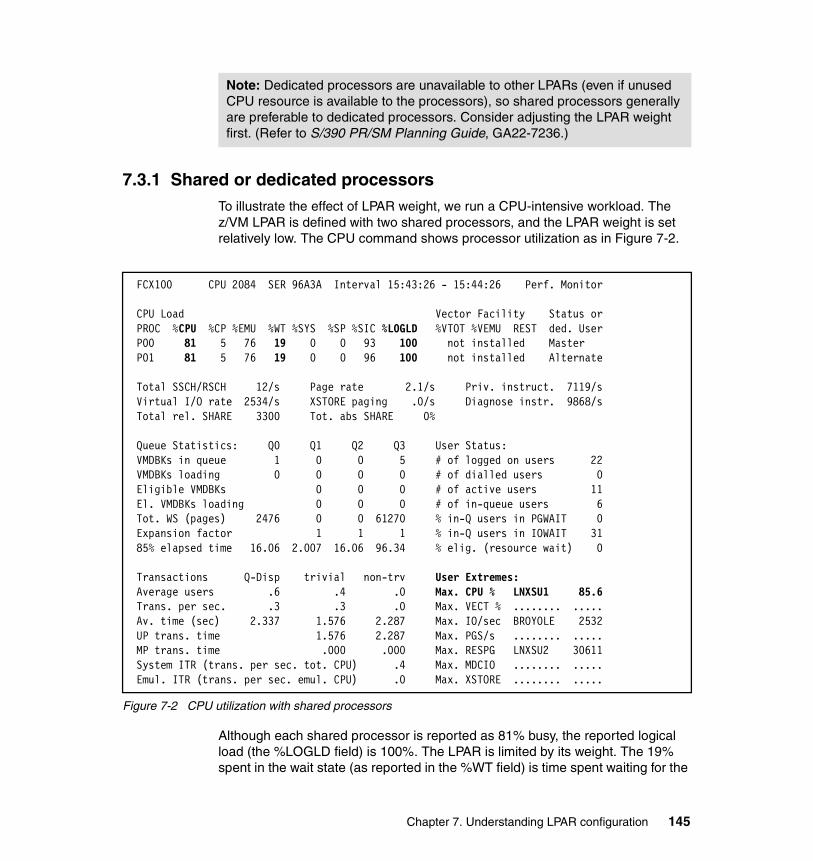
7.3.1 Shared or dedicated processorsTo illustrate the effect of LPAR weight, we run a CPU-intensive workload. The z/VM LPAR is defined with two shared processors, and the LPAR weight is set relatively low. The CPU command shows processor utilization as in Figure 7-2.
Figure 7-2 CPU utilization with shared processors
Although each shared processor is reported as 81% busy, the reported logical load (the %LOGLD field) is 100%. The LPAR is limited by its weight. The 19% spent in the wait state (as reported in the %WT field) is time spent waiting for the
Note: Dedicated processors are unavailable to other LPARs (even if unused CPU resource is available to the processors), so shared processors generally are preferable to dedicated processors. Consider adjusting the LPAR weight first. (Refer to S/390 PR/SM Planning Guide, GA22-7236.)
FCX100 CPU 2084 SER 96A3A Interval 15:43:26 - 15:44:26 Perf. Monitor CPU Load Vector Facility Status or PROC %CPU %CP %EMU %WT %SYS %SP %SIC %LOGLD %VTOT %VEMU REST ded. User P00 81 5 76 19 0 0 93 100 not installed Master P01 81 5 76 19 0 0 96 100 not installed Alternate Total SSCH/RSCH 12/s Page rate 2.1/s Priv. instruct. 7119/s Virtual I/O rate 2534/s XSTORE paging .0/s Diagnose instr. 9868/s Total rel. SHARE 3300 Tot. abs SHARE 0% Queue Statistics: Q0 Q1 Q2 Q3 User Status: VMDBKs in queue 1 0 0 5 # of logged on users 22 VMDBKs loading 0 0 0 0 # of dialled users 0 Eligible VMDBKs 0 0 0 # of active users 11 El. VMDBKs loading 0 0 0 # of in-queue users 6 Tot. WS (pages) 2476 0 0 61270 % in-Q users in PGWAIT 0 Expansion factor 1 1 1 % in-Q users in IOWAIT 31 85% elapsed time 16.06 2.007 16.06 96.34 % elig. (resource wait) 0 Transactions Q-Disp trivial non-trv User Extremes: Average users .6 .4 .0 Max. CPU % LNXSU1 85.6 Trans. per sec. .3 .3 .0 Max. VECT % ........ ..... Av. time (sec) 2.337 1.576 2.287 Max. IO/sec BROYOLE 2532 UP trans. time 1.576 2.287 Max. PGS/s ........ ..... MP trans. time .000 .000 Max. RESPG LNXSU2 30611 System ITR (trans. per sec. tot. CPU) .4 Max. MDCIO ........ ..... Emul. ITR (trans. per sec. emul. CPU) .0 Max. XSTORE ........ .....
Chapter 7. Understanding LPAR configuration 145
LPAR to get serviced. The reported User Extremes values are useful in identifying major resource consumers. (In this case, user LNXSU1 is executing the benchmark).
7.3.2 Shared or dedicated CHPIDsLPAR devices can be defined as shared CHPIDs in the IOCDS. The LCHANNEL subcommand displays channel activity relative to the partition. Figure 7-3 shows the LPAR channel screen.
Figure 7-3 The LPAR channel screen (LCHANNEL subcommand)
The shrd column reports the sharing status of the CHPID: Yes or No. To determine real channel activity, you should refer to the Activity monitoring function on the HMC.
FCX161 CPU 2084 SER 96A3A Interval 08:29:59 - 10:15:59 Remote Data CHPID Chan-Group <%Busy> <----- Channel %Busy Distribution 08:29:59-10:1(Hex) Descr Qual Shrd Cur Ave 0-10 11-20 21-30 31-40 41-50 51-60 61-70 71-80 05 FICON 00 Yes 1 0 100 0 0 0 0 0 0 0 48 ESCON 00 Yes 1 1 96 1 2 1 0 0 0 0 75 ESCON 00 Yes 1 1 96 1 2 1 1 0 0 0 00 FICON 00 Yes 0 0 100 0 0 0 0 0 0 0 01 FICON 00 Yes 0 0 100 0 0 0 0 0 0 0 02 FICON 00 Yes 0 0 100 0 0 0 0 0 0 0 03 FICON 00 Yes 0 0 100 0 0 0 0 0 0 0 04 FICON 00 Yes 0 0 100 0 0 0 0 0 0 0 06 FICON 00 Yes 0 0 100 0 0 0 0 0 0 0 07 FICON 00 Yes 0 0 100 0 0 0 0 0 0 0 3E ESCON 00 Yes 0 0 100 0 0 0 0 0 0 0 3F ESCON 00 Yes 0 0 100 0 0 0 0 0 0 0 40 ESCON 00 Yes 0 0 100 0 0 0 0 0 0 0 41 ESCON 00 Yes 0 0 100 0 0 0 0 0 0 0 42 ESCON 00 Yes 0 0 100 0 0 0 0 0 0 0 43 ESCON 00 Yes 0 0 100 0 0 0 0 0 0 0 44 ESCON 00 Yes 0 0 100 0 0 0 0 0 0 0 45 ESCON 00 Yes 0 0 100 0 0 0 0 0 0 0 46 ESCON 00 Yes 0 0 100 0 0 0 0 0 0 0 47 ESCON 00 Yes 0 0 100 0 0 0 0 0 0 0 49 ESCON 00 Yes 0 1 96 1 1 2 1 0 0 0 F0 Hiper 00 Yes n/a n/a .. .. .. .. .. .. .. .. F1 Hiper 00 Yes n/a n/a .. .. .. .. .. .. .. .. F2 Hiper 00 Yes n/a n/a .. .. .. .. .. .. .. .. F3 Hiper 00 Yes n/a n/a .. .. .. .. .. .. .. .. >>>>>>>>>> Enter next command, or 'QUIT' to exit <<<<<<<<<<
146 Linux on IBM Eserver zSeries and S/390: Performance Toolkit for VM
Chapter 8. Monitoring Linux guests
Performance Toolkit for VM can retrieve and display Linux internal performance data. This chapter provides an introduction to analyzing what goes on inside Linux guests. Topics include:
� Reporting Linux monitor data
� Viewing Linux performance data
� Analyzing Linux guest memory utilization
� Analyzing Linux guest paging
8
© Copyright IBM Corp. 2004. All rights reserved. 147

8.1 Reporting Linux monitor dataPerformance Toolkit for VM can retrieve and display internal Linux performance data. The data is gathered by processes running in the Linux virtual machine and fed to Performance Toolkit for VM using the Distributed Data Server (DDS). DDS, which originally was written for use with Resource Measurement Facility™ (RMF™), is available at:
http://www.ibm.com/servers/eserver/zseries/zos/rmf/rmfhtmls/pmweb/pmlin.htm
DDS operates as a server process running on Linux that feeds performance data to Performance Toolkit for VM over a TCP/IP connection as shown in Figure 8-1.
Figure 8-1 Data collection using DDS
8.1.1 Installing DDSIn order to report Linux monitor data, each Linux guest that is to be monitored must first install and configure DDS. The DDS package is available at:
ftp://ftp.software.ibm.com/eserver/zseries/zos/rmf
PERFSVM z/VM 4.4
Linux1
DDS
Linux2
DDS
TCP/IP
Linuxn
DDS
Linux3
DDS
148 Linux on IBM Eserver zSeries and S/390: Performance Toolkit for VM
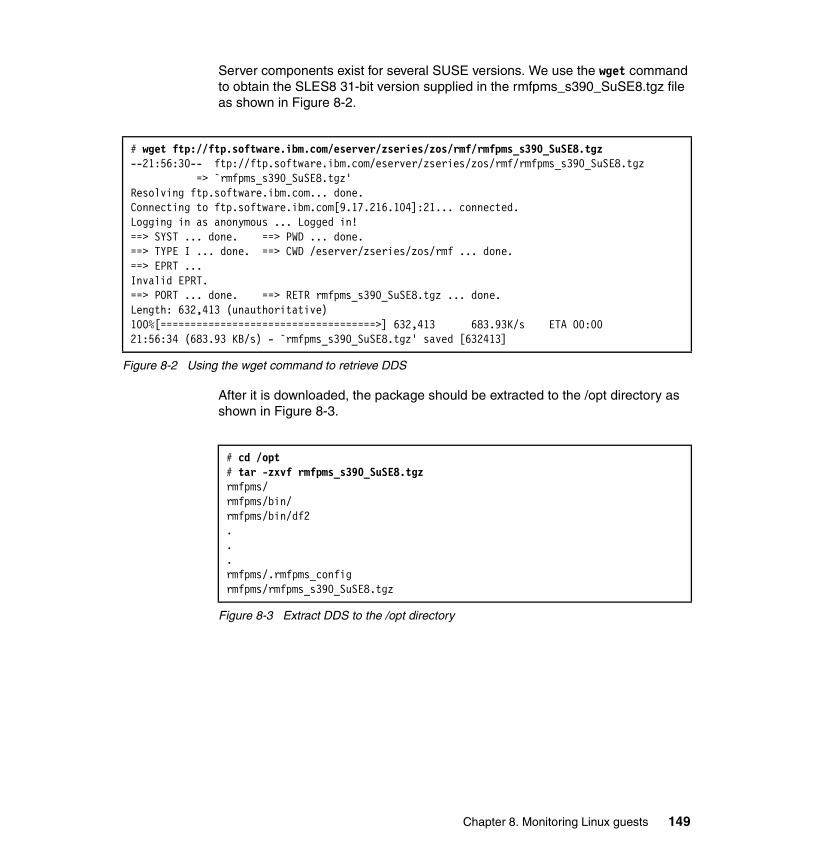
Server components exist for several SUSE versions. We use the wget command to obtain the SLES8 31-bit version supplied in the rmfpms_s390_SuSE8.tgz file as shown in Figure 8-2.
Figure 8-2 Using the wget command to retrieve DDS
After it is downloaded, the package should be extracted to the /opt directory as shown in Figure 8-3.
Figure 8-3 Extract DDS to the /opt directory
# wget ftp://ftp.software.ibm.com/eserver/zseries/zos/rmf/rmfpms_s390_SuSE8.tgz--21:56:30-- ftp://ftp.software.ibm.com/eserver/zseries/zos/rmf/rmfpms_s390_SuSE8.tgz => `rmfpms_s390_SuSE8.tgz'Resolving ftp.software.ibm.com... done.Connecting to ftp.software.ibm.com[9.17.216.104]:21... connected.Logging in as anonymous ... Logged in!==> SYST ... done. ==> PWD ... done.==> TYPE I ... done. ==> CWD /eserver/zseries/zos/rmf ... done.==> EPRT ...Invalid EPRT.==> PORT ... done. ==> RETR rmfpms_s390_SuSE8.tgz ... done.Length: 632,413 (unauthoritative)100%[====================================>] 632,413 683.93K/s ETA 00:0021:56:34 (683.93 KB/s) - `rmfpms_s390_SuSE8.tgz' saved [632413]
# cd /opt # tar -zxvf rmfpms_s390_SuSE8.tgzrmfpms/rmfpms/bin/rmfpms/bin/df2...rmfpms/.rmfpms_configrmfpms/rmfpms_s390_SuSE8.tgz
Chapter 8. Monitoring Linux guests 149
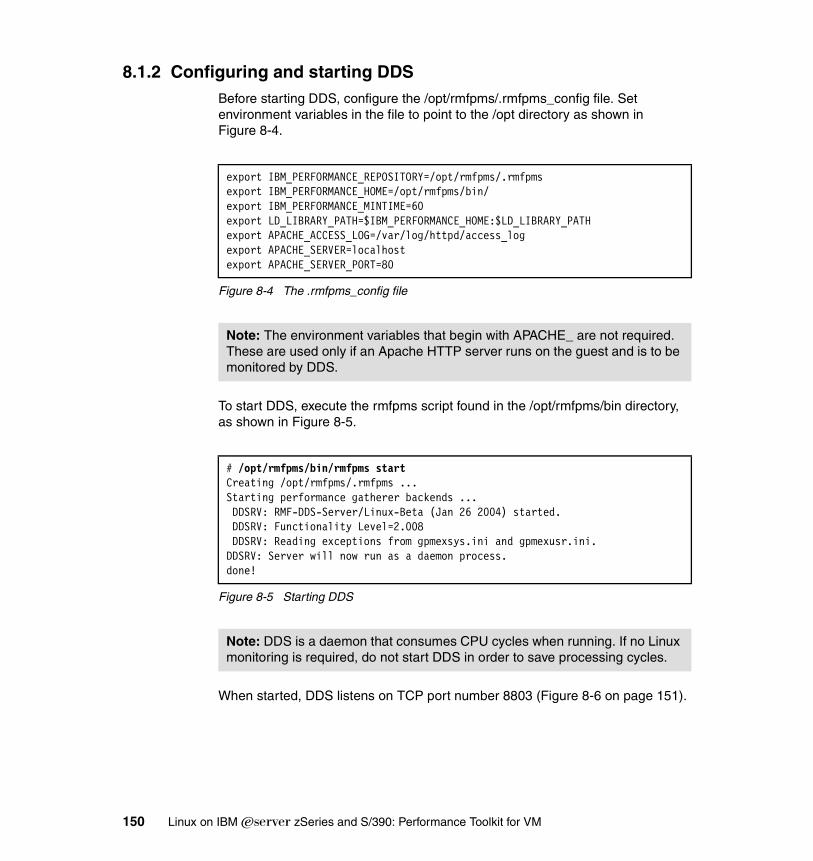
8.1.2 Configuring and starting DDSBefore starting DDS, configure the /opt/rmfpms/.rmfpms_config file. Set environment variables in the file to point to the /opt directory as shown in Figure 8-4.
Figure 8-4 The .rmfpms_config file
To start DDS, execute the rmfpms script found in the /opt/rmfpms/bin directory, as shown in Figure 8-5.
Figure 8-5 Starting DDS
When started, DDS listens on TCP port number 8803 (Figure 8-6 on page 151).
export IBM_PERFORMANCE_REPOSITORY=/opt/rmfpms/.rmfpmsexport IBM_PERFORMANCE_HOME=/opt/rmfpms/bin/export IBM_PERFORMANCE_MINTIME=60export LD_LIBRARY_PATH=$IBM_PERFORMANCE_HOME:$LD_LIBRARY_PATHexport APACHE_ACCESS_LOG=/var/log/httpd/access_logexport APACHE_SERVER=localhostexport APACHE_SERVER_PORT=80
Note: The environment variables that begin with APACHE_ are not required. These are used only if an Apache HTTP server runs on the guest and is to be monitored by DDS.
# /opt/rmfpms/bin/rmfpms startCreating /opt/rmfpms/.rmfpms ...Starting performance gatherer backends ... DDSRV: RMF-DDS-Server/Linux-Beta (Jan 26 2004) started. DDSRV: Functionality Level=2.008 DDSRV: Reading exceptions from gpmexsys.ini and gpmexusr.ini.DDSRV: Server will now run as a daemon process.done!
Note: DDS is a daemon that consumes CPU cycles when running. If no Linux monitoring is required, do not start DDS in order to save processing cycles.
150 Linux on IBM Eserver zSeries and S/390: Performance Toolkit for VM
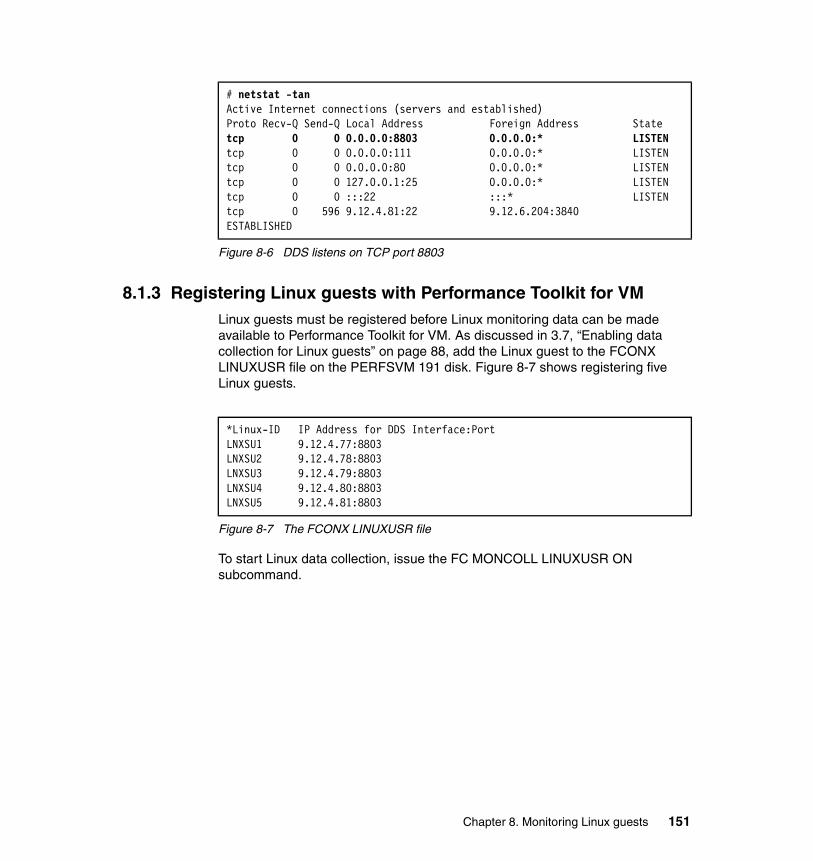
Figure 8-6 DDS listens on TCP port 8803
8.1.3 Registering Linux guests with Performance Toolkit for VMLinux guests must be registered before Linux monitoring data can be made available to Performance Toolkit for VM. As discussed in 3.7, “Enabling data collection for Linux guests” on page 88, add the Linux guest to the FCONX LINUXUSR file on the PERFSVM 191 disk. Figure 8-7 shows registering five Linux guests.
Figure 8-7 The FCONX LINUXUSR file
To start Linux data collection, issue the FC MONCOLL LINUXUSR ON subcommand.
# netstat -tanActive Internet connections (servers and established)Proto Recv-Q Send-Q Local Address Foreign Address Statetcp 0 0 0.0.0.0:8803 0.0.0.0:* LISTENtcp 0 0 0.0.0.0:111 0.0.0.0:* LISTENtcp 0 0 0.0.0.0:80 0.0.0.0:* LISTENtcp 0 0 127.0.0.1:25 0.0.0.0:* LISTENtcp 0 0 :::22 :::* LISTENtcp 0 596 9.12.4.81:22 9.12.6.204:3840 ESTABLISHED
*Linux-ID IP Address for DDS Interface:PortLNXSU1 9.12.4.77:8803LNXSU2 9.12.4.78:8803LNXSU3 9.12.4.79:8803LNXSU4 9.12.4.80:8803LNXSU5 9.12.4.81:8803
Chapter 8. Monitoring Linux guests 151
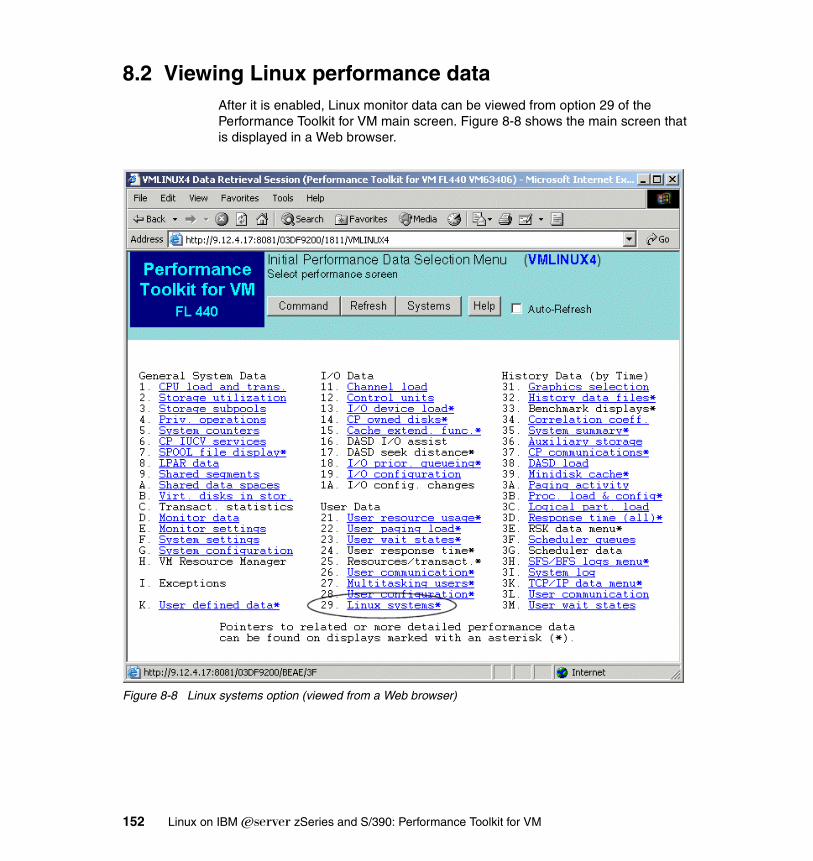
8.2 Viewing Linux performance dataAfter it is enabled, Linux monitor data can be viewed from option 29 of the Performance Toolkit for VM main screen. Figure 8-8 shows the main screen that is displayed in a Web browser.
Figure 8-8 Linux systems option (viewed from a Web browser)
152 Linux on IBM Eserver zSeries and S/390: Performance Toolkit for VM
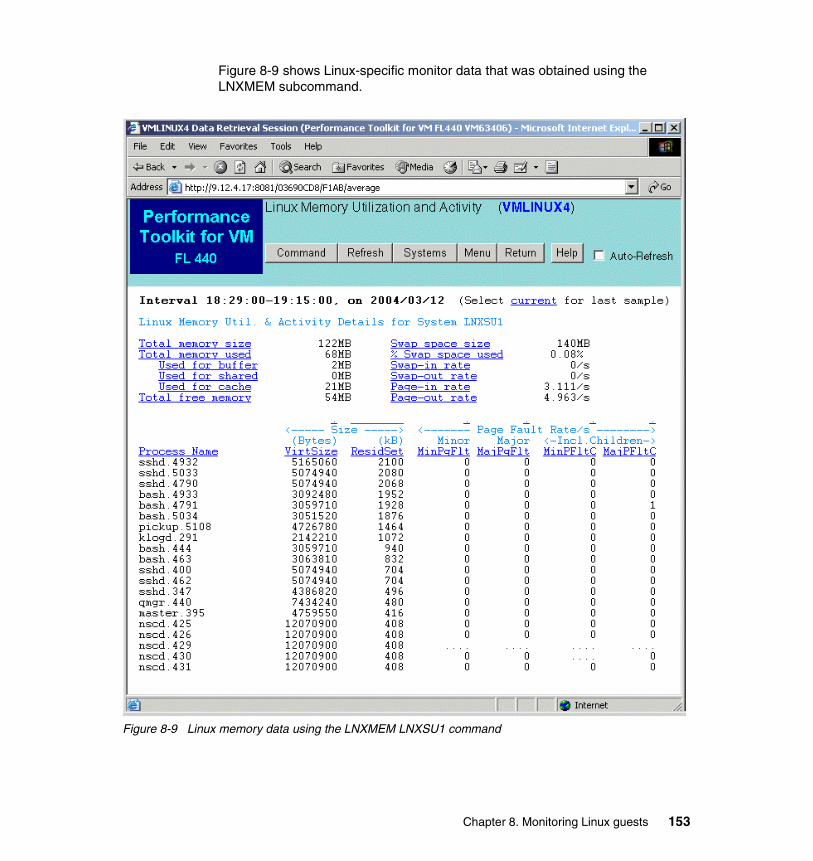
Figure 8-9 shows Linux-specific monitor data that was obtained using the LNXMEM subcommand.
Figure 8-9 Linux memory data using the LNXMEM LNXSU1 command
Chapter 8. Monitoring Linux guests 153
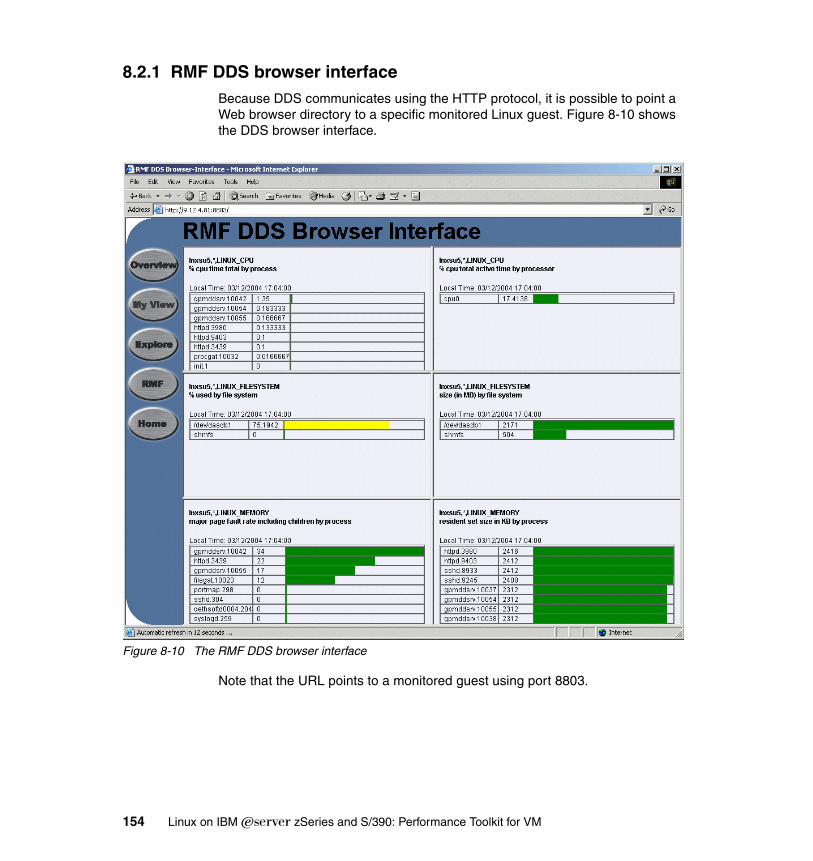
8.2.1 RMF DDS browser interfaceBecause DDS communicates using the HTTP protocol, it is possible to point a Web browser directory to a specific monitored Linux guest. Figure 8-10 shows the DDS browser interface.
Figure 8-10 The RMF DDS browser interface
Note that the URL points to a monitored guest using port 8803.
154 Linux on IBM Eserver zSeries and S/390: Performance Toolkit for VM
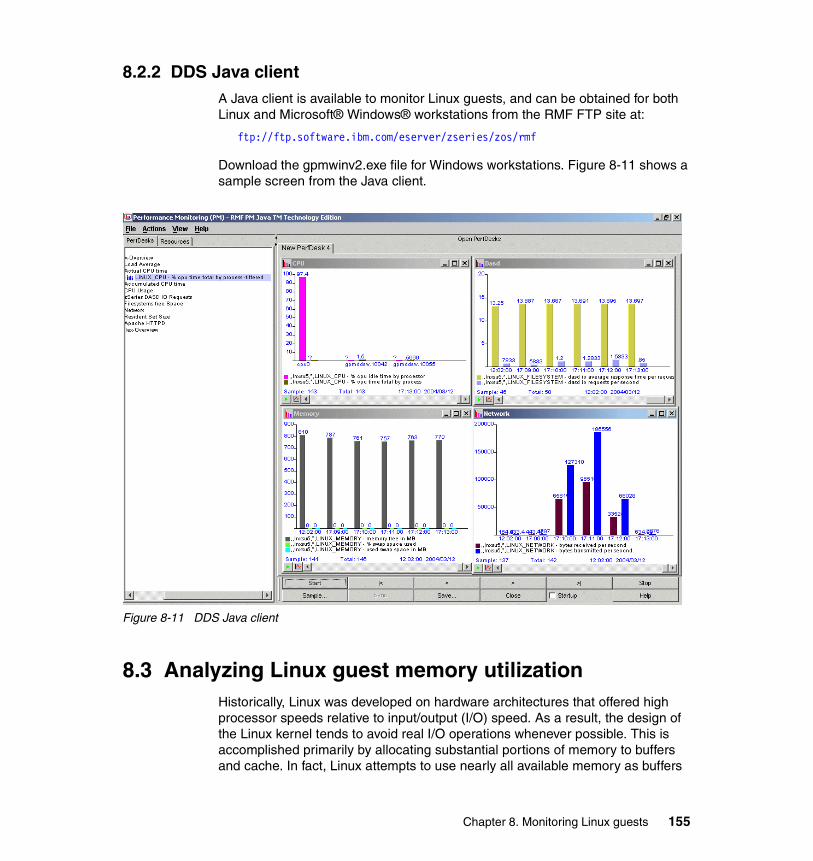
8.2.2 DDS Java clientA Java client is available to monitor Linux guests, and can be obtained for both Linux and Microsoft® Windows® workstations from the RMF FTP site at:
ftp://ftp.software.ibm.com/eserver/zseries/zos/rmf
Download the gpmwinv2.exe file for Windows workstations. Figure 8-11 shows a sample screen from the Java client.
Figure 8-11 DDS Java client
8.3 Analyzing Linux guest memory utilizationHistorically, Linux was developed on hardware architectures that offered high processor speeds relative to input/output (I/O) speed. As a result, the design of the Linux kernel tends to avoid real I/O operations whenever possible. This is accomplished primarily by allocating substantial portions of memory to buffers and cache. In fact, Linux attempts to use nearly all available memory as buffers
Chapter 8. Monitoring Linux guests 155
or file system cache. Buffer caching and file system caching can improve the performance of a specific Linux guest, as long as memory resources are not overcommitted and heavily used. However, on a memory-constrained system aggressive caching and buffering in a Linux guest can reduce overall system performance when a large number of Linux guests compete for memory.
In a z/VM system, overcommitted memory is a normal situation. zSeries architecture is optimized for high-speed I/O operations. In this case, aggressive buffering to avoid I/O can be counterproductive when memory becomes scarce. Linux for zSeries employs the same general memory management scheme as Linux for other platforms, so Linux is unaware that it is running in a virtualized environment. To reduce contention for system memory, we must reduce buffering and caching in z/VM Linux guests. The best way to accomplish this is to reduce the virtual machine size of Linux guests.
Normally, multiple virtual machines are active on a z/VM system and seem to run simultaneously. Every guest runs in its own virtual machine. From the guest’s perspective, it completely owns all of the resources (CPU, memory). But the CPU is shared over the time to run several z/VM processes and the processes, including the guest’s. Each process needs to run a special amount of memory (in z/VM terms, working set size).
To be cost-effective, it is not unusual to overcommit a portion of resources. The applications can run only when their allocated memory is in main memory. In case of a overcommitment of memory, not all pages belonging to all processes can be hosted in the main memory at the same time. Resource sharing is done by paging (bringing pages to the main memory as needed for the process to run and taking away pages that are not needed at the moment).
The overhead of paging is the price you pay for cost-effective dynamic resource balancing in z/VM. The amount of paging that occurs depends of the amount of total memory that is available for the guests, and the workload of each guest in ratio to the portion of the available memory. consider, too, the amount of work that has to be done at the same time. It is not possible to give “one size fits all” recommendations here, but the Performance Toolkit for VM may help to detect the bottlenecks and memory usage overall.
Note: See Linux on IBM ̂zSeries and S/390: Performance Measurement and Tuning, SG24-6926 for details about sizing Linux virtual machines. As a general rule, reduce memory size to the point where swapping in the guest first occurs. At that point, add an additional 10% to 20% memory. Define fast swap devices such as VDISK to reduce the negative effect of occasional swapping in small Linux guests.
156 Linux on IBM Eserver zSeries and S/390: Performance Toolkit for VM
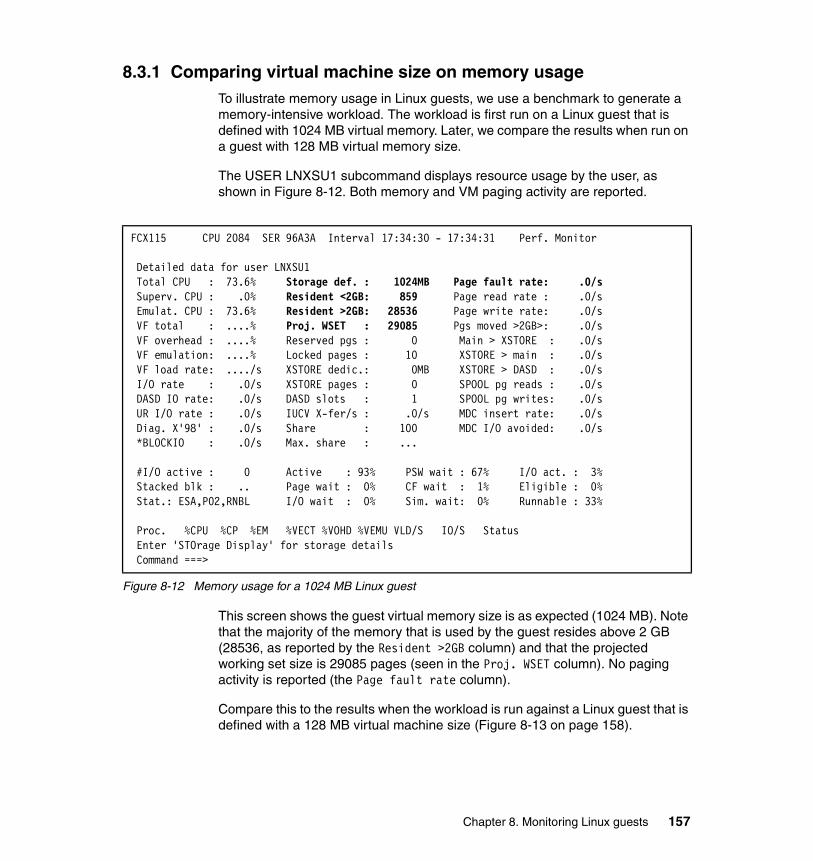
8.3.1 Comparing virtual machine size on memory usageTo illustrate memory usage in Linux guests, we use a benchmark to generate a memory-intensive workload. The workload is first run on a Linux guest that is defined with 1024 MB virtual memory. Later, we compare the results when run on a guest with 128 MB virtual memory size.
The USER LNXSU1 subcommand displays resource usage by the user, as shown in Figure 8-12. Both memory and VM paging activity are reported.
Figure 8-12 Memory usage for a 1024 MB Linux guest
This screen shows the guest virtual memory size is as expected (1024 MB). Note that the majority of the memory that is used by the guest resides above 2 GB (28536, as reported by the Resident >2GB column) and that the projected working set size is 29085 pages (seen in the Proj. WSET column). No paging activity is reported (the Page fault rate column).
Compare this to the results when the workload is run against a Linux guest that is defined with a 128 MB virtual machine size (Figure 8-13 on page 158).
FCX115 CPU 2084 SER 96A3A Interval 17:34:30 - 17:34:31 Perf. Monitor Detailed data for user LNXSU1 Total CPU : 73.6% Storage def. : 1024MB Page fault rate: .0/s Superv. CPU : .0% Resident <2GB: 859 Page read rate : .0/s Emulat. CPU : 73.6% Resident >2GB: 28536 Page write rate: .0/s VF total : ....% Proj. WSET : 29085 Pgs moved >2GB>: .0/s VF overhead : ....% Reserved pgs : 0 Main > XSTORE : .0/s VF emulation: ....% Locked pages : 10 XSTORE > main : .0/s VF load rate: ..../s XSTORE dedic.: 0MB XSTORE > DASD : .0/s I/O rate : .0/s XSTORE pages : 0 SPOOL pg reads : .0/s DASD IO rate: .0/s DASD slots : 1 SPOOL pg writes: .0/s UR I/O rate : .0/s IUCV X-fer/s : .0/s MDC insert rate: .0/s Diag. X'98' : .0/s Share : 100 MDC I/O avoided: .0/s *BLOCKIO : .0/s Max. share : ... #I/O active : 0 Active : 93% PSW wait : 67% I/O act. : 3% Stacked blk : .. Page wait : 0% CF wait : 1% Eligible : 0% Stat.: ESA,P02,RNBL I/O wait : 0% Sim. wait: 0% Runnable : 33% Proc. %CPU %CP %EM %VECT %VOHD %VEMU VLD/S IO/S Status Enter 'STOrage Display' for storage details Command ===>
Chapter 8. Monitoring Linux guests 157
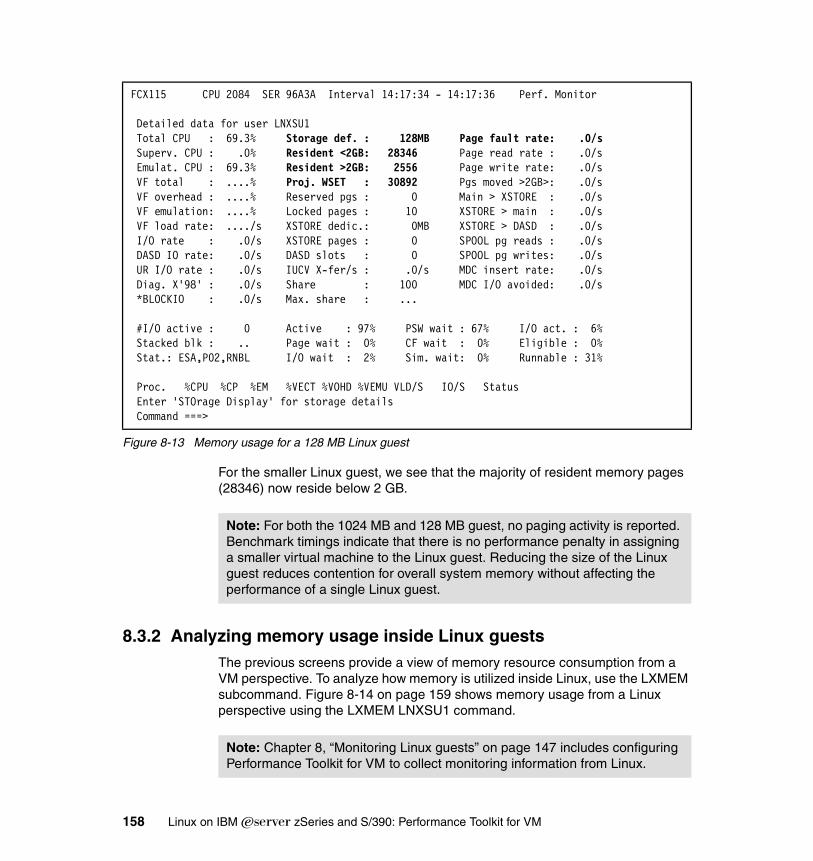
Figure 8-13 Memory usage for a 128 MB Linux guest
For the smaller Linux guest, we see that the majority of resident memory pages (28346) now reside below 2 GB.
8.3.2 Analyzing memory usage inside Linux guestsThe previous screens provide a view of memory resource consumption from a VM perspective. To analyze how memory is utilized inside Linux, use the LXMEM subcommand. Figure 8-14 on page 159 shows memory usage from a Linux perspective using the LXMEM LNXSU1 command.
FCX115 CPU 2084 SER 96A3A Interval 14:17:34 - 14:17:36 Perf. Monitor Detailed data for user LNXSU1 Total CPU : 69.3% Storage def. : 128MB Page fault rate: .0/s Superv. CPU : .0% Resident <2GB: 28346 Page read rate : .0/s Emulat. CPU : 69.3% Resident >2GB: 2556 Page write rate: .0/s VF total : ....% Proj. WSET : 30892 Pgs moved >2GB>: .0/s VF overhead : ....% Reserved pgs : 0 Main > XSTORE : .0/s VF emulation: ....% Locked pages : 10 XSTORE > main : .0/s VF load rate: ..../s XSTORE dedic.: 0MB XSTORE > DASD : .0/s I/O rate : .0/s XSTORE pages : 0 SPOOL pg reads : .0/s DASD IO rate: .0/s DASD slots : 0 SPOOL pg writes: .0/s UR I/O rate : .0/s IUCV X-fer/s : .0/s MDC insert rate: .0/s Diag. X'98' : .0/s Share : 100 MDC I/O avoided: .0/s *BLOCKIO : .0/s Max. share : ... #I/O active : 0 Active : 97% PSW wait : 67% I/O act. : 6% Stacked blk : .. Page wait : 0% CF wait : 0% Eligible : 0% Stat.: ESA,P02,RNBL I/O wait : 2% Sim. wait: 0% Runnable : 31% Proc. %CPU %CP %EM %VECT %VOHD %VEMU VLD/S IO/S Status Enter 'STOrage Display' for storage details Command ===>
Note: For both the 1024 MB and 128 MB guest, no paging activity is reported. Benchmark timings indicate that there is no performance penalty in assigning a smaller virtual machine to the Linux guest. Reducing the size of the Linux guest reduces contention for overall system memory without affecting the performance of a single Linux guest.
Note: Chapter 8, “Monitoring Linux guests” on page 147 includes configuring Performance Toolkit for VM to collect monitoring information from Linux.
158 Linux on IBM Eserver zSeries and S/390: Performance Toolkit for VM
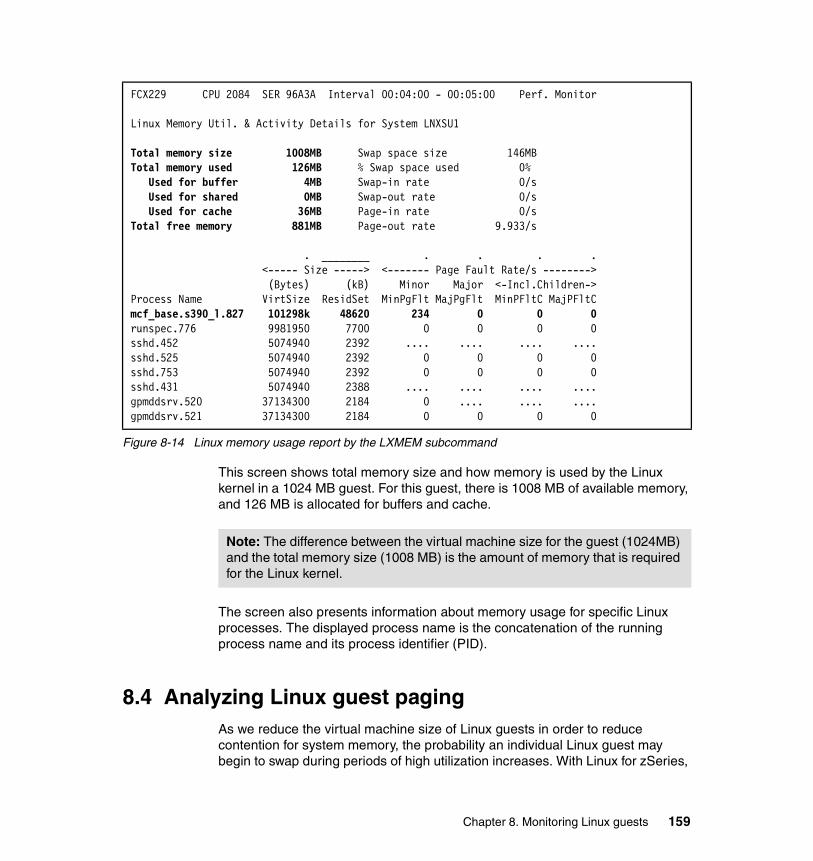
Figure 8-14 Linux memory usage report by the LXMEM subcommand
This screen shows total memory size and how memory is used by the Linux kernel in a 1024 MB guest. For this guest, there is 1008 MB of available memory, and 126 MB is allocated for buffers and cache.
The screen also presents information about memory usage for specific Linux processes. The displayed process name is the concatenation of the running process name and its process identifier (PID).
8.4 Analyzing Linux guest pagingAs we reduce the virtual machine size of Linux guests in order to reduce contention for system memory, the probability an individual Linux guest may begin to swap during periods of high utilization increases. With Linux for zSeries,
FCX229 CPU 2084 SER 96A3A Interval 00:04:00 - 00:05:00 Perf. Monitor Linux Memory Util. & Activity Details for System LNXSU1 Total memory size 1008MB Swap space size 146MB Total memory used 126MB % Swap space used 0% Used for buffer 4MB Swap-in rate 0/s Used for shared 0MB Swap-out rate 0/s Used for cache 36MB Page-in rate 0/s Total free memory 881MB Page-out rate 9.933/s . ________ . . . . <----- Size -----> <------- Page Fault Rate/s --------> (Bytes) (kB) Minor Major <-Incl.Children-> Process Name VirtSize ResidSet MinPgFlt MajPgFlt MinPFltC MajPFltC mcf_base.s390_l.827 101298k 48620 234 0 0 0 runspec.776 9981950 7700 0 0 0 0 sshd.452 5074940 2392 .... .... .... .... sshd.525 5074940 2392 0 0 0 0 sshd.753 5074940 2392 0 0 0 0 sshd.431 5074940 2388 .... .... .... .... gpmddsrv.520 37134300 2184 0 .... .... .... gpmddsrv.521 37134300 2184 0 0 0 0
Note: The difference between the virtual machine size for the guest (1024MB) and the total memory size (1008 MB) is the amount of memory that is required for the Linux kernel.
Chapter 8. Monitoring Linux guests 159
we have several options when defining swap partitions to a Linux guest. In this section, we look at some of these options and illustrate how to monitor activity on Linux swap partitions using Performance Toolkit for VM.
8.4.1 Using a VDISK as a Linux swap partitionA VDISK is a temporary FBA minidisk allocated in z/VM main memory. Because VDISKs reside in main memory, I/O overhead is avoided and data access is faster than accessing real DASD. Using a VDISK swap partition has the potential for improving system performance. However, there are situations where VDISK swap partitions can degrade system performance. The decision to use VDISK swap partitions should be based on your system configuration:
� Large memory systems
For systems with large real memory, VDISK swap partitions can reduce Linux guest latency. The VDISK is a very fast I/O device when its disk blocks, implemented as pages in an address space, can remain memory-resident.
When performing I/O to a VDISK, z/VM does not require the Linux guest’s buffers to reside below 2 GB. VDISKs might be appropriate if your system is memory-constrained below 2 GB, but has adequate memory above 2 GB.
� Memory-constrained systems
Prior to z/VM 4.4.0, page faults that occurred on a VDISK memory page caused that page and any other associated pages to be brought into real memory below 2 GB. This could add to system memory contention below 2 GB. In z/VM 4.4.0, this behavior changed to bring VDISK memory pages to real memory 2 GB where possible.
Though the pages backing the VDISK blocks themselves are not created until referenced, the control blocks for dynamic address translation (primarily page tables and segment tables) are created when the VDISK is created. These control blocks are not pageable and must reside below 2 GB (a factor that can increase contention below 2 GB).
The VM memory management steal processing has a hierarchy of pages that it uses in trying to select the most appropriate pages. In that hierarchy, normal idle guest pages are chosen for steal more readily than VDISK pages (a virtual disk in memory page is really a system utility space and therefore is given preferential treatment). As Linux guests go idle, this hierarchy might have an undesirable
Note: Using a VDISK does not change other Linux I/O behavior. Linux must still form and execute I/O commands to read and write the swap extent, and z/VM must still perform these I/O operations for the guest.
160 Linux on IBM Eserver zSeries and S/390: Performance Toolkit for VM
effect. Linux will determine an unused page and move it out to its swap disk (a VDISK). If the Linux guest goes idle, VM memory management will steal more aggressively from the guest pages (pages Linux decided it needed) and less aggressively from the VDISK (pages Linux decided it was safe to page out). This is counter to what good performance would dictate.
Again we mention that for VDISK I/O, z/VM does not pull the Linux guest’s swap file I/O buffers to below the real 2 GB line in order to do the I/O for the guest. If you are memory-constrained below 2 GB but rich above, VDISK might be particularly appropriate for you if not defined unnecessarily large.
8.4.2 Effect of minidisk cacheMinidisk cache is a z/VM feature that can provide a significant performance improvement to z/VM guests. The MDC feature uses real or expanded memory to cache data for virtual I/O, thus avoiding real I/O to DASD. MDC trades increased use of real and expanded memory for decreased DASD I/O.
Because paging to DASD increases as the amount of available real and expanded memory decreases, you should expect some increase in paging I/O when exploiting the MDC. An increase in paging is not necessarily bad. The total real DASD I/O rate and user state sampling can indicate whether the MDC benefits system performance. For example, if the MDC reduces real DASD I/O rate by 300 I/O operations per second and paging DASD I/O increases by 50 per second, there would be a net 250 I/O operations per second reduction.
8.4.3 Effect of expanded storageWhile the configuration of some expanded memory may result in more paging, it often results in more consistent or better response time. VM paging algorithms are tuned for a hierarchy of paging devices:
� Expanded memory is a high-speed paging device.� DASD is a slower paging device that performs block paging.
Important: Since a VDISK resides in the z/VM main memory you should carefully consider how many VDISKs you really need. If your system is already memory-constrained, it is probably better not to use VDISKs.
Important: MDC can be enabled or disabled for each minidisk. MDC can be set to use 4 K record caching or normal full track caching. Full track caching is the default when MDC is set on without a parameter. We recommend using only MDC record caching.
Chapter 8. Monitoring Linux guests 161
Expanded memory acts as a buffer for more active users as they switch between working sets. The more active users do not compete with users coming from a completely paged out scenario.
To illustrate, consider a scenario in which a programmer and a manager both log on to a z/VM system. The programmer issues commands to create software; the manager looks up a phone number, then talks on the phone for 20 minutes. If all real memory were allocated as z/VM main memory, the system would page less often. However, it will eventually page part of the programmer’s working set. When the manager gets off the phone and returns to the VM session, the programmer competes for memory pages with the manager’s working set on slower DASD. Using expanded storage, the programmer will page more; however, paging would most likely occur in expanded storage. This reduces contention with the manager’s working set (which likely resides on slower DASD). The programmer experiences slightly higher response times, but the response time is more consistent.
8.4.4 Monitoring Linux guest pagingTo illustrate the effect of paging in a Linux guest, use a benchmark to cause swap partition activity on a Linux guest. In the tests, we use a SUSE Linux guest defined with a 128 MB virtual machine size. We monitor the guest’s resource usage with the USER command in several scenarios:
� Using a single minidisk swap partition
In this scenario, we define a minidisk residing on a RAMAC® Virtual Array (RVA) as the Linux swap partition. We also look at the effect of the MDC on the swap device.
� Using four minidisk swap partitions
In this scenario, we define four RVA minidisks as Linux swap partitions.
� Using a VDISK swap partition
In this scenario, we define a single VDISK as the Linux swap partition.
8.4.5 Using a single minidisk swap partitionFigure 8-15 on page 163 shows the result of a single minidisk swap partition with MDC disabled. In this case, although the guest is defined with two virtual processors, the reported CPU utilization is 91%. This is due to the high I/O rate (147/s). In the device activity section, I/O activity is primarily to the swap partition
Note: The manager is likely to page to expanded memory for a short period of time before being paged out to DASD.
162 Linux on IBM Eserver zSeries and S/390: Performance Toolkit for VM
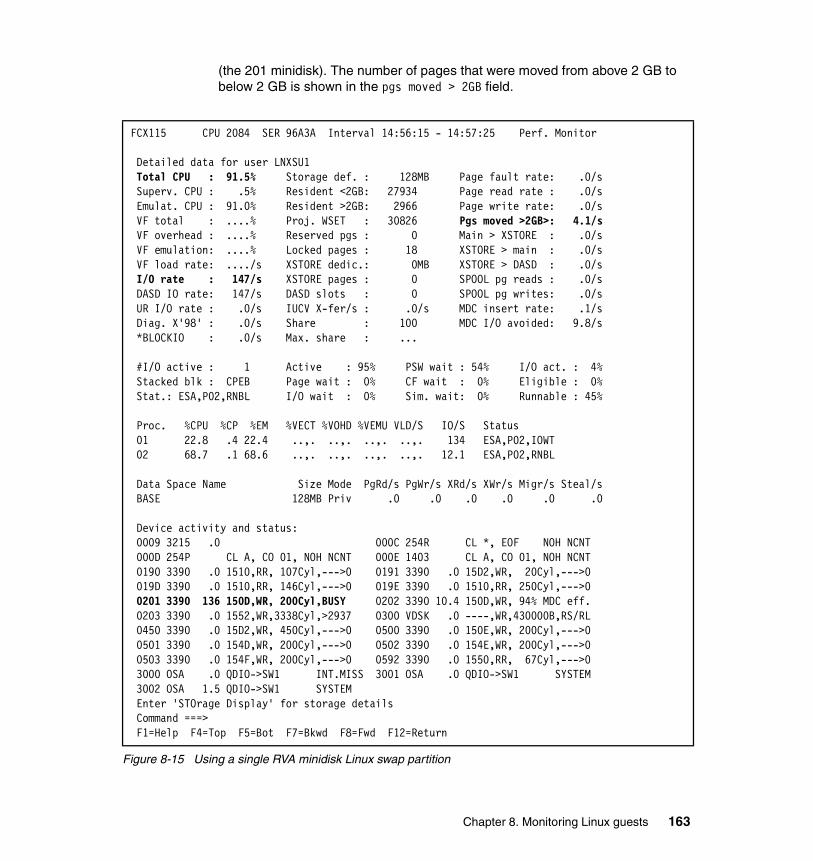
(the 201 minidisk). The number of pages that were moved from above 2 GB to below 2 GB is shown in the pgs moved > 2GB field.
Figure 8-15 Using a single RVA minidisk Linux swap partition
FCX115 CPU 2084 SER 96A3A Interval 14:56:15 - 14:57:25 Perf. Monitor Detailed data for user LNXSU1 Total CPU : 91.5% Storage def. : 128MB Page fault rate: .0/s Superv. CPU : .5% Resident <2GB: 27934 Page read rate : .0/s Emulat. CPU : 91.0% Resident >2GB: 2966 Page write rate: .0/s VF total : ....% Proj. WSET : 30826 Pgs moved >2GB>: 4.1/s VF overhead : ....% Reserved pgs : 0 Main > XSTORE : .0/s VF emulation: ....% Locked pages : 18 XSTORE > main : .0/s VF load rate: ..../s XSTORE dedic.: 0MB XSTORE > DASD : .0/s I/O rate : 147/s XSTORE pages : 0 SPOOL pg reads : .0/s DASD IO rate: 147/s DASD slots : 0 SPOOL pg writes: .0/s UR I/O rate : .0/s IUCV X-fer/s : .0/s MDC insert rate: .1/s Diag. X'98' : .0/s Share : 100 MDC I/O avoided: 9.8/s *BLOCKIO : .0/s Max. share : ... #I/O active : 1 Active : 95% PSW wait : 54% I/O act. : 4% Stacked blk : CPEB Page wait : 0% CF wait : 0% Eligible : 0% Stat.: ESA,P02,RNBL I/O wait : 0% Sim. wait: 0% Runnable : 45% Proc. %CPU %CP %EM %VECT %VOHD %VEMU VLD/S IO/S Status 01 22.8 .4 22.4 ..,. ..,. ..,. ..,. 134 ESA,P02,IOWT 02 68.7 .1 68.6 ..,. ..,. ..,. ..,. 12.1 ESA,P02,RNBL Data Space Name Size Mode PgRd/s PgWr/s XRd/s XWr/s Migr/s Steal/s BASE 128MB Priv .0 .0 .0 .0 .0 .0 Device activity and status: 0009 3215 .0 000C 254R CL *, EOF NOH NCNT 000D 254P CL A, CO 01, NOH NCNT 000E 1403 CL A, CO 01, NOH NCNT 0190 3390 .0 1510,RR, 107Cyl,--->0 0191 3390 .0 15D2,WR, 20Cyl,--->0 019D 3390 .0 1510,RR, 146Cyl,--->0 019E 3390 .0 1510,RR, 250Cyl,--->0 0201 3390 136 150D,WR, 200Cyl,BUSY 0202 3390 10.4 150D,WR, 94% MDC eff. 0203 3390 .0 1552,WR,3338Cyl,>2937 0300 VDSK .0 ----,WR,430000B,RS/RL 0450 3390 .0 15D2,WR, 450Cyl,--->0 0500 3390 .0 150E,WR, 200Cyl,--->0 0501 3390 .0 154D,WR, 200Cyl,--->0 0502 3390 .0 154E,WR, 200Cyl,--->0 0503 3390 .0 154F,WR, 200Cyl,--->0 0592 3390 .0 1550,RR, 67Cyl,--->0 3000 OSA .0 QDIO->SW1 INT.MISS 3001 OSA .0 QDIO->SW1 SYSTEM 3002 OSA 1.5 QDIO->SW1 SYSTEM Enter 'STOrage Display' for storage details Command ===> F1=Help F4=Top F5=Bot F7=Bkwd F8=Fwd F12=Return
Chapter 8. Monitoring Linux guests 163
Effect of MDC on Linux swappingTo illustrate the effect of the MDC on Linux swapping, we enabled the MDC for the Linux swap device (the 201 minidisk) and re-ran the test. Figure 8-16 on page 165 shows the results.
In this case, CPU utilization is much lower at 36.9%. The reported I/O rate is much higher at 1159/s. However, much of the real I/O operations are avoided, as reported in the MDC I/O avoided field.
Note: In this scenario, the workload throughput actually decreased. This is not reported in the user resource utilization screen, but is indicated by the longer elapsed time that is required for the test. From this observation, we conclude that enabling the minidisk cache for the swap partition actually degrades performance, so the access pattern for Linux swapping does not justify the cost of using the MDC.
164 Linux on IBM Eserver zSeries and S/390: Performance Toolkit for VM
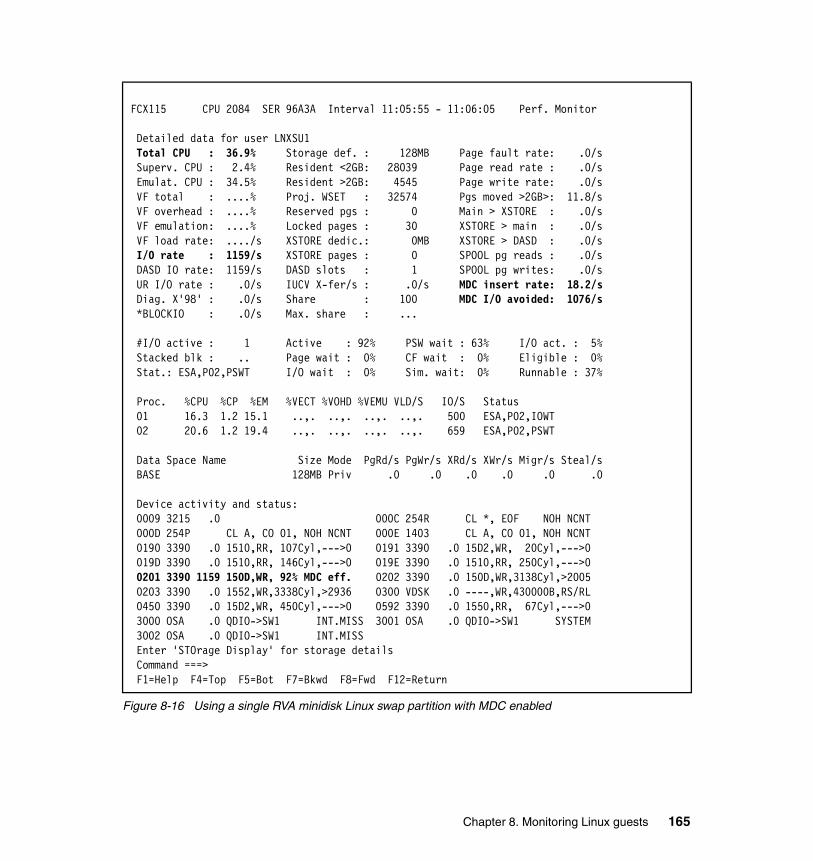
Figure 8-16 Using a single RVA minidisk Linux swap partition with MDC enabled
FCX115 CPU 2084 SER 96A3A Interval 11:05:55 - 11:06:05 Perf. Monitor Detailed data for user LNXSU1 Total CPU : 36.9% Storage def. : 128MB Page fault rate: .0/s Superv. CPU : 2.4% Resident <2GB: 28039 Page read rate : .0/s Emulat. CPU : 34.5% Resident >2GB: 4545 Page write rate: .0/s VF total : ....% Proj. WSET : 32574 Pgs moved >2GB>: 11.8/s VF overhead : ....% Reserved pgs : 0 Main > XSTORE : .0/s VF emulation: ....% Locked pages : 30 XSTORE > main : .0/s VF load rate: ..../s XSTORE dedic.: 0MB XSTORE > DASD : .0/s I/O rate : 1159/s XSTORE pages : 0 SPOOL pg reads : .0/s DASD IO rate: 1159/s DASD slots : 1 SPOOL pg writes: .0/s UR I/O rate : .0/s IUCV X-fer/s : .0/s MDC insert rate: 18.2/s Diag. X'98' : .0/s Share : 100 MDC I/O avoided: 1076/s *BLOCKIO : .0/s Max. share : ... #I/O active : 1 Active : 92% PSW wait : 63% I/O act. : 5% Stacked blk : .. Page wait : 0% CF wait : 0% Eligible : 0% Stat.: ESA,P02,PSWT I/O wait : 0% Sim. wait: 0% Runnable : 37% Proc. %CPU %CP %EM %VECT %VOHD %VEMU VLD/S IO/S Status 01 16.3 1.2 15.1 ..,. ..,. ..,. ..,. 500 ESA,P02,IOWT 02 20.6 1.2 19.4 ..,. ..,. ..,. ..,. 659 ESA,P02,PSWT Data Space Name Size Mode PgRd/s PgWr/s XRd/s XWr/s Migr/s Steal/s BASE 128MB Priv .0 .0 .0 .0 .0 .0 Device activity and status: 0009 3215 .0 000C 254R CL *, EOF NOH NCNT 000D 254P CL A, CO 01, NOH NCNT 000E 1403 CL A, CO 01, NOH NCNT 0190 3390 .0 1510,RR, 107Cyl,--->0 0191 3390 .0 15D2,WR, 20Cyl,--->0 019D 3390 .0 1510,RR, 146Cyl,--->0 019E 3390 .0 1510,RR, 250Cyl,--->0 0201 3390 1159 150D,WR, 92% MDC eff. 0202 3390 .0 150D,WR,3138Cyl,>2005 0203 3390 .0 1552,WR,3338Cyl,>2936 0300 VDSK .0 ----,WR,430000B,RS/RL 0450 3390 .0 15D2,WR, 450Cyl,--->0 0592 3390 .0 1550,RR, 67Cyl,--->0 3000 OSA .0 QDIO->SW1 INT.MISS 3001 OSA .0 QDIO->SW1 SYSTEM 3002 OSA .0 QDIO->SW1 INT.MISS Enter 'STOrage Display' for storage details Command ===> F1=Help F4=Top F5=Bot F7=Bkwd F8=Fwd F12=Return
Chapter 8. Monitoring Linux guests 165
8.4.6 Using four minidisk swap partitionsFigure 8-17 on page 167 examines the effect of using four Linux swap partitions.
As seen in the Device activity and status fields, I/O activity to the four swap devices (devices 0500, 0501, 0502, and 0503) is well-balanced. The system uses all four swap devices equally because they are defined with the same priority. The throughput for this scenario is somewhat faster than using a single-swap minidisk with MDC disabled.
166 Linux on IBM Eserver zSeries and S/390: Performance Toolkit for VM
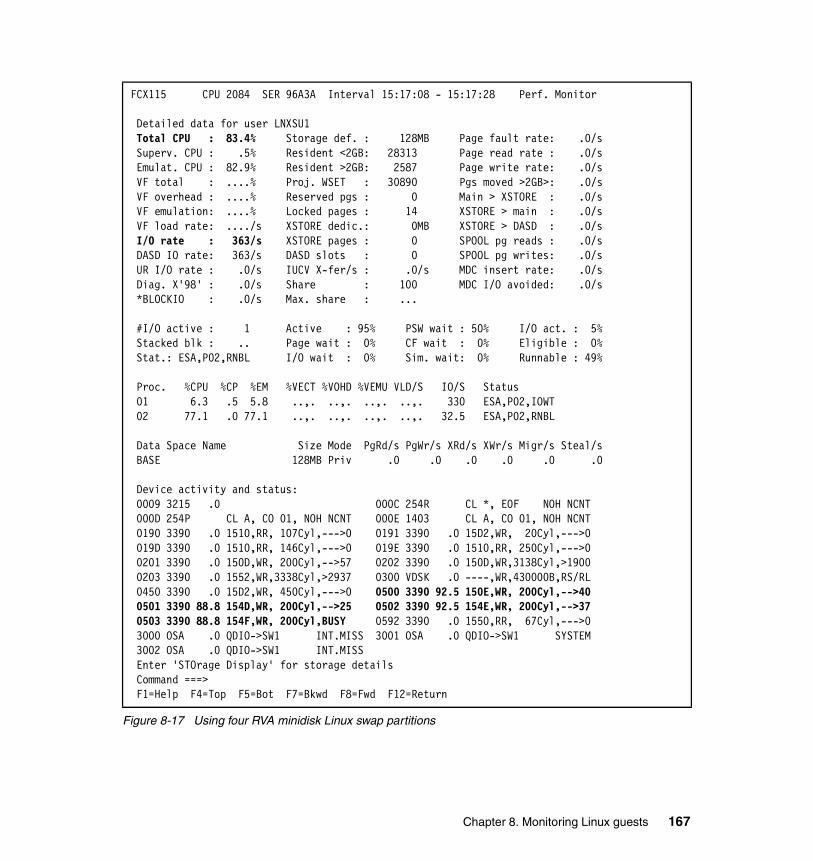
Figure 8-17 Using four RVA minidisk Linux swap partitions
FCX115 CPU 2084 SER 96A3A Interval 15:17:08 - 15:17:28 Perf. Monitor Detailed data for user LNXSU1 Total CPU : 83.4% Storage def. : 128MB Page fault rate: .0/s Superv. CPU : .5% Resident <2GB: 28313 Page read rate : .0/s Emulat. CPU : 82.9% Resident >2GB: 2587 Page write rate: .0/s VF total : ....% Proj. WSET : 30890 Pgs moved >2GB>: .0/s VF overhead : ....% Reserved pgs : 0 Main > XSTORE : .0/s VF emulation: ....% Locked pages : 14 XSTORE > main : .0/s VF load rate: ..../s XSTORE dedic.: 0MB XSTORE > DASD : .0/s I/O rate : 363/s XSTORE pages : 0 SPOOL pg reads : .0/s DASD IO rate: 363/s DASD slots : 0 SPOOL pg writes: .0/s UR I/O rate : .0/s IUCV X-fer/s : .0/s MDC insert rate: .0/s Diag. X'98' : .0/s Share : 100 MDC I/O avoided: .0/s *BLOCKIO : .0/s Max. share : ... #I/O active : 1 Active : 95% PSW wait : 50% I/O act. : 5% Stacked blk : .. Page wait : 0% CF wait : 0% Eligible : 0% Stat.: ESA,P02,RNBL I/O wait : 0% Sim. wait: 0% Runnable : 49% Proc. %CPU %CP %EM %VECT %VOHD %VEMU VLD/S IO/S Status 01 6.3 .5 5.8 ..,. ..,. ..,. ..,. 330 ESA,P02,IOWT 02 77.1 .0 77.1 ..,. ..,. ..,. ..,. 32.5 ESA,P02,RNBL Data Space Name Size Mode PgRd/s PgWr/s XRd/s XWr/s Migr/s Steal/s BASE 128MB Priv .0 .0 .0 .0 .0 .0 Device activity and status: 0009 3215 .0 000C 254R CL *, EOF NOH NCNT 000D 254P CL A, CO 01, NOH NCNT 000E 1403 CL A, CO 01, NOH NCNT 0190 3390 .0 1510,RR, 107Cyl,--->0 0191 3390 .0 15D2,WR, 20Cyl,--->0 019D 3390 .0 1510,RR, 146Cyl,--->0 019E 3390 .0 1510,RR, 250Cyl,--->0 0201 3390 .0 150D,WR, 200Cyl,-->57 0202 3390 .0 150D,WR,3138Cyl,>1900 0203 3390 .0 1552,WR,3338Cyl,>2937 0300 VDSK .0 ----,WR,430000B,RS/RL 0450 3390 .0 15D2,WR, 450Cyl,--->0 0500 3390 92.5 150E,WR, 200Cyl,-->40 0501 3390 88.8 154D,WR, 200Cyl,-->25 0502 3390 92.5 154E,WR, 200Cyl,-->37 0503 3390 88.8 154F,WR, 200Cyl,BUSY 0592 3390 .0 1550,RR, 67Cyl,--->0 3000 OSA .0 QDIO->SW1 INT.MISS 3001 OSA .0 QDIO->SW1 SYSTEM 3002 OSA .0 QDIO->SW1 INT.MISS Enter 'STOrage Display' for storage details Command ===> F1=Help F4=Top F5=Bot F7=Bkwd F8=Fwd F12=Return
Chapter 8. Monitoring Linux guests 167
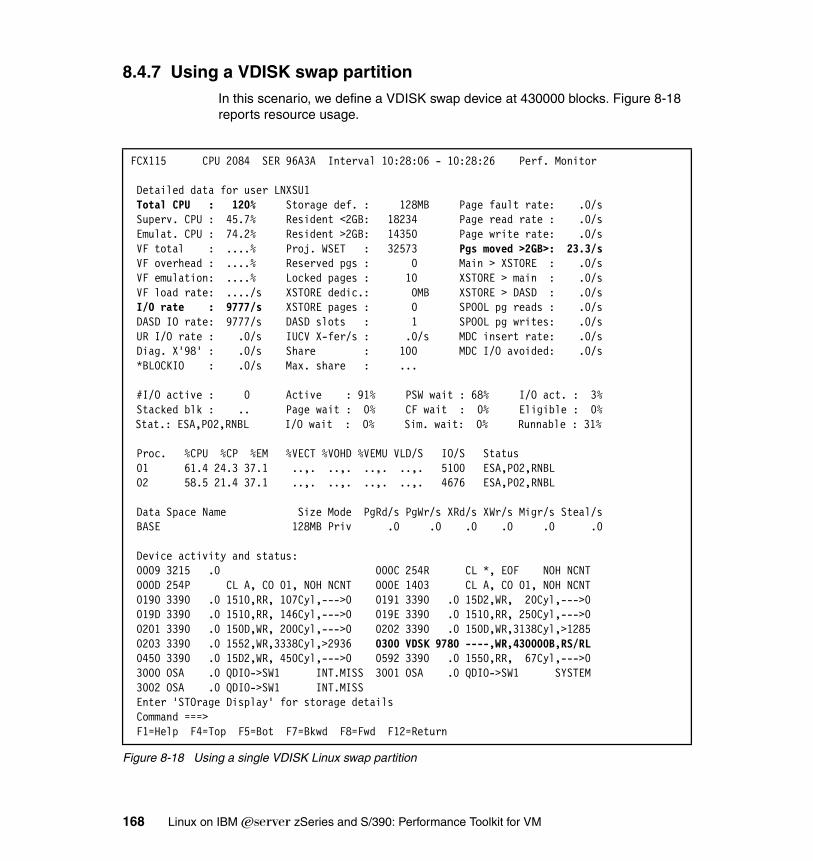
8.4.7 Using a VDISK swap partitionIn this scenario, we define a VDISK swap device at 430000 blocks. Figure 8-18 reports resource usage.
Figure 8-18 Using a single VDISK Linux swap partition
FCX115 CPU 2084 SER 96A3A Interval 10:28:06 - 10:28:26 Perf. Monitor Detailed data for user LNXSU1 Total CPU : 120% Storage def. : 128MB Page fault rate: .0/s Superv. CPU : 45.7% Resident <2GB: 18234 Page read rate : .0/s Emulat. CPU : 74.2% Resident >2GB: 14350 Page write rate: .0/s VF total : ....% Proj. WSET : 32573 Pgs moved >2GB>: 23.3/s VF overhead : ....% Reserved pgs : 0 Main > XSTORE : .0/s VF emulation: ....% Locked pages : 10 XSTORE > main : .0/s VF load rate: ..../s XSTORE dedic.: 0MB XSTORE > DASD : .0/s I/O rate : 9777/s XSTORE pages : 0 SPOOL pg reads : .0/s DASD IO rate: 9777/s DASD slots : 1 SPOOL pg writes: .0/s UR I/O rate : .0/s IUCV X-fer/s : .0/s MDC insert rate: .0/s Diag. X'98' : .0/s Share : 100 MDC I/O avoided: .0/s *BLOCKIO : .0/s Max. share : ... #I/O active : 0 Active : 91% PSW wait : 68% I/O act. : 3% Stacked blk : .. Page wait : 0% CF wait : 0% Eligible : 0% Stat.: ESA,P02,RNBL I/O wait : 0% Sim. wait: 0% Runnable : 31% Proc. %CPU %CP %EM %VECT %VOHD %VEMU VLD/S IO/S Status 01 61.4 24.3 37.1 ..,. ..,. ..,. ..,. 5100 ESA,P02,RNBL 02 58.5 21.4 37.1 ..,. ..,. ..,. ..,. 4676 ESA,P02,RNBL Data Space Name Size Mode PgRd/s PgWr/s XRd/s XWr/s Migr/s Steal/s BASE 128MB Priv .0 .0 .0 .0 .0 .0 Device activity and status: 0009 3215 .0 000C 254R CL *, EOF NOH NCNT 000D 254P CL A, CO 01, NOH NCNT 000E 1403 CL A, CO 01, NOH NCNT 0190 3390 .0 1510,RR, 107Cyl,--->0 0191 3390 .0 15D2,WR, 20Cyl,--->0 019D 3390 .0 1510,RR, 146Cyl,--->0 019E 3390 .0 1510,RR, 250Cyl,--->0 0201 3390 .0 150D,WR, 200Cyl,--->0 0202 3390 .0 150D,WR,3138Cyl,>1285 0203 3390 .0 1552,WR,3338Cyl,>2936 0300 VDSK 9780 ----,WR,430000B,RS/RL 0450 3390 .0 15D2,WR, 450Cyl,--->0 0592 3390 .0 1550,RR, 67Cyl,--->0 3000 OSA .0 QDIO->SW1 INT.MISS 3001 OSA .0 QDIO->SW1 SYSTEM 3002 OSA .0 QDIO->SW1 INT.MISS Enter 'STOrage Display' for storage details Command ===> F1=Help F4=Top F5=Bot F7=Bkwd F8=Fwd F12=Return
168 Linux on IBM Eserver zSeries and S/390: Performance Toolkit for VM
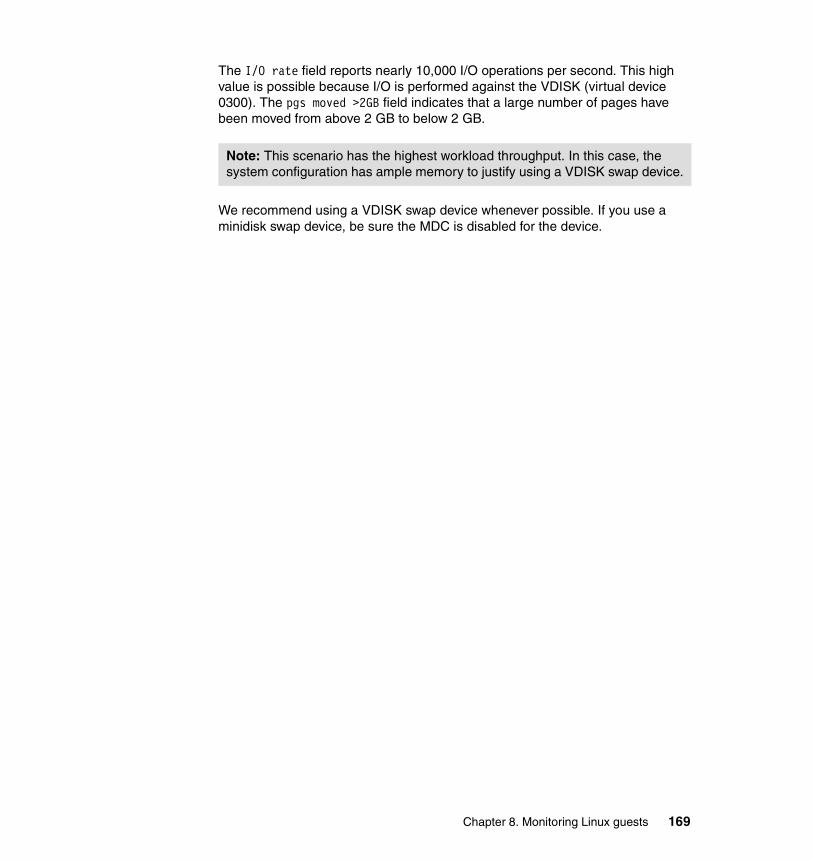
The I/O rate field reports nearly 10,000 I/O operations per second. This high value is possible because I/O is performed against the VDISK (virtual device 0300). The pgs moved >2GB field indicates that a large number of pages have been moved from above 2 GB to below 2 GB.
We recommend using a VDISK swap device whenever possible. If you use a minidisk swap device, be sure the MDC is disabled for the device.
Note: This scenario has the highest workload throughput. In this case, the system configuration has ample memory to justify using a VDISK swap device.
Chapter 8. Monitoring Linux guests 169
8.5 Analyzing processor utilizationTo evaluate processor utilization, use the CPU command shown in Figure 8-19.
Figure 8-19 CPU utilization screen
This report shows CPU load on each processor defined to the LPAR (two in this case). This example illustrates a CPU-intensive workload running on a Linux guest (LNXSU1). The User Extremes column lists major resource consumers (in this case, the LNXSU1 guest consumes 99.4% of the available processor resources). This can be useful for identifying some types of malfunctions, such as runaway processes or looping applications.
The USER command reports CPU utilization by a specific VM user.
FCX100 CPU 2084 SER 96A3A Interval 20:35:33 - 20:36:33 Perf. Monitor CPU Load Vector Facility Status or PROC %CPU %CP %EMU %WT %SYS %SP %SIC %LOGLD %VTOT %VEMU REST ded. User P00 100 0 100 0 0 0 12 100 not installed Master P01 100 0 100 0 0 0 10 100 not installed Alternate Total SSCH/RSCH 2/s Page rate .0/s Priv. instruct. 40/s Virtual I/O rate 3/s XSTORE paging .4/s Diagnose instr. 34/s Total rel. SHARE 300 Tot. abs SHARE 0% Queue Statistics: Q0 Q1 Q2 Q3 User Status: VMDBKs in queue 0 1 0 4 # of logged on users 26 VMDBKs loading 0 0 0 0 # of dialled users 0 Eligible VMDBKs 0 0 0 # of active users 15 El. VMDBKs loading 0 0 0 # of in-queue users 5 Tot. WS (pages) 0 29655 0 59111 % in-Q users in PGWAIT 0 Expansion factor 1 1 1 % in-Q users in IOWAIT 19 85% elapsed time 1.880 .235 1.880 11.28 % elig. (resource wait) 0 Transactions Q-Disp trivial non-trv User Extremes: Average users 42.4 .0 .5 Max. CPU % LNXSU1 99.4 Trans. per sec. .7 2.4 .5 Max. VECT % ........ ..... Av. time (sec) 63.69 .018 1.077 Max. IO/sec PERFKLA .9 UP trans. time .018 1.077 Max. PGS/s ........ ..... MP trans. time .000 .000 Max. RESPG LNXSU5 55855 System ITR (trans. per sec. tot. CPU) 1.8 Max. MDCIO ........ ..... Emul. ITR (trans. per sec. emul. CPU) .0 Max. XSTORE LNXSU4 7574
Note: In this example, z/VM uses two dedicated processors. This can be recognized by the reported 100% CPU utilization for each processor.
170 Linux on IBM Eserver zSeries and S/390: Performance Toolkit for VM
8.5.1 Processor utilization for a Linux guestTo inspect the processor consumption of a special Linux guest running under z/VM, use from the “Performance Screen Selection - 29. Linux systems*”. The screen mentioned belongs to the group “User Data”.
The Performance Toolkit for VM was developed in consideration of the mechanisms under which z/VM virtual machines operate. From the Linux perspective, tools such as top are not aware of z/VM underneath Linux, so they report CPU consumption as if the processors were completely owned by the Linux system
The difference is illustrated by running a workload on two Linux guests on z/VM. The CPU usage that is reported by z/VM for the Linux guests is approximately half as much as the usage reported by Linux. The z/VM system has two real CPUs; each guest can use both.
Chapter 8. Monitoring Linux guests 171
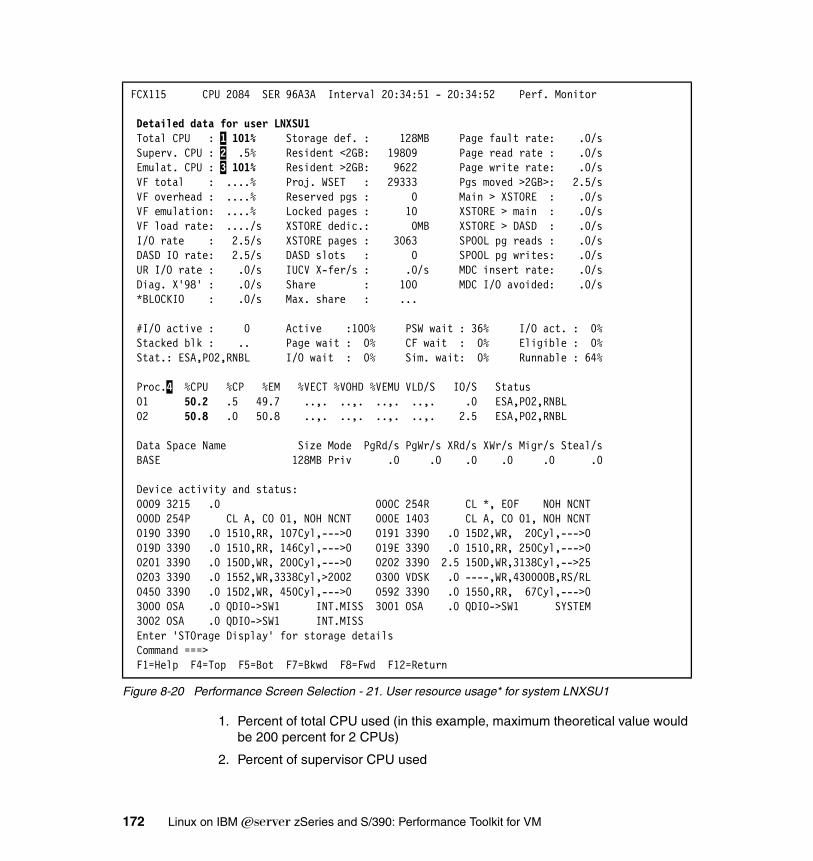
Figure 8-20 Performance Screen Selection - 21. User resource usage* for system LNXSU1
1. Percent of total CPU used (in this example, maximum theoretical value would be 200 percent for 2 CPUs)
2. Percent of supervisor CPU used
FCX115 CPU 2084 SER 96A3A Interval 20:34:51 - 20:34:52 Perf. Monitor Detailed data for user LNXSU1 Total CPU : 1 101% Storage def. : 128MB Page fault rate: .0/s Superv. CPU : 2 .5% Resident <2GB: 19809 Page read rate : .0/s Emulat. CPU : 3 101% Resident >2GB: 9622 Page write rate: .0/s VF total : ....% Proj. WSET : 29333 Pgs moved >2GB>: 2.5/s VF overhead : ....% Reserved pgs : 0 Main > XSTORE : .0/s VF emulation: ....% Locked pages : 10 XSTORE > main : .0/s VF load rate: ..../s XSTORE dedic.: 0MB XSTORE > DASD : .0/s I/O rate : 2.5/s XSTORE pages : 3063 SPOOL pg reads : .0/s DASD IO rate: 2.5/s DASD slots : 0 SPOOL pg writes: .0/s UR I/O rate : .0/s IUCV X-fer/s : .0/s MDC insert rate: .0/s Diag. X'98' : .0/s Share : 100 MDC I/O avoided: .0/s *BLOCKIO : .0/s Max. share : ... #I/O active : 0 Active :100% PSW wait : 36% I/O act. : 0% Stacked blk : .. Page wait : 0% CF wait : 0% Eligible : 0% Stat.: ESA,P02,RNBL I/O wait : 0% Sim. wait: 0% Runnable : 64% Proc.4 %CPU %CP %EM %VECT %VOHD %VEMU VLD/S IO/S Status 01 50.2 .5 49.7 ..,. ..,. ..,. ..,. .0 ESA,P02,RNBL 02 50.8 .0 50.8 ..,. ..,. ..,. ..,. 2.5 ESA,P02,RNBL Data Space Name Size Mode PgRd/s PgWr/s XRd/s XWr/s Migr/s Steal/s BASE 128MB Priv .0 .0 .0 .0 .0 .0 Device activity and status: 0009 3215 .0 000C 254R CL *, EOF NOH NCNT 000D 254P CL A, CO 01, NOH NCNT 000E 1403 CL A, CO 01, NOH NCNT 0190 3390 .0 1510,RR, 107Cyl,--->0 0191 3390 .0 15D2,WR, 20Cyl,--->0 019D 3390 .0 1510,RR, 146Cyl,--->0 019E 3390 .0 1510,RR, 250Cyl,--->0 0201 3390 .0 150D,WR, 200Cyl,--->0 0202 3390 2.5 150D,WR,3138Cyl,-->25 0203 3390 .0 1552,WR,3338Cyl,>2002 0300 VDSK .0 ----,WR,430000B,RS/RL 0450 3390 .0 15D2,WR, 450Cyl,--->0 0592 3390 .0 1550,RR, 67Cyl,--->0 3000 OSA .0 QDIO->SW1 INT.MISS 3001 OSA .0 QDIO->SW1 SYSTEM 3002 OSA .0 QDIO->SW1 INT.MISS Enter 'STOrage Display' for storage details Command ===> F1=Help F4=Top F5=Bot F7=Bkwd F8=Fwd F12=Return
172 Linux on IBM Eserver zSeries and S/390: Performance Toolkit for VM
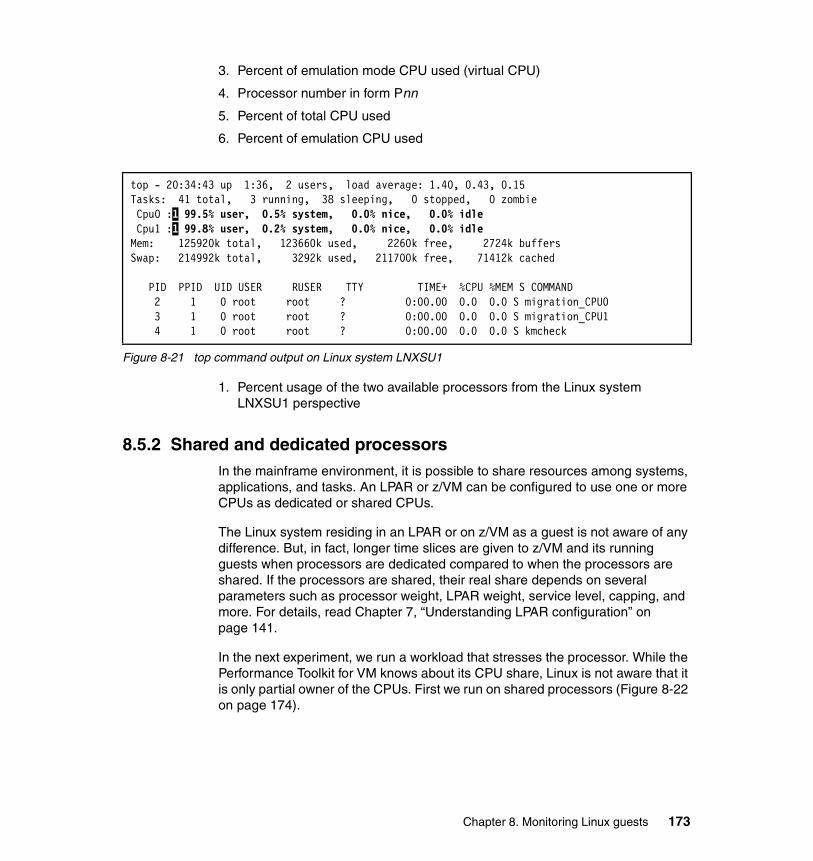
3. Percent of emulation mode CPU used (virtual CPU)
4. Processor number in form Pnn
5. Percent of total CPU used
6. Percent of emulation CPU used
Figure 8-21 top command output on Linux system LNXSU1
1. Percent usage of the two available processors from the Linux system LNXSU1 perspective
8.5.2 Shared and dedicated processorsIn the mainframe environment, it is possible to share resources among systems, applications, and tasks. An LPAR or z/VM can be configured to use one or more CPUs as dedicated or shared CPUs.
The Linux system residing in an LPAR or on z/VM as a guest is not aware of any difference. But, in fact, longer time slices are given to z/VM and its running guests when processors are dedicated compared to when the processors are shared. If the processors are shared, their real share depends on several parameters such as processor weight, LPAR weight, service level, capping, and more. For details, read Chapter 7, “Understanding LPAR configuration” on page 141.
In the next experiment, we run a workload that stresses the processor. While the Performance Toolkit for VM knows about its CPU share, Linux is not aware that it is only partial owner of the CPUs. First we run on shared processors (Figure 8-22 on page 174).
top - 20:34:43 up 1:36, 2 users, load average: 1.40, 0.43, 0.15Tasks: 41 total, 3 running, 38 sleeping, 0 stopped, 0 zombie Cpu0 :1 99.5% user, 0.5% system, 0.0% nice, 0.0% idle Cpu1 :1 99.8% user, 0.2% system, 0.0% nice, 0.0% idleMem: 125920k total, 123660k used, 2260k free, 2724k buffersSwap: 214992k total, 3292k used, 211700k free, 71412k cached
PID PPID UID USER RUSER TTY TIME+ %CPU %MEM S COMMAND 2 1 0 root root ? 0:00.00 0.0 0.0 S migration_CPU0 3 1 0 root root ? 0:00.00 0.0 0.0 S migration_CPU1 4 1 0 root root ? 0:00.00 0.0 0.0 S kmcheck
Chapter 8. Monitoring Linux guests 173
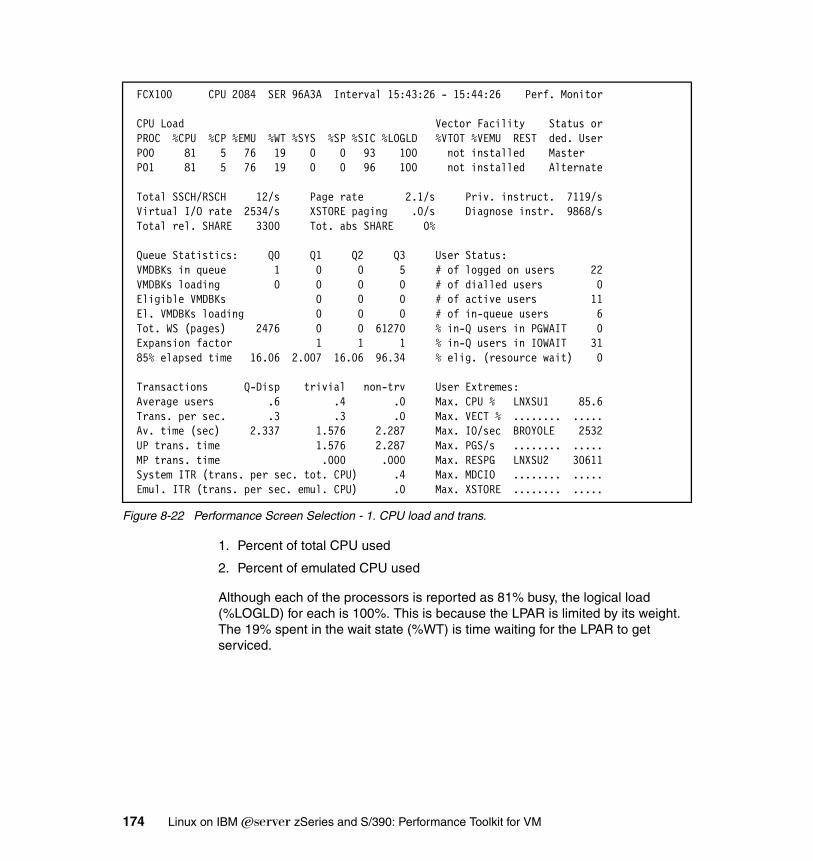
Figure 8-22 Performance Screen Selection - 1. CPU load and trans.
1. Percent of total CPU used
2. Percent of emulated CPU used
Although each of the processors is reported as 81% busy, the logical load (%LOGLD) for each is 100%. This is because the LPAR is limited by its weight. The 19% spent in the wait state (%WT) is time waiting for the LPAR to get serviced.
FCX100 CPU 2084 SER 96A3A Interval 15:43:26 - 15:44:26 Perf. Monitor CPU Load Vector Facility Status or PROC %CPU %CP %EMU %WT %SYS %SP %SIC %LOGLD %VTOT %VEMU REST ded. User P00 81 5 76 19 0 0 93 100 not installed Master P01 81 5 76 19 0 0 96 100 not installed Alternate Total SSCH/RSCH 12/s Page rate 2.1/s Priv. instruct. 7119/s Virtual I/O rate 2534/s XSTORE paging .0/s Diagnose instr. 9868/s Total rel. SHARE 3300 Tot. abs SHARE 0% Queue Statistics: Q0 Q1 Q2 Q3 User Status: VMDBKs in queue 1 0 0 5 # of logged on users 22 VMDBKs loading 0 0 0 0 # of dialled users 0 Eligible VMDBKs 0 0 0 # of active users 11 El. VMDBKs loading 0 0 0 # of in-queue users 6 Tot. WS (pages) 2476 0 0 61270 % in-Q users in PGWAIT 0 Expansion factor 1 1 1 % in-Q users in IOWAIT 31 85% elapsed time 16.06 2.007 16.06 96.34 % elig. (resource wait) 0 Transactions Q-Disp trivial non-trv User Extremes: Average users .6 .4 .0 Max. CPU % LNXSU1 85.6 Trans. per sec. .3 .3 .0 Max. VECT % ........ ..... Av. time (sec) 2.337 1.576 2.287 Max. IO/sec BROYOLE 2532 UP trans. time 1.576 2.287 Max. PGS/s ........ ..... MP trans. time .000 .000 Max. RESPG LNXSU2 30611 System ITR (trans. per sec. tot. CPU) .4 Max. MDCIO ........ ..... Emul. ITR (trans. per sec. emul. CPU) .0 Max. XSTORE ........ .....
174 Linux on IBM Eserver zSeries and S/390: Performance Toolkit for VM
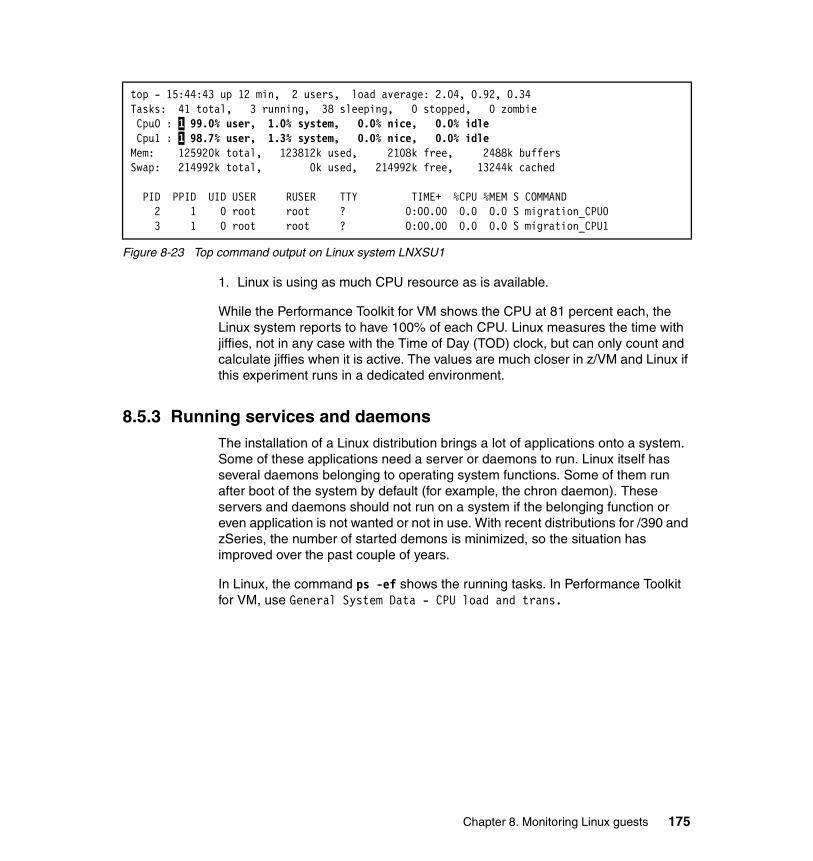
Figure 8-23 Top command output on Linux system LNXSU1
1. Linux is using as much CPU resource as is available.
While the Performance Toolkit for VM shows the CPU at 81 percent each, the Linux system reports to have 100% of each CPU. Linux measures the time with jiffies, not in any case with the Time of Day (TOD) clock, but can only count and calculate jiffies when it is active. The values are much closer in z/VM and Linux if this experiment runs in a dedicated environment.
8.5.3 Running services and daemonsThe installation of a Linux distribution brings a lot of applications onto a system. Some of these applications need a server or daemons to run. Linux itself has several daemons belonging to operating system functions. Some of them run after boot of the system by default (for example, the chron daemon). These servers and daemons should not run on a system if the belonging function or even application is not wanted or not in use. With recent distributions for /390 and zSeries, the number of started demons is minimized, so the situation has improved over the past couple of years.
In Linux, the command ps -ef shows the running tasks. In Performance Toolkit for VM, use General System Data - CPU load and trans.
top - 15:44:43 up 12 min, 2 users, load average: 2.04, 0.92, 0.34Tasks: 41 total, 3 running, 38 sleeping, 0 stopped, 0 zombie Cpu0 : 1 99.0% user, 1.0% system, 0.0% nice, 0.0% idle Cpu1 : 1 98.7% user, 1.3% system, 0.0% nice, 0.0% idleMem: 125920k total, 123812k used, 2108k free, 2488k buffersSwap: 214992k total, 0k used, 214992k free, 13244k cached
PID PPID UID USER RUSER TTY TIME+ %CPU %MEM S COMMAND 2 1 0 root root ? 0:00.00 0.0 0.0 S migration_CPU0 3 1 0 root root ? 0:00.00 0.0 0.0 S migration_CPU1
Chapter 8. Monitoring Linux guests 175

176 Linux on IBM Eserver zSeries and S/390: Performance Toolkit for VM
Chapter 9. RTM and PRF functions in Performance Toolkit for VM
This chapter provides an introduction to the Real Time Monitor (RTM) and Performance Reporting Facility (PRF) functions that available in Performance Toolkit for VM. In general, Performance Toolkit for VM covers most of the functions and reports that are available with RTM and PRF, plus a lot more. However, certain features are just not applicable. This chapter attempts to map RTM and PRF functions to their Performance Toolkit for VM equivalent. We discuss:
� Equivalent RTM functions
� The RTM general display
� The RTM SLOG display
� The RTM environment display
� The RTM user display
� The RTM idle user display
� The RTM I/O display
� Using the Virtual Machine Communication Facility
� Creating scheduled printed reports
� VMPRF functions
9
© Copyright IBM Corp. 2004. All rights reserved. 177
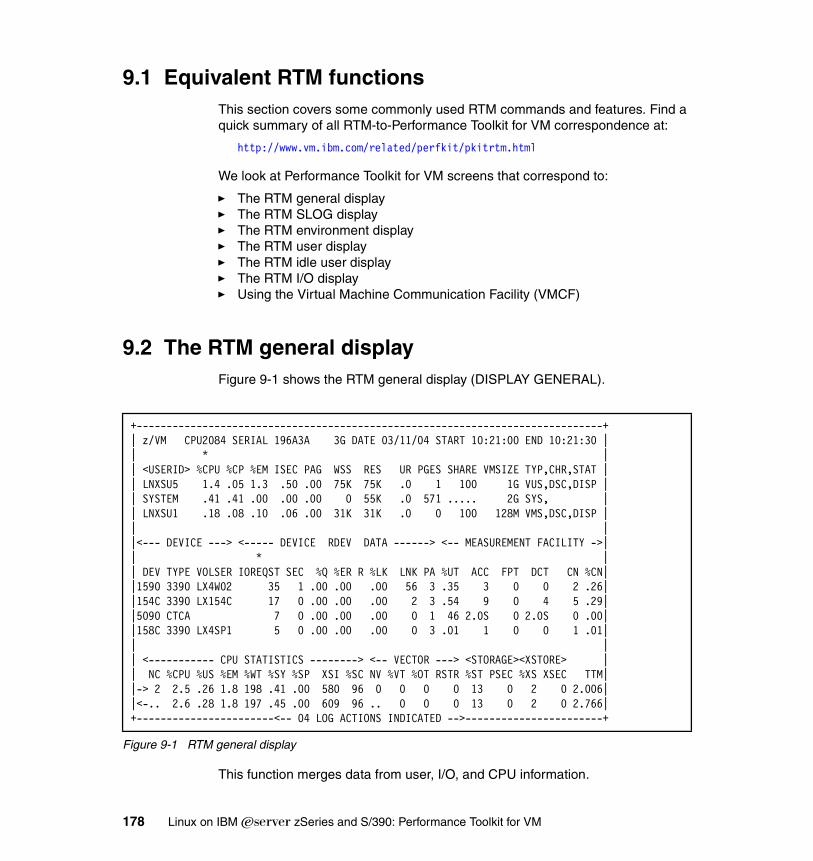
9.1 Equivalent RTM functionsThis section covers some commonly used RTM commands and features. Find a quick summary of all RTM-to-Performance Toolkit for VM correspondence at:
http://www.vm.ibm.com/related/perfkit/pkitrtm.html
We look at Performance Toolkit for VM screens that correspond to:
� The RTM general display� The RTM SLOG display� The RTM environment display� The RTM user display� The RTM idle user display� The RTM I/O display� Using the Virtual Machine Communication Facility (VMCF)
9.2 The RTM general displayFigure 9-1 shows the RTM general display (DISPLAY GENERAL).
Figure 9-1 RTM general display
This function merges data from user, I/O, and CPU information.
+------------------------------------------------------------------------------+| z/VM CPU2084 SERIAL 196A3A 3G DATE 03/11/04 START 10:21:00 END 10:21:30 || * || <USERID> %CPU %CP %EM ISEC PAG WSS RES UR PGES SHARE VMSIZE TYP,CHR,STAT || LNXSU5 1.4 .05 1.3 .50 .00 75K 75K .0 1 100 1G VUS,DSC,DISP || SYSTEM .41 .41 .00 .00 .00 0 55K .0 571 ..... 2G SYS, || LNXSU1 .18 .08 .10 .06 .00 31K 31K .0 0 100 128M VMS,DSC,DISP || ||<--- DEVICE ---> <----- DEVICE RDEV DATA ------> <-- MEASUREMENT FACILITY ->|| * || DEV TYPE VOLSER IOREQST SEC %Q %ER R %LK LNK PA %UT ACC FPT DCT CN %CN||1590 3390 LX4W02 35 1 .00 .00 .00 56 3 .35 3 0 0 2 .26||154C 3390 LX154C 17 0 .00 .00 .00 2 3 .54 9 0 4 5 .29||5090 CTCA 7 0 .00 .00 .00 0 1 46 2.0S 0 2.0S 0 .00||158C 3390 LX4SP1 5 0 .00 .00 .00 0 3 .01 1 0 0 1 .01|| || <----------- CPU STATISTICS --------> <-- VECTOR ---> <STORAGE><XSTORE> || NC %CPU %US %EM %WT %SY %SP XSI %SC NV %VT %OT RSTR %ST PSEC %XS XSEC TTM||-> 2 2.5 .26 1.8 198 .41 .00 580 96 0 0 0 0 13 0 2 0 2.006||<-.. 2.6 .28 1.8 197 .45 .00 609 96 .. 0 0 0 13 0 2 0 2.766|+-----------------------<-- 04 LOG ACTIONS INDICATED -->-----------------------+
178 Linux on IBM Eserver zSeries and S/390: Performance Toolkit for VM
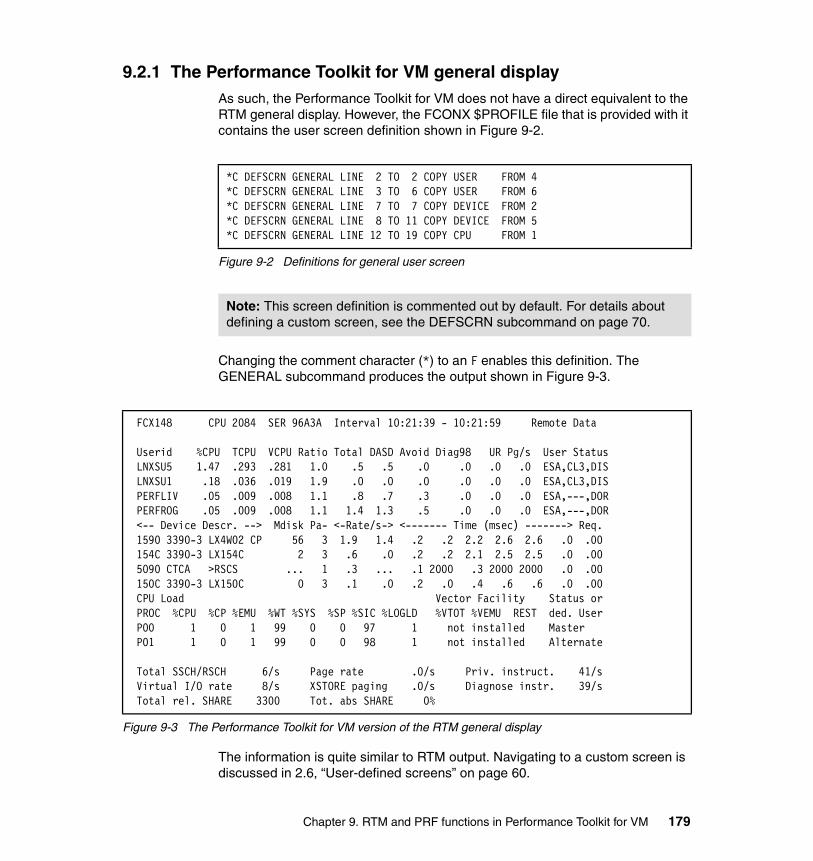
9.2.1 The Performance Toolkit for VM general displayAs such, the Performance Toolkit for VM does not have a direct equivalent to the RTM general display. However, the FCONX $PROFILE file that is provided with it contains the user screen definition shown in Figure 9-2.
Figure 9-2 Definitions for general user screen
Changing the comment character (*) to an F enables this definition. The GENERAL subcommand produces the output shown in Figure 9-3.
Figure 9-3 The Performance Toolkit for VM version of the RTM general display
The information is quite similar to RTM output. Navigating to a custom screen is discussed in 2.6, “User-defined screens” on page 60.
*C DEFSCRN GENERAL LINE 2 TO 2 COPY USER FROM 4*C DEFSCRN GENERAL LINE 3 TO 6 COPY USER FROM 6*C DEFSCRN GENERAL LINE 7 TO 7 COPY DEVICE FROM 2*C DEFSCRN GENERAL LINE 8 TO 11 COPY DEVICE FROM 5*C DEFSCRN GENERAL LINE 12 TO 19 COPY CPU FROM 1
Note: This screen definition is commented out by default. For details about defining a custom screen, see the DEFSCRN subcommand on page 70.
FCX148 CPU 2084 SER 96A3A Interval 10:21:39 - 10:21:59 Remote Data Userid %CPU TCPU VCPU Ratio Total DASD Avoid Diag98 UR Pg/s User Status LNXSU5 1.47 .293 .281 1.0 .5 .5 .0 .0 .0 .0 ESA,CL3,DIS LNXSU1 .18 .036 .019 1.9 .0 .0 .0 .0 .0 .0 ESA,CL3,DIS PERFLIV .05 .009 .008 1.1 .8 .7 .3 .0 .0 .0 ESA,---,DOR PERFROG .05 .009 .008 1.1 1.4 1.3 .5 .0 .0 .0 ESA,---,DOR <-- Device Descr. --> Mdisk Pa- <-Rate/s-> <------- Time (msec) -------> Req. 1590 3390-3 LX4W02 CP 56 3 1.9 1.4 .2 .2 2.2 2.6 2.6 .0 .00 154C 3390-3 LX154C 2 3 .6 .0 .2 .2 2.1 2.5 2.5 .0 .00 5090 CTCA >RSCS ... 1 .3 ... .1 2000 .3 2000 2000 .0 .00 150C 3390-3 LX150C 0 3 .1 .0 .2 .0 .4 .6 .6 .0 .00 CPU Load Vector Facility Status or PROC %CPU %CP %EMU %WT %SYS %SP %SIC %LOGLD %VTOT %VEMU REST ded. User P00 1 0 1 99 0 0 97 1 not installed Master P01 1 0 1 99 0 0 98 1 not installed Alternate Total SSCH/RSCH 6/s Page rate .0/s Priv. instruct. 41/s Virtual I/O rate 8/s XSTORE paging .0/s Diagnose instr. 39/s Total rel. SHARE 3300 Tot. abs SHARE 0%
Chapter 9. RTM and PRF functions in Performance Toolkit for VM 179
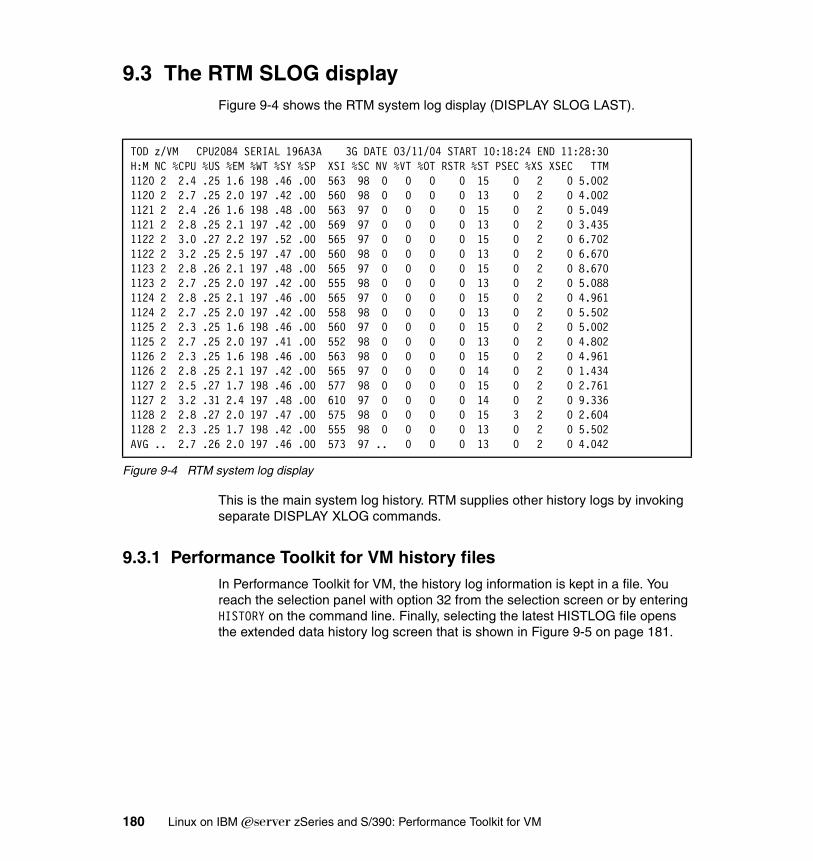
9.3 The RTM SLOG displayFigure 9-4 shows the RTM system log display (DISPLAY SLOG LAST).
Figure 9-4 RTM system log display
This is the main system log history. RTM supplies other history logs by invoking separate DISPLAY XLOG commands.
9.3.1 Performance Toolkit for VM history filesIn Performance Toolkit for VM, the history log information is kept in a file. You reach the selection panel with option 32 from the selection screen or by entering HISTORY on the command line. Finally, selecting the latest HISTLOG file opens the extended data history log screen that is shown in Figure 9-5 on page 181.
TOD z/VM CPU2084 SERIAL 196A3A 3G DATE 03/11/04 START 10:18:24 END 11:28:30H:M NC %CPU %US %EM %WT %SY %SP XSI %SC NV %VT %OT RSTR %ST PSEC %XS XSEC TTM1120 2 2.4 .25 1.6 198 .46 .00 563 98 0 0 0 0 15 0 2 0 5.0021120 2 2.7 .25 2.0 197 .42 .00 560 98 0 0 0 0 13 0 2 0 4.0021121 2 2.4 .26 1.6 198 .48 .00 563 97 0 0 0 0 15 0 2 0 5.0491121 2 2.8 .25 2.1 197 .42 .00 569 97 0 0 0 0 13 0 2 0 3.4351122 2 3.0 .27 2.2 197 .52 .00 565 97 0 0 0 0 15 0 2 0 6.7021122 2 3.2 .25 2.5 197 .47 .00 560 98 0 0 0 0 13 0 2 0 6.6701123 2 2.8 .26 2.1 197 .48 .00 565 97 0 0 0 0 15 0 2 0 8.6701123 2 2.7 .25 2.0 197 .42 .00 555 98 0 0 0 0 13 0 2 0 5.0881124 2 2.8 .25 2.1 197 .46 .00 565 97 0 0 0 0 15 0 2 0 4.9611124 2 2.7 .25 2.0 197 .42 .00 558 98 0 0 0 0 13 0 2 0 5.5021125 2 2.3 .25 1.6 198 .46 .00 560 97 0 0 0 0 15 0 2 0 5.0021125 2 2.7 .25 2.0 197 .41 .00 552 98 0 0 0 0 13 0 2 0 4.8021126 2 2.3 .25 1.6 198 .46 .00 563 98 0 0 0 0 15 0 2 0 4.9611126 2 2.8 .25 2.1 197 .42 .00 565 97 0 0 0 0 14 0 2 0 1.4341127 2 2.5 .27 1.7 198 .46 .00 577 98 0 0 0 0 15 0 2 0 2.7611127 2 3.2 .31 2.4 197 .48 .00 610 97 0 0 0 0 14 0 2 0 9.3361128 2 2.8 .27 2.0 197 .47 .00 575 98 0 0 0 0 15 3 2 0 2.6041128 2 2.3 .25 1.7 198 .42 .00 555 98 0 0 0 0 13 0 2 0 5.502AVG .. 2.7 .26 2.0 197 .46 .00 573 97 .. 0 0 0 13 0 2 0 4.042
180 Linux on IBM Eserver zSeries and S/390: Performance Toolkit for VM
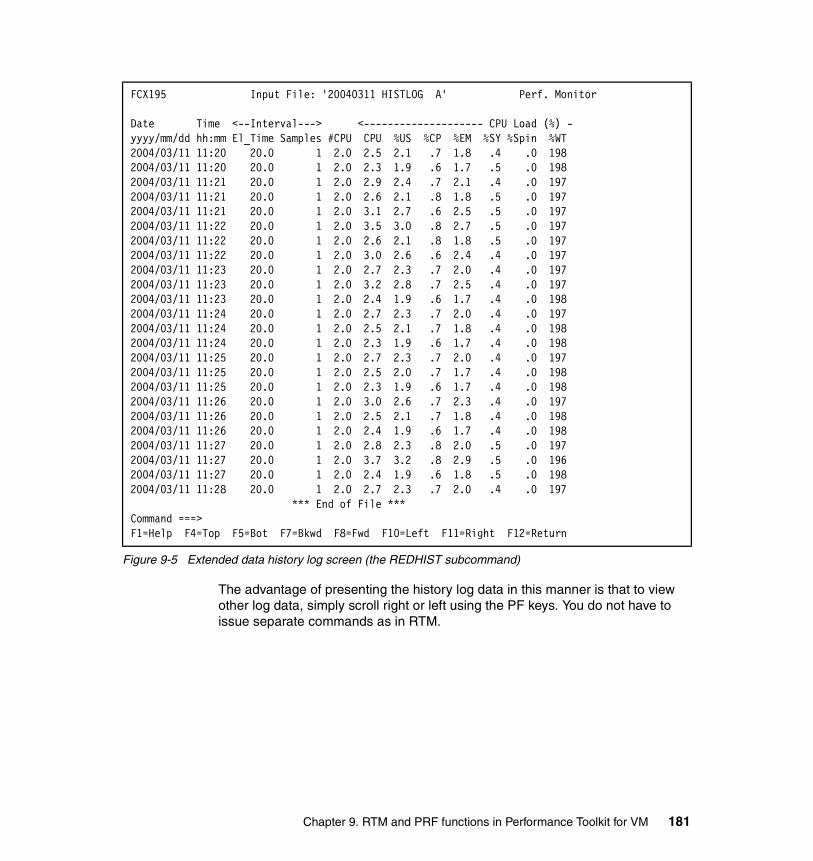
Figure 9-5 Extended data history log screen (the REDHIST subcommand)
The advantage of presenting the history log data in this manner is that to view other log data, simply scroll right or left using the PF keys. You do not have to issue separate commands as in RTM.
FCX195 Input File: '20040311 HISTLOG A' Perf. Monitor Date Time <--Interval---> <-------------------- CPU Load (%) - yyyy/mm/dd hh:mm El_Time Samples #CPU CPU %US %CP %EM %SY %Spin %WT 2004/03/11 11:20 20.0 1 2.0 2.5 2.1 .7 1.8 .4 .0 198 2004/03/11 11:20 20.0 1 2.0 2.3 1.9 .6 1.7 .5 .0 198 2004/03/11 11:21 20.0 1 2.0 2.9 2.4 .7 2.1 .4 .0 197 2004/03/11 11:21 20.0 1 2.0 2.6 2.1 .8 1.8 .5 .0 197 2004/03/11 11:21 20.0 1 2.0 3.1 2.7 .6 2.5 .5 .0 197 2004/03/11 11:22 20.0 1 2.0 3.5 3.0 .8 2.7 .5 .0 197 2004/03/11 11:22 20.0 1 2.0 2.6 2.1 .8 1.8 .5 .0 197 2004/03/11 11:22 20.0 1 2.0 3.0 2.6 .6 2.4 .4 .0 197 2004/03/11 11:23 20.0 1 2.0 2.7 2.3 .7 2.0 .4 .0 197 2004/03/11 11:23 20.0 1 2.0 3.2 2.8 .7 2.5 .4 .0 197 2004/03/11 11:23 20.0 1 2.0 2.4 1.9 .6 1.7 .4 .0 198 2004/03/11 11:24 20.0 1 2.0 2.7 2.3 .7 2.0 .4 .0 197 2004/03/11 11:24 20.0 1 2.0 2.5 2.1 .7 1.8 .4 .0 198 2004/03/11 11:24 20.0 1 2.0 2.3 1.9 .6 1.7 .4 .0 198 2004/03/11 11:25 20.0 1 2.0 2.7 2.3 .7 2.0 .4 .0 197 2004/03/11 11:25 20.0 1 2.0 2.5 2.0 .7 1.7 .4 .0 198 2004/03/11 11:25 20.0 1 2.0 2.3 1.9 .6 1.7 .4 .0 198 2004/03/11 11:26 20.0 1 2.0 3.0 2.6 .7 2.3 .4 .0 197 2004/03/11 11:26 20.0 1 2.0 2.5 2.1 .7 1.8 .4 .0 198 2004/03/11 11:26 20.0 1 2.0 2.4 1.9 .6 1.7 .4 .0 198 2004/03/11 11:27 20.0 1 2.0 2.8 2.3 .8 2.0 .5 .0 197 2004/03/11 11:27 20.0 1 2.0 3.7 3.2 .8 2.9 .5 .0 196 2004/03/11 11:27 20.0 1 2.0 2.4 1.9 .6 1.8 .5 .0 198 2004/03/11 11:28 20.0 1 2.0 2.7 2.3 .7 2.0 .4 .0 197 *** End of File *** Command ===> F1=Help F4=Top F5=Bot F7=Bkwd F8=Fwd F10=Left F11=Right F12=Return
Chapter 9. RTM and PRF functions in Performance Toolkit for VM 181
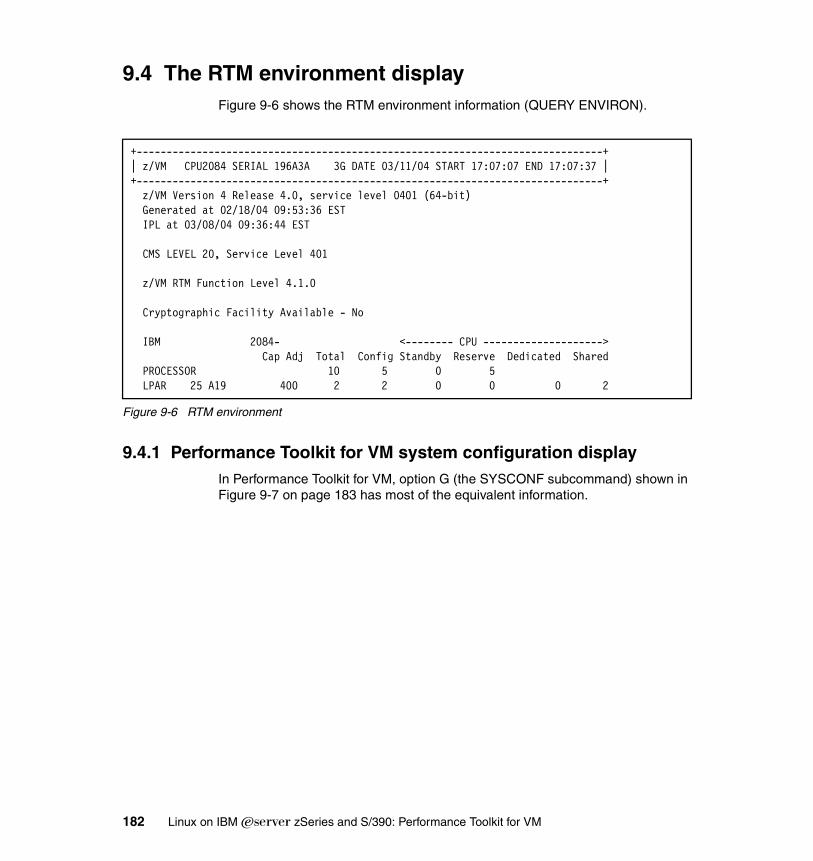
9.4 The RTM environment displayFigure 9-6 shows the RTM environment information (QUERY ENVIRON).
Figure 9-6 RTM environment
9.4.1 Performance Toolkit for VM system configuration displayIn Performance Toolkit for VM, option G (the SYSCONF subcommand) shown in Figure 9-7 on page 183 has most of the equivalent information.
+------------------------------------------------------------------------------+| z/VM CPU2084 SERIAL 196A3A 3G DATE 03/11/04 START 17:07:07 END 17:07:37 |+------------------------------------------------------------------------------+ z/VM Version 4 Release 4.0, service level 0401 (64-bit) Generated at 02/18/04 09:53:36 EST IPL at 03/08/04 09:36:44 EST CMS LEVEL 20, Service Level 401 z/VM RTM Function Level 4.1.0 Cryptographic Facility Available - No IBM 2084- <-------- CPU --------------------> Cap Adj Total Config Standby Reserve Dedicated Shared PROCESSOR 10 5 0 5 LPAR 25 A19 400 2 2 0 0 0 2
182 Linux on IBM Eserver zSeries and S/390: Performance Toolkit for VM
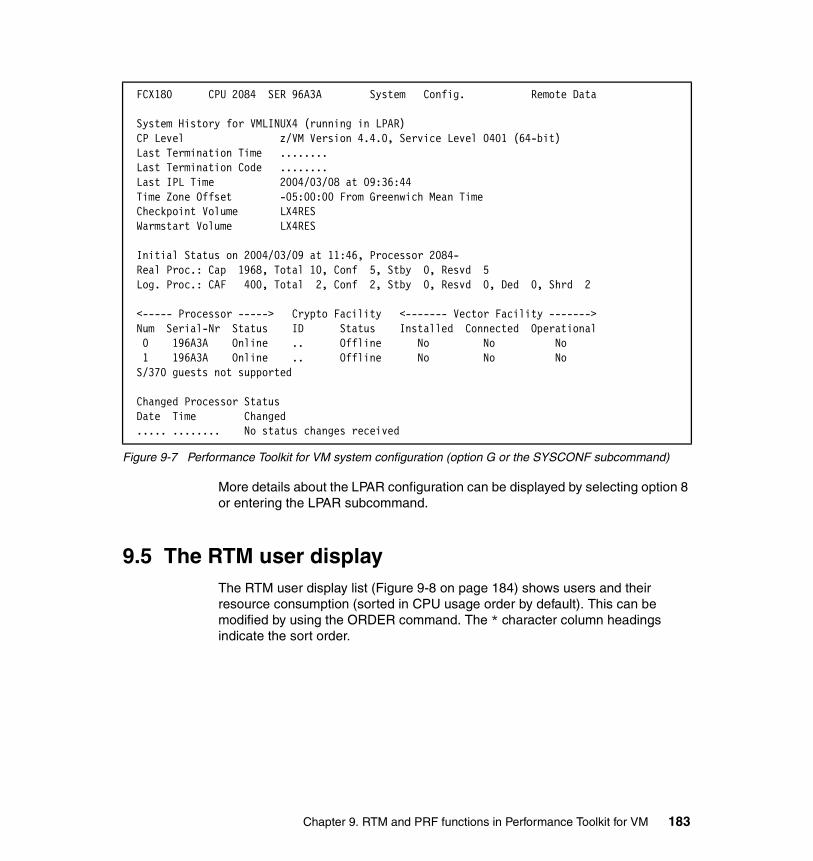
Figure 9-7 Performance Toolkit for VM system configuration (option G or the SYSCONF subcommand)
More details about the LPAR configuration can be displayed by selecting option 8 or entering the LPAR subcommand.
9.5 The RTM user displayThe RTM user display list (Figure 9-8 on page 184) shows users and their resource consumption (sorted in CPU usage order by default). This can be modified by using the ORDER command. The * character column headings indicate the sort order.
FCX180 CPU 2084 SER 96A3A System Config. Remote Data System History for VMLINUX4 (running in LPAR) CP Level z/VM Version 4.4.0, Service Level 0401 (64-bit) Last Termination Time ........ Last Termination Code ........ Last IPL Time 2004/03/08 at 09:36:44 Time Zone Offset -05:00:00 From Greenwich Mean Time Checkpoint Volume LX4RES Warmstart Volume LX4RES Initial Status on 2004/03/09 at 11:46, Processor 2084- Real Proc.: Cap 1968, Total 10, Conf 5, Stby 0, Resvd 5 Log. Proc.: CAF 400, Total 2, Conf 2, Stby 0, Resvd 0, Ded 0, Shrd 2 <----- Processor -----> Crypto Facility <------- Vector Facility -------> Num Serial-Nr Status ID Status Installed Connected Operational 0 196A3A Online .. Offline No No No 1 196A3A Online .. Offline No No No S/370 guests not supported Changed Processor Status Date Time Changed ..... ........ No status changes received
Chapter 9. RTM and PRF functions in Performance Toolkit for VM 183
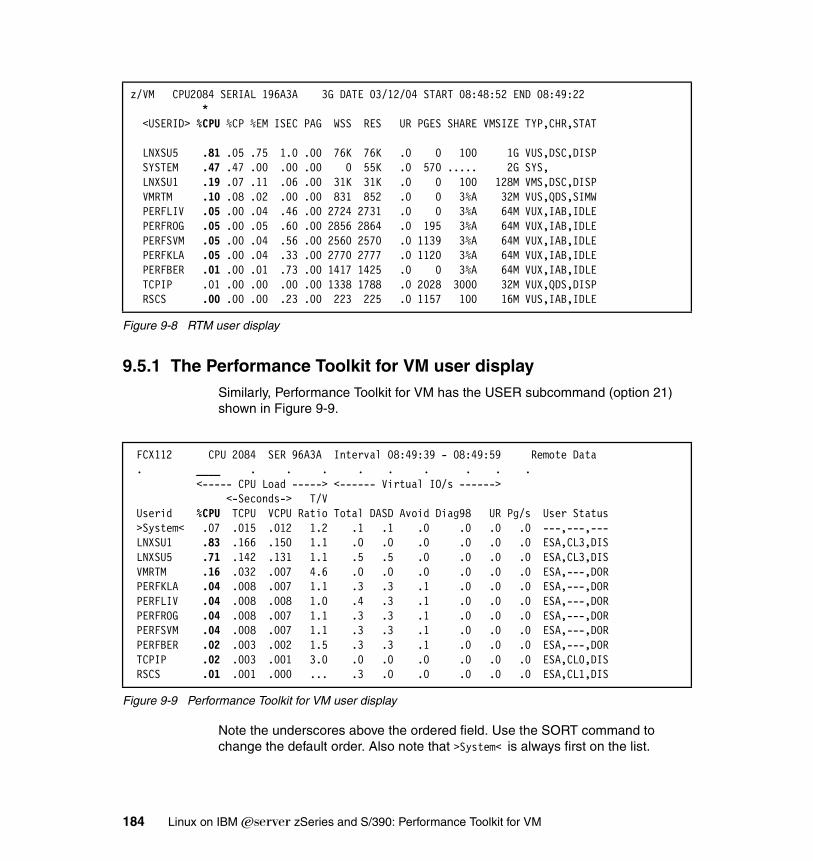
Figure 9-8 RTM user display
9.5.1 The Performance Toolkit for VM user displaySimilarly, Performance Toolkit for VM has the USER subcommand (option 21) shown in Figure 9-9.
Figure 9-9 Performance Toolkit for VM user display
Note the underscores above the ordered field. Use the SORT command to change the default order. Also note that >System< is always first on the list.
z/VM CPU2084 SERIAL 196A3A 3G DATE 03/12/04 START 08:48:52 END 08:49:22 * <USERID> %CPU %CP %EM ISEC PAG WSS RES UR PGES SHARE VMSIZE TYP,CHR,STAT LNXSU5 .81 .05 .75 1.0 .00 76K 76K .0 0 100 1G VUS,DSC,DISP SYSTEM .47 .47 .00 .00 .00 0 55K .0 570 ..... 2G SYS, LNXSU1 .19 .07 .11 .06 .00 31K 31K .0 0 100 128M VMS,DSC,DISP VMRTM .10 .08 .02 .00 .00 831 852 .0 0 3%A 32M VUS,QDS,SIMW PERFLIV .05 .00 .04 .46 .00 2724 2731 .0 0 3%A 64M VUX,IAB,IDLE PERFROG .05 .00 .05 .60 .00 2856 2864 .0 195 3%A 64M VUX,IAB,IDLE PERFSVM .05 .00 .04 .56 .00 2560 2570 .0 1139 3%A 64M VUX,IAB,IDLE PERFKLA .05 .00 .04 .33 .00 2770 2777 .0 1120 3%A 64M VUX,IAB,IDLE PERFBER .01 .00 .01 .73 .00 1417 1425 .0 0 3%A 64M VUX,IAB,IDLE TCPIP .01 .00 .00 .00 .00 1338 1788 .0 2028 3000 32M VUX,QDS,DISP RSCS .00 .00 .00 .23 .00 223 225 .0 1157 100 16M VUS,IAB,IDLE
FCX112 CPU 2084 SER 96A3A Interval 08:49:39 - 08:49:59 Remote Data . ____ . . . . . . . . . <----- CPU Load -----> <------ Virtual IO/s ------> <-Seconds-> T/V Userid %CPU TCPU VCPU Ratio Total DASD Avoid Diag98 UR Pg/s User Status >System< .07 .015 .012 1.2 .1 .1 .0 .0 .0 .0 ---,---,--- LNXSU1 .83 .166 .150 1.1 .0 .0 .0 .0 .0 .0 ESA,CL3,DIS LNXSU5 .71 .142 .131 1.1 .5 .5 .0 .0 .0 .0 ESA,CL3,DIS VMRTM .16 .032 .007 4.6 .0 .0 .0 .0 .0 .0 ESA,---,DOR PERFKLA .04 .008 .007 1.1 .3 .3 .1 .0 .0 .0 ESA,---,DOR PERFLIV .04 .008 .008 1.0 .4 .3 .1 .0 .0 .0 ESA,---,DOR PERFROG .04 .008 .007 1.1 .3 .3 .1 .0 .0 .0 ESA,---,DOR PERFSVM .04 .008 .007 1.1 .3 .3 .1 .0 .0 .0 ESA,---,DOR PERFBER .02 .003 .002 1.5 .3 .3 .1 .0 .0 .0 ESA,---,DOR TCPIP .02 .003 .001 3.0 .0 .0 .0 .0 .0 .0 ESA,CL0,DIS RSCS .01 .001 .000 ... .3 .0 .0 .0 .0 .0 ESA,CL1,DIS
184 Linux on IBM Eserver zSeries and S/390: Performance Toolkit for VM
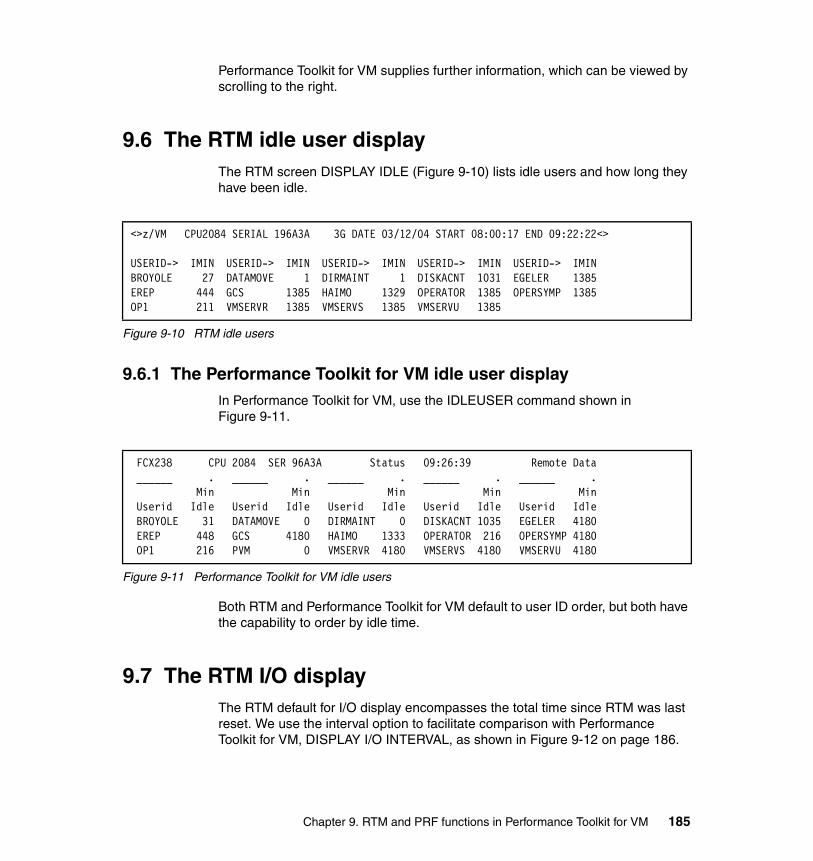
Performance Toolkit for VM supplies further information, which can be viewed by scrolling to the right.
9.6 The RTM idle user displayThe RTM screen DISPLAY IDLE (Figure 9-10) lists idle users and how long they have been idle.
Figure 9-10 RTM idle users
9.6.1 The Performance Toolkit for VM idle user displayIn Performance Toolkit for VM, use the IDLEUSER command shown in Figure 9-11.
Figure 9-11 Performance Toolkit for VM idle users
Both RTM and Performance Toolkit for VM default to user ID order, but both have the capability to order by idle time.
9.7 The RTM I/O displayThe RTM default for I/O display encompasses the total time since RTM was last reset. We use the interval option to facilitate comparison with Performance Toolkit for VM, DISPLAY I/O INTERVAL, as shown in Figure 9-12 on page 186.
<>z/VM CPU2084 SERIAL 196A3A 3G DATE 03/12/04 START 08:00:17 END 09:22:22<> USERID-> IMIN USERID-> IMIN USERID-> IMIN USERID-> IMIN USERID-> IMIN BROYOLE 27 DATAMOVE 1 DIRMAINT 1 DISKACNT 1031 EGELER 1385 EREP 444 GCS 1385 HAIMO 1329 OPERATOR 1385 OPERSYMP 1385 OP1 211 VMSERVR 1385 VMSERVS 1385 VMSERVU 1385
FCX238 CPU 2084 SER 96A3A Status 09:26:39 Remote Data ______ . ______ . ______ . ______ . ______ . Min Min Min Min Min Userid Idle Userid Idle Userid Idle Userid Idle Userid Idle BROYOLE 31 DATAMOVE 0 DIRMAINT 0 DISKACNT 1035 EGELER 4180 EREP 448 GCS 4180 HAIMO 1333 OPERATOR 216 OPERSYMP 4180 OP1 216 PVM 0 VMSERVR 4180 VMSERVS 4180 VMSERVU 4180
Chapter 9. RTM and PRF functions in Performance Toolkit for VM 185
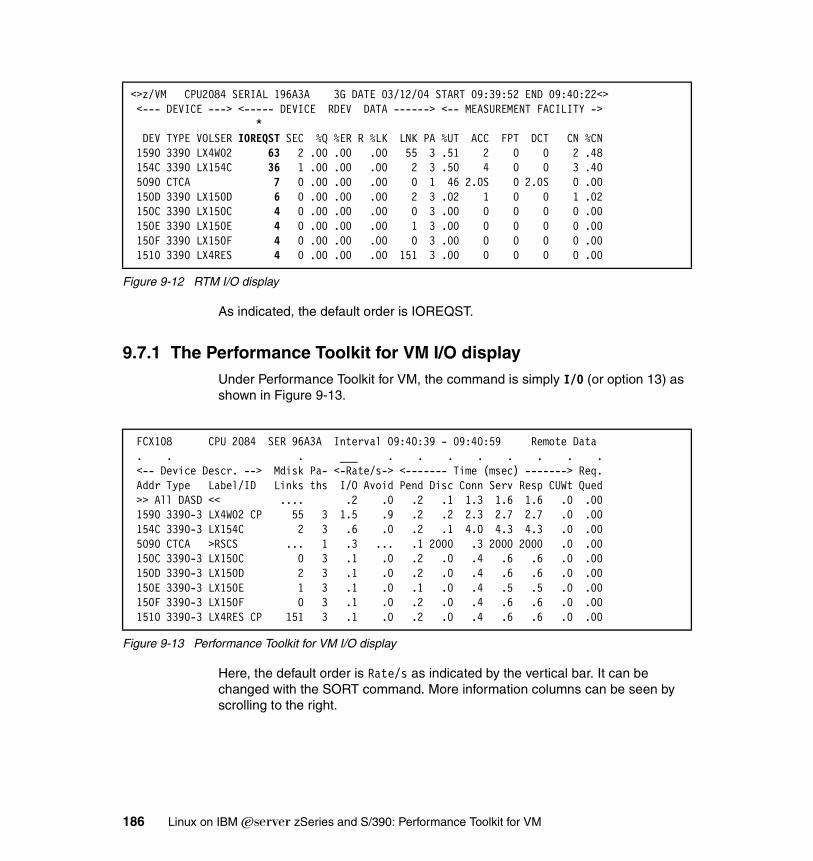
Figure 9-12 RTM I/O display
As indicated, the default order is IOREQST.
9.7.1 The Performance Toolkit for VM I/O displayUnder Performance Toolkit for VM, the command is simply I/O (or option 13) as shown in Figure 9-13.
Figure 9-13 Performance Toolkit for VM I/O display
Here, the default order is Rate/s as indicated by the vertical bar. It can be changed with the SORT command. More information columns can be seen by scrolling to the right.
<>z/VM CPU2084 SERIAL 196A3A 3G DATE 03/12/04 START 09:39:52 END 09:40:22<> <--- DEVICE ---> <----- DEVICE RDEV DATA ------> <-- MEASUREMENT FACILITY -> * DEV TYPE VOLSER IOREQST SEC %Q %ER R %LK LNK PA %UT ACC FPT DCT CN %CN 1590 3390 LX4W02 63 2 .00 .00 .00 55 3 .51 2 0 0 2 .48 154C 3390 LX154C 36 1 .00 .00 .00 2 3 .50 4 0 0 3 .40 5090 CTCA 7 0 .00 .00 .00 0 1 46 2.0S 0 2.0S 0 .00 150D 3390 LX150D 6 0 .00 .00 .00 2 3 .02 1 0 0 1 .02 150C 3390 LX150C 4 0 .00 .00 .00 0 3 .00 0 0 0 0 .00 150E 3390 LX150E 4 0 .00 .00 .00 1 3 .00 0 0 0 0 .00 150F 3390 LX150F 4 0 .00 .00 .00 0 3 .00 0 0 0 0 .00 1510 3390 LX4RES 4 0 .00 .00 .00 151 3 .00 0 0 0 0 .00
FCX108 CPU 2084 SER 96A3A Interval 09:40:39 - 09:40:59 Remote Data . . . ___ . . . . . . . . <-- Device Descr. --> Mdisk Pa- <-Rate/s-> <------- Time (msec) -------> Req. Addr Type Label/ID Links ths I/O Avoid Pend Disc Conn Serv Resp CUWt Qued >> All DASD << .... .2 .0 .2 .1 1.3 1.6 1.6 .0 .00 1590 3390-3 LX4W02 CP 55 3 1.5 .9 .2 .2 2.3 2.7 2.7 .0 .00 154C 3390-3 LX154C 2 3 .6 .0 .2 .1 4.0 4.3 4.3 .0 .00 5090 CTCA >RSCS ... 1 .3 ... .1 2000 .3 2000 2000 .0 .00 150C 3390-3 LX150C 0 3 .1 .0 .2 .0 .4 .6 .6 .0 .00 150D 3390-3 LX150D 2 3 .1 .0 .2 .0 .4 .6 .6 .0 .00 150E 3390-3 LX150E 1 3 .1 .0 .1 .0 .4 .5 .5 .0 .00 150F 3390-3 LX150F 0 3 .1 .0 .2 .0 .4 .6 .6 .0 .00 1510 3390-3 LX4RES CP 151 3 .1 .0 .2 .0 .4 .6 .6 .0 .00
186 Linux on IBM Eserver zSeries and S/390: Performance Toolkit for VM
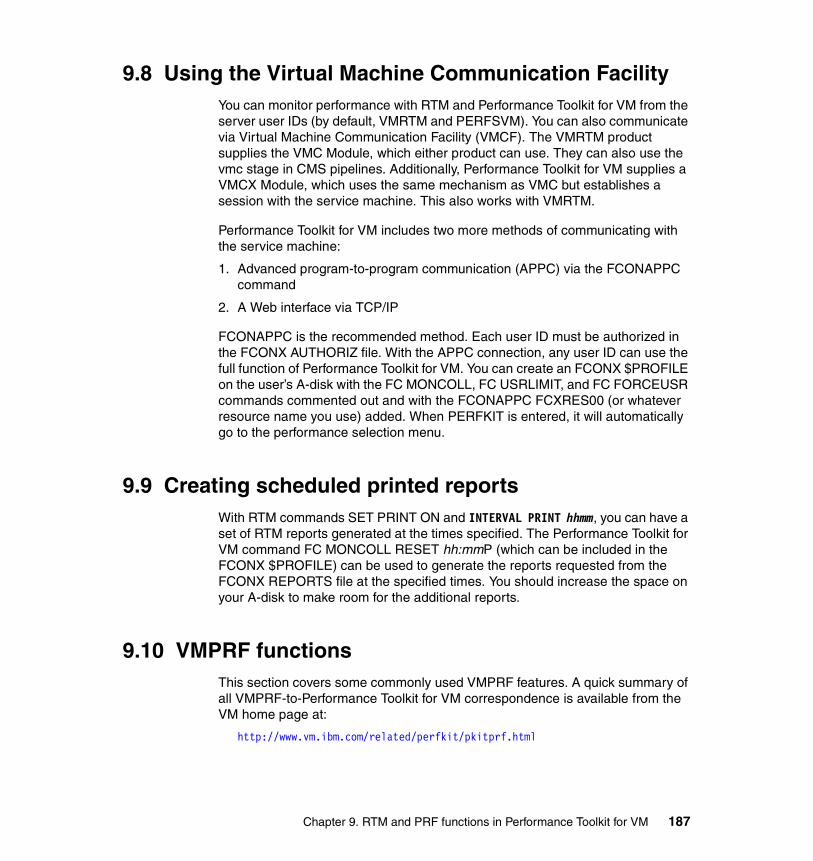
9.8 Using the Virtual Machine Communication FacilityYou can monitor performance with RTM and Performance Toolkit for VM from the server user IDs (by default, VMRTM and PERFSVM). You can also communicate via Virtual Machine Communication Facility (VMCF). The VMRTM product supplies the VMC Module, which either product can use. They can also use the vmc stage in CMS pipelines. Additionally, Performance Toolkit for VM supplies a VMCX Module, which uses the same mechanism as VMC but establishes a session with the service machine. This also works with VMRTM.
Performance Toolkit for VM includes two more methods of communicating with the service machine:
1. Advanced program-to-program communication (APPC) via the FCONAPPC command
2. A Web interface via TCP/IP
FCONAPPC is the recommended method. Each user ID must be authorized in the FCONX AUTHORIZ file. With the APPC connection, any user ID can use the full function of Performance Toolkit for VM. You can create an FCONX $PROFILE on the user’s A-disk with the FC MONCOLL, FC USRLIMIT, and FC FORCEUSR commands commented out and with the FCONAPPC FCXRES00 (or whatever resource name you use) added. When PERFKIT is entered, it will automatically go to the performance selection menu.
9.9 Creating scheduled printed reportsWith RTM commands SET PRINT ON and INTERVAL PRINT hhmm, you can have a set of RTM reports generated at the times specified. The Performance Toolkit for VM command FC MONCOLL RESET hh:mmP (which can be included in the FCONX $PROFILE) can be used to generate the reports requested from the FCONX REPORTS file at the specified times. You should increase the space on your A-disk to make room for the additional reports.
9.10 VMPRF functionsThis section covers some commonly used VMPRF features. A quick summary of all VMPRF-to-Performance Toolkit for VM correspondence is available from the VM home page at:
http://www.vm.ibm.com/related/perfkit/pkitprf.html
Chapter 9. RTM and PRF functions in Performance Toolkit for VM 187
9.10.1 Creating history dataVMPRF is used to process data from the CP MONITOR. It can be run automatically on a daily basis to create printed reports and machine-readable data in the form of trend and summary records. It can also be used to process specific time periods to analyze performance problems. Performance Toolkit for VM can be used to create the printed reports and machine-readable trend data as it processes, eliminating the need for regularly scheduled processing.
9.10.2 Processing historical dataPerformance Toolkit for VM can be used to process:
� CP MONITOR data� Performance Toolkit for VM TREND data
The MONSCAN fn ft fm command is used to process a monitor data file. On the Performance Screen Selection panel, MONSCAN appears in the upper right corner where the system ID is found when monitoring performance on a real-time basis. MONSCAN enables you to step through the data an interval at a time using the NEXTSAMP subcommand. If you do not need averages and want to skip to a certain time period, you can use SKIPSAMP hh:mm yyymmdd to skip to the time that you are interested in. Most Performance Toolkit for VM reports are available using MONSCAN, but some reports that rely on internal CP control blocks for data that is not available in the monitor records are not available using MONSCAN. Performance Toolkit for VM can also process machine-readable files that it has created using the TRNDSCAN command.
9.10.3 When to use MONSCANUse MONSCAN when you want to process existing monitor data, and to identify past activity or previously reported problems. If you are already collecting monitor data, then you can invoke PERFKIT from an authorized user ID and issue the MONSCAN fn ft fm command. The monitor selection screen appears with a subset of the selections highlighted (Figure 9-14 on page 189).
188 Linux on IBM Eserver zSeries and S/390: Performance Toolkit for VM
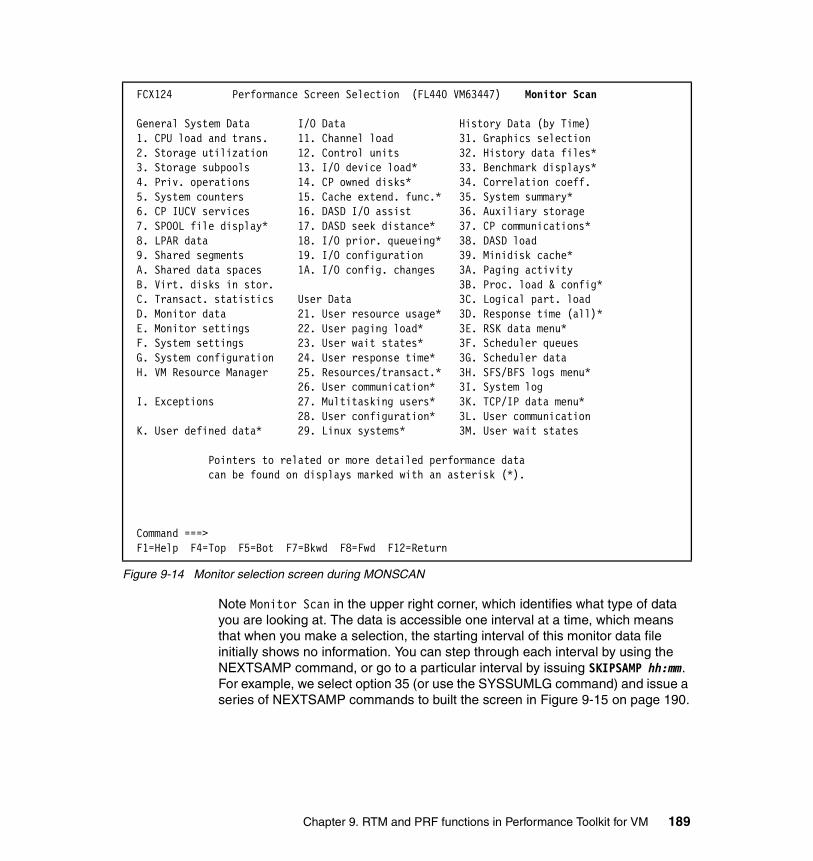
Figure 9-14 Monitor selection screen during MONSCAN
Note Monitor Scan in the upper right corner, which identifies what type of data you are looking at. The data is accessible one interval at a time, which means that when you make a selection, the starting interval of this monitor data file initially shows no information. You can step through each interval by using the NEXTSAMP command, or go to a particular interval by issuing SKIPSAMP hh:mm. For example, we select option 35 (or use the SYSSUMLG command) and issue a series of NEXTSAMP commands to built the screen in Figure 9-15 on page 190.
FCX124 Performance Screen Selection (FL440 VM63447) Monitor Scan General System Data I/O Data History Data (by Time) 1. CPU load and trans. 11. Channel load 31. Graphics selection 2. Storage utilization 12. Control units 32. History data files* 3. Storage subpools 13. I/O device load* 33. Benchmark displays* 4. Priv. operations 14. CP owned disks* 34. Correlation coeff. 5. System counters 15. Cache extend. func.* 35. System summary* 6. CP IUCV services 16. DASD I/O assist 36. Auxiliary storage 7. SPOOL file display* 17. DASD seek distance* 37. CP communications* 8. LPAR data 18. I/O prior. queueing* 38. DASD load 9. Shared segments 19. I/O configuration 39. Minidisk cache* A. Shared data spaces 1A. I/O config. changes 3A. Paging activity B. Virt. disks in stor. 3B. Proc. load & config* C. Transact. statistics User Data 3C. Logical part. load D. Monitor data 21. User resource usage* 3D. Response time (all)* E. Monitor settings 22. User paging load* 3E. RSK data menu* F. System settings 23. User wait states* 3F. Scheduler queues G. System configuration 24. User response time* 3G. Scheduler data H. VM Resource Manager 25. Resources/transact.* 3H. SFS/BFS logs menu* 26. User communication* 3I. System log I. Exceptions 27. Multitasking users* 3K. TCP/IP data menu* 28. User configuration* 3L. User communication K. User defined data* 29. Linux systems* 3M. User wait states Pointers to related or more detailed performance data can be found on displays marked with an asterisk (*). Command ===> F1=Help F4=Top F5=Bot F7=Bkwd F8=Fwd F12=Return
Chapter 9. RTM and PRF functions in Performance Toolkit for VM 189
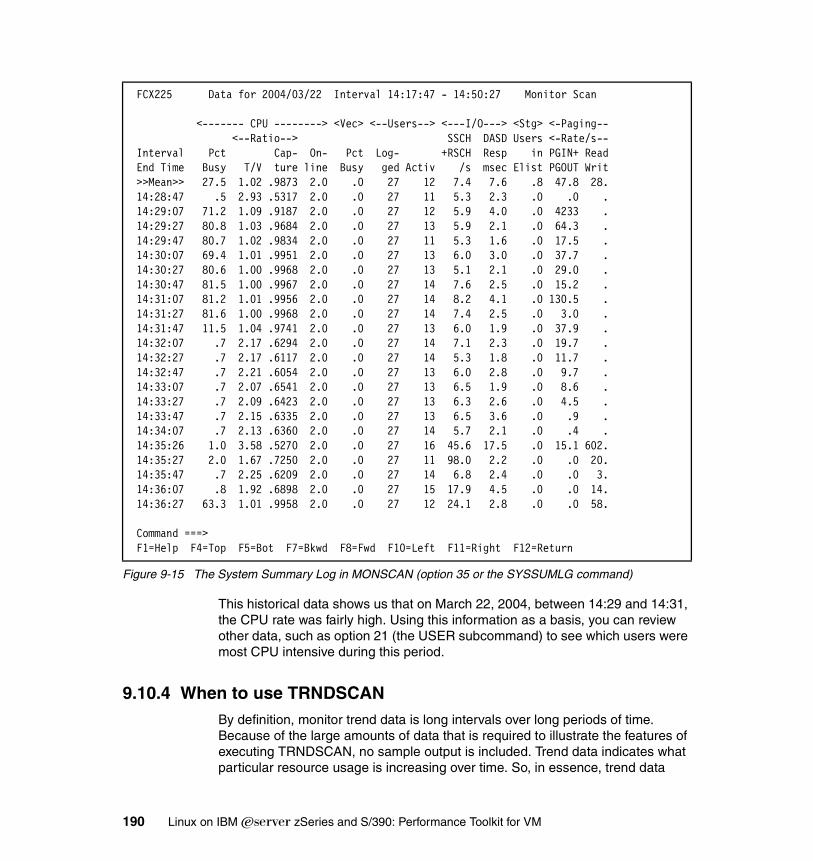
Figure 9-15 The System Summary Log in MONSCAN (option 35 or the SYSSUMLG command)
This historical data shows us that on March 22, 2004, between 14:29 and 14:31, the CPU rate was fairly high. Using this information as a basis, you can review other data, such as option 21 (the USER subcommand) to see which users were most CPU intensive during this period.
9.10.4 When to use TRNDSCANBy definition, monitor trend data is long intervals over long periods of time. Because of the large amounts of data that is required to illustrate the features of executing TRNDSCAN, no sample output is included. Trend data indicates what particular resource usage is increasing over time. So, in essence, trend data
FCX225 Data for 2004/03/22 Interval 14:17:47 - 14:50:27 Monitor Scan <------- CPU --------> <Vec> <--Users--> <---I/O---> <Stg> <-Paging-- <--Ratio--> SSCH DASD Users <-Rate/s-- Interval Pct Cap- On- Pct Log- +RSCH Resp in PGIN+ Read End Time Busy T/V ture line Busy ged Activ /s msec Elist PGOUT Writ >>Mean>> 27.5 1.02 .9873 2.0 .0 27 12 7.4 7.6 .8 47.8 28. 14:28:47 .5 2.93 .5317 2.0 .0 27 11 5.3 2.3 .0 .0 . 14:29:07 71.2 1.09 .9187 2.0 .0 27 12 5.9 4.0 .0 4233 . 14:29:27 80.8 1.03 .9684 2.0 .0 27 13 5.9 2.1 .0 64.3 . 14:29:47 80.7 1.02 .9834 2.0 .0 27 11 5.3 1.6 .0 17.5 . 14:30:07 69.4 1.01 .9951 2.0 .0 27 13 6.0 3.0 .0 37.7 . 14:30:27 80.6 1.00 .9968 2.0 .0 27 13 5.1 2.1 .0 29.0 . 14:30:47 81.5 1.00 .9967 2.0 .0 27 14 7.6 2.5 .0 15.2 . 14:31:07 81.2 1.01 .9956 2.0 .0 27 14 8.2 4.1 .0 130.5 . 14:31:27 81.6 1.00 .9968 2.0 .0 27 14 7.4 2.5 .0 3.0 . 14:31:47 11.5 1.04 .9741 2.0 .0 27 13 6.0 1.9 .0 37.9 . 14:32:07 .7 2.17 .6294 2.0 .0 27 14 7.1 2.3 .0 19.7 . 14:32:27 .7 2.17 .6117 2.0 .0 27 14 5.3 1.8 .0 11.7 . 14:32:47 .7 2.21 .6054 2.0 .0 27 13 6.0 2.8 .0 9.7 . 14:33:07 .7 2.07 .6541 2.0 .0 27 13 6.5 1.9 .0 8.6 . 14:33:27 .7 2.09 .6423 2.0 .0 27 13 6.3 2.6 .0 4.5 . 14:33:47 .7 2.15 .6335 2.0 .0 27 13 6.5 3.6 .0 .9 . 14:34:07 .7 2.13 .6360 2.0 .0 27 14 5.7 2.1 .0 .4 . 14:35:26 1.0 3.58 .5270 2.0 .0 27 16 45.6 17.5 .0 15.1 602. 14:35:27 2.0 1.67 .7250 2.0 .0 27 11 98.0 2.2 .0 .0 20. 14:35:47 .7 2.25 .6209 2.0 .0 27 14 6.8 2.4 .0 .0 3. 14:36:07 .8 1.92 .6898 2.0 .0 27 15 17.9 4.5 .0 .0 14. 14:36:27 63.3 1.01 .9958 2.0 .0 27 12 24.1 2.8 .0 .0 58. Command ===> F1=Help F4=Top F5=Bot F7=Bkwd F8=Fwd F10=Left F11=Right F12=Return
190 Linux on IBM Eserver zSeries and S/390: Performance Toolkit for VM
analysis is more for capacity planning than for performance and tuning. For example, if your paging rate has been rising steadily, then you might consider (among other things):
� Adding more page volumes� Using faster DASD for paging� Increasing your main storage� Reconfiguring your XSTORE� Reducing certain guests’ virtual storage size� Spreading the workload over shifts
TRNDSCAN has the same command syntax as MONSCAN, and also uses NEXTSAMP, but SKIPSAMP uses yyyymmdd because trend data deals with information over several days.
9.10.5 ReportsVMPRF has separate reports depending on how they are sorted. For example, the PRF008 USER_RESOURCE_UTILIZATION is sorted by CPU PCT, and the PRF054 USER_RESOURCE_UTILIZATION_BY_USERID is the same report sorted by USERID. The equivalent Performance Toolkit for VM report is the USER report (option 21 from the selection menu). The second row contains a series of dots and an underscore. Place the cursor over the column you want to use for sorting and press Enter to sort the report by that column. Therefore, in addition to sorting by user ID or %CPU, you could also sort by TOTAL Virtual I/Os or any other field showing a dot.
Chapter 9. RTM and PRF functions in Performance Toolkit for VM 191

192 Linux on IBM Eserver zSeries and S/390: Performance Toolkit for VM
Chapter 10. Performance Toolkit for VM updates for function level 510
This chapter covers updates to Performance Toolkit for VM that are available with Function Level 510 of Performance Toolkit for VM. We discuss:
� Performance Toolkit for VM changes for FL510
� Performance Toolkit for VM installation changes
� Control file changes for FL510
� Performance Toolkit for VM PRF support
� New Linux reports using CP Monitor data from Linux
� New SCSI device report
10
© Copyright IBM Corp. 2004. All rights reserved. 193
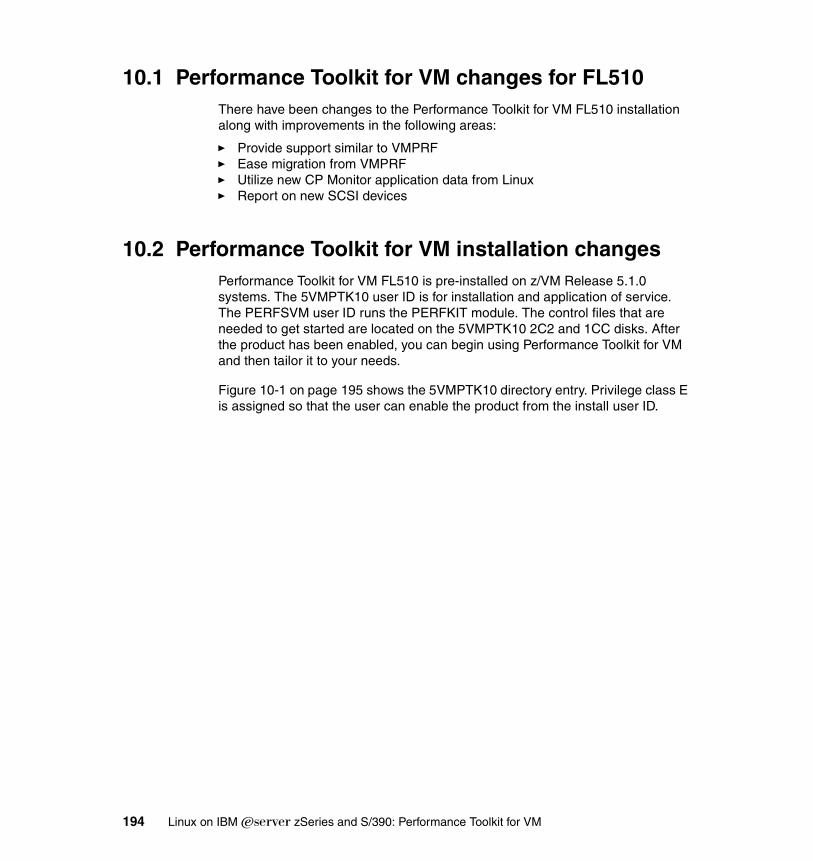
10.1 Performance Toolkit for VM changes for FL510There have been changes to the Performance Toolkit for VM FL510 installation along with improvements in the following areas:
� Provide support similar to VMPRF� Ease migration from VMPRF� Utilize new CP Monitor application data from Linux� Report on new SCSI devices
10.2 Performance Toolkit for VM installation changesPerformance Toolkit for VM FL510 is pre-installed on z/VM Release 5.1.0 systems. The 5VMPTK10 user ID is for installation and application of service. The PERFSVM user ID runs the PERFKIT module. The control files that are needed to get started are located on the 5VMPTK10 2C2 and 1CC disks. After the product has been enabled, you can begin using Performance Toolkit for VM and then tailor it to your needs.
Figure 10-1 on page 195 shows the 5VMPTK10 directory entry. Privilege class E is assigned so that the user can enable the product from the install user ID.
194 Linux on IBM Eserver zSeries and S/390: Performance Toolkit for VM
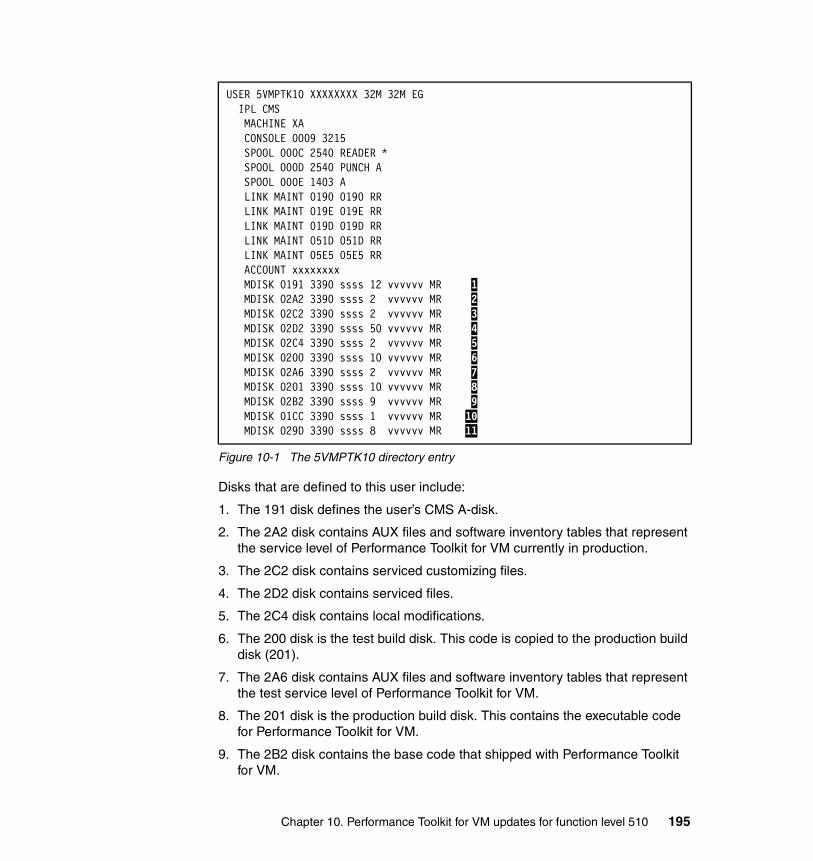
Figure 10-1 The 5VMPTK10 directory entry
Disks that are defined to this user include:
1. The 191 disk defines the user’s CMS A-disk.
2. The 2A2 disk contains AUX files and software inventory tables that represent the service level of Performance Toolkit for VM currently in production.
3. The 2C2 disk contains serviced customizing files.
4. The 2D2 disk contains serviced files.
5. The 2C4 disk contains local modifications.
6. The 200 disk is the test build disk. This code is copied to the production build disk (201).
7. The 2A6 disk contains AUX files and software inventory tables that represent the test service level of Performance Toolkit for VM.
8. The 201 disk is the production build disk. This contains the executable code for Performance Toolkit for VM.
9. The 2B2 disk contains the base code that shipped with Performance Toolkit for VM.
USER 5VMPTK10 XXXXXXXX 32M 32M EG IPL CMS MACHINE XA CONSOLE 0009 3215 SPOOL 000C 2540 READER * SPOOL 000D 2540 PUNCH A SPOOL 000E 1403 A LINK MAINT 0190 0190 RR LINK MAINT 019E 019E RR LINK MAINT 019D 019D RR LINK MAINT 051D 051D RR LINK MAINT 05E5 05E5 RR ACCOUNT xxxxxxxx MDISK 0191 3390 ssss 12 vvvvvv MR 1 MDISK 02A2 3390 ssss 2 vvvvvv MR 2 MDISK 02C2 3390 ssss 2 vvvvvv MR 3 MDISK 02D2 3390 ssss 50 vvvvvv MR 4 MDISK 02C4 3390 ssss 2 vvvvvv MR 5 MDISK 0200 3390 ssss 10 vvvvvv MR 6 MDISK 02A6 3390 ssss 2 vvvvvv MR 7 MDISK 0201 3390 ssss 10 vvvvvv MR 8 MDISK 02B2 3390 ssss 9 vvvvvv MR 9 MDISK 01CC 3390 ssss 1 vvvvvv MR 10 MDISK 029D 3390 ssss 8 vvvvvv MR 11
Chapter 10. Performance Toolkit for VM updates for function level 510 195
10.The 1CC disk contains customized files. The control files that are needed for Performance Toolkit for VM are located on this disk.
11.The 29D disk contains the help files for Performance Toolkit for VM.
The directory entry for the PERFSVM machine is shown in Figure 10-2. The privilege class is ABDEG, so PERFSVM running the PERFKIT MODULE can be used as a VM operator’s console. If you are only going to use it for performance monitoring you can change it to class EG. This will prevent you from entering commands that only an operator should issue.
Figure 10-2 The PERFSVM directory entry for FL510
Information about the directory entries:
1. The NAMESAVE MONDCSS option enables Performance Toolkit for VM to access the CP Monitor data.
2. IUCV *IDENT entries define the resource that is used for FCONAPPC access to the Performance Toolkit for VM display screens from other user IDs.
3. SHARE ABS 3% is needed to assure that Performance Toolkit for VM is dispatched long enough to collect the monitor data.
USER PERFSVM PERFSVM 64M 512M ABDEG MACHINE XA XAUTOLOG AUTOLOG1 ACCOUNT xxxx NAMESAVE MONDCSS 1 IUCV *MONITOR MSGLIMIT 255 IUCV *IDENT FCXRES00 GLOBAL 2 IUCV *IDENT FCXSYSTM GLOBAL IUCV ALLOW SHARE ABS 3% 3 IPL CMS OPTION QUICKDSP 4 CONSOLE 0009 3215 SPOOL 000C 2540 READER * SPOOL 000D 2540 PUNCH A SPOOL 000E 1403 A LINK MAINT 190 190 RR LINK MAINT 19D 19D RR LINK MAINT 19E 19E RR LINK 5VMPTK10 200 200 RR 5 LINK 5VMPTK10 201 201 RR LINK 5VMPTK10 1CC 1CC RR LINK 5VMPTK10 29D 29D RR MDISK 191 3390 1007 060 440W02 MR READ WRITE MULTIPLE 6 MDISK 195 3390 1067 060 440W02 MR READ WRITE MULTIPLE 7
196 Linux on IBM Eserver zSeries and S/390: Performance Toolkit for VM
4. OPTION QUICKDSP also ensures that Performance Toolkit for VM will be dispatched long enough.
5. The LINKs to 5VMPTK10 minidisks provide access to the control files and executable parts of Performance Toolkit for VM.
6. The MDISK 191 defines the PERFSVM machine’s A-disk.
7. The MDISK 195 defines a disk on which history data can be saved.
The PROFILE EXECSAMP has also been updated to reflect the changes to the minidisks that are used for the control files.
10.3 Control file changes for FL510The files that are necessary to control Performance Toolkit for VM are located on 5VMPTK10 users 1CC disk. These can be modified and kept on the 1CC disk for local tailoring. The latest serviced copy of each is kept on the 2C2 disk. For any permanent changes to control files, you should use the VMSES/E local modification instructions found in Guide for Automated Installation and Service, SC24-6099. This will create an update on the 2C4 disc and alert you when service is applied to a control file. The 1CC disk will be used by the PERFSVM machine.
10.3.1 FCONX $PROFILE changeThe FCONX $PROFILE file contains Performance Toolkit for VM commands to set up and control how the Performance Toolkit for VM will operate. The FC MONCOLL RESET command has been changed to reflect the new summary file creation similar to VMPRF SUMMARY files. You can now use S as a suffix to tell PERFKIT to create a summary file at the specified time. You can specify all (P, T, and S — print, trend, and summary) at one time or use a separate set of times for each. See Figure 10-3 on page 199 for an example.
10.3.2 Performance Toolkit for VM report changesChanges have been made to these Linux reports:� LXCPU� LXNET� LXPROC
They can be entered without specifying a user ID. This produces the new screen with an entry for each Linux user ID that is producing APPLDATA. From these new screens you can now select more details by user ID. See 10.5, “Using APPLDATA from Linux” on page 200 for more details.
Chapter 10. Performance Toolkit for VM updates for function level 510 197
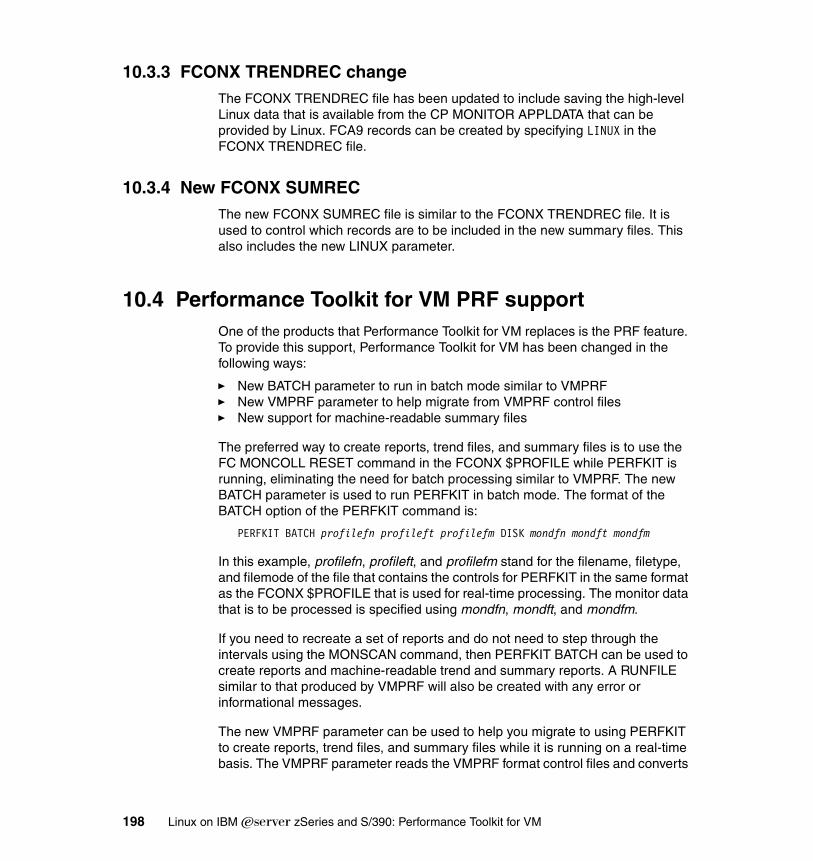
10.3.3 FCONX TRENDREC changeThe FCONX TRENDREC file has been updated to include saving the high-level Linux data that is available from the CP MONITOR APPLDATA that can be provided by Linux. FCA9 records can be created by specifying LINUX in the FCONX TRENDREC file.
10.3.4 New FCONX SUMRECThe new FCONX SUMREC file is similar to the FCONX TRENDREC file. It is used to control which records are to be included in the new summary files. This also includes the new LINUX parameter.
10.4 Performance Toolkit for VM PRF supportOne of the products that Performance Toolkit for VM replaces is the PRF feature. To provide this support, Performance Toolkit for VM has been changed in the following ways:
� New BATCH parameter to run in batch mode similar to VMPRF� New VMPRF parameter to help migrate from VMPRF control files� New support for machine-readable summary files
The preferred way to create reports, trend files, and summary files is to use the FC MONCOLL RESET command in the FCONX $PROFILE while PERFKIT is running, eliminating the need for batch processing similar to VMPRF. The new BATCH parameter is used to run PERFKIT in batch mode. The format of the BATCH option of the PERFKIT command is:
PERFKIT BATCH profilefn profileft profilefm DISK mondfn mondft mondfm
In this example, profilefn, profileft, and profilefm stand for the filename, filetype, and filemode of the file that contains the controls for PERFKIT in the same format as the FCONX $PROFILE that is used for real-time processing. The monitor data that is to be processed is specified using mondfn, mondft, and mondfm.
If you need to recreate a set of reports and do not need to step through the intervals using the MONSCAN command, then PERFKIT BATCH can be used to create reports and machine-readable trend and summary reports. A RUNFILE similar to that produced by VMPRF will also be created with any error or informational messages.
The new VMPRF parameter can be used to help you migrate to using PERFKIT to create reports, trend files, and summary files while it is running on a real-time basis. The VMPRF parameter reads the VMPRF format control files and converts
198 Linux on IBM Eserver zSeries and S/390: Performance Toolkit for VM
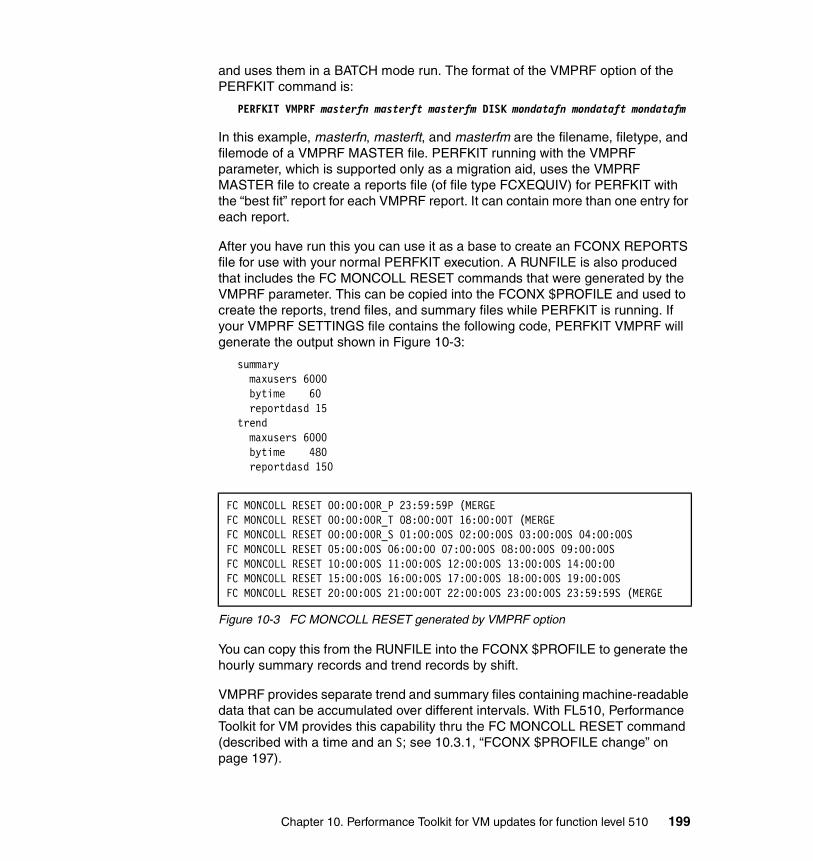
and uses them in a BATCH mode run. The format of the VMPRF option of the PERFKIT command is:
PERFKIT VMPRF masterfn masterft masterfm DISK mondatafn mondataft mondatafm
In this example, masterfn, masterft, and masterfm are the filename, filetype, and filemode of a VMPRF MASTER file. PERFKIT running with the VMPRF parameter, which is supported only as a migration aid, uses the VMPRF MASTER file to create a reports file (of file type FCXEQUIV) for PERFKIT with the “best fit” report for each VMPRF report. It can contain more than one entry for each report.
After you have run this you can use it as a base to create an FCONX REPORTS file for use with your normal PERFKIT execution. A RUNFILE is also produced that includes the FC MONCOLL RESET commands that were generated by the VMPRF parameter. This can be copied into the FCONX $PROFILE and used to create the reports, trend files, and summary files while PERFKIT is running. If your VMPRF SETTINGS file contains the following code, PERFKIT VMPRF will generate the output shown in Figure 10-3:
summary maxusers 6000 bytime 60 reportdasd 15 trend maxusers 6000 bytime 480 reportdasd 150
Figure 10-3 FC MONCOLL RESET generated by VMPRF option
You can copy this from the RUNFILE into the FCONX $PROFILE to generate the hourly summary records and trend records by shift.
VMPRF provides separate trend and summary files containing machine-readable data that can be accumulated over different intervals. With FL510, Performance Toolkit for VM provides this capability thru the FC MONCOLL RESET command (described with a time and an S; see 10.3.1, “FCONX $PROFILE change” on page 197).
FC MONCOLL RESET 00:00:00R_P 23:59:59P (MERGEFC MONCOLL RESET 00:00:00R_T 08:00:00T 16:00:00T (MERGEFC MONCOLL RESET 00:00:00R_S 01:00:00S 02:00:00S 03:00:00S 04:00:00SFC MONCOLL RESET 05:00:00S 06:00:00 07:00:00S 08:00:00S 09:00:00SFC MONCOLL RESET 10:00:00S 11:00:00S 12:00:00S 13:00:00S 14:00:00FC MONCOLL RESET 15:00:00S 16:00:00S 17:00:00S 18:00:00S 19:00:00SFC MONCOLL RESET 20:00:00S 21:00:00T 22:00:00S 23:00:00S 23:59:59S (MERGE
Chapter 10. Performance Toolkit for VM updates for function level 510 199
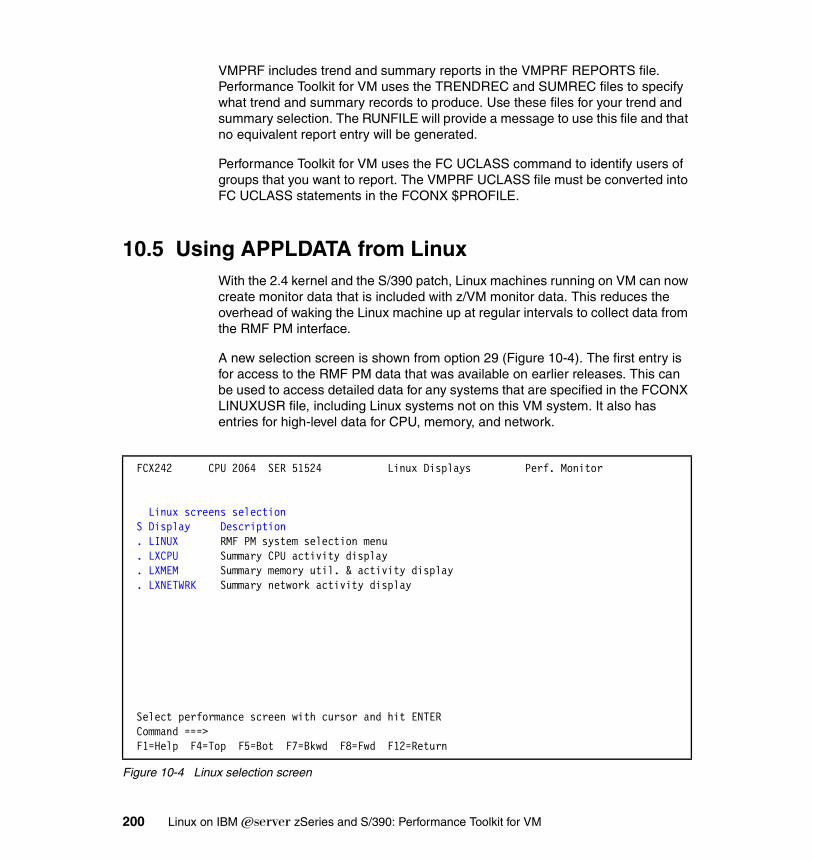
VMPRF includes trend and summary reports in the VMPRF REPORTS file. Performance Toolkit for VM uses the TRENDREC and SUMREC files to specify what trend and summary records to produce. Use these files for your trend and summary selection. The RUNFILE will provide a message to use this file and that no equivalent report entry will be generated.
Performance Toolkit for VM uses the FC UCLASS command to identify users of groups that you want to report. The VMPRF UCLASS file must be converted into FC UCLASS statements in the FCONX $PROFILE.
10.5 Using APPLDATA from LinuxWith the 2.4 kernel and the S/390 patch, Linux machines running on VM can now create monitor data that is included with z/VM monitor data. This reduces the overhead of waking the Linux machine up at regular intervals to collect data from the RMF PM interface.
A new selection screen is shown from option 29 (Figure 10-4). The first entry is for access to the RMF PM data that was available on earlier releases. This can be used to access detailed data for any systems that are specified in the FCONX LINUXUSR file, including Linux systems not on this VM system. It also has entries for high-level data for CPU, memory, and network.
Figure 10-4 Linux selection screen
FCX242 CPU 2064 SER 51524 Linux Displays Perf. Monitor
Linux screens selection S Display Description . LINUX RMF PM system selection menu . LXCPU Summary CPU activity display . LXMEM Summary memory util. & activity display . LXNETWRK Summary network activity display
Select performance screen with cursor and hit ENTER Command ===> F1=Help F4=Top F5=Bot F7=Bkwd F8=Fwd F12=Return
200 Linux on IBM Eserver zSeries and S/390: Performance Toolkit for VM
Select the LXCPU entry to view the Linux CPU screen that is shown in Figure 10-5. This screen contains a line for each Linux system that is providing MONITOR APPLDATA. If the user ID is highlighted, it can be selected for more detail using the RMF PM interface. You must supply an IP address for this Linux system with a name that matches the VM user ID on this system for that Linux machine in the FCONX LINUXUSR file. LXCPU userid can still be used to go directly to the RMF PM data for the specified user ID.
Figure 10-5 Linux CPU screen
FCX243 Run 2004/03/25 14:53:34 LXCPU Page 1 Linux CPU Utilization SummaryFrom 2004/03/25 14:51:48 VMLINUX4To 2004/03/25 14:52:26 CPU 2084 SN 96A3AFor 39 Secs 00:00:39 This is a performance report for system XYZ z/VM V.4.4.0 SLU 0401____________________________________________________________________________________________________________________________________
______ . . . . . . . . . . . . . . . <------------------- Total CPU --------------------> <------------- Processes --------------> Linux Virt <---------------- Utilization (%) -----------------> <---- Current -----> <-Average Running-> Nr of Userid CPUs TotCPU User Kernel Nice IRQ SoftIRQ IOWait Idle Runabl Waiting Total 1_Min 5_Min 15_Min Users >System< 2.0 103.4 102.5 1.0 .0 ... ... ... 96.6 2.0 ... 60.0 1.00 .49 .19 1 LNXSU1 2 103.4 102.5 1.0 .0 ... ... ... 96.6 2 ... 60 1.00 .49 .19
Chapter 10. Performance Toolkit for VM updates for function level 510 201
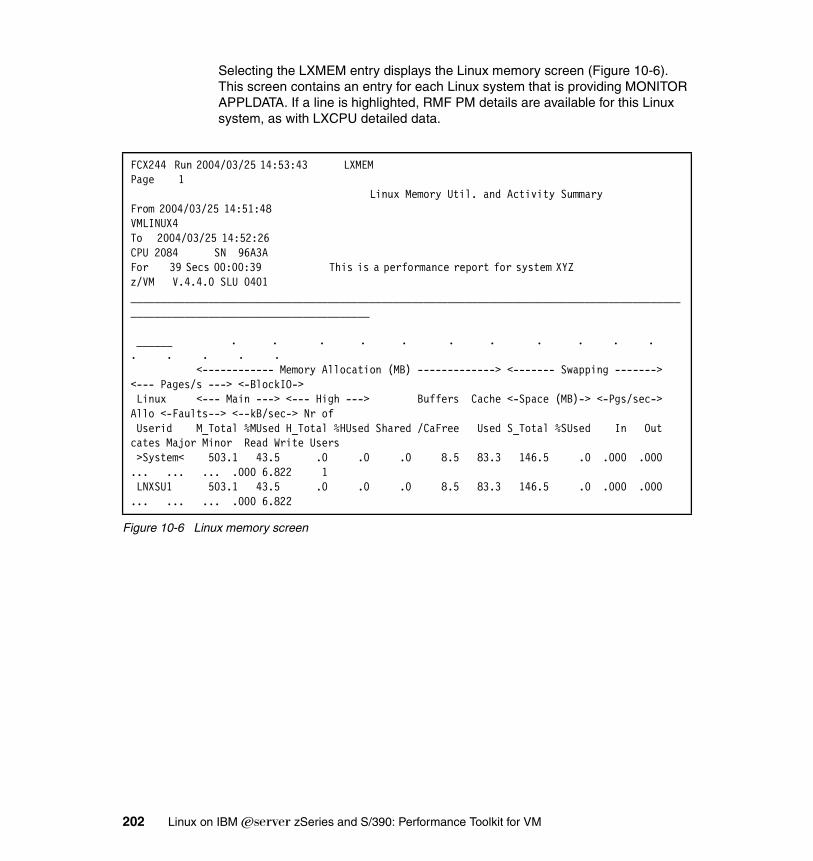
Selecting the LXMEM entry displays the Linux memory screen (Figure 10-6). This screen contains an entry for each Linux system that is providing MONITOR APPLDATA. If a line is highlighted, RMF PM details are available for this Linux system, as with LXCPU detailed data.
Figure 10-6 Linux memory screen
FCX244 Run 2004/03/25 14:53:43 LXMEM Page 1 Linux Memory Util. and Activity SummaryFrom 2004/03/25 14:51:48 VMLINUX4To 2004/03/25 14:52:26 CPU 2084 SN 96A3AFor 39 Secs 00:00:39 This is a performance report for system XYZ z/VM V.4.4.0 SLU 0401____________________________________________________________________________________________________________________________________
______ . . . . . . . . . . . . . . . . <------------ Memory Allocation (MB) -------------> <------- Swapping -------> <--- Pages/s ---> <-BlockIO-> Linux <--- Main ---> <--- High ---> Buffers Cache <-Space (MB)-> <-Pgs/sec-> Allo <-Faults--> <--kB/sec-> Nr of Userid M_Total %MUsed H_Total %HUsed Shared /CaFree Used S_Total %SUsed In Out cates Major Minor Read Write Users >System< 503.1 43.5 .0 .0 .0 8.5 83.3 146.5 .0 .000 .000 ... ... ... .000 6.822 1 LNXSU1 503.1 43.5 .0 .0 .0 8.5 83.3 146.5 .0 .000 .000 ... ... ... .000 6.822
202 Linux on IBM Eserver zSeries and S/390: Performance Toolkit for VM
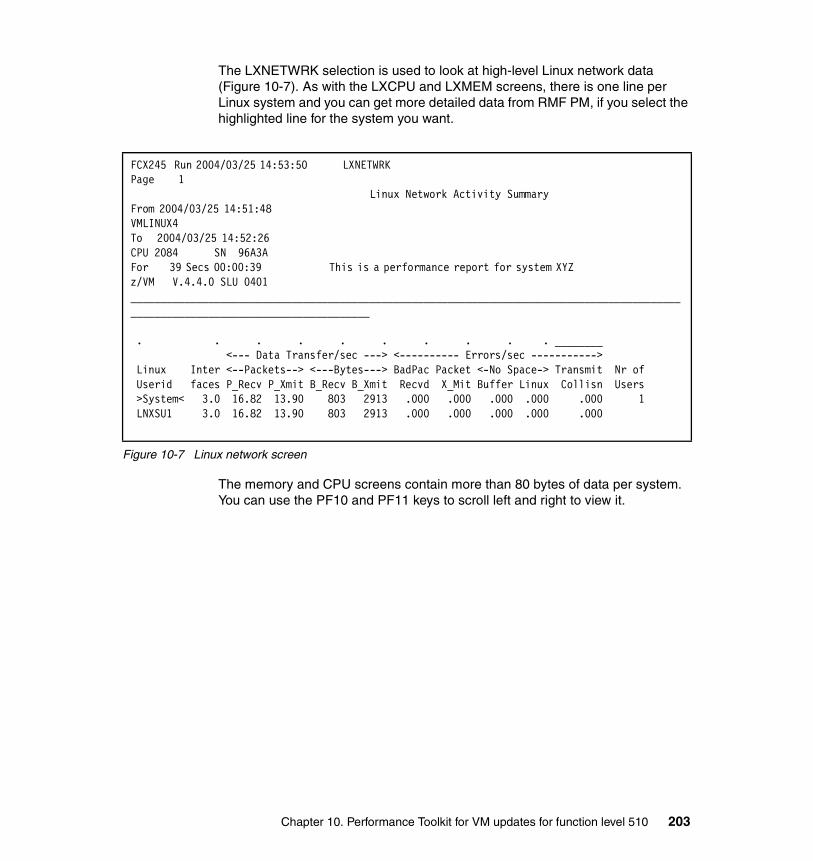
The LXNETWRK selection is used to look at high-level Linux network data (Figure 10-7). As with the LXCPU and LXMEM screens, there is one line per Linux system and you can get more detailed data from RMF PM, if you select the highlighted line for the system you want.
Figure 10-7 Linux network screen
The memory and CPU screens contain more than 80 bytes of data per system. You can use the PF10 and PF11 keys to scroll left and right to view it.
FCX245 Run 2004/03/25 14:53:50 LXNETWRK Page 1 Linux Network Activity SummaryFrom 2004/03/25 14:51:48 VMLINUX4To 2004/03/25 14:52:26 CPU 2084 SN 96A3AFor 39 Secs 00:00:39 This is a performance report for system XYZ z/VM V.4.4.0 SLU 0401____________________________________________________________________________________________________________________________________
. . . . . . . . . . ________ <--- Data Transfer/sec ---> <---------- Errors/sec -----------> Linux Inter <--Packets--> <---Bytes---> BadPac Packet <-No Space-> Transmit Nr of Userid faces P_Recv P_Xmit B_Recv B_Xmit Recvd X_Mit Buffer Linux Collisn Users >System< 3.0 16.82 13.90 803 2913 .000 .000 .000 .000 .000 1 LNXSU1 3.0 16.82 13.90 803 2913 .000 .000 .000 .000 .000
Chapter 10. Performance Toolkit for VM updates for function level 510 203
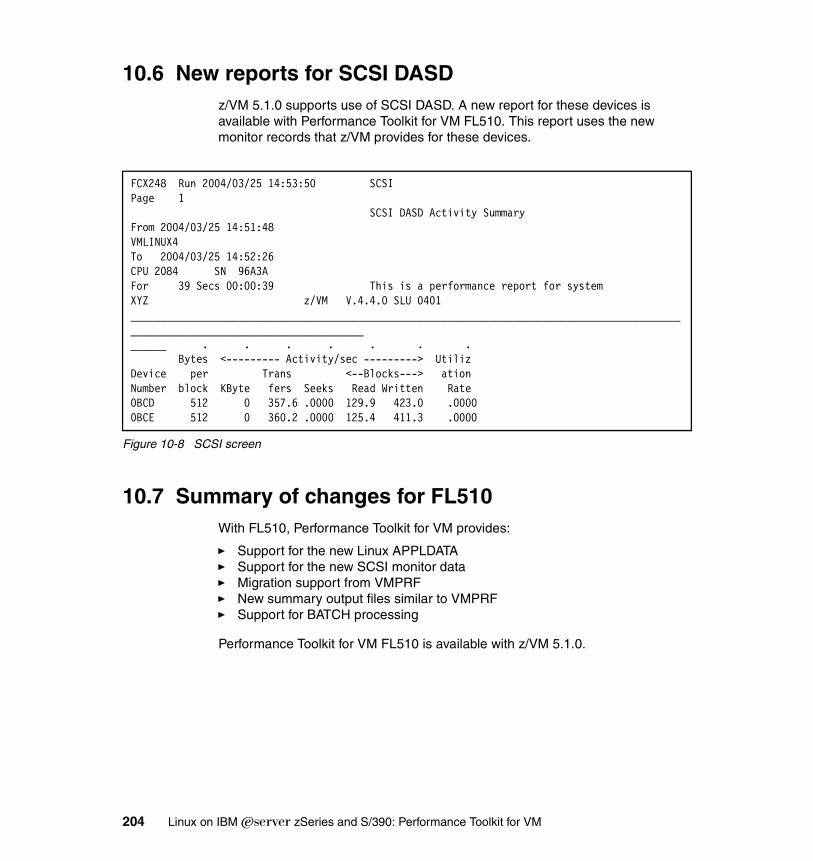
10.6 New reports for SCSI DASDz/VM 5.1.0 supports use of SCSI DASD. A new report for these devices is available with Performance Toolkit for VM FL510. This report uses the new monitor records that z/VM provides for these devices.
Figure 10-8 SCSI screen
10.7 Summary of changes for FL510With FL510, Performance Toolkit for VM provides:
� Support for the new Linux APPLDATA� Support for the new SCSI monitor data� Migration support from VMPRF� New summary output files similar to VMPRF� Support for BATCH processing
Performance Toolkit for VM FL510 is available with z/VM 5.1.0.
FCX248 Run 2004/03/25 14:53:50 SCSI Page 1 SCSI DASD Activity Summary From 2004/03/25 14:51:48 VMLINUX4 To 2004/03/25 14:52:26 CPU 2084 SN 96A3A For 39 Secs 00:00:39 This is a performance report for system XYZ z/VM V.4.4.0 SLU 0401 ___________________________________________________________________________________________________________________________________ ______ . . . . . . . Bytes <--------- Activity/sec ---------> Utiliz Device per Trans <--Blocks---> ation Number block KByte fers Seeks Read Written Rate 0BCD 512 0 357.6 .0000 129.9 423.0 .00000BCE 512 0 360.2 .0000 125.4 411.3 .0000
204 Linux on IBM Eserver zSeries and S/390: Performance Toolkit for VM
Appendix A. Monitoring for z/VM
This appendix introduces VM monitoring concepts. We discuss:
� VM Monitor facility overview
� Types of available monitor data
� Using the CP MONITOR command
A
© Copyright IBM Corp. 2004. All rights reserved. 205
VM Monitor facility overviewThe VM Control Program (CP) has a Monitor facility to collect system performance data. The data can be used to:
� Provide an understanding of system operation� Analyze system resources usage� Diagnose performance bottlenecks
Monitored resources include processors, storage, Input/Output devices, and the paging subsystem. You can control the amount of data and the type of data that is collected.
The CP MONITOR command controls monitoring:
1. A Conversational Monitor System (CMS) virtual machine running an application program connects to the CP *MONITOR System Service to initiate the data link with CP.
2. The monitor system service collects monitor data during CP operation and stores it in a user-defined saved segment in the form of monitor records.
3. An application running on the CMS virtual machine retrieves and processes monitor records from the saved segment.
MONWRITE is a CP utility supplied with z/VM. It establishes the communication links with CP, retrieves monitor records from the saved segment, and stores the records (on disk, in a CMS file, or on tape). An application program can read the monitor records from the file and perform data reduction on the performance data.
Figure A-1 on page 207 shows the process steps to collect monitor data.
206 Linux on IBM Eserver zSeries and S/390: Performance Toolkit for VM
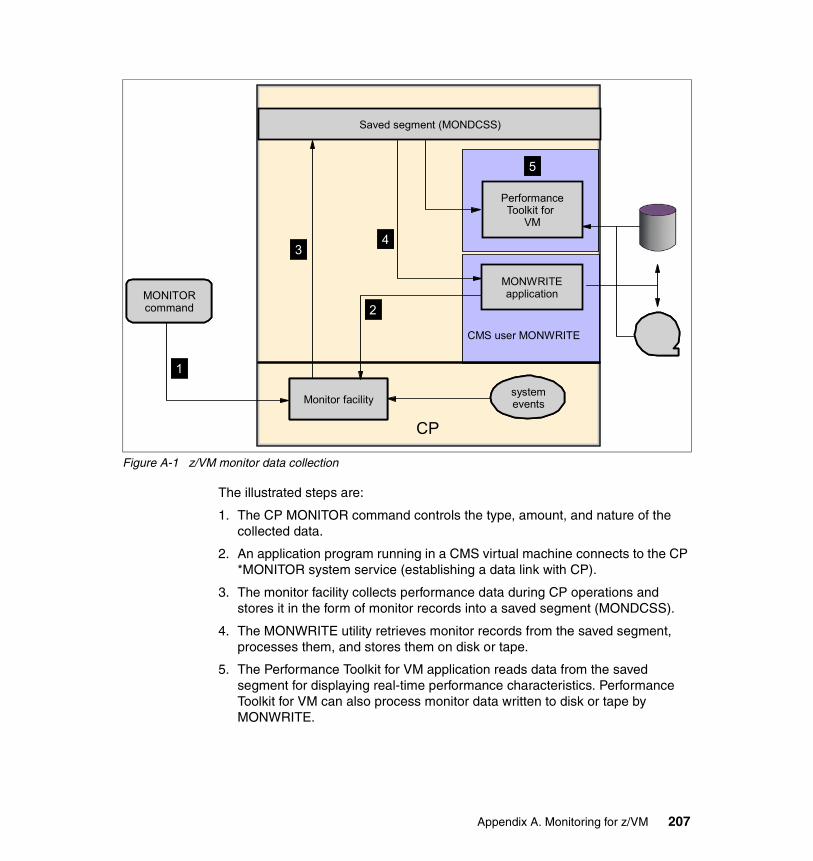
Figure A-1 z/VM monitor data collection
The illustrated steps are:
1. The CP MONITOR command controls the type, amount, and nature of the collected data.
2. An application program running in a CMS virtual machine connects to the CP *MONITOR system service (establishing a data link with CP).
3. The monitor facility collects performance data during CP operations and stores it in the form of monitor records into a saved segment (MONDCSS).
4. The MONWRITE utility retrieves monitor records from the saved segment, processes them, and stores them on disk or tape.
5. The Performance Toolkit for VM application reads data from the saved segment for displaying real-time performance characteristics. Performance Toolkit for VM can also process monitor data written to disk or tape by MONWRITE.
MONITORcommand
PerformanceToolkit for
VM
CMS user MONWRITE
MONWRITEapplication
Monitor facilitysystemevents
Saved segment (MONDCSS)
CP
5
2
43
1
Appendix A. Monitoring for z/VM 207
A word about the monitor system service (*MONITOR)The monitor system service (*MONITOR) notifies connected virtual machines when records are created by the z/VM monitor facility. The CP monitor collects statistics about the z/VM system operation based on the user’s selections. These statistics are stored in a user-defined saved segment in the form of monitor records as discussed earlier. The statistics are grouped into sets called domains. Domains correspond to areas of the system for which information of interest is sampled or events of interest take place. The monitor records are shown by domain number.
The collection of system statistics and their storage in monitor records is controlled by the MONITOR SAMPLE and MONITOR EVENT commands. *MONITOR provides virtual machines with the location of monitor records. Details about the *MONITOR system service are found in z/VM: Performance, SC24-5999.
Types of available monitor dataCP Monitor collects data during system operation and stores (or “reports”) the data in a saved segment in the form of monitor records.
Two types of monitor data are collected:
� Event data
Event data is collected and reported each time a designated system event occurs. The reported data represents system status at the time the event occurs. For example, to monitor the DASD device at address 1234, use the MONITOR ENABLE EVENT I/O DEVICE 1234 command. Events recorded for the device include VARY ON, VARY OFF, ATTACH, and DETACH.
� Sample data
Sample data is reported at the end of a designated time interval. Two varieties of sample data are collected:
– Single-sample data
Single-sample data is collected and reported once (at the end of the time interval). Some of the data represents system status at the time of collection; other data represents accumulated counters, states, or elapsed times since the start of sampling.
– High-frequency sample data
High-frequency data is collected more frequently than reported. At each high-frequency sampling time, the collected data is added to the corresponding counters. The data is reported once at the end of the time
208 Linux on IBM Eserver zSeries and S/390: Performance Toolkit for VM
interval (along with single-sample data) and represents the accumulated counter or state values since the start of high-frequency sampling.
Use the CP MONITOR command to select the types of data to collect. You can also control the time interval for single sampling and the rate for high-frequency sampling.
A set of data called configuration data is collected and reported immediately whenever at least one virtual machine connects to *MONITOR and the CP MONITOR START command is issued.
Monitor data is categorized into several data domains:
� Domain 0 - System domain
Contains information about system-wide resource usage and consists of only sample data.
� Domain 1 - Monitor domain
Contains information about the installation configuration such as processors, paging, storage, and I/O. This domain consists of both sample and event data.
� Domain 2 - Scheduler domain
Contains information about scheduler queues, workload flow through the scheduler, and resource allocation strategies of the scheduler and dispatcher. This domain consists of only event data.
� Domain 3 - Storage domain
Contains information about use of real, virtual, expanded, and auxiliary storage. This domain consists of both sample and event data.
� Domain 4 - User domain
Contains information about virtual machines such as scheduling status, virtual I/O usage, and logon/logoff events. This domain consists of both sample and event data.
� Domain 5 - Processor domain
Contains information related to work that is dispatched to a given processor, and other data related to processor usage. This domain consists of both sample and event data.
Note: These steps may occur in any order.
Appendix A. Monitoring for z/VM 209
� Domain 6- I/O domain
Contains information about I/O requests, error recovery, interrupts, and other information for real devices. Consists of both sample and event data.
� Domain 7 - Seek domain
Contains information about DASD seek operations and consists of only event data.
� Domain 10 - Application data domain
Contains application data copied from a virtual machine’s storage (when that storage has been defined to CP for collecting application-generated monitor data). This domain consists of both sample and event data.
Using the CP MONITOR commandUsing the CP MONITOR command, you can:
� Create a profile for event and sample data collection. Select the domains and the elements within the domain (such as user IDs, device numbers, device types, classes, and volume identifiers).
� Specify the time interval for single-sample data collection and the rate for high-frequency sample data collection.
� Start event and sample data monitoring based on the profiles established.
� Stop event and sample data monitoring.
� Partition the saved segment into sample area and event area. Within each area, you can further partition it into one area for configuration records and the other for data records.
� Specify the maximum time a user has to reply to an IUCV send for configuration data.
Use the CP QUERY MONITOR command to view existing monitor settings. This provides information about event and sample recording, configuration areas, and configuration time limits. Further details concerning the use of these and other CP commands can be found in the publication z/VM CP Command and Utility Reference, SC24-6008.
210 Linux on IBM Eserver zSeries and S/390: Performance Toolkit for VM
Appendix B. Performance Toolkit for VM sample files
This appendix contains a listing of the sample files distributed with Performance Toolkit for VM.
B
© Copyright IBM Corp. 2004. All rights reserved. 211
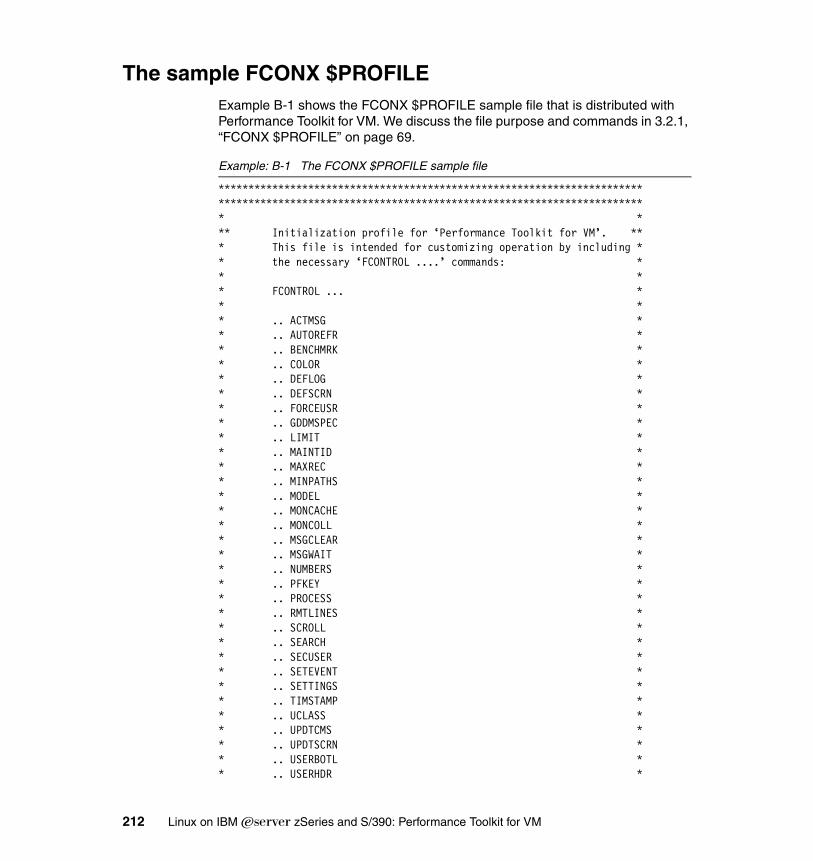
The sample FCONX $PROFILEExample B-1 shows the FCONX $PROFILE sample file that is distributed with Performance Toolkit for VM. We discuss the file purpose and commands in 3.2.1, “FCONX $PROFILE” on page 69.
Example: B-1 The FCONX $PROFILE sample file
*********************************************************************************************************************************************** *** Initialization profile for ‘Performance Toolkit for VM’. *** This file is intended for customizing operation by including ** the necessary ‘FCONTROL ....’ commands: ** ** FCONTROL ... ** ** .. ACTMSG ** .. AUTOREFR ** .. BENCHMRK ** .. COLOR ** .. DEFLOG ** .. DEFSCRN ** .. FORCEUSR ** .. GDDMSPEC ** .. LIMIT ** .. MAINTID ** .. MAXREC ** .. MINPATHS ** .. MODEL ** .. MONCACHE ** .. MONCOLL ** .. MSGCLEAR ** .. MSGWAIT ** .. NUMBERS ** .. PFKEY ** .. PROCESS ** .. RMTLINES ** .. SCROLL ** .. SEARCH ** .. SECUSER ** .. SETEVENT ** .. SETTINGS ** .. TIMSTAMP ** .. UCLASS ** .. UPDTCMS ** .. UPDTSCRN ** .. USERBOTL ** .. USERHDR *
212 Linux on IBM Eserver zSeries and S/390: Performance Toolkit for VM
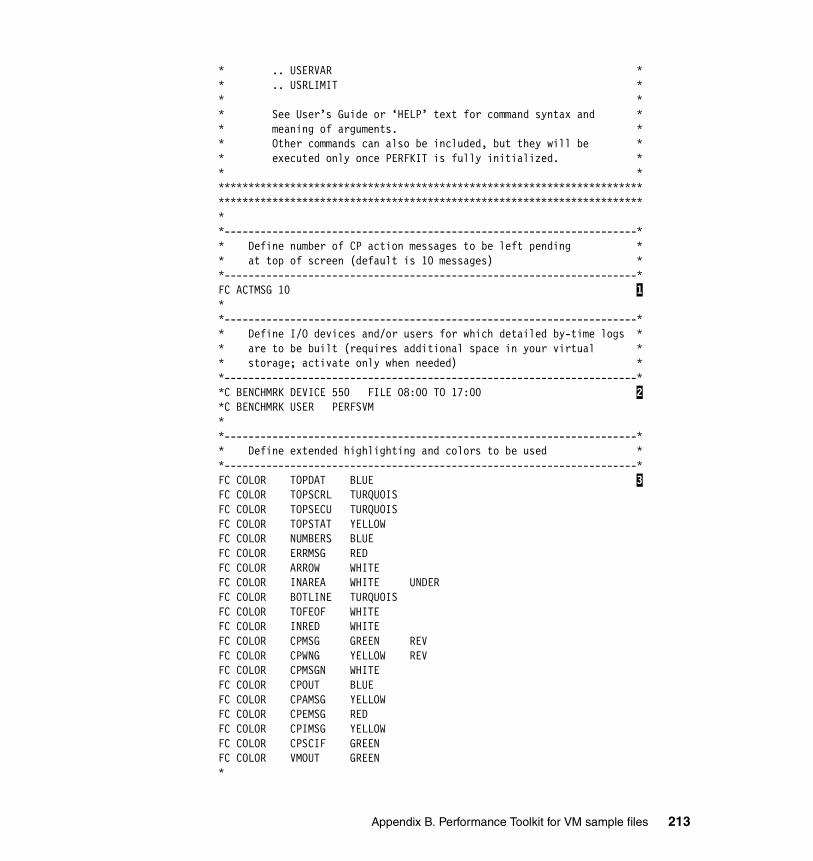
* .. USERVAR ** .. USRLIMIT ** ** See User’s Guide or ‘HELP’ text for command syntax and ** meaning of arguments. ** Other commands can also be included, but they will be ** executed only once PERFKIT is fully initialized. ** *************************************************************************************************************************************************---------------------------------------------------------------------** Define number of CP action messages to be left pending ** at top of screen (default is 10 messages) **---------------------------------------------------------------------*FC ACTMSG 10 1 **---------------------------------------------------------------------** Define I/O devices and/or users for which detailed by-time logs ** are to be built (requires additional space in your virtual ** storage; activate only when needed) **---------------------------------------------------------------------**C BENCHMRK DEVICE 550 FILE 08:00 TO 17:00 2 *C BENCHMRK USER PERFSVM **---------------------------------------------------------------------** Define extended highlighting and colors to be used **---------------------------------------------------------------------*FC COLOR TOPDAT BLUE 3 FC COLOR TOPSCRL TURQUOISFC COLOR TOPSECU TURQUOISFC COLOR TOPSTAT YELLOWFC COLOR NUMBERS BLUEFC COLOR ERRMSG REDFC COLOR ARROW WHITEFC COLOR INAREA WHITE UNDERFC COLOR BOTLINE TURQUOISFC COLOR TOFEOF WHITEFC COLOR INRED WHITEFC COLOR CPMSG GREEN REVFC COLOR CPWNG YELLOW REVFC COLOR CPMSGN WHITEFC COLOR CPOUT BLUEFC COLOR CPAMSG YELLOWFC COLOR CPEMSG REDFC COLOR CPIMSG YELLOWFC COLOR CPSCIF GREENFC COLOR VMOUT GREEN*
Appendix B. Performance Toolkit for VM sample files 213
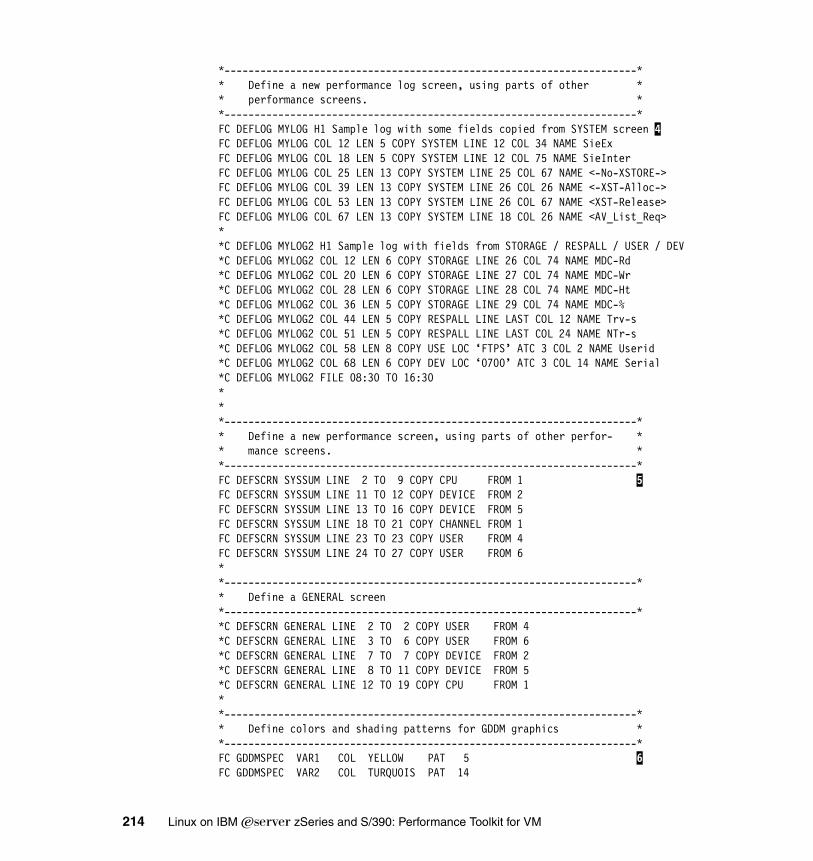
*---------------------------------------------------------------------** Define a new performance log screen, using parts of other ** performance screens. **---------------------------------------------------------------------*FC DEFLOG MYLOG H1 Sample log with some fields copied from SYSTEM screen 4 FC DEFLOG MYLOG COL 12 LEN 5 COPY SYSTEM LINE 12 COL 34 NAME SieExFC DEFLOG MYLOG COL 18 LEN 5 COPY SYSTEM LINE 12 COL 75 NAME SieInterFC DEFLOG MYLOG COL 25 LEN 13 COPY SYSTEM LINE 25 COL 67 NAME <-No-XSTORE->FC DEFLOG MYLOG COL 39 LEN 13 COPY SYSTEM LINE 26 COL 26 NAME <-XST-Alloc->FC DEFLOG MYLOG COL 53 LEN 13 COPY SYSTEM LINE 26 COL 67 NAME <XST-Release>FC DEFLOG MYLOG COL 67 LEN 13 COPY SYSTEM LINE 18 COL 26 NAME <AV_List_Req>**C DEFLOG MYLOG2 H1 Sample log with fields from STORAGE / RESPALL / USER / DEV*C DEFLOG MYLOG2 COL 12 LEN 6 COPY STORAGE LINE 26 COL 74 NAME MDC-Rd*C DEFLOG MYLOG2 COL 20 LEN 6 COPY STORAGE LINE 27 COL 74 NAME MDC-Wr*C DEFLOG MYLOG2 COL 28 LEN 6 COPY STORAGE LINE 28 COL 74 NAME MDC-Ht*C DEFLOG MYLOG2 COL 36 LEN 5 COPY STORAGE LINE 29 COL 74 NAME MDC-%*C DEFLOG MYLOG2 COL 44 LEN 5 COPY RESPALL LINE LAST COL 12 NAME Trv-s*C DEFLOG MYLOG2 COL 51 LEN 5 COPY RESPALL LINE LAST COL 24 NAME NTr-s*C DEFLOG MYLOG2 COL 58 LEN 8 COPY USE LOC ‘FTPS’ ATC 3 COL 2 NAME Userid*C DEFLOG MYLOG2 COL 68 LEN 6 COPY DEV LOC ‘0700’ ATC 3 COL 14 NAME Serial*C DEFLOG MYLOG2 FILE 08:30 TO 16:30***---------------------------------------------------------------------** Define a new performance screen, using parts of other perfor- ** mance screens. **---------------------------------------------------------------------*FC DEFSCRN SYSSUM LINE 2 TO 9 COPY CPU FROM 1 5 FC DEFSCRN SYSSUM LINE 11 TO 12 COPY DEVICE FROM 2FC DEFSCRN SYSSUM LINE 13 TO 16 COPY DEVICE FROM 5FC DEFSCRN SYSSUM LINE 18 TO 21 COPY CHANNEL FROM 1FC DEFSCRN SYSSUM LINE 23 TO 23 COPY USER FROM 4FC DEFSCRN SYSSUM LINE 24 TO 27 COPY USER FROM 6**---------------------------------------------------------------------** Define a GENERAL screen*---------------------------------------------------------------------**C DEFSCRN GENERAL LINE 2 TO 2 COPY USER FROM 4*C DEFSCRN GENERAL LINE 3 TO 6 COPY USER FROM 6*C DEFSCRN GENERAL LINE 7 TO 7 COPY DEVICE FROM 2*C DEFSCRN GENERAL LINE 8 TO 11 COPY DEVICE FROM 5*C DEFSCRN GENERAL LINE 12 TO 19 COPY CPU FROM 1**---------------------------------------------------------------------** Define colors and shading patterns for GDDM graphics **---------------------------------------------------------------------*FC GDDMSPEC VAR1 COL YELLOW PAT 5 6 FC GDDMSPEC VAR2 COL TURQUOIS PAT 14
214 Linux on IBM Eserver zSeries and S/390: Performance Toolkit for VM
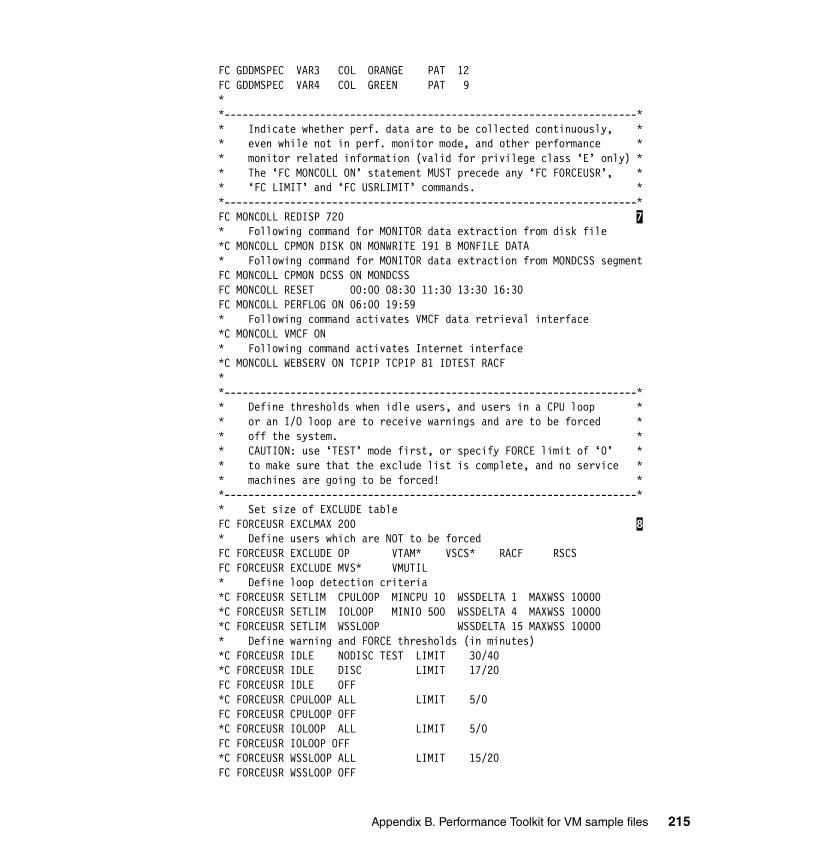
FC GDDMSPEC VAR3 COL ORANGE PAT 12FC GDDMSPEC VAR4 COL GREEN PAT 9**---------------------------------------------------------------------** Indicate whether perf. data are to be collected continuously, ** even while not in perf. monitor mode, and other performance ** monitor related information (valid for privilege class ‘E’ only) ** The ‘FC MONCOLL ON’ statement MUST precede any ‘FC FORCEUSR’, ** ‘FC LIMIT’ and ‘FC USRLIMIT’ commands. **---------------------------------------------------------------------*FC MONCOLL REDISP 720 7 * Following command for MONITOR data extraction from disk file*C MONCOLL CPMON DISK ON MONWRITE 191 B MONFILE DATA* Following command for MONITOR data extraction from MONDCSS segmentFC MONCOLL CPMON DCSS ON MONDCSSFC MONCOLL RESET 00:00 08:30 11:30 13:30 16:30FC MONCOLL PERFLOG ON 06:00 19:59* Following command activates VMCF data retrieval interface*C MONCOLL VMCF ON* Following command activates Internet interface*C MONCOLL WEBSERV ON TCPIP TCPIP 81 IDTEST RACF**---------------------------------------------------------------------** Define thresholds when idle users, and users in a CPU loop ** or an I/O loop are to receive warnings and are to be forced ** off the system. ** CAUTION: use ‘TEST’ mode first, or specify FORCE limit of ‘0’ ** to make sure that the exclude list is complete, and no service ** machines are going to be forced! **---------------------------------------------------------------------** Set size of EXCLUDE tableFC FORCEUSR EXCLMAX 200 8 * Define users which are NOT to be forcedFC FORCEUSR EXCLUDE OP VTAM* VSCS* RACF RSCSFC FORCEUSR EXCLUDE MVS* VMUTIL* Define loop detection criteria*C FORCEUSR SETLIM CPULOOP MINCPU 10 WSSDELTA 1 MAXWSS 10000*C FORCEUSR SETLIM IOLOOP MINIO 500 WSSDELTA 4 MAXWSS 10000*C FORCEUSR SETLIM WSSLOOP WSSDELTA 15 MAXWSS 10000* Define warning and FORCE thresholds (in minutes)*C FORCEUSR IDLE NODISC TEST LIMIT 30/40*C FORCEUSR IDLE DISC LIMIT 17/20FC FORCEUSR IDLE OFF*C FORCEUSR CPULOOP ALL LIMIT 5/0FC FORCEUSR CPULOOP OFF*C FORCEUSR IOLOOP ALL LIMIT 5/0FC FORCEUSR IOLOOP OFF*C FORCEUSR WSSLOOP ALL LIMIT 15/20FC FORCEUSR WSSLOOP OFF
Appendix B. Performance Toolkit for VM sample files 215
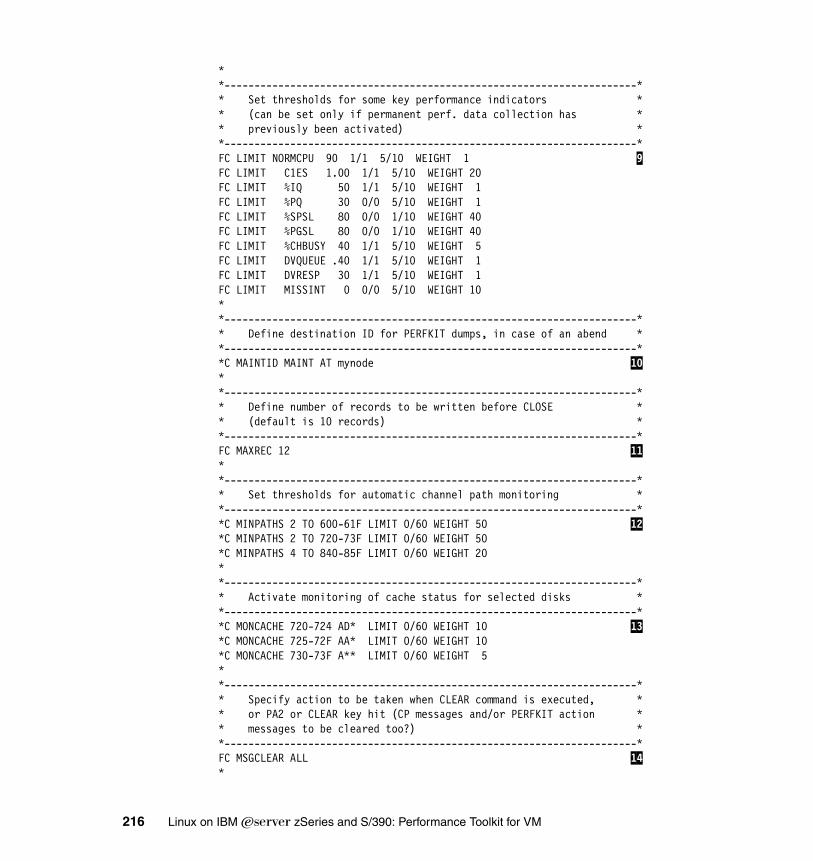
**---------------------------------------------------------------------** Set thresholds for some key performance indicators ** (can be set only if permanent perf. data collection has ** previously been activated) **---------------------------------------------------------------------*FC LIMIT NORMCPU 90 1/1 5/10 WEIGHT 1 9 FC LIMIT C1ES 1.00 1/1 5/10 WEIGHT 20FC LIMIT %IQ 50 1/1 5/10 WEIGHT 1FC LIMIT %PQ 30 0/0 5/10 WEIGHT 1FC LIMIT %SPSL 80 0/0 1/10 WEIGHT 40FC LIMIT %PGSL 80 0/0 1/10 WEIGHT 40FC LIMIT %CHBUSY 40 1/1 5/10 WEIGHT 5FC LIMIT DVQUEUE .40 1/1 5/10 WEIGHT 1FC LIMIT DVRESP 30 1/1 5/10 WEIGHT 1FC LIMIT MISSINT 0 0/0 5/10 WEIGHT 10**---------------------------------------------------------------------** Define destination ID for PERFKIT dumps, in case of an abend **---------------------------------------------------------------------**C MAINTID MAINT AT mynode 10 **---------------------------------------------------------------------** Define number of records to be written before CLOSE ** (default is 10 records) **---------------------------------------------------------------------*FC MAXREC 12 11 **---------------------------------------------------------------------** Set thresholds for automatic channel path monitoring **---------------------------------------------------------------------**C MINPATHS 2 TO 600-61F LIMIT 0/60 WEIGHT 50 12 *C MINPATHS 2 TO 720-73F LIMIT 0/60 WEIGHT 50*C MINPATHS 4 TO 840-85F LIMIT 0/60 WEIGHT 20**---------------------------------------------------------------------** Activate monitoring of cache status for selected disks **---------------------------------------------------------------------**C MONCACHE 720-724 AD* LIMIT 0/60 WEIGHT 10 13 *C MONCACHE 725-72F AA* LIMIT 0/60 WEIGHT 10*C MONCACHE 730-73F A** LIMIT 0/60 WEIGHT 5**---------------------------------------------------------------------** Specify action to be taken when CLEAR command is executed, ** or PA2 or CLEAR key hit (CP messages and/or PERFKIT action ** messages to be cleared too?) **---------------------------------------------------------------------*FC MSGCLEAR ALL 14 *
216 Linux on IBM Eserver zSeries and S/390: Performance Toolkit for VM
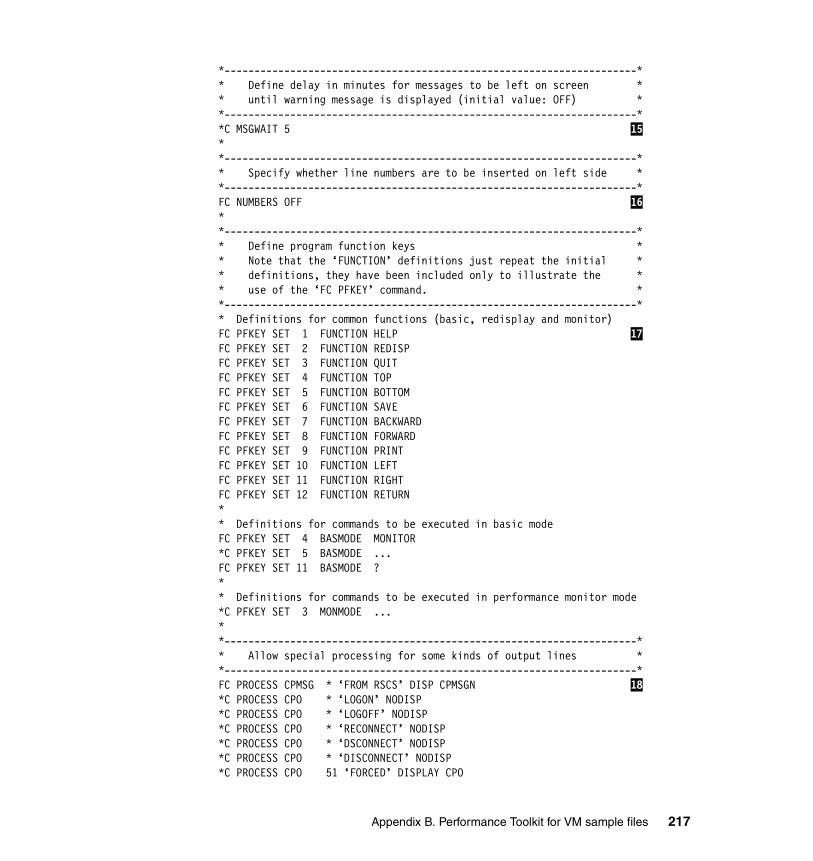
*---------------------------------------------------------------------** Define delay in minutes for messages to be left on screen ** until warning message is displayed (initial value: OFF) **---------------------------------------------------------------------**C MSGWAIT 5 15 **---------------------------------------------------------------------** Specify whether line numbers are to be inserted on left side **---------------------------------------------------------------------*FC NUMBERS OFF 16 **---------------------------------------------------------------------** Define program function keys ** Note that the ‘FUNCTION’ definitions just repeat the initial ** definitions, they have been included only to illustrate the ** use of the ‘FC PFKEY’ command. **---------------------------------------------------------------------** Definitions for common functions (basic, redisplay and monitor)FC PFKEY SET 1 FUNCTION HELP 17 FC PFKEY SET 2 FUNCTION REDISPFC PFKEY SET 3 FUNCTION QUITFC PFKEY SET 4 FUNCTION TOPFC PFKEY SET 5 FUNCTION BOTTOMFC PFKEY SET 6 FUNCTION SAVEFC PFKEY SET 7 FUNCTION BACKWARDFC PFKEY SET 8 FUNCTION FORWARDFC PFKEY SET 9 FUNCTION PRINTFC PFKEY SET 10 FUNCTION LEFTFC PFKEY SET 11 FUNCTION RIGHTFC PFKEY SET 12 FUNCTION RETURN** Definitions for commands to be executed in basic modeFC PFKEY SET 4 BASMODE MONITOR*C PFKEY SET 5 BASMODE ...FC PFKEY SET 11 BASMODE ?** Definitions for commands to be executed in performance monitor mode*C PFKEY SET 3 MONMODE ...**---------------------------------------------------------------------** Allow special processing for some kinds of output lines **---------------------------------------------------------------------*FC PROCESS CPMSG * ‘FROM RSCS’ DISP CPMSGN 18 *C PROCESS CPO * ‘LOGON’ NODISP*C PROCESS CPO * ‘LOGOFF’ NODISP*C PROCESS CPO * ‘RECONNECT’ NODISP*C PROCESS CPO * ‘DSCONNECT’ NODISP*C PROCESS CPO * ‘DISCONNECT’ NODISP*C PROCESS CPO 51 ‘FORCED’ DISPLAY CPO
Appendix B. Performance Toolkit for VM sample files 217
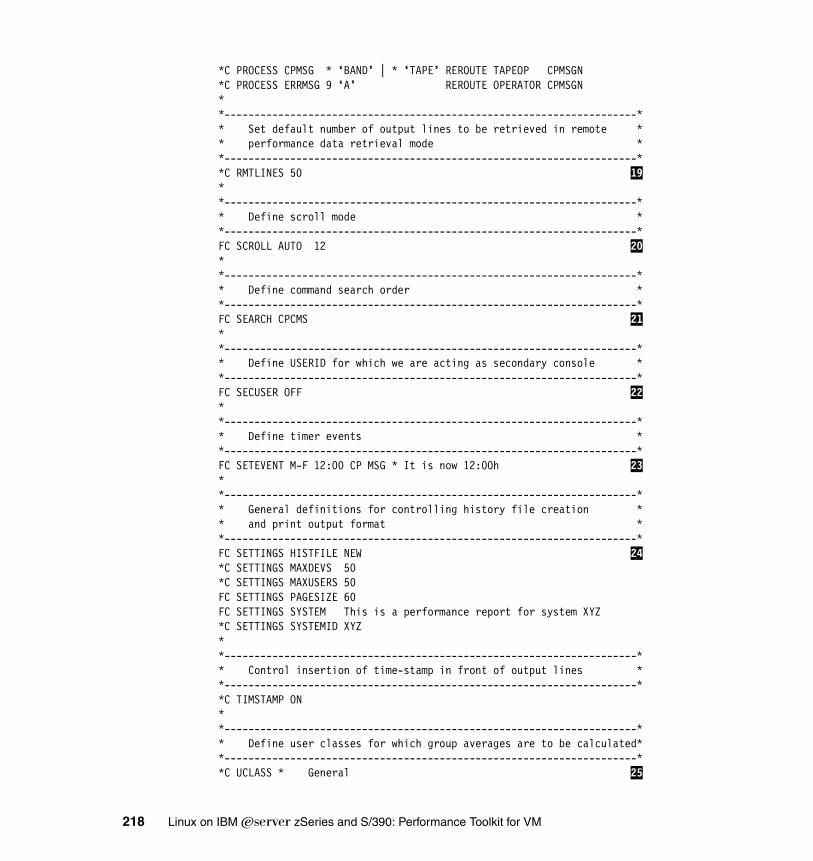
*C PROCESS CPMSG * ‘BAND’ | * ‘TAPE’ REROUTE TAPEOP CPMSGN*C PROCESS ERRMSG 9 ‘A’ REROUTE OPERATOR CPMSGN**---------------------------------------------------------------------** Set default number of output lines to be retrieved in remote ** performance data retrieval mode **---------------------------------------------------------------------**C RMTLINES 50 19 **---------------------------------------------------------------------** Define scroll mode **---------------------------------------------------------------------*FC SCROLL AUTO 12 20 **---------------------------------------------------------------------** Define command search order **---------------------------------------------------------------------*FC SEARCH CPCMS 21 **---------------------------------------------------------------------** Define USERID for which we are acting as secondary console **---------------------------------------------------------------------*FC SECUSER OFF 22 **---------------------------------------------------------------------** Define timer events **---------------------------------------------------------------------*FC SETEVENT M-F 12:00 CP MSG * It is now 12:00h 23 **---------------------------------------------------------------------** General definitions for controlling history file creation ** and print output format **---------------------------------------------------------------------*FC SETTINGS HISTFILE NEW 24 *C SETTINGS MAXDEVS 50*C SETTINGS MAXUSERS 50FC SETTINGS PAGESIZE 60FC SETTINGS SYSTEM This is a performance report for system XYZ*C SETTINGS SYSTEMID XYZ**---------------------------------------------------------------------** Control insertion of time-stamp in front of output lines **---------------------------------------------------------------------**C TIMSTAMP ON **---------------------------------------------------------------------** Define user classes for which group averages are to be calculated**---------------------------------------------------------------------**C UCLASS * General 25
218 Linux on IBM Eserver zSeries and S/390: Performance Toolkit for VM
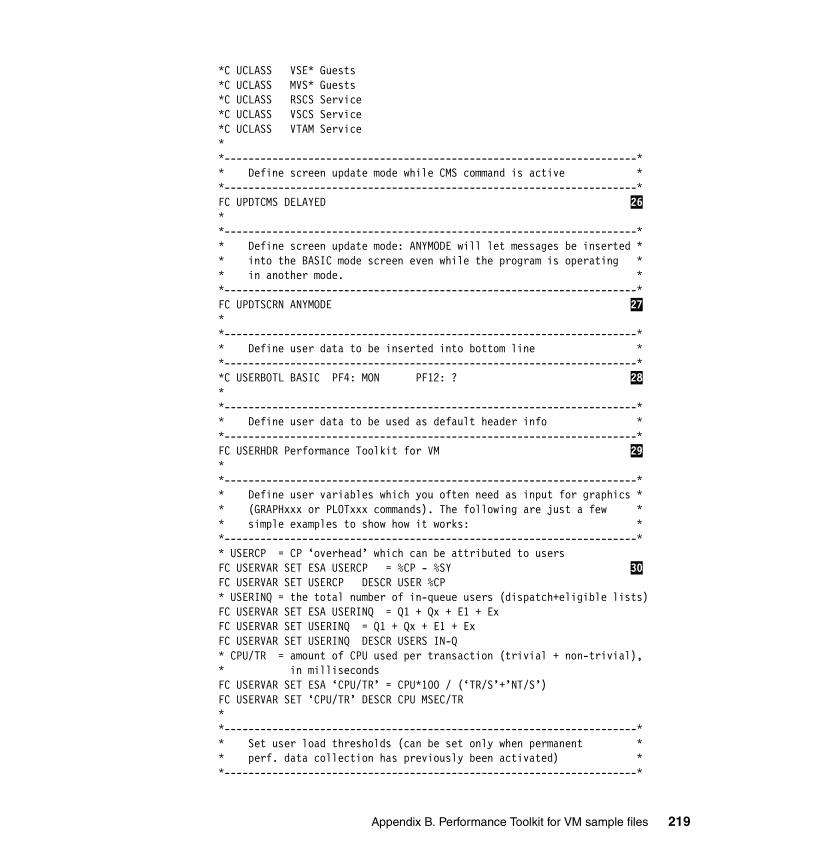
*C UCLASS VSE* Guests*C UCLASS MVS* Guests*C UCLASS RSCS Service*C UCLASS VSCS Service*C UCLASS VTAM Service**---------------------------------------------------------------------** Define screen update mode while CMS command is active **---------------------------------------------------------------------*FC UPDTCMS DELAYED 26 **---------------------------------------------------------------------** Define screen update mode: ANYMODE will let messages be inserted ** into the BASIC mode screen even while the program is operating ** in another mode. **---------------------------------------------------------------------*FC UPDTSCRN ANYMODE 27 **---------------------------------------------------------------------** Define user data to be inserted into bottom line **---------------------------------------------------------------------**C USERBOTL BASIC PF4: MON PF12: ? 28 **---------------------------------------------------------------------** Define user data to be used as default header info **---------------------------------------------------------------------*FC USERHDR Performance Toolkit for VM 29 **---------------------------------------------------------------------** Define user variables which you often need as input for graphics ** (GRAPHxxx or PLOTxxx commands). The following are just a few ** simple examples to show how it works: **---------------------------------------------------------------------** USERCP = CP ‘overhead’ which can be attributed to usersFC USERVAR SET ESA USERCP = %CP - %SY 30 FC USERVAR SET USERCP DESCR USER %CP* USERINQ = the total number of in-queue users (dispatch+eligible lists)FC USERVAR SET ESA USERINQ = Q1 + Qx + E1 + ExFC USERVAR SET USERINQ = Q1 + Qx + E1 + ExFC USERVAR SET USERINQ DESCR USERS IN-Q* CPU/TR = amount of CPU used per transaction (trivial + non-trivial),* in millisecondsFC USERVAR SET ESA ‘CPU/TR’ = CPU*100 / (‘TR/S’+’NT/S’)FC USERVAR SET ‘CPU/TR’ DESCR CPU MSEC/TR**---------------------------------------------------------------------** Set user load thresholds (can be set only when permanent ** perf. data collection has previously been activated) **---------------------------------------------------------------------*
Appendix B. Performance Toolkit for VM sample files 219
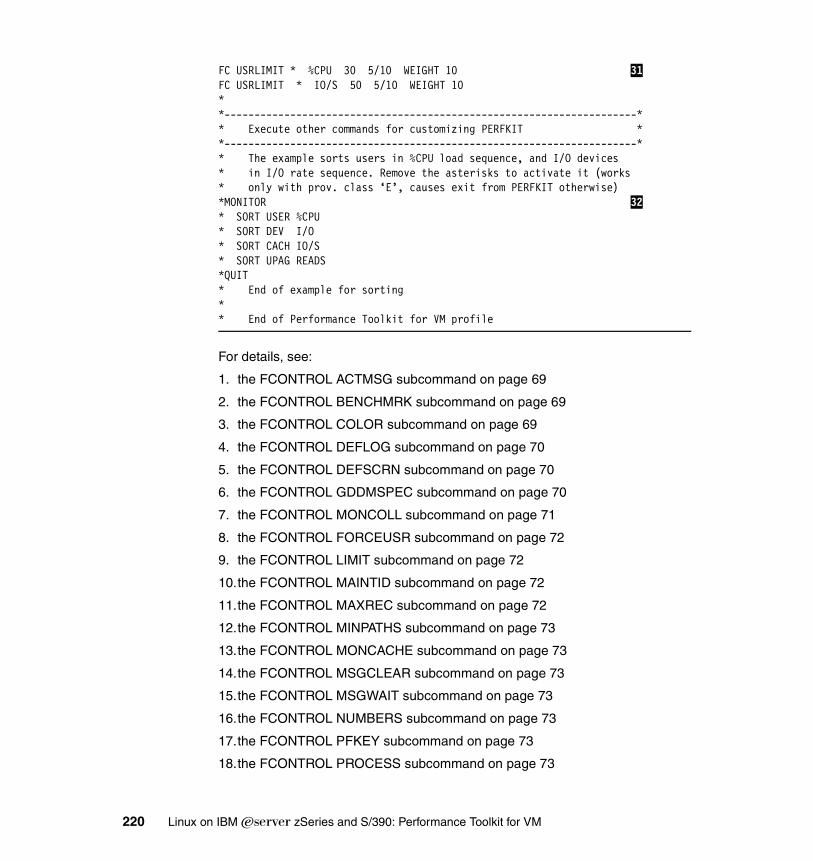
FC USRLIMIT * %CPU 30 5/10 WEIGHT 10 31 FC USRLIMIT * IO/S 50 5/10 WEIGHT 10**---------------------------------------------------------------------** Execute other commands for customizing PERFKIT **---------------------------------------------------------------------** The example sorts users in %CPU load sequence, and I/O devices* in I/O rate sequence. Remove the asterisks to activate it (works* only with prov. class ‘E’, causes exit from PERFKIT otherwise)*MONITOR 32 * SORT USER %CPU* SORT DEV I/O* SORT CACH IO/S* SORT UPAG READS*QUIT* End of example for sorting** End of Performance Toolkit for VM profile
For details, see:
1. the FCONTROL ACTMSG subcommand on page 69
2. the FCONTROL BENCHMRK subcommand on page 69
3. the FCONTROL COLOR subcommand on page 69
4. the FCONTROL DEFLOG subcommand on page 70
5. the FCONTROL DEFSCRN subcommand on page 70
6. the FCONTROL GDDMSPEC subcommand on page 70
7. the FCONTROL MONCOLL subcommand on page 71
8. the FCONTROL FORCEUSR subcommand on page 72
9. the FCONTROL LIMIT subcommand on page 72
10.the FCONTROL MAINTID subcommand on page 72
11.the FCONTROL MAXREC subcommand on page 72
12.the FCONTROL MINPATHS subcommand on page 73
13.the FCONTROL MONCACHE subcommand on page 73
14.the FCONTROL MSGCLEAR subcommand on page 73
15.the FCONTROL MSGWAIT subcommand on page 73
16.the FCONTROL NUMBERS subcommand on page 73
17.the FCONTROL PFKEY subcommand on page 73
18.the FCONTROL PROCESS subcommand on page 73
220 Linux on IBM Eserver zSeries and S/390: Performance Toolkit for VM
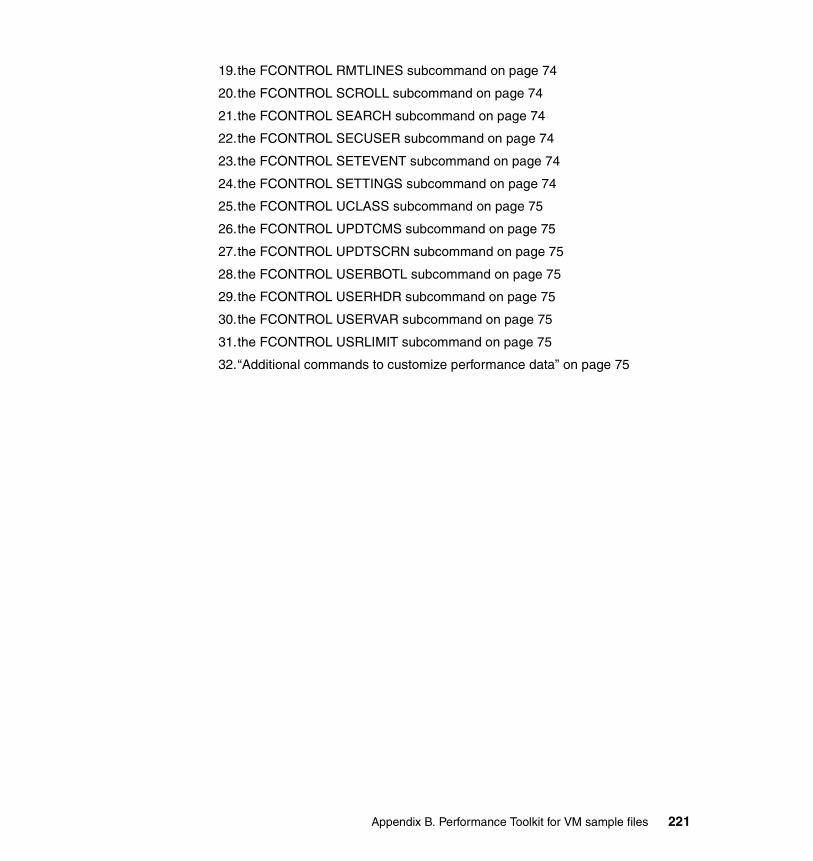
19.the FCONTROL RMTLINES subcommand on page 74
20.the FCONTROL SCROLL subcommand on page 74
21.the FCONTROL SEARCH subcommand on page 74
22.the FCONTROL SECUSER subcommand on page 74
23.the FCONTROL SETEVENT subcommand on page 74
24.the FCONTROL SETTINGS subcommand on page 74
25.the FCONTROL UCLASS subcommand on page 75
26.the FCONTROL UPDTCMS subcommand on page 75
27.the FCONTROL UPDTSCRN subcommand on page 75
28.the FCONTROL USERBOTL subcommand on page 75
29.the FCONTROL USERHDR subcommand on page 75
30.the FCONTROL USERVAR subcommand on page 75
31.the FCONTROL USRLIMIT subcommand on page 75
32.“Additional commands to customize performance data” on page 75
Appendix B. Performance Toolkit for VM sample files 221

222 Linux on IBM Eserver zSeries and S/390: Performance Toolkit for VM
Appendix C. Adding VM page space
This appendix explains how to dynamically add page space to z/VM without system interruption. Note that the process is the same for adding spool space.
This appendix covers the following steps:
� Verifying the current space allocation
� Formatting a volume for CP
� Allocating the page area
� Adding the volume to the list of CP-owned DASD
� Validating the CP-owned addition
� Verifying that the page space was detected by CP
� Making the dynamic change permanent in the SYSTEM CONFIG file
� Optional:
– Adding new page volume to MAINT’s directory as a full pack minidisk
– Adding cylinder zero of the new page volume to the $ALLOC$ directory
– Adding the new page area to the $PAGE$ directory
C
© Copyright IBM Corp. 2004. All rights reserved. 223
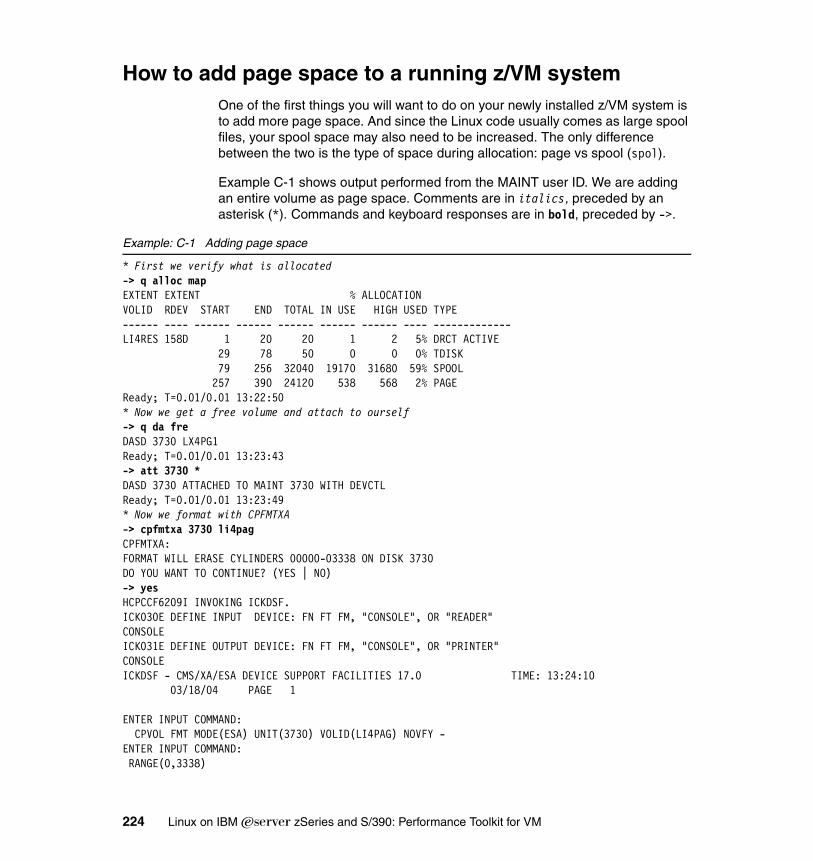
How to add page space to a running z/VM systemOne of the first things you will want to do on your newly installed z/VM system is to add more page space. And since the Linux code usually comes as large spool files, your spool space may also need to be increased. The only difference between the two is the type of space during allocation: page vs spool (spol).
Example C-1 shows output performed from the MAINT user ID. We are adding an entire volume as page space. Comments are in italics, preceded by an asterisk (*). Commands and keyboard responses are in bold, preceded by ->.
Example: C-1 Adding page space
* First we verify what is allocated-> q alloc mapEXTENT EXTENT % ALLOCATION VOLID RDEV START END TOTAL IN USE HIGH USED TYPE ------ ---- ------ ------ ------ ------ ------ ---- -------------LI4RES 158D 1 20 20 1 2 5% DRCT ACTIVE 29 78 50 0 0 0% TDISK 79 256 32040 19170 31680 59% SPOOL 257 390 24120 538 568 2% PAGE Ready; T=0.01/0.01 13:22:50* Now we get a free volume and attach to ourself-> q da fre DASD 3730 LX4PG1 Ready; T=0.01/0.01 13:23:43 -> att 3730 * DASD 3730 ATTACHED TO MAINT 3730 WITH DEVCTLReady; T=0.01/0.01 13:23:49 * Now we format with CPFMTXA-> cpfmtxa 3730 li4pag CPFMTXA: FORMAT WILL ERASE CYLINDERS 00000-03338 ON DISK 3730 DO YOU WANT TO CONTINUE? (YES | NO) -> yes HCPCCF6209I INVOKING ICKDSF. ICK030E DEFINE INPUT DEVICE: FN FT FM, "CONSOLE", OR "READER" CONSOLE ICK031E DEFINE OUTPUT DEVICE: FN FT FM, "CONSOLE", OR "PRINTER" CONSOLE ICKDSF - CMS/XA/ESA DEVICE SUPPORT FACILITIES 17.0 TIME: 13:24:10 03/18/04 PAGE 1 ENTER INPUT COMMAND: CPVOL FMT MODE(ESA) UNIT(3730) VOLID(LI4PAG) NOVFY - ENTER INPUT COMMAND: RANGE(0,3338)
224 Linux on IBM Eserver zSeries and S/390: Performance Toolkit for VM
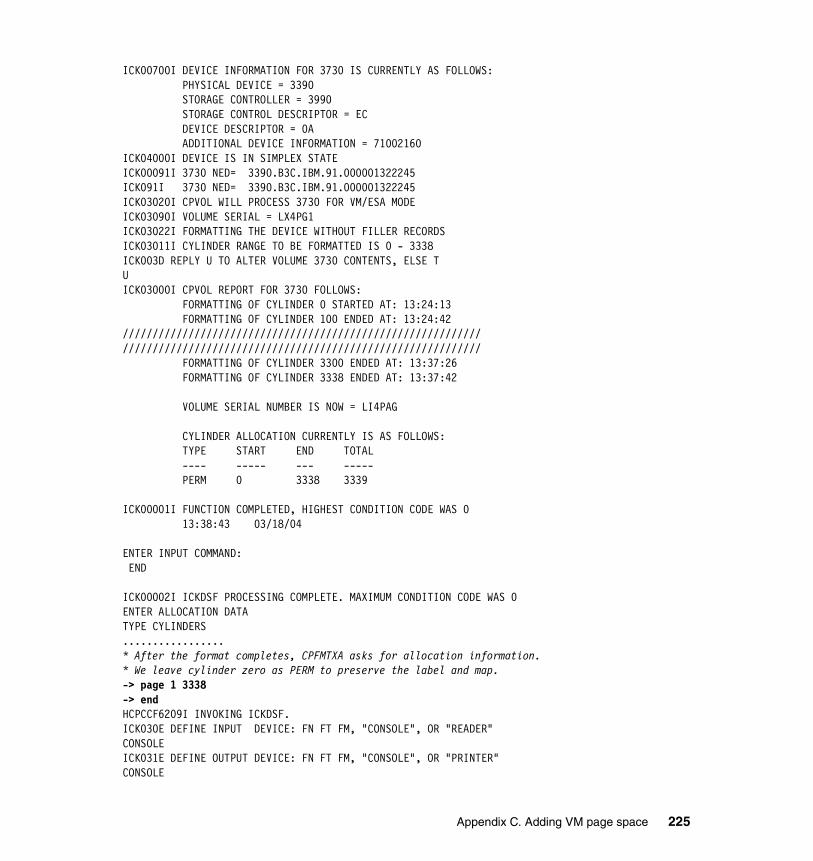
ICK00700I DEVICE INFORMATION FOR 3730 IS CURRENTLY AS FOLLOWS: PHYSICAL DEVICE = 3390 STORAGE CONTROLLER = 3990 STORAGE CONTROL DESCRIPTOR = EC DEVICE DESCRIPTOR = 0A ADDITIONAL DEVICE INFORMATION = 71002160 ICK04000I DEVICE IS IN SIMPLEX STATE ICK00091I 3730 NED= 3390.B3C.IBM.91.000001322245 ICK091I 3730 NED= 3390.B3C.IBM.91.000001322245 ICK03020I CPVOL WILL PROCESS 3730 FOR VM/ESA MODE ICK03090I VOLUME SERIAL = LX4PG1 ICK03022I FORMATTING THE DEVICE WITHOUT FILLER RECORDS ICK03011I CYLINDER RANGE TO BE FORMATTED IS 0 - 3338 ICK003D REPLY U TO ALTER VOLUME 3730 CONTENTS, ELSE T U ICK03000I CPVOL REPORT FOR 3730 FOLLOWS: FORMATTING OF CYLINDER 0 STARTED AT: 13:24:13 FORMATTING OF CYLINDER 100 ENDED AT: 13:24:42 //////////////////////////////////////////////////////////// //////////////////////////////////////////////////////////// FORMATTING OF CYLINDER 3300 ENDED AT: 13:37:26 FORMATTING OF CYLINDER 3338 ENDED AT: 13:37:42 VOLUME SERIAL NUMBER IS NOW = LI4PAG CYLINDER ALLOCATION CURRENTLY IS AS FOLLOWS: TYPE START END TOTAL ---- ----- --- ----- PERM 0 3338 3339 ICK00001I FUNCTION COMPLETED, HIGHEST CONDITION CODE WAS 0 13:38:43 03/18/04 ENTER INPUT COMMAND: END ICK00002I ICKDSF PROCESSING COMPLETE. MAXIMUM CONDITION CODE WAS 0ENTER ALLOCATION DATA TYPE CYLINDERS .................* After the format completes, CPFMTXA asks for allocation information.* We leave cylinder zero as PERM to preserve the label and map.-> page 1 3338 -> end HCPCCF6209I INVOKING ICKDSF. ICK030E DEFINE INPUT DEVICE: FN FT FM, "CONSOLE", OR "READER" CONSOLE ICK031E DEFINE OUTPUT DEVICE: FN FT FM, "CONSOLE", OR "PRINTER" CONSOLE
Appendix C. Adding VM page space 225
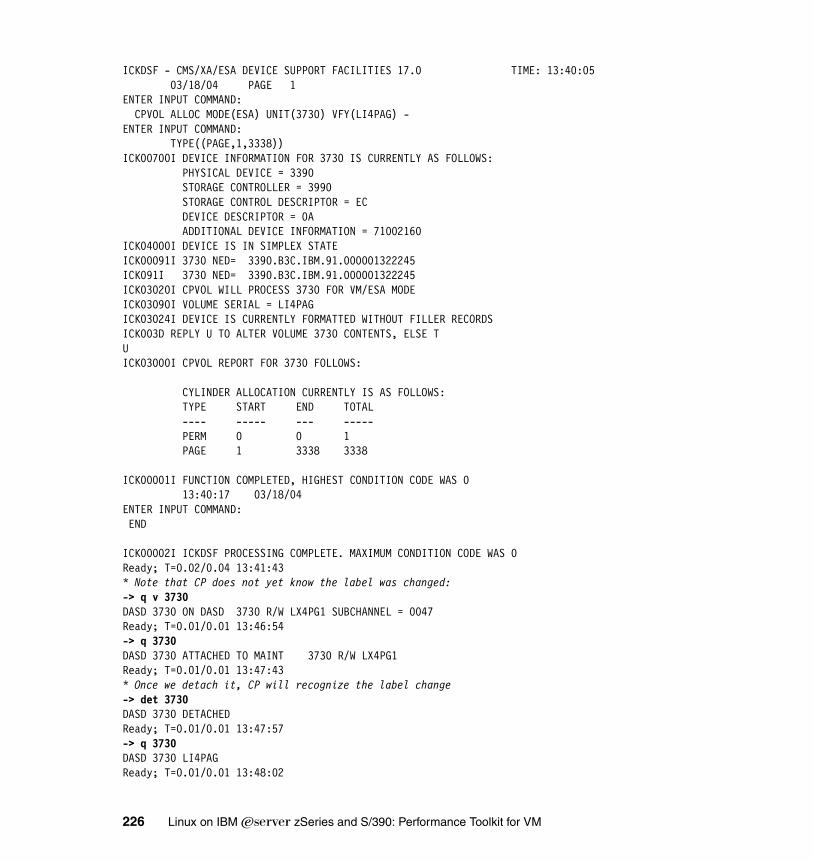
ICKDSF - CMS/XA/ESA DEVICE SUPPORT FACILITIES 17.0 TIME: 13:40:05 03/18/04 PAGE 1 ENTER INPUT COMMAND: CPVOL ALLOC MODE(ESA) UNIT(3730) VFY(LI4PAG) - ENTER INPUT COMMAND: TYPE((PAGE,1,3338)) ICK00700I DEVICE INFORMATION FOR 3730 IS CURRENTLY AS FOLLOWS: PHYSICAL DEVICE = 3390 STORAGE CONTROLLER = 3990 STORAGE CONTROL DESCRIPTOR = EC DEVICE DESCRIPTOR = 0A ADDITIONAL DEVICE INFORMATION = 71002160 ICK04000I DEVICE IS IN SIMPLEX STATE ICK00091I 3730 NED= 3390.B3C.IBM.91.000001322245 ICK091I 3730 NED= 3390.B3C.IBM.91.000001322245 ICK03020I CPVOL WILL PROCESS 3730 FOR VM/ESA MODE ICK03090I VOLUME SERIAL = LI4PAG ICK03024I DEVICE IS CURRENTLY FORMATTED WITHOUT FILLER RECORDS ICK003D REPLY U TO ALTER VOLUME 3730 CONTENTS, ELSE T U ICK03000I CPVOL REPORT FOR 3730 FOLLOWS: CYLINDER ALLOCATION CURRENTLY IS AS FOLLOWS: TYPE START END TOTAL ---- ----- --- ----- PERM 0 0 1 PAGE 1 3338 3338 ICK00001I FUNCTION COMPLETED, HIGHEST CONDITION CODE WAS 0 13:40:17 03/18/04 ENTER INPUT COMMAND: END ICK00002I ICKDSF PROCESSING COMPLETE. MAXIMUM CONDITION CODE WAS 0Ready; T=0.02/0.04 13:41:43* Note that CP does not yet know the label was changed:-> q v 3730 DASD 3730 ON DASD 3730 R/W LX4PG1 SUBCHANNEL = 0047 Ready; T=0.01/0.01 13:46:54 -> q 3730 DASD 3730 ATTACHED TO MAINT 3730 R/W LX4PG1 Ready; T=0.01/0.01 13:47:43* Once we detach it, CP will recognize the label change-> det 3730 DASD 3730 DETACHED Ready; T=0.01/0.01 13:47:57 -> q 3730 DASD 3730 LI4PAG Ready; T=0.01/0.01 13:48:02
226 Linux on IBM Eserver zSeries and S/390: Performance Toolkit for VM
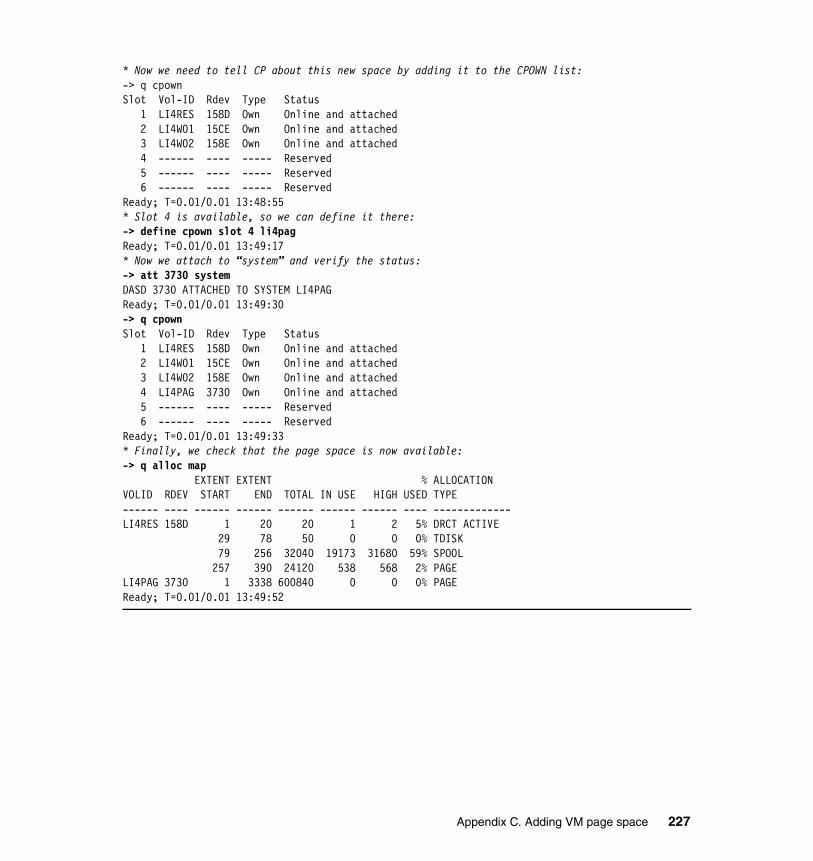
* Now we need to tell CP about this new space by adding it to the CPOWN list:-> q cpown Slot Vol-ID Rdev Type Status 1 LI4RES 158D Own Online and attached 2 LI4W01 15CE Own Online and attached 3 LI4W02 158E Own Online and attached 4 ------ ---- ----- Reserved 5 ------ ---- ----- Reserved 6 ------ ---- ----- Reserved Ready; T=0.01/0.01 13:48:55 * Slot 4 is available, so we can define it there:-> define cpown slot 4 li4pag Ready; T=0.01/0.01 13:49:17* Now we attach to “system” and verify the status:-> att 3730 system DASD 3730 ATTACHED TO SYSTEM LI4PAG Ready; T=0.01/0.01 13:49:30 -> q cpown Slot Vol-ID Rdev Type Status 1 LI4RES 158D Own Online and attached 2 LI4W01 15CE Own Online and attached 3 LI4W02 158E Own Online and attached 4 LI4PAG 3730 Own Online and attached 5 ------ ---- ----- Reserved 6 ------ ---- ----- Reserved Ready; T=0.01/0.01 13:49:33* Finally, we check that the page space is now available:-> q alloc map EXTENT EXTENT % ALLOCATION VOLID RDEV START END TOTAL IN USE HIGH USED TYPE ------ ---- ------ ------ ------ ------ ------ ---- -------------LI4RES 158D 1 20 20 1 2 5% DRCT ACTIVE 29 78 50 0 0 0% TDISK 79 256 32040 19173 31680 59% SPOOL 257 390 24120 538 568 2% PAGE LI4PAG 3730 1 3338 600840 0 0 0% PAGE Ready; T=0.01/0.01 13:49:52
Appendix C. Adding VM page space 227
Making the dynamic change permanentIn order for the above change to stay in effect across IPLs, you must change the following line in the SYSTEM CONFIG file:
CP_Owned Slot 4 RESERVED to CP_Owned Slot 4 LI4PAG
To accomplish this, execute the following commands:
� cprelease a
� link * cf1 cf1 mr
� access cf1 e
� xedit system config e
Make the change to slot 4 and file
� detach cf1
� cpaccess maint cf1 a sr
Optional stepsWhen your system is installed, the CP-owned volumes are defined to the MAINT user ID as full pack minidisks, at virtual addresses 123, 124, and so on. The advantage is that you do not have to attach these volumes, because you can already work with them at these virtual addresses. You can do the same with your new page volume by adding this line to MAINT’s directory:
MDISK 126 3390 000 END LI4PAG MR
Also, there are some placeholder user IDs for CP areas, and for cylinder zero of CP-owned volumes. If you are running with DIRMAINT, they are no longer required, as DIRMAINT now detects these areas. If you wish to define your new volume to these user IDs, add the following line to the $ALLOC$ user ID:
MDISK A04 3390 000 001 LI4PAG R
And add the following line to the $PAGE$ user ID:
MDISK A04 3390 001 END LI4PAG R
Tip: When adding spool space dynamically, it is safer to update the SYSTEM CONFIG before you start. This way, if you have an outage and files got created in the new spool area, the warm and checkpoint areas will now have pointers to these files and will find them on the new spool area at the next IPL.
228 Linux on IBM Eserver zSeries and S/390: Performance Toolkit for VM
Appendix D. Sample tools
This appendix provides some sample EXECs that can complement Performance Toolkit for VM.
D
Attention: This code is delivered as is. Use or adapt it as you see fit.
© Copyright IBM Corp. 2004. All rights reserved. 229
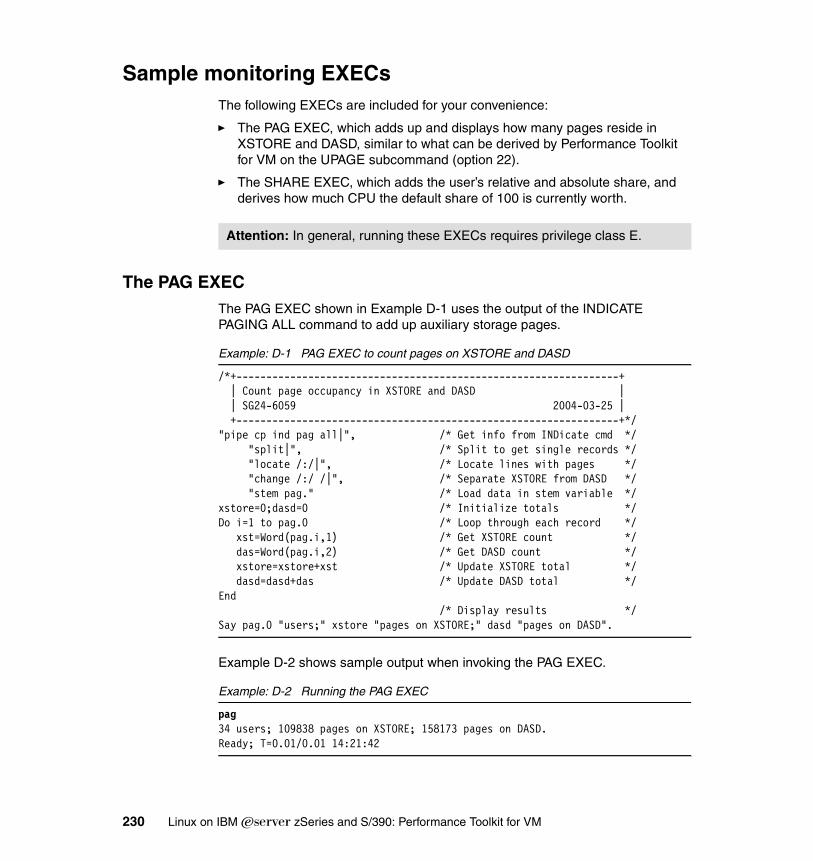
Sample monitoring EXECsThe following EXECs are included for your convenience:
� The PAG EXEC, which adds up and displays how many pages reside in XSTORE and DASD, similar to what can be derived by Performance Toolkit for VM on the UPAGE subcommand (option 22).
� The SHARE EXEC, which adds the user’s relative and absolute share, and derives how much CPU the default share of 100 is currently worth.
The PAG EXECThe PAG EXEC shown in Example D-1 uses the output of the INDICATE PAGING ALL command to add up auxiliary storage pages.
Example: D-1 PAG EXEC to count pages on XSTORE and DASD
/*+----------------------------------------------------------------+ | Count page occupancy in XSTORE and DASD | | SG24-6059 2004-03-25 | +----------------------------------------------------------------+*/ "pipe cp ind pag all|", /* Get info from INDicate cmd */ "split|", /* Split to get single records */ "locate /:/|", /* Locate lines with pages */ "change /:/ /|", /* Separate XSTORE from DASD */ "stem pag." /* Load data in stem variable */ xstore=0;dasd=0 /* Initialize totals */ Do i=1 to pag.0 /* Loop through each record */ xst=Word(pag.i,1) /* Get XSTORE count */ das=Word(pag.i,2) /* Get DASD count */ xstore=xstore+xst /* Update XSTORE total */ dasd=dasd+das /* Update DASD total */ End /* Display results */ Say pag.0 "users;" xstore "pages on XSTORE;" dasd "pages on DASD".
Example D-2 shows sample output when invoking the PAG EXEC.
Example: D-2 Running the PAG EXEC
pag 34 users; 109838 pages on XSTORE; 158173 pages on DASD.Ready; T=0.01/0.01 14:21:42
Attention: In general, running these EXECs requires privilege class E.
230 Linux on IBM Eserver zSeries and S/390: Performance Toolkit for VM
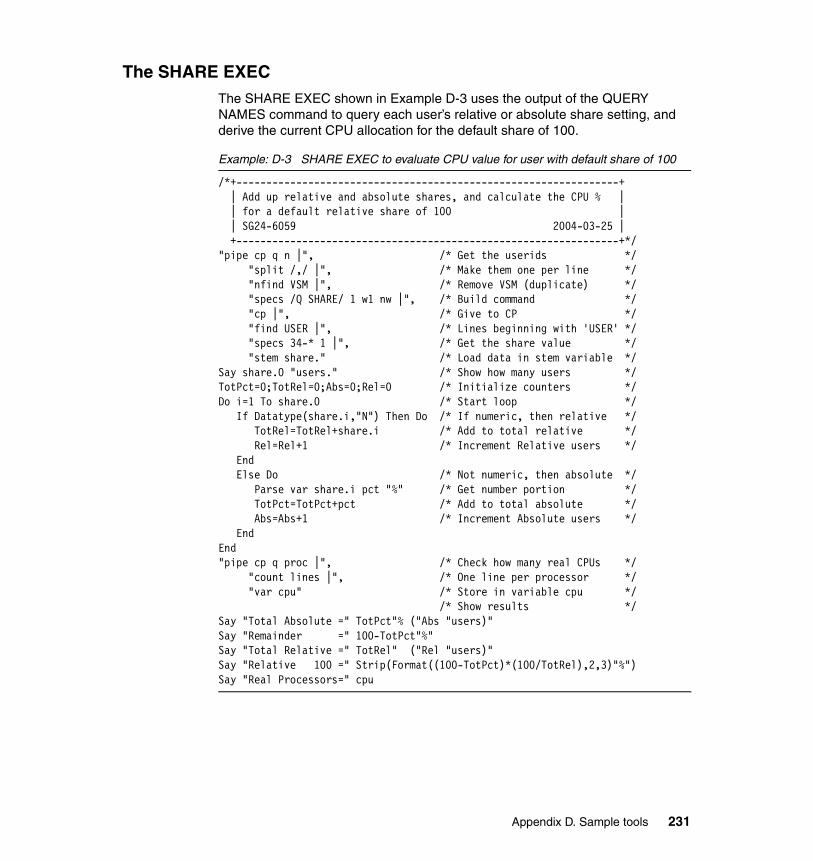
The SHARE EXECThe SHARE EXEC shown in Example D-3 uses the output of the QUERY NAMES command to query each user’s relative or absolute share setting, and derive the current CPU allocation for the default share of 100.
Example: D-3 SHARE EXEC to evaluate CPU value for user with default share of 100
/*+----------------------------------------------------------------+ | Add up relative and absolute shares, and calculate the CPU % | | for a default relative share of 100 | | SG24-6059 2004-03-25 | +----------------------------------------------------------------+*/ "pipe cp q n |", /* Get the userids */ "split /,/ |", /* Make them one per line */ "nfind VSM |", /* Remove VSM (duplicate) */ "specs /Q SHARE/ 1 w1 nw |", /* Build command */ "cp |", /* Give to CP */ "find USER |", /* Lines beginning with 'USER' */ "specs 34-* 1 |", /* Get the share value */ "stem share." /* Load data in stem variable */ Say share.0 "users." /* Show how many users */ TotPct=0;TotRel=0;Abs=0;Rel=0 /* Initialize counters */ Do i=1 To share.0 /* Start loop */ If Datatype(share.i,"N") Then Do /* If numeric, then relative */ TotRel=TotRel+share.i /* Add to total relative */ Rel=Rel+1 /* Increment Relative users */ End Else Do /* Not numeric, then absolute */ Parse var share.i pct "%" /* Get number portion */ TotPct=TotPct+pct /* Add to total absolute */ Abs=Abs+1 /* Increment Absolute users */ End End "pipe cp q proc |", /* Check how many real CPUs */ "count lines |", /* One line per processor */ "var cpu" /* Store in variable cpu */ /* Show results */ Say "Total Absolute =" TotPct"% ("Abs "users)" Say "Remainder =" 100-TotPct"%" Say "Total Relative =" TotRel" ("Rel "users)" Say "Relative 100 =" Strip(Format((100-TotPct)*(100/TotRel),2,3)"%") Say "Real Processors=" cpu
Appendix D. Sample tools 231
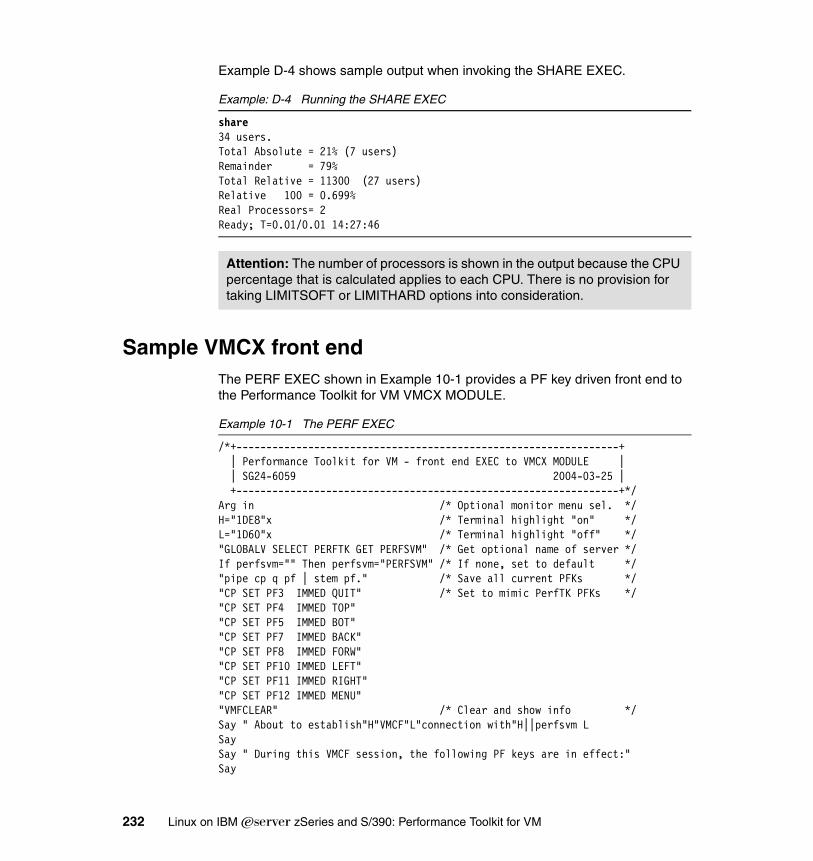
Example D-4 shows sample output when invoking the SHARE EXEC.
Example: D-4 Running the SHARE EXEC
share 34 users. Total Absolute = 21% (7 users) Remainder = 79% Total Relative = 11300 (27 users)Relative 100 = 0.699% Real Processors= 2Ready; T=0.01/0.01 14:27:46
Sample VMCX front endThe PERF EXEC shown in Example 10-1 provides a PF key driven front end to the Performance Toolkit for VM VMCX MODULE.
Example 10-1 The PERF EXEC
/*+----------------------------------------------------------------+ | Performance Toolkit for VM - front end EXEC to VMCX MODULE | | SG24-6059 2004-03-25 | +----------------------------------------------------------------+*/ Arg in /* Optional monitor menu sel. */ H="1DE8"x /* Terminal highlight "on" */ L="1D60"x /* Terminal highlight "off" */ "GLOBALV SELECT PERFTK GET PERFSVM" /* Get optional name of server */ If perfsvm="" Then perfsvm="PERFSVM" /* If none, set to default */ "pipe cp q pf | stem pf." /* Save all current PFKs */ "CP SET PF3 IMMED QUIT" /* Set to mimic PerfTK PFKs */ "CP SET PF4 IMMED TOP" "CP SET PF5 IMMED BOT" "CP SET PF7 IMMED BACK" "CP SET PF8 IMMED FORW" "CP SET PF10 IMMED LEFT" "CP SET PF11 IMMED RIGHT" "CP SET PF12 IMMED MENU" "VMFCLEAR" /* Clear and show info */ Say " About to establish"H"VMCF"L"connection with"H||perfsvm L Say Say " During this VMCF session, the following PF keys are in effect:" Say
Attention: The number of processors is shown in the output because the CPU percentage that is calculated applies to each CPU. There is no provision for taking LIMITSOFT or LIMITHARD options into consideration.
232 Linux on IBM Eserver zSeries and S/390: Performance Toolkit for VM
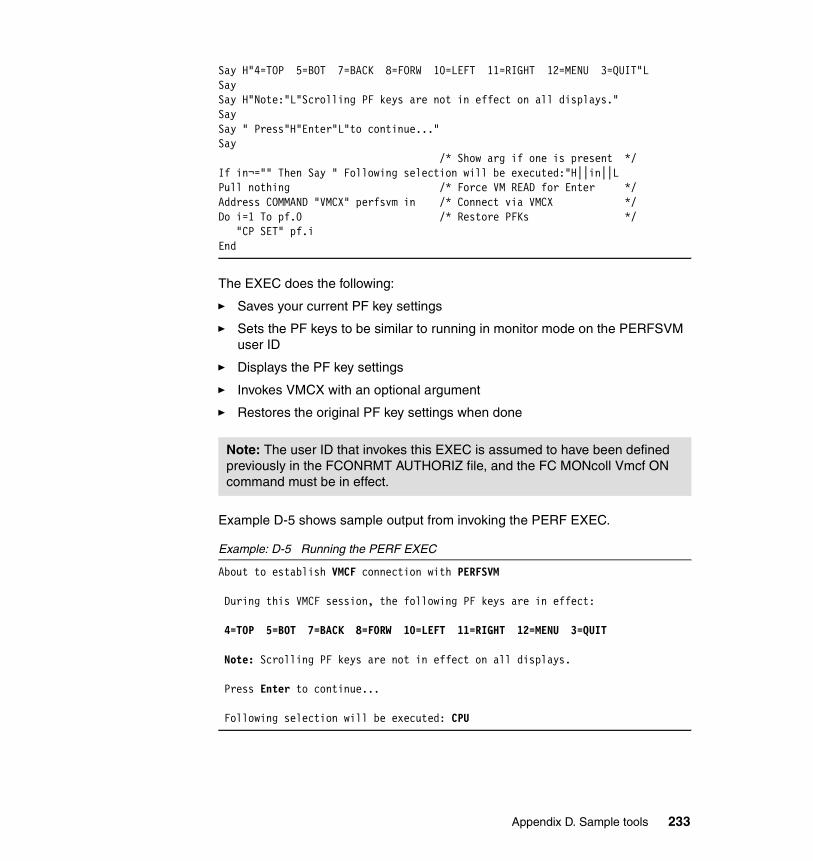
Say H"4=TOP 5=BOT 7=BACK 8=FORW 10=LEFT 11=RIGHT 12=MENU 3=QUIT"L Say Say H"Note:"L"Scrolling PF keys are not in effect on all displays." Say Say " Press"H"Enter"L"to continue..." Say /* Show arg if one is present */ If in¬="" Then Say " Following selection will be executed:"H||in||L Pull nothing /* Force VM READ for Enter */ Address COMMAND "VMCX" perfsvm in /* Connect via VMCX */ Do i=1 To pf.0 /* Restore PFKs */ "CP SET" pf.i End
The EXEC does the following:
� Saves your current PF key settings
� Sets the PF keys to be similar to running in monitor mode on the PERFSVM user ID
� Displays the PF key settings
� Invokes VMCX with an optional argument
� Restores the original PF key settings when done
Example D-5 shows sample output from invoking the PERF EXEC.
Example: D-5 Running the PERF EXEC
About to establish VMCF connection with PERFSVM During this VMCF session, the following PF keys are in effect: 4=TOP 5=BOT 7=BACK 8=FORW 10=LEFT 11=RIGHT 12=MENU 3=QUIT Note: Scrolling PF keys are not in effect on all displays. Press Enter to continue... Following selection will be executed: CPU
Note: The user ID that invokes this EXEC is assumed to have been defined previously in the FCONRMT AUTHORIZ file, and the FC MONcoll Vmcf ON command must be in effect.
Appendix D. Sample tools 233
After pressing Enter, the monitor CPU screen would be displayed via the VMCX interface. To terminate the VMCX connection, press the PF3 key or enter QUIT and clear the screen.
Tip: To bypass the need to clear the screen when the PF3 (QUIT) key is pressed, use the CP TERM MORE 0 0 command.
234 Linux on IBM Eserver zSeries and S/390: Performance Toolkit for VM
Related publications
The publications that are listed in this section are considered particularly suitable for a more detailed discussion of the topics covered in this redbook.
IBM RedbooksFor information about ordering these publications, see “How to get IBM Redbooks” on page 236. Note that some of the documents that are referenced here may be available in softcopy only.
� Linux for S/390, SG24-4987
http://www.ibm.com/redbooks/abstracts/sg244987.html
� Linux on IBM ̂zSeries and S/390: Distributions, SG24-6264
http://www.ibm.com/redbooks/abstracts/sg246264.html
� Linux on IBM ̂zSeries and S/390: ISP/ASP Solutions, SG24-6299
http://www.ibm.com/redbooks/abstracts/sg246299.html
� Linux on IBM ̂zSeries and S/390: Performance Measurement and Tuning, SG24-6926
http://www.ibm.com/redbooks/abstracts/sg246926.html
Other publicationsThese publications are also relevant as further information sources:
� z/VM: CP Command and Utility Reference, SC24-6008
� Linux for zSeries and S/390 Device Drivers and Installation Commands, LNUX-1303
� z/VM: Performance, SC24-5999
� z/VM: Performance Toolkit, SC24-6062
� z/VM: CP Planning and Administration, SC24-6043
� VM/ESA Connectivity Planning, Administration, and Operation, SC24-5756
� S/390 PR/SM Planning Guide, GA22-7236
© Copyright IBM Corp. 2004. All rights reserved. 235
Online resourcesThese Web sites and URLs are also relevant as further information sources:
� IBM developerWorks Linux for zSeries and S/390 home page
http://www-124.ibm.com/developerworks/oss/linux390/index.shtml
� RMF PM download page
http://www.ibm.com/servers/eserver/zseries/zos/rmf/rmfhtmls/pmweb/pmlin.htm
� Real Time Monitor commands and corresponding Performance Toolkit for VM commands
http://www.vm.ibm.com/related/perfkit/pkitrtm.html
� VMPRF reports and corresponding Performance Toolkit for VM reports
http://www.vm.ibm.com/related/perfkit/pkitprf.html
How to get IBM RedbooksYou can search for, view, and download Redbooks, Redpapers, Hints and Tips, draft publications, and Additional materials, as well as order hardcopy Redbooks or CD-ROMs, at this Web site:
ibm.com/redbooks
Help from IBMIBM Support and downloads
ibm.com/support
IBM Global Services
ibm.com/services
236 Linux on IBM Eserver zSeries and S/390: Performance Toolkit for VM
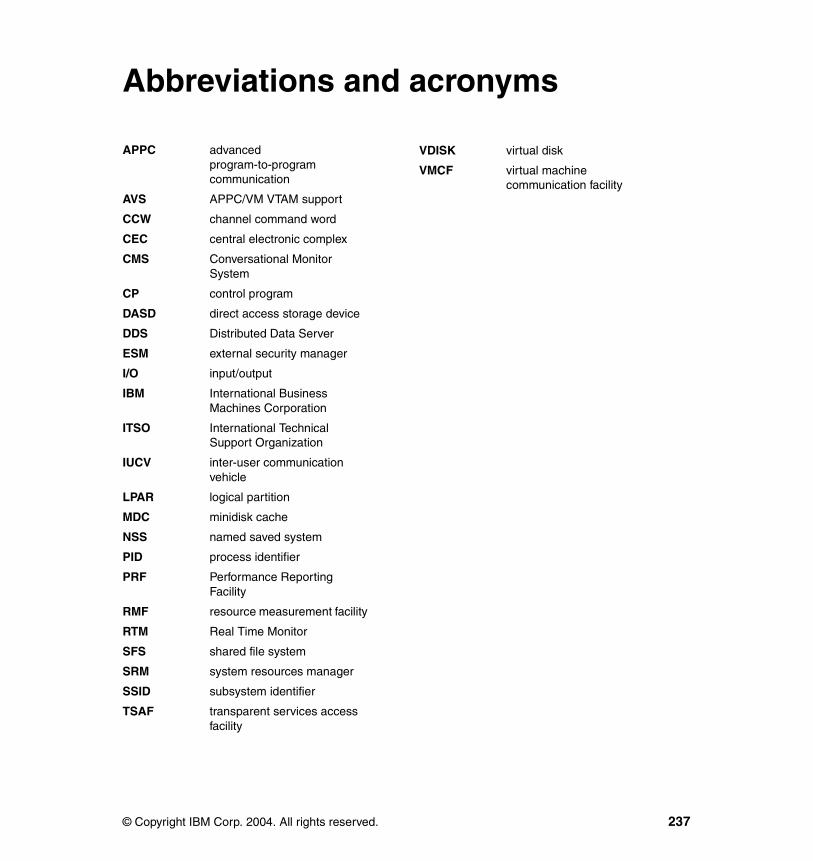
acronyms
APPC advanced program-to-program communication
AVS APPC/VM VTAM support
CCW channel command word
CEC central electronic complex
CMS Conversational Monitor System
CP control program
DASD direct access storage device
DDS Distributed Data Server
ESM external security manager
I/O input/output
IBM International Business Machines Corporation
ITSO International Technical Support Organization
IUCV inter-user communication vehicle
LPAR logical partition
MDC minidisk cache
NSS named saved system
PID process identifier
PRF Performance Reporting Facility
RMF resource measurement facility
RTM Real Time Monitor
SFS shared file system
SRM system resources manager
SSID subsystem identifier
TSAF transparent services access facility
Abbreviations and
© Copyright IBM Corp. 2004. All rights reserved.
VDISK virtual disk
VMCF virtual machine communication facility
237

238 Linux on IBM Eserver zSeries and S/390: Performance Toolkit for VM
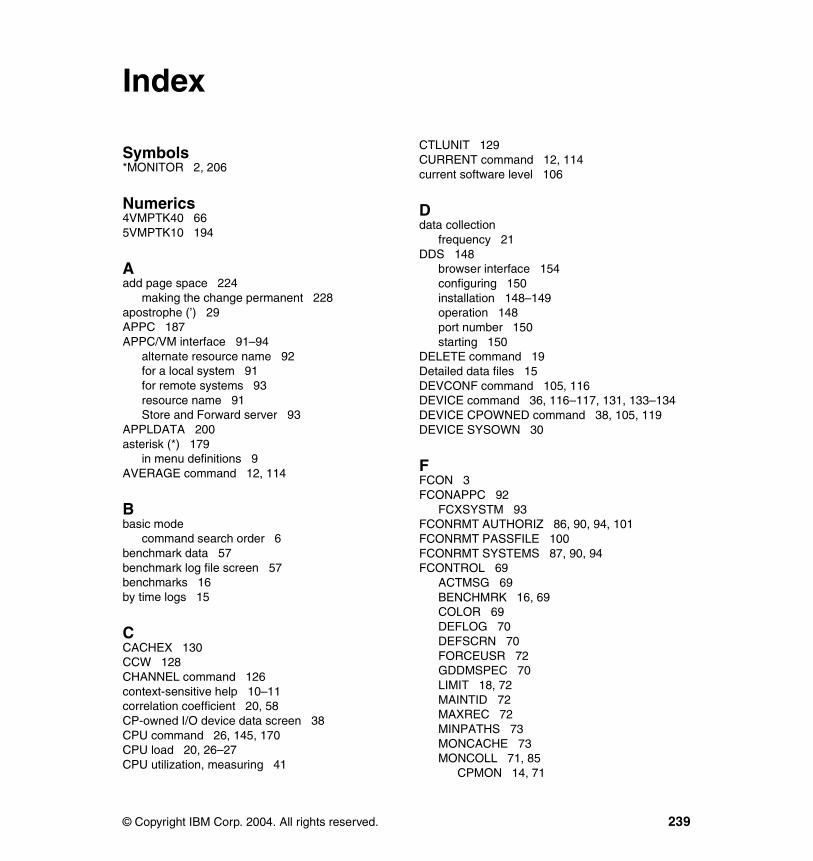
Index
Symbols*MONITOR 2, 206
Numerics4VMPTK40 665VMPTK10 194
Aadd page space 224
making the change permanent 228apostrophe (’) 29APPC 187APPC/VM interface 91–94
alternate resource name 92for a local system 91for remote systems 93resource name 91Store and Forward server 93
APPLDATA 200asterisk (*) 179
in menu definitions 9AVERAGE command 12, 114
Bbasic mode
command search order 6benchmark data 57benchmark log file screen 57benchmarks 16by time logs 15
CCACHEX 130CCW 128CHANNEL command 126context-sensitive help 10–11correlation coefficient 20, 58CP-owned I/O device data screen 38CPU command 26, 145, 170CPU load 20, 26–27CPU utilization, measuring 41
© Copyright IBM Corp. 2004. All rights reserved.
CTLUNIT 129CURRENT command 12, 114current software level 106
Ddata collection
frequency 21DDS 148
browser interface 154configuring 150installation 148–149operation 148port number 150starting 150
DELETE command 19Detailed data files 15DEVCONF command 105, 116DEVICE command 36, 116–117, 131, 133–134DEVICE CPOWNED command 38, 105, 119DEVICE SYSOWN 30
FFCON 3FCONAPPC 92
FCXSYSTM 93FCONRMT AUTHORIZ 86, 90, 94, 101FCONRMT PASSFILE 100FCONRMT SYSTEMS 87, 90, 94FCONTROL 69
ACTMSG 69BENCHMRK 16, 69COLOR 69DEFLOG 70DEFSCRN 70FORCEUSR 72GDDMSPEC 70LIMIT 18, 72MAINTID 72MAXREC 72MINPATHS 73MONCACHE 73MONCOLL 71, 85
CPMON 14, 71
239
CPMON DCSS 14CPMON DISK 14LINUXUSR 151PERFLOG 14, 71REDISP 14, 71RESET 71, 187VMCF 71, 91, 233WEBSERV 71, 100
MSGCLEAR 73MSGWAIT 73NUMBERS 73PFKEY 73PROCESS 73RELOAD 87
AUTHORIZ 92RESET 76RMTLINES 74SCROLL 74SEARCH 74SECUSER 74SETEVENT 74SETTINGS 74
HISTFILE 15UCLASS 42, 75UPDTCMS 75UPDTSCRN 75USERBOTL 75USERHDR 75USERVAR 75USRLIMIT 75
FCONX $PROFILE 212FCONX LINUXUSR file 88, 151FCONX REPORTS 76–77, 85FCONX TRENDREC 80, 85FCXCMD511I message 114FCXRES00 91–92FCXSYSTM 93FL510 194
control files 197FCONTROL
MONCOLL 199UCLASS 200
FCONX $PROFILE 197FCONX SUMREC 198FCONX TRENDREC 198LXCPU 197LXNET 197LXPROC 197report changes 197
GGDDM 51GRAPHICS command 51graphics selection screen 51–54guest 46–47, 88
HHISTDATA command 55HISTLOG file 15historic performance data 13HISTORY command 180history data
ACUM HISTSUM file 15HISTLOG files 15PERFHIST files 15PERFLOG files 15
history file 59history file selection screen 55HISTSUM file 15
II/O activity, measuring 41I/O command 186I/O data reporting 35I/O device data screen 36IDLEUSER 185INDICATE 87
PAGING 230INDICATE LOAD 144
LLCHANNEL command 126, 146Linux 47
memory required 159LINUX command 46Linux data
viewing 152–155Linux guest 88
analyzing memory usage 158–159monitoring 147–175processor utilization 171–173reducing virtual machine size 155, 159registering 151
Linux performance details screen 47Linux swap partition 160Linux systems screen 46LPAR command 32, 142, 183
240 Linux on IBM Eserver zSeries and S/390: Performance Toolkit for VM
LPAR data screen 32LPAR weight 145LPARLOG 142LXCPU 48LXFILSYS 47LXMEM 49, 158LXNETWRK 47
MMDC 164
See minidisk cachemeasuring CPU utilization 41measuring I/O activity 41memory
required for Linux kernel 159memory usage
analyzing inside Linux guests 158–159comparing resource usage 157–158Linux guest 155
menunavigating methods 9
MENU command 105minidisk 38minidisk cache 37, 126, 161minidisk swap partition
multiple 166–167single 162–163
MONCOLL commandto reset data values 12
MONDCSS 207MONITOR 8, 104, 206
ENABLE 208EVENT 208SAMPLE 208START 209
monitor data 208analyzing 14configuration data 209domains 209
application data 210I/O 210monitor 209processor 209scheduler 209seek 210storage 209system 209user 209
event 208sample 208
high-frequency sample 208single-sample 208
monitor domains 20monitor SAMPLE interval 21MONSCAN command 188, 198MONSET command 105, 115MONWRITE 206
Nnavigation
scrolling with keys 9using option number 9using sensitive select 9using subcommand name 9
NEXTSAMP 188–189NSS 33
Ooverhead 20
PPAG EXEC 230paging 159–169
monitoring Linux guest paging 162PERF EXEC 232PERFKIT 2
basic mode 5BATCH 198command syntax for 4module 3starting Performance Toolkit for VM 4VMPRF parameter 198
PERFLOG history files 15performance screen selection 25Performance Toolkit for VM
APPC/VM interface 91–94basic mode 4–7benchmark data analysis 16–17control files 68–81correlation coefficient 58data collection for Linux guests 88data reports 24–59defining 2–3displaying current and average data 11–12general display 179
Index 241
help facility 9–11context-sensitive help 10–11
help mode 4history files 55–56, 180–181history performance analysis 13–16
extended trend files 16PERFLOG history files 15simple data files 15
I/O data reporting 35–39installation 66–68monitor mode 8–9navigation to a specific screen 4operation 83–84overhead 20–21redisplay facility 6–7
scrolling commands 7remote access and monitoring 85–87remote monitoring 90sorting reported data 12–13starting 4–5tailoring 84–85threshold monitoring 17–19user data reporting 40user-defined screens 60–62, 70variable correlation coefficients 20Web interface 63, 95–101, 187when to use 20–21
PERFSVM 66directory entry 67FL510 version 196PROFILE EXEC 81
PF keys for scrolling screen 9port choice 99PRF support 198PRF trend files 16processor utilization 170–175PROFILE TCPIP 99ps -ef command 175
QQUERY MONITOR command 210QUERY NAMES command 231question mark character (?) 4QUICKDISP option 110
RReal Time Monitor
See RTM
real-time dataanalyzing 14
Red Hat Linux user class 42Redbooks Web site 236
Contact us xivREDHIST command 55REDISP command 6RETURN command 105RMF
DDS browser interface 154RTM 2
DISPLAYGENERAL 178I/O INTERVAL 185IDLE 185SLOG 180XLOG 180
functions 178INTERVAL PRINT 187ORDER 183QUERY
ENVIRON 182SET
PRINT ON 187system log display 180
RTM environment display 182RTM I/O display 185RTM idle user display 185RTM user display 183
SSCOMDIR NAMES file 92screen
FCX001 19FCX100 26, 170FCX102 113–114FCX103 28, 107FCX107 127FCX108 12, 36, 117, 131–132, 186FCX109 38, 119FCX110 37, 118, 134FCX112 41, 43, 184FCX113 122FCX115 44, 157, 165, 172FCX119 30, 121FCX120 120FCX121 31, 120FCX124 8, 50
242 Linux on IBM Eserver zSeries and S/390: Performance Toolkit for VM
FCX126 32FCX128 51FCX131 116FCX133 33FCX147 123FCX148 62, 179FCX149 115FCX154 109FCX160 55FCX162 58FCX173 57FCX176 129FCX177 130FCX180 34, 106, 183FCX193 94FCX194 59FCX195 56, 181FCX203 137FCX204 138FCX205 139FCX213 61FCX223 46FCX224 47FCX229 49, 159FCX230 48FCX238 185FCX240 137FCX242 200FCX243 201FCX244 202FCX245 203FCX248 204
scrolling the screen 9SET QUICKDSP command 110SET SRM command 109SHARE
ABSOLUTE 113RELATIVE 111
SHARE EXEC 230–231SHARE settings 111shared segment screen 33SKIPSAMP command 188
syntax 191SORT command 13, 184sort ordering 12SPOOL command 30, 105, 119, 121spool file 121spool file overview display 31spool file usage screen 30–31
STORAGE command 27, 31, 105, 107storage utilization screen 27–29subcommand syntax 5summary data files 15SUSE Linux user class 42swap partition 160SYSCONF command 34, 105, 182SYSSET command 105, 109, 115SYSSTA command 62SYSSUMLG command 189SYSTEM command 105, 113system configuration screen 34
TTCPACTLG 138TCPDATLG 139TCPMENU 137TERM 234threshold monitoring
performance values 18thresholds 17, 72TRNDSCAN command 188, 190
syntax 191
UUDEFMENU command 61UPAGE command 105, 122, 230USER 41, 123, 157, 162, 184user class 42
resource usage 42USER command 111user data screens
defining 61user resource usage screen 41, 43user-defined performance screen 62user-defined screen menu 61
Vvariable correlation coefficients 20, 58VDISKS command 105, 123virtual disk (VDISK) 123, 126
as Linux swap partition 160Virtual Machine Communication Facility
See VMCFVM Real Time Monitor 2
See also RTMVMCF 187
Index 243
VMCX 233VMPRF 2, 187–191, 198VSWITCH 137
WWeb interface 95–101
authentication 100–101enable 99line graphics 98logon page 96main selection menu 97port number 99welcome page 95
wget command 149working set size 156
Zz/VM
system configuration 103–123
244 Linux on IBM Eserver zSeries and S/390: Performance Toolkit for VM
(0.2”spine)0.17”<
->0.473”
90<->
249 pages
Linux on IBME
server zSeries and S/390: Perform
ance Toolkit for VM


®
SG24-6059-00 ISBN 0738490466
INTERNATIONAL TECHNICALSUPPORTORGANIZATION
BUILDING TECHNICALINFORMATION BASED ONPRACTICAL EXPERIENCE
IBM Redbooks are developed by the IBM International Technical Support Organization. Experts from IBM, Customers and Partners from around the world create timely technical information based on realistic scenarios. Specific recommendations are provided to help you implement IT solutions more effectively in your environment.
For more information:ibm.com/redbooks
Linux on IBM Eserver zSeries and S/390:Performance Toolkit for VM
Understanding Performance Toolkit for VM
Monitoring VM performance
Optimizing Linux guest performance
This IBM Redbook discusses Performance Toolkit for VM, a performance monitoring and analysis tool for z/VM. Derived from the earlier FCON/ESA product, Performance Toolkit for VM enables system administrators to collect and analyze VM performance data. Both real-time and history data can be processed by Performance Toolkit for VM, and it provides most of the functions that are available in Real Time Monitor (TRTM) and Performance Reporting Facility (PRF).
In this book, we present an overview of the functions and features of Performance Toolkit for VM. We show how to navigate through its major monitoring screens and configure it. We also describe configuration for monitoring remote z/VM systems. Using examples, we illustrate how to monitor your z/VM system to identify potential performance problems. Major performance factors for running Linux guests under z/VM are discussed.
Back cover