Embed Size (px)
Citation preview
Linköping University Post Print
Cross-field ion transport during high power impulse magnetron sputtering
Daniel Lundin, Petter Larsson, Erik Wallin, Martina Lattemann,
Nils Brenning and Ulf Helmersson
N.B.: When citing this work, cite the original article.
Original Publication:
Daniel Lundin, Petter Larsson, Erik Wallin, Martina Lattemann, Nils Brenning and Ulf Helmersson, Cross-field ion transport during high power impulse magnetron sputtering, 2008, Plasma Sources Science and Technology, (17), 035021. http://dx.doi.org/10.1088/0963-0252/17/3/035021 Copyright: Iop Publishing
http://www.iop.org/
Postprint available at: Linköping University Electronic Press http://urn.kb.se/resolve?urn=urn:nbn:se:liu:diva-13209
Cross-field ion transport during high power impulse magnetron sputtering Daniel Lundin1, Petter Larsson1, Erik Wallin1, Martina Lattemann1, 2, Nils Brenning3 and Ulf Helmersson1 1 Plasma & Coatings Physics Division, IFM-Materials Physics, Linköping University, SE-581 83 Linköping, Sweden 2 Joint Research Laboratory Nanomaterials, TU Darmstadt and Forschungszentrum Karlsruhe GmbH, Petersenstraße 23, D-64287 Darmstadt, Germany 3 Division of Space and Plasma Physics, School of Electrical Engineering, Royal Institute of Technology, SE-100 44 Stockholm, Sweden
E-mail: [email protected] Abstract
In this study, the effect on thin film growth due to an anomalous electron transport, found in high
power impulse magnetron sputtering (HiPIMS) has been investigated for the case of a planar circular
magnetron. An important consequence of this type of transport is that it affects the way ions are being
transported in the plasma. It was found that a significant fraction of ions are transported radially
outwards in the vicinity of the cathode, across the magnetic field lines, leading to increased deposition
rates directly at the side of the cathode (perpendicular to the target surface). Furthermore, this mass
transport parallel to the target surface leads to that the fraction of sputtered material reaching a
substrate placed directly in front of the target is substantially lower in HiPIMS compared to
conventional direct current magnetron sputtering (dcMS). This would help to explain the lower
deposition rates generally observed for HiPIMS compared to dcMS. Moreover, time-averaged mass
spectrometry measurements of the energy distribution of the cross-field transported ions were carried
out. The measured distributions show a direction-dependent high-energy tail, in agreement with
predictions of the anomalous transport mechanism.
Introduction
In high power impulse magnetron sputtering (HiPIMS), introduced in the 90ies [1, 2], plasma
densities up to 1019 m-3 can be reached close to the target race track [3, 4], which should be
D. Lundin et al. Cross-field ion transport during high power impulse magnetron sputtering
compared to 1015-1016 m-3 for direct current magnetron sputtering (dcMS) [5]. Due to the
plasma conditions in this pulsed plasma, a high degree of ionization of the deposition flux as
well as an inherently high energy of the depositing species are obtained, while still keeping
the average power at a reasonable level [6]. Therefore, and due to the fact that it is easily
applied in a standard magnetron sputtering equipment, HiPIMS is a promising addition to
commonly used ionized physical vapor deposition (IPVD) techniques for applications such as
filling of narrow trenches in integrated circuits [2]. Moreover, the use of HiPIMS has resulted
in improved film quality [7], especially at low temperatures, and controlled film growth
through the use of substrate bias to control the momentum transfer from ion bombardment.
The deposition rate in the HiPIMS discharge is commonly found to be lower than that
obtained for dcMS at the same average power. Christie [8] suggested self-sputtering due to
back-attraction of metal ions to the target as a reason for this. A correlation between the
deposition rate and the self-sputtering yield has also been observed experimentally [6,9].
Konstantinidis et al. [ 10 ] pointed out the importance of the plasma conductivity, while
Bugaev et al. [11] and Bohlmark et al. [12] showed that the magnetic arrangement affected
the deposition rate. It is important to keep in mind that the spatial distribution of the
deposition flux is in general not necessarily the same for dcMS and HiPIMS, since the ionized
deposition species will be affected by fields and energy fluxes in the plasma in a different way
than for neutrals. Bohlmark et al. demonstrated this by adding an adjustable magnetic field to
focus the deposition flux, and thereby increase the deposition rate on a sample position in
front of the target while decreasing the amount of deposited material on substrates placed on
the side of the magnetron, perpendicular to the target surface [12]. Another aspect is the non-
linear dependence of the sputter yield as function of the applied voltage, which was recently
discussed by Emmerlich et al. [13], pointing out that it is unphysical to compare HiPIMS and
dcMS deposition rates for the same average power. In conclusion, it is most likely a
combination of the factors mentioned above, and possibly others, that affect the deposition
rate, which highlights the importance of looking into the particle transport.
2
D. Lundin et al. Cross-field ion transport during high power impulse magnetron sputtering
Factors that may affect the spatial distribution of the deposition flux include
azimuthal currents (such as the Hall current) generated close to the target surface, which can
couple energy between electrons and ions, resulting in modified transport properties.
Measurements by Bohlmark et al. [14] showed anomalous fast electron transport in HiPIMS
discharges, which has been further investigated by Lundin et al. [15] and is understood as
follows: In HiPIMS, large discharge currents in the plasma between the sputtering cathode
and the anode (often the chamber walls and the ground shield of the magnetron) are generated.
Furthermore, large azimuthal currents, Jϕ, circulating in the magnetic field trap close to the
magnetron, arise due to the presence of the magnetic field through a combination of
diamagnetic and E×B drifts of electrons. The currents correspond to azimuthal ion-electron
drift velocities ranging from about 1.3×10⁴ m s-1 at z = 0.01 m (above the target surface) to
5×10⁴ m s-1 at z = 0.04 m, which is well above both the typical speed of 5 eV sputtered
particles (< 5×10³ m s-1) and the ion acoustic speed of ions (~ 2×10³ m s-1). The current is
therefore two-stream (cross-B) unstable according to linear theory [
+Ar
16 ] and drives the
modified two-stream instability (MTSI), the lower hybrid drift instability, or a mixture of both
[ 17 ]. The underlying mechanisms within this class of instabilities are known both from
simulations of critical ion velocities in plasmas and plasma gun transport mechanisms [18,
19], and from measurements in a plasma gun [19] operated in the same plasma parameter
regime as reported in the present work. The dominating frequency of the instability is in the
lower hybrid range [ 20 ], and the variations in density and electric fields (waves) are
correlated. Due to this correlation, the waves give a net force Fei = <eEw,ϕne> from electrons
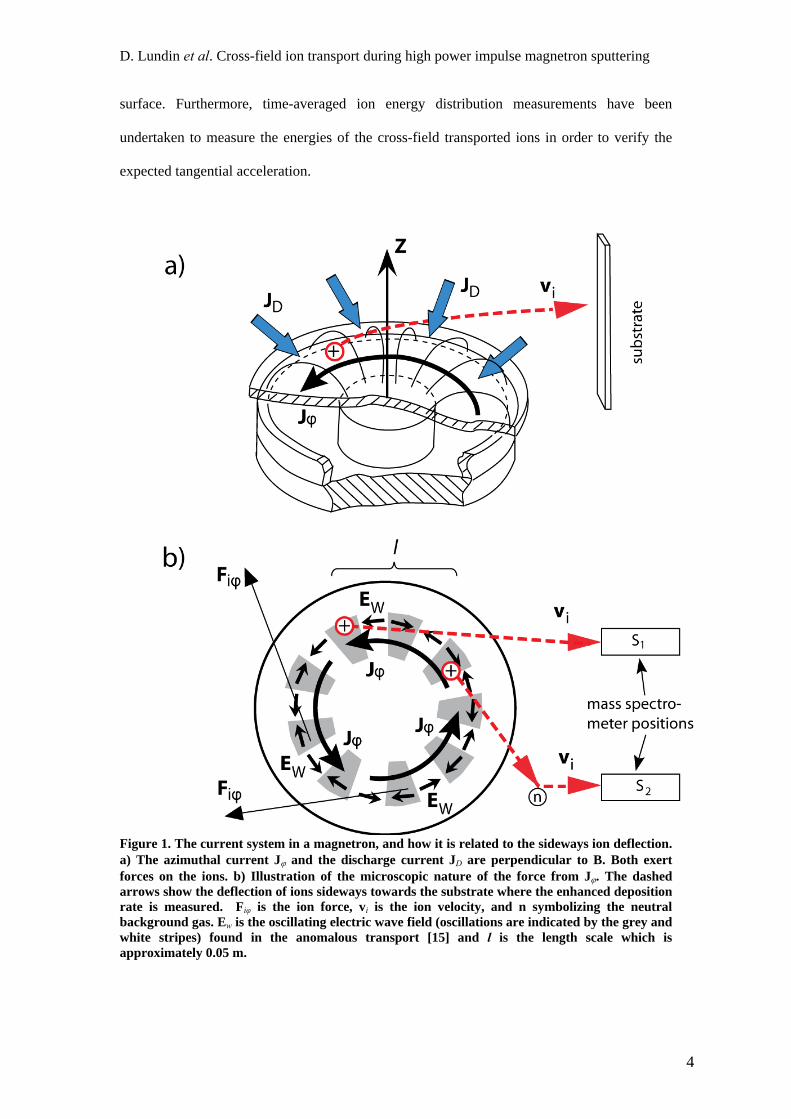
to ions, directed along the azimuthal current density, Jϕ (see Figure 1a). Here Ew,ϕ is the
azimuthal electric field of the waves. Therefore a cross-field ion mass transport directed
tangentially outwards in the HiPIMS discharge is expected.
In this article the effect of a modified ion transport on thin film growth by changes in
flux direction as well as energies is investigated. The expected cross-field ion transport is
analyzed by measuring the deposition rate at several positions perpendicular to the target
3
D. Lundin et al. Cross-field ion transport during high power impulse magnetron sputtering
surface. Furthermore, time-averaged ion energy distribution measurements have been
undertaken to measure the energies of the cross-field transported ions in order to verify the
expected tangential acceleration.
Figure 1. The current system in a magnetron, and how it is related to the sideways ion deflection. a) The azimuthal current Jϕ and the discharge current JD are perpendicular to B. Both exert forces on the ions. b) Illustration of the microscopic nature of the force from Jϕ. The dashed arrows show the deflection of ions sideways towards the substrate where the enhanced deposition rate is measured. Fiφ is the ion force, vi is the ion velocity, and n symbolizing the neutral background gas. Ew is the oscillating electric wave field (oscillations are indicated by the grey and white stripes) found in the anomalous transport [15] and l is the length scale which is approximately 0.05 m.
4
D. Lundin et al. Cross-field ion transport during high power impulse magnetron sputtering
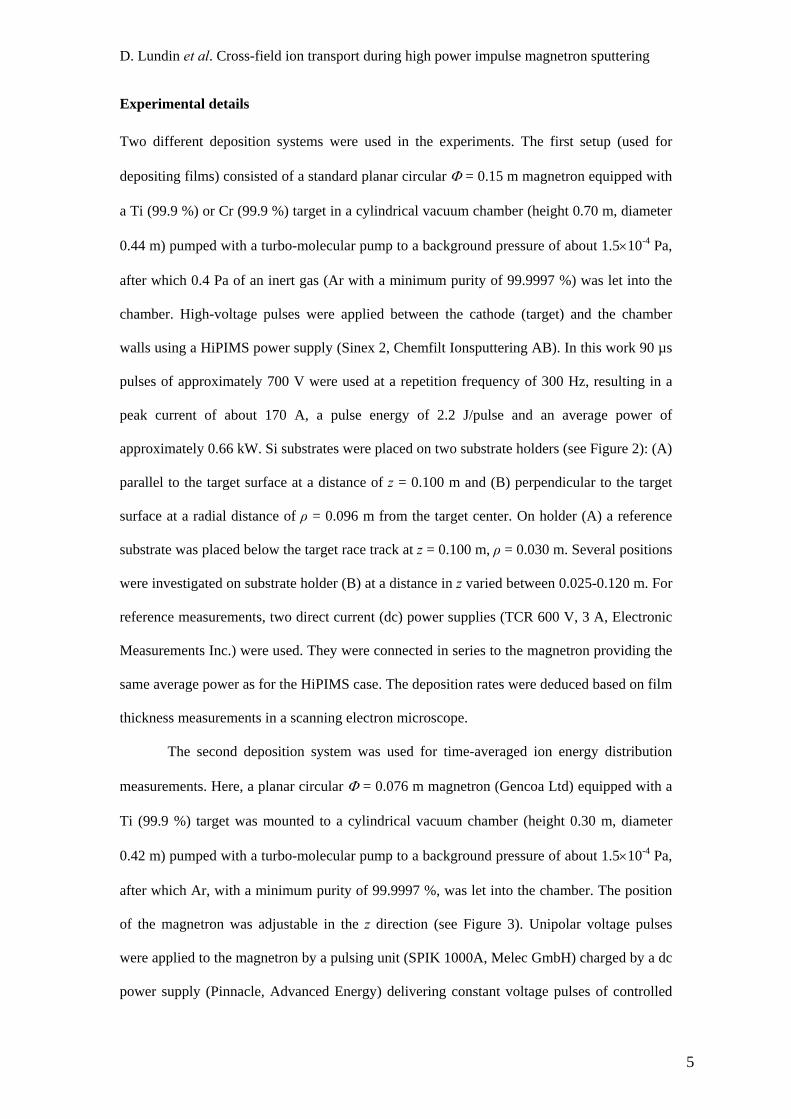
Experimental details
Two different deposition systems were used in the experiments. The first setup (used for
depositing films) consisted of a standard planar circular Φ = 0.15 m magnetron equipped with
a Ti (99.9 %) or Cr (99.9 %) target in a cylindrical vacuum chamber (height 0.70 m, diameter
0.44 m) pumped with a turbo-molecular pump to a background pressure of about 1.5×10⁻⁴ Pa,
after which 0.4 Pa of an inert gas (Ar with a minimum purity of 99.9997 %) was let into the
chamber. High-voltage pulses were applied between the cathode (target) and the chamber
walls using a HiPIMS power supply (Sinex 2, Chemfilt Ionsputtering AB). In this work 90 µs
pulses of approximately 700 V were used at a repetition frequency of 300 Hz, resulting in a
peak current of about 170 A, a pulse energy of 2.2 J/pulse and an average power of
approximately 0.66 kW. Si substrates were placed on two substrate holders (see Figure 2): (A)
parallel to the target surface at a distance of z = 0.100 m and (B) perpendicular to the target
surface at a radial distance of ρ = 0.096 m from the target center. On holder (A) a reference
substrate was placed below the target race track at z = 0.100 m, ρ = 0.030 m. Several positions
were investigated on substrate holder (B) at a distance in z varied between 0.025-0.120 m. For
reference measurements, two direct current (dc) power supplies (TCR 600 V, 3 A, Electronic
Measurements Inc.) were used. They were connected in series to the magnetron providing the
same average power as for the HiPIMS case. The deposition rates were deduced based on film
thickness measurements in a scanning electron microscope.
The second deposition system was used for time-averaged ion energy distribution
measurements. Here, a planar circular Φ = 0.076 m magnetron (Gencoa Ltd) equipped with a
Ti (99.9 %) target was mounted to a cylindrical vacuum chamber (height 0.30 m, diameter
0.42 m) pumped with a turbo-molecular pump to a background pressure of about 1.5×10⁻⁴ Pa,
after which Ar, with a minimum purity of 99.9997 %, was let into the chamber. The position
of the magnetron was adjustable in the z direction (see Figure 3). Unipolar voltage pulses
were applied to the magnetron by a pulsing unit (SPIK 1000A, Melec GmbH) charged by a dc
power supply (Pinnacle, Advanced Energy) delivering constant voltage pulses of controlled
5

D. Lundin et al. Cross-field ion transport during high power impulse magnetron sputtering
length. 70 µs pulses of approximately 500 V and 270 A were used, resulting in about 1.1
J/pulse with an average power of about 100 W. For conventional dc reference measurements,
a dc power supply (MDX 1K, Advanced Energy) was connected to the magnetron.
Figure 2. A schematic cross-section of the magnetron and the lid of the deposition chamber with substrate holders (A) and (B) mounted. The location for the reference measurements is also marked (ref).
Figure 3. A schematic cross-section of the magnetron (M) and mass spectrometer (S) of the system used for measuring ion energy distributions. The z position of the magnetron was adjusted between 0 and 0.05 m while ρ was kept at 0.05 m.
6
D. Lundin et al. Cross-field ion transport during high power impulse magnetron sputtering
For the ion energy distribution measurements, an energy resolving mass spectrometer
(PSM003, Hiden Analytical) was used. It was inserted into the chamber with the sampling
orifice radially positioned about 0.05 m from the center axis of the magnetron (see Figure 3).
The magnetron was mounted in the radial direction about 0.025 m off-axis, so that the race
track was in line with the orifice of the mass spectrometer. For most measurements (if not
otherwise stated), the orifice was placed in position S1 according to Figure 1b. Due to the
adjustable position of the magnetron, the distance between the orifice and the target surface
could be varied in z from about 0 – 0.05 m, as can be seen in Figure 3. This means that ion
energy distributions for different z positions could be investigated, which corresponds to
inserting a mass spectrometer at the different positions displayed in Figure 2. The mass
spectrometer was capable of measuring ion energies up to 100 eV with a resolution of 0.05
eV and masses up to 300 amu, with a resolution of 0.01 amu (for more specific details on the
mass spectrometer see reference 21 ). The energy distributions presented here were all
collected under constant spectrometer settings. It has to be noted that the acceptance angle of
the mass spectrometer is dependent on the ion energy, meaning that the acceptance angle gets
smaller with increasing ion energy. Thus, it is less likely to measure all the incoming high-
energy ions compared to the low-energy ions. No exact values are available from the
manufacturer for this specific mass spectrometer, but can be estimated to be similar as those
given for the EQP mass spectrometer produced by the same manufacturer (see Table 1) [22],
using the same extraction optics (the only difference is the use of different energy filters).
7
D. Lundin et al. Cross-field ion transport during high power impulse magnetron sputtering
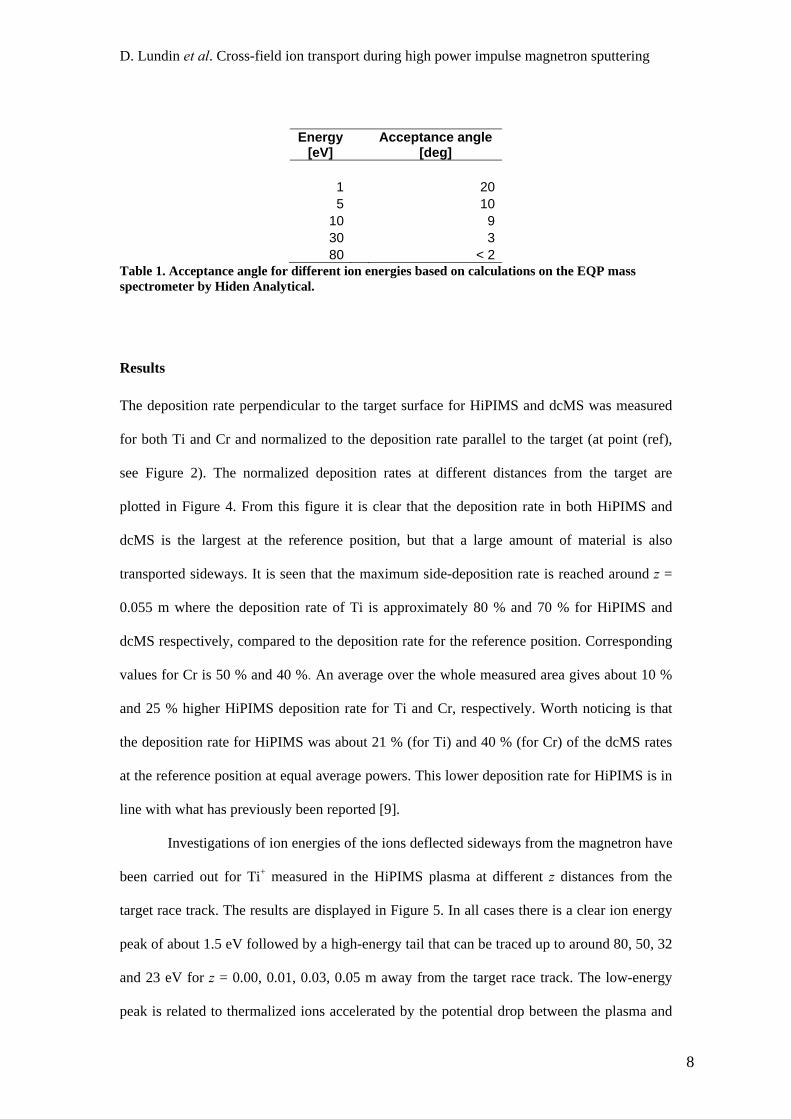
Energy [eV]
Acceptance angle [deg]
1 205 10
10 930 380 < 2
Table 1. Acceptance angle for different ion energies based on calculations on the EQP mass spectrometer by Hiden Analytical.
Results
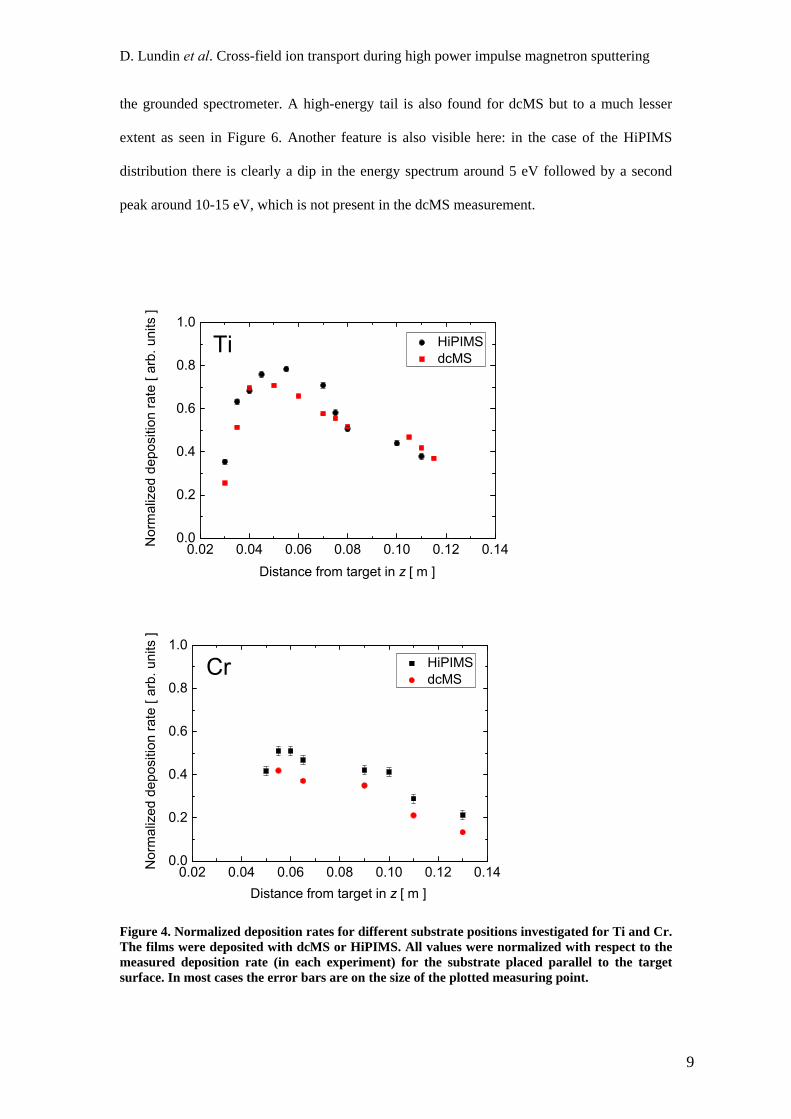
The deposition rate perpendicular to the target surface for HiPIMS and dcMS was measured
for both Ti and Cr and normalized to the deposition rate parallel to the target (at point (ref),
see Figure 2). The normalized deposition rates at different distances from the target are
plotted in Figure 4. From this figure it is clear that the deposition rate in both HiPIMS and
dcMS is the largest at the reference position, but that a large amount of material is also
transported sideways. It is seen that the maximum side-deposition rate is reached around z =
0.055 m where the deposition rate of Ti is approximately 80 % and 70 % for HiPIMS and
dcMS respectively, compared to the deposition rate for the reference position. Corresponding
values for Cr is 50 % and 40 %. An average over the whole measured area gives about 10 %
and 25 % higher HiPIMS deposition rate for Ti and Cr, respectively. Worth noticing is that
the deposition rate for HiPIMS was about 21 % (for Ti) and 40 % (for Cr) of the dcMS rates
at the reference position at equal average powers. This lower deposition rate for HiPIMS is in
line with what has previously been reported [9].
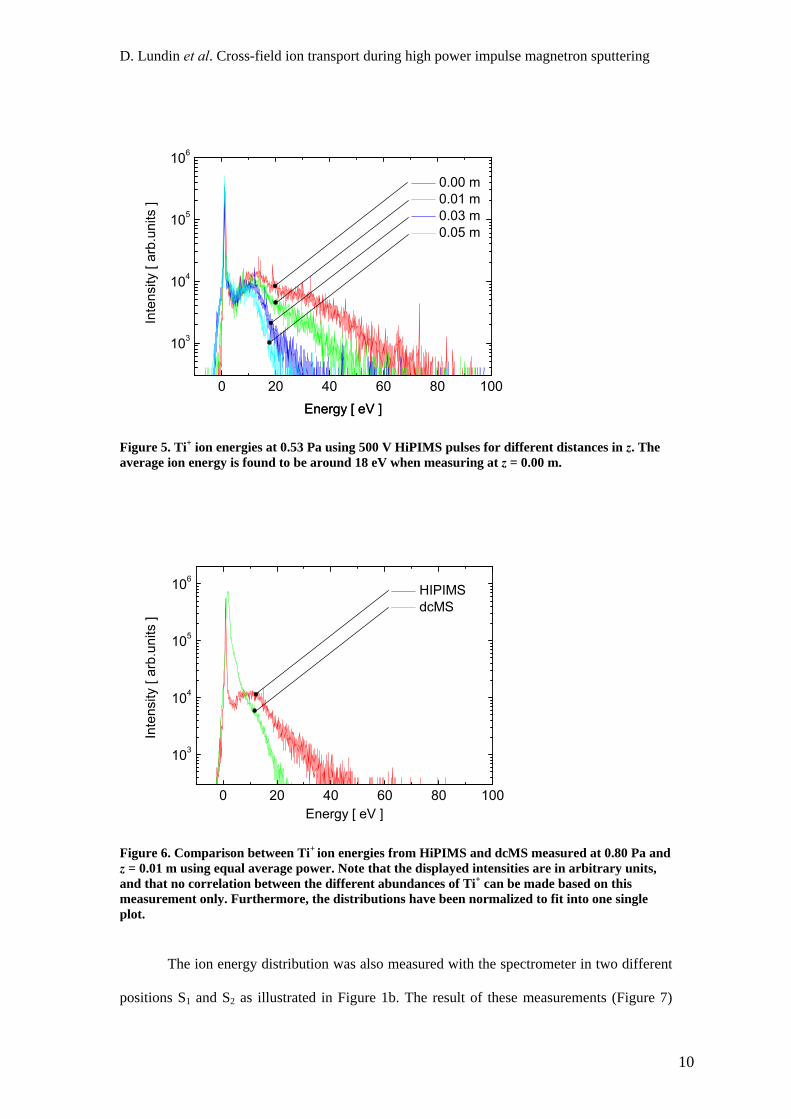
Investigations of ion energies of the ions deflected sideways from the magnetron have
been carried out for Ti+ measured in the HiPIMS plasma at different z distances from the
target race track. The results are displayed in Figure 5. In all cases there is a clear ion energy
peak of about 1.5 eV followed by a high-energy tail that can be traced up to around 80, 50, 32
and 23 eV for z = 0.00, 0.01, 0.03, 0.05 m away from the target race track. The low-energy
peak is related to thermalized ions accelerated by the potential drop between the plasma and
8
D. Lundin et al. Cross-field ion transport during high power impulse magnetron sputtering
the grounded spectrometer. A high-energy tail is also found for dcMS but to a much lesser
extent as seen in Figure 6. Another feature is also visible here: in the case of the HiPIMS
distribution there is clearly a dip in the energy spectrum around 5 eV followed by a second
peak around 10-15 eV, which is not present in the dcMS measurement.
Figure 4. Normalized deposition rates for different substrate positions investigated for Ti and Cr. The films were deposited with dcMS or HiPIMS. All values were normalized with respect to the measured deposition rate (in each experiment) for the substrate placed parallel to the target surface. In most cases the error bars are on the size of the plotted measuring point.
9
D. Lundin et al. Cross-field ion transport during high power impulse magnetron sputtering
Figure 5. Ti+ ion energies at 0.53 Pa using 500 V HiPIMS pulses for different distances in z. The average ion energy is found to be around 18 eV when measuring at z = 0.00 m.
Figure 6. Comparison between Ti+ ion energies from HiPIMS and dcMS measured at 0.80 Pa and z = 0.01 m using equal average power. Note that the displayed intensities are in arbitrary units, and that no correlation between the different abundances of Ti+ can be made based on this measurement only. Furthermore, the distributions have been normalized to fit into one single plot.
The ion energy distribution was also measured with the spectrometer in two different
positions S1 and S2 as illustrated in Figure 1b. The result of these measurements (Figure 7)
10
D. Lundin et al. Cross-field ion transport during high power impulse magnetron sputtering
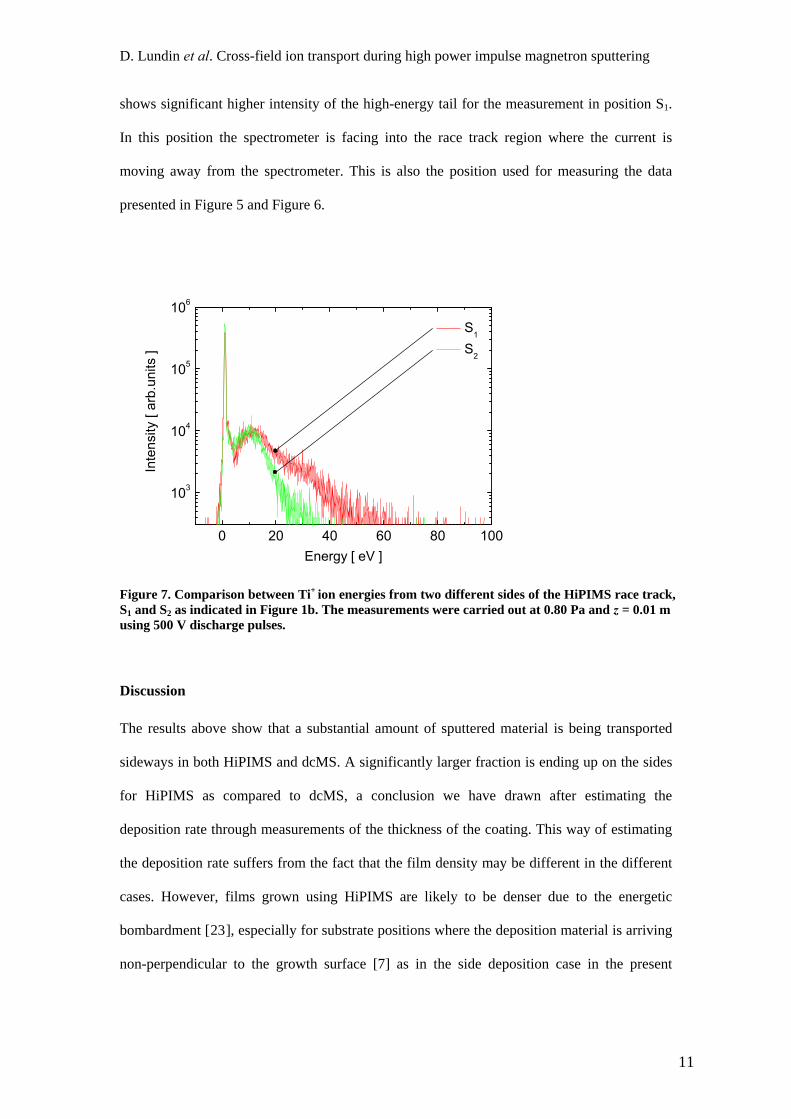
shows significant higher intensity of the high-energy tail for the measurement in position S1.
In this position the spectrometer is facing into the race track region where the current is
moving away from the spectrometer. This is also the position used for measuring the data
presented in Figure 5 and Figure 6.
Figure 7. Comparison between Ti+ ion energies from two different sides of the HiPIMS race track, S1 and S2 as indicated in Figure 1b. The measurements were carried out at 0.80 Pa and z = 0.01 m using 500 V discharge pulses.
Discussion
The results above show that a substantial amount of sputtered material is being transported
sideways in both HiPIMS and dcMS. A significantly larger fraction is ending up on the sides
for HiPIMS as compared to dcMS, a conclusion we have drawn after estimating the
deposition rate through measurements of the thickness of the coating. This way of estimating
the deposition rate suffers from the fact that the film density may be different in the different
cases. However, films grown using HiPIMS are likely to be denser due to the energetic
bombardment [23], especially for substrate positions where the deposition material is arriving
non-perpendicular to the growth surface [7] as in the side deposition case in the present
11
D. Lundin et al. Cross-field ion transport during high power impulse magnetron sputtering
experiment. It is therefore concluded that it is possible that the difference between the
HiPIMS and the dcMS side deposition rates are underestimated in our case.
It is clear from the measurements presented here that a considerable amount of
deposition material is captured on the side walls of the deposition vessel, and particularly so
in the case of HiPIMS. With the design of the present experiment it is difficult to use the
measurements to estimate how much this increased side-transport is contributing to the
observed lower HiPIMS deposition rate observed on positions facing the target. However, it
cannot be excluded that it is an important factor, especially when considering that the capture
surface of the side-wall is considerably larger (approximately 6.5 times) than the surface
facing the target in the used experimental set-up.
From the discussion above it is concluded that sputtered material in the HiPIMS
mode is deflected sideways, away from the z axis and towards the walls to a larger extent
than for dcMS. An increased deflection by collisions with gas neutrals is discarded because
the gas background is expected to be strongly reduced during the HiPIMS pulse [24] and that
the sideways deflection mechanism gives the metal ions an increased energy (around 20 eV
on average). Among electrical forces that could explain the deflection to the sides, an
ambipolar diffusion field is unlikely because the electrons are well magnetized but not the
ions; an ambipolar electric field with the required direction towards the walls would arise only
if the electrons escaped more easily than the ions. Acceleration to the side walls due to the
high applied external voltage in HiPIMS is also excluded for the simple reason that it has the
wrong polarity.
Instead, it is here proposed that the cause of the sideways deflection of the ions is that
the azimuthal current density Jϕ above the race track exerts a volume force on the ions
tangentially outwards as illustrated in Figure 1b, in accordance with what was stated in the
introduction about radial ion transport related to anomalous transport. This force is
proportional to the current density and the transverse resistivity, i eneϕ ϕη⊥= −F J . The strong
deflection in the HiPIMS mode can be understood by the density-normalized resistivity, η⊥ ,
12
D. Lundin et al. Cross-field ion transport during high power impulse magnetron sputtering
being typically an order of magnitude higher than in dcMS, leading to greater force
transferred to the ions from the electrons. In order to see why there is an increase in resistivity,
it is necessary to look into anomalous transport in more detail.
The macroscopic transverse resistivity given by the average over the azimuthally
traveling wave structure can be rewritten as /en E J nϕ ϕ eη⊥ =< > < > [20]. The effective
momentum transfer time, often called the effective electron collision time,τc, is related to the
resistivity through
2e
c e ge c e
m Be n en
ητ ω τ⊥ = = , (1)
where the electron angular gyro frequency, /ge eeB mω = . The product ωgeτc can, in the bulk
plasma of magnetrons, where the current is carried mainly by the electrons, be directly
obtained from a macroscopic measurement of the current density ratio as ωgeτc = Jϕ / JD [5],
where JD is the discharge current density. In the case where the current is driven by an electric
field, this follows directly from the ratio between the Hall and Pedersen conductivities [25],
σH and σP respectively, and does not require ωgeτc >> 1 as sometimes stated:
2 2
2 2
2 2
1
1
ge ce
ge cHge c
ge cD P e
ge c
enEBJ E
J E enEB
ϕ
ω τω τσ ω τ
ω τσω τ
⋅ ⋅+
= = =⋅ ⋅
+
. (2)
In dcMS, measurements of Jϕ / JD give typical values in the range 8 < ωgeτc < 30 [26, 27],
which is often referred to as the Bohm regime. Note that for the upper limit reference 26
proposes the value ωgeτc = 16, but we find that it better fits ωgeτc = 30. In HiPIMS and mid-
frequency pulsed magnetrons, recent measurements [14, 15, 28] agree on a value close to
ωgeτc = 2. This means that the ratio of azimuthal current density to the discharge current
density (or equivalently ωgeτc), being roughly one order of magnitude lower compared to
dcMS discharges, increases the transverse resistivity and thereby the tangential force on the
ions.
13
D. Lundin et al. Cross-field ion transport during high power impulse magnetron sputtering
For a numerical estimate of the ion acceleration due to the increased azimuthal force,
quantities at the location of the maximum Jϕ current density, which is at z = 0.01 m above the
race track, are taken. At the time of discharge current maximum, the following values are
used (scaled from a study by Bohlmark et al. [14], as discussed by Lundin et al. [15]) : B =
0.03 T, ne = ni = 1019 m-3, Jϕ = 20×103 Am-2, and /( ) 0.01 mge c eB enη ω τ⊥ = = Ω
/ inϕ
. The
average azimuthal force per ion /i i in enϕ η⊥< > = −F J
/ 10 eViW F l eϕ
, is with these values 3×10-17 N/ion.
Ions above the race track will be subject to this force over a distance of typically l = 0.05 m
(see Figure 1) and gain an average energy of < Δ >= ⋅ ≈
15 eV
. The sideways
velocity gain, added to a predominantly vertical velocity (i.e. in the z direction) corresponding
to about 5 eV from the sputtering process, is of the right order to give the observed deflection
to the sides. Also, it gives a total average energy iW< >≈
,phasev
, in good agreement with the
average ion energy of 18 eV in Figure 5. The spread in ion energy around the average is the
expected result of different phase matching between individual ions and the wave structure as
well as collisions. It can separately be checked if the highest ion energies of Figure 5 can
result from the proposed acceleration mechanism. Ions that are accelerated azimuthally by the
wave structure can reach at most the wave phase velocity ϕ . Since the waves are driven
by the azimuthal electron drift eu ϕ relative to the much slower moving ions, the situation is
the following: u u,max ,i phase euϕ ϕ ϕ . The range of ≤ ≤ eu ϕ from 1.3×10⁴ m s-1 (at z = 0.01 m) to
5×10⁴ m s-1 (at z = 0.04 m) in the HiPIMS setup corresponds to a range in
from 40 to about 600 eV , consistent with the measured highest ion energies in
2 / 2i eu ϕ,maxiW m=
Figure 5
taking into consideration that the maximum detection energy is 100 eV. It is important to
understand that the wave phase speed is a theoretical upper limit. The ions can probably not
reach the full phase speed because of the limitations in spatial extent of the region where there
is strong wave activity (i.e. in the torus-shaped plasma close to the race track region).
Last, the azimuthal kick of the ions as observed from the race track was verified
in Figure 7, which is consistent of the picture of ions tangentially leaving the race track region
14
D. Lundin et al. Cross-field ion transport during high power impulse magnetron sputtering
in the opposite direction of Jϕ as shown in Figure 1b. It can be also be seen that there is a
small fraction of ions with Ei > 20 eV being measured by the mass spectrometer placed at
position S2, contrary to what is expected if the ions were accelerated by the transport
mechanism described. One possibility would be that the high-energy accelerated ions leaving
the race track region undergo a collision as depicted in Figure 1b (the mean free path for these
pressures is estimated to less than 0.1 m), which would change the direction enough, as well
as lower the ion energy, so as to produce this type of distribution. On the other hand, the
minimum in energy found around 5 eV on the HiPIMS curve of Figure 6, but not detected for
dcMS, cannot be explained by azimuthal acceleration since the minimum looks identical
when examining the distributions from both sides of the race track in Figure 7. The energy
spectrum in this range is therefore probably determined by some other mechanism.
Conclusions
It is found that a substantial fraction of sputtered material is accelerated and transported
radially away from the cathode and lost to the walls in HiPIMS discharges. This can help in
understanding the decreased deposition rate measured for HiPIMS. The mechanisms for this
radial acceleration of the target ions is believed to be due to a type of modified ion transport
resulting from anomalous electron transport, previously reported in several pulsed magnetron
experiments. In a series of time-averaged ion energy measurements, the Ti+ energy
distributions were recorded, which confirmed theoretical estimations on this type of transport
regarding energy and direction.
Acknowledgements
This work was partly supported by the European Commission within the 6th framework
(integrated project: InnovaTiAl).
15
D. Lundin et al. Cross-field ion transport during high power impulse magnetron sputtering
16
References
[1] Mozgrin D V, Fetisov I K and Khodachenko G V 1995 Plasma Phys. Rep. 21 400
[2] Kouznetsov V, Macák K, Schneider J M, Helmersson U and Petrov I 1999 Surf. Coat.
Technol. 122 290
[3] Macák K, Kouznetsov V, Schneider J M, Helmersson U and Petrov I 2000 J. Vac. Sci.
Technol. A 18 1533
[4] Gudmundsson J T, Alami J and Helmersson U 2002 Surf. Coat. Technol. 161 249
[5] Rossnagel S M and Kaufman H R 1986 J. Vac. Sci. Technol. A 4 1822
[6] Helmersson U, Lattemann M, Bohlmark J, Ehiasarian A P and Gudmundsson J T 2006
Thin Solid Films 513 1
[7] Alami J, Persson P O Å, Music D, Gudmundsson J T, Bohlmark J and Helmersson U 2005
J. Vac. Sci. Technol. A 23 278
[8] Christie D J 2005 J. Vac. Sci. Technol. A 23 330
[9] Helmersson U, Lattemann M, Alami J, Bohlmark J, Ehiasarian A P and Gudmundsson J T
2005 Proceedings of the 48th Annual Technical Conference of the Society of Vacuum Coaters
(Denver, CO, USA) p 458
[10] Konstantinidis S, Dauchot J P, Ganciu M and Hecq M 2006 Appl. Phys. Lett. 88 021501
[11] Bugaev S P, Koval N N, Sochugov N S and Zakharov A N 1996 Proceedings of the
XVIIth International Symposium on Discharges and Electrical Insulation in Vacuum
(Berkeley, CA, USA) p 1074
[12]Bohlmark J, Östbye M, Lattemann M, Ljungcrantz H, Rosell T and Helmersson U 2006
Thin Solid Films 515 1928
[13] Emmerlich J, Mráz S, Snyders R, Jiang K and Schneider J M in press 2007 Vacuum
doi:10.1016/j.vacuum.2007.10.011
[14] Bohlmark J, Helmersson U, VanZeeland M, Axnäs I, Alami J and Brenning N 2004
Plasma Sources Sci. Technol. 13 654
D. Lundin et al. Cross-field ion transport during high power impulse magnetron sputtering
17
[15] Lundin D, Helmersson U, Kirkpatrick S, Rohde S and Brenning N 2008 Plasma Sources
Sci. Technol. 17 025007
[16] Brenning N, Hurtig T and Raadu M A 2005 Phys. Plasmas 12 012309
[17] Hsia J B, Chiu S M, Hsia M F, Chou R L and Wu C S 1979 Phys. Fluids 22 1737
[18] Machida S, Abe T and Terasawa T 1984 Phys. Fluids 27, 1928
[19] Hurtig T, Brenning N and Raadu M A 2005 Phys. Plasmas 12 012308
[20] Hurtig T, Brenning N and Raadu M A 2004 Phys. Plasmas 11 33
[21] Bohlmark J, Lattemann M, Gudmundsson J T, Ehiasarian A P, Aranda Gonzalvo Y,
Brenning N and Helmersson U 2006 Thin Solid Films 515 1522
[22] Aranda Gonzalvo Y Hiden Analytical Ltd. private communication
[23] Ehiasarian A P, Hovsepian P Eh, Hultman L and Helmersson U 2004 Thin Solid Films
457 270
[24] Kadlec S 2007 Plasma Proc. Polym. 4 S419
[25] Fälthammar C-G 1991 Space Physics (Stockholm) Department of Plasma Physics, Royal
Institute of Technology p 50
[26] Rossnagel S M and Kaufman H R 1987 J. Vac. Sci. Technol. A 5 2276
[27] Bradley J W, Thompson S and Aranda Gonzalvo Y 2001 Plasma Sources Sci. Technol.
10 490
[28] Vetushka A and Bradley J W 2007 J. Phys. D 40 2037