Embed Size (px)
Citation preview
ECOPHYSIOLOGY
Linking water uptake with rooting patterns in grassland species
Jesse B. Nippert Æ Alan K. Knapp
Received: 20 April 2006 / Accepted: 28 March 2007
� Springer-Verlag 2007
Abstract Water availability strongly governs grassland
primary productivity, yet this resource varies dramatically
in time (seasonally) and space (with soil depth and
topography). It has long been assumed that co-occurring
species differ in their partitioning of water use by depth,
but direct evidence is lacking. We report data from two
growing seasons (2004–2005) in which we measured the
isotopic signature of plant xylem water from seven species
(including C3 forbs and shrubs and C4 grasses) growing
along a topographic gradient at the Konza Prairie Biolog-
ical Station. Plant xylem stable oxygen isotope ratio (d18O)
values were compared to soil water d18O profiles, recent
rainfall events, and groundwater. Species varied in both
their temporal patterns of water use and their responses to
seasonal droughts in both years. During wet periods, spe-
cies differences in water use were minimal, with common
dependency on recent rainfall events stored in the upper
soil layers. However, during dry periods, most C3 species
used proportionally more water from deeper portions of the
soil profile relative to the C4 grasses. Plants in uplands used
more shallow soil water compared to those in lowlands,
with the greatest differences across the topographic gradi-
ent occurring during dry periods. While the documented
vertical root distribution varies by species and growth form
in this grassland, each of the species we measured appeared
to compete for the same surface layer soil moisture when
water was not limiting. Thus, our results suggest that var-
iation in precipitation history and landscape positions are
greater determinants of water-use patterns than would be
expected based on absolute rooting depth.
Keywords C3 plants � C4 plants � Stable oxygen isotope
ratio � Tallgrass prairie � Mixing model
Introduction
Much of our present-day ecological understanding of
grassland root structure and function is based on the sem-
inal research of Prof. John Weaver and his students. From
the 1920s to 1950s, Weaver mapped root distribution by
depth of grassland plant assemblages from Iowa to Kansas
(Weaver and Albertson 1943). Weaver determined that
65% of ‘‘true prairie’’ species (tallgrass) had rooting
depths greater than 1.5 m (up to 7 m deep), and of these
deep-rooted species, only 20% relied on shallower
(<1.5 m) soil for water and nutrients (Weaver 1966). The
ability of forb populations to persist through prolonged
droughts reinforced his speculation that sub-dominant C3
species must rely on deeper soil water sources than
co-occurring grass species (Weaver 1966). After decades
of research, Weaver concluded that the vertical layering of
roots within the soil profile permitted the co-occurrence
of many species in the tallgrass prairie (Weaver 1966).
Understanding landscape patterns of species occurrence
requires information on functional root distribution and the
responses of species or growth forms to environmental
drivers that vary by soil depth, landscape position, and time
(Turner and Knapp 1996). C4 grasses, which are the
dominant growth form in tallgrass prairie (Smith and
Communicated by Zoe Cardon.
A. K. Knapp
Department of Biology, Graduate Degree Program in Ecology,
Colorado State University, Fort Collins, CO 80523, USA
J. B. Nippert (&)
Division of Biology, Kansas State University,
Manhattan, KS 66506, USA
e-mail: [email protected]
123
Oecologia
DOI 10.1007/s00442-007-0745-8
Knapp 2003), concentrate total root biomass in the shallow
soil layers (0–10 cm), but can have roots to depths > 2 m
(Albertson 1937). Shrub and forb species also concentrate
roots in surface soil layers (0–30 cm) and have reduced
root densities throughout the soil profile compared to
grasses, but have greater root diameters and a greater
proportion of roots at depth (up to 3 m) (Albertson 1937;
Weaver 1954; Turner et al. 1995; Sun et al. 1997). Dif-
ferences in the proportion of root biomass by depth may
permit C3 herbaceous and woody species to supplement
total water used with deeper soil water during dry periods
and use shallow soil water after rain events (Boutton et al.
1999).
Despite the recognized importance of water and its
influence on patterns of aboveground net primary produc-
tion (ANPP) in grasslands (Knapp and Smith 2001), eco-
logical studies addressing belowground plant activity and
functional rooting depth are rare, primarily because of the
difficulty in assessing root growth, turnover and activity
(Polley et al. 1992; Craine et al. 2002). An alternate
approach to soil excavation and root mapping for inferring
functional rooting depth and resource use has been to
measure stable isotopic signatures of water. Natural frac-
tionation alters the stable isotopic composition of water as
a function of season, location, rainfall event size, and
evaporative demand (see Ehleringer and Dawson 1992).
These effects lead to an isotopic signature of plant xylem
water that is unique to the source from which the water was
acquired (White et al. 1985). This technique has several
advantages over descriptive analyses of rooting depth.
Previous research has shown that the occurrence of live
roots at a particular depth does not equate to uptake of
water by those roots, regardless of whether the water
supply is deep (Thorburn and Ehleringer 1995) or shallow
(Dawson and Ehleringer 1991). Similarly, comparisons of
water uptake under controlled conditions (growth chamber
or pot studies) often fail to incorporate competitive eco-
logical interactions that are common in plant communities
(Chapin 1991; Craine et al. 2002). The use of the stable
isotope ratios of water allows for interpretation of water
uptake among natural community assemblages in relation
to precipitation history, providing a direct assessment of
water uptake among co-existing species.
Our goal was to link belowground structure, as docu-
mented by Weaver nearly a century ago (Table 1), with
function (water uptake). Specifically, we hypothesized that
if species differences in water uptake exist within the
tallgrass prairie, these would vary according to temporal
patterns in precipitation and with patterns of soil wetting
and drying. Additionally, because grass species have
greater total belowground biomass in the upper soil layers
compared to other grassland species (Canadell et al. 1996),
we proposed that grasses would consistently rely more on
soil water in the shallowest soil layers compared to C3
forbs and shrubs. If C3 species have greater reliance on
deeper (>30 cm) soil water than the C4 grasses regardless
of time period, this response may reduce belowground
competition, permitting C3 forb and shrub species to persist
over time within an ecosystem dominated by C4 species.
Greater reliance on deeper soil moisture by C3 species
would also support Weaver’s observations of C3 persis-
tence through drought when C4 species were previously
lost from this ecosystem (Weaver 1966). Finally, we pre-
dicted that differences in water-use patterns would likely
be most pronounced at upland sites, which have shallower
soils and experience greater evaporational demands.
Therefore, species growing in uplands were expected to be
more reliant on shallow soil water compared to lowland
and hillside locations with deeper soils.
Materials and methods
Research was conducted at the Konza Prairie Biological
Station (KPBS), a 3,487-ha unplowed native tallgrass
prairie managed within the framework of the Long-Term
Ecological Research Network. KPBS is located in the Flint
Hills of eastern Kansas, USA (39�05¢N, 96�35¢W), a region
Table 1 Hypothesized differences in water use from different soil depths based on Weaver’s published reports of maximum rooting depth for
the seven species measured in this study
Plant type Species Maximum root
depth (m)
Citation Predicted water use
C4 grass Andropogon gerardii 2.13 Weaver and Darland (1949) Water use will be concentrated
in surface soil layers (top 30 cm)Schizachyrium scoparium 1.22
Sorghastrum nutans 1.83
C3 forb Lespedeza capitata 2.74 Weaver (1926) Rely on surface layer water early,
and deep soil during late seasonVernonia baldwinii 3.35
C3 shrub Amorpha canescens 4.87 Weaver (1919) Consistent reliance on deep
soil water (>30 cm)Ceanothus spp. 4.57 Weaver and Fitzpatrick (1934)
Oecologia
123

characterized by a mid-continental climate consisting of
cool, dry winters and warm, wet summers. The site is di-
vided into drainage basins (watersheds) with varying strata
of Permian chert-bearing shales and limestones. The effect
of long-term weathering and erosion has created a non-
uniform topography, with relief of 20–50 m within water-
sheds, consisting of flat upland ridges, steep intermediate
hillsides, and lowlands with deep soils (Oviatt 1998). Soil
depth varies by location with thin, rocky upland soils
characteristic of the surficial Florence limestone bedrock
(<0.5 m), while lowland soils are silty-clay loams (Tully
soils) and can be relatively deep (>2 m) (Schimel et al.
1991; Ransom et al. 1998).
In April 2003, two randomly located transects were
established in east–west directions in two annually burned,
ungrazed watersheds (watersheds 1B and 1D, respectively).
These watersheds were selected because annual burning
results in the greatest water limitation (Briggs and Knapp
1995), and these watersheds had been burned in late April
of each year for the past 24 years. Within each watershed,
two transects > 100 m long were permanently marked and
spanned the topographic gradient from upland to lowland.
Therefore, samples were collected monthly from June to
August 2004 and 2005 from four transects containing the
three characteristic topographic locations on site: upland,
hillside, and lowland.
Plant sampling
Plant species composition from each sampling location was
surveyed in June 2003. The seven most abundant perennial
species were chosen as the target species from the 53 total
species encountered over all locations. These species in-
clude three C4 grasses (Andropogon gerardii, Sorghastrum
nutans, and Schizachyrium scoparium), two C3 forbs
(Lespedeza capitata and Vernonia baldwinii) and two small
C3 shrubs (Amorpha canescens and Ceanothus americ-
anus). L. capitata and A. canescens are also both legumes.
Only the grass species and A. canescens were present at
every location, but all seven species co-occurred at over
half of the sampling locations (Table 2).
For the collection of plant xylem water, approximately
20–30 g of plant tissue was collected from the crown re-
gion of each species. The crown region was non-photo-
synthetic and is located immediately below ground level,
but above the rhizomes. Due to the destructive nature of the
sampling, different individuals for each species were col-
lected for subsequent sampling periods. Samples were cut
into 1- to 3-cm lengths and placed into sealed exetainer
vials (Labco, UK) and immediately stored on ice until
transferred to a 1–2�C refrigerator. For each grass species,
each vial was a composite sample of five to 15 co-located
tillers to provide enough water for the CO2 equilibration
process. For the forb and shrub species, one individual
provided enough water per sample vial. At each sampling
period, three replicates per species were collected for each
replicate location and stored in separate exetainers. These
replicates constitute the sampling unit. Replicate individ-
uals for each species were collected at least 1 m apart to
capture more of the variability present per location.
Xylem water was extracted from plant samples using
cryogenic vacuum distillation (Ehleringer and Osmond
1989; Webb and Longstaffe 2003). To ensure that water
samples did not fractionate during the extraction process,
water standards were also run through the line and pro-
cessed. Variation in these standards was lower than the
known precision of the instrument (~0.1&). Additionally,
samples of plant tissue were routinely weighed and oven
dried to ensure the extraction time was sufficient to
vaporize all xylem water within the plant stem. The stable
oxygen isotope ratio (d18O) of the collected xylem water
was measured using direct equilibration with CO2 (Epstein
and Mayeda 1953). Stable isotopic analyses were per-
formed using a Finnigan Delta-plus (Bremen, Germany)
Table 2 Species occurrencea along the permanent sampling transects. Sampling locations indicate the hierarchy of topographic positions
[upland (Up), hillside (Hill), and lowland (Low)] within transects within watersheds
Growth form Species 1B 1D
1 2 1 2
Up Hill Low Up Hill Low Up Hill Low Up Hill Low
C3 shrub A. canescens + + + + + + + + + + + +
C. americanus + – – + + – + + – + + –
C3 forb L. capitata + + + – + + + + + + – +
V. baldwinii + + + – + + + + + + + +
C4 grass A. gerardii + + + + + + + + + + + +
S. scoparium + + + + + + + + + + + +
S. nutans + + + + + + + + + + + +
a Presence (+) or absence (–) for each species for each sampling location
Oecologia
123
and a Micromass VG Optima (Manchester, UK) isotope
ratio mass spectrometer (IRMS) in the Stable Isotope
Laboratories at Kansas State and Colorado State Univer-
sities, respectively. Analyses were cross-calibrated
between locations using a subset of identical samples and
variation was minimal (0.18&). Both instruments operate
in continuous-flow with peripheral gas bench microgas
injectors. Isotopic abundance is expressed in d notation as
parts per mil (&) according to:
d18O ¼ ½ðRsample= RstandardÞ � 1� � 1000 ð1Þ
where Rsample and Rstandard are the molar abundance ratios,18O:16O of the sample and standard (Vienna standard mean
ocean water), respectively. Raw values were corrected
based on calibration curves developed using internal
laboratory standards. The working laboratory standard
(deionized water, d = –7.64) averaged (±1 SD)
–7.61(0.24), and –7.62(0.26)& when measured within and
across runs, respectively. Arbitrarily selected blind repli-
cates were sent to the Idaho Stable Isotope Laboratory
(Moscow, Idaho), and differed by <0.15& compared to the
values obtained in our analyses.
Soil sampling
Soil samples were collected adjacent to plant tissues using
a 5-cm-diameter sliding hammer corer (AMS Samplers,
USA). One soil core was taken per location/sampling date
to 35 cm or the maximum depth achievable through the
extremely rocky soils. Because most of the sampling
locations were inaccessible by vehicle, frequent soil coring
to deep depths with a hydraulic corer was not possible, and
frequent digging of large soil pits was not consistent with
site management plans. Therefore, to determine the d18O
profile of soil water at greater depth, we used a Geoprobe
hydraulic direct push corer (model 6600; Geoprobe Sys-
tems, Kan.) on the north transects of watershed 1B during
the final sampling period in August 2005. This instrument
extracted soil samples to 2 m deep (or bedrock). Cores
were immediately separated into 5-cm increments, stored
in two-layer plastic bags and placed on ice. Long-term
sample storage was in a freezer at –4�C until they were
analyzed. The stable isotopic signature of soil water was
quantified in 5-cm increments for the first 30 cm and in
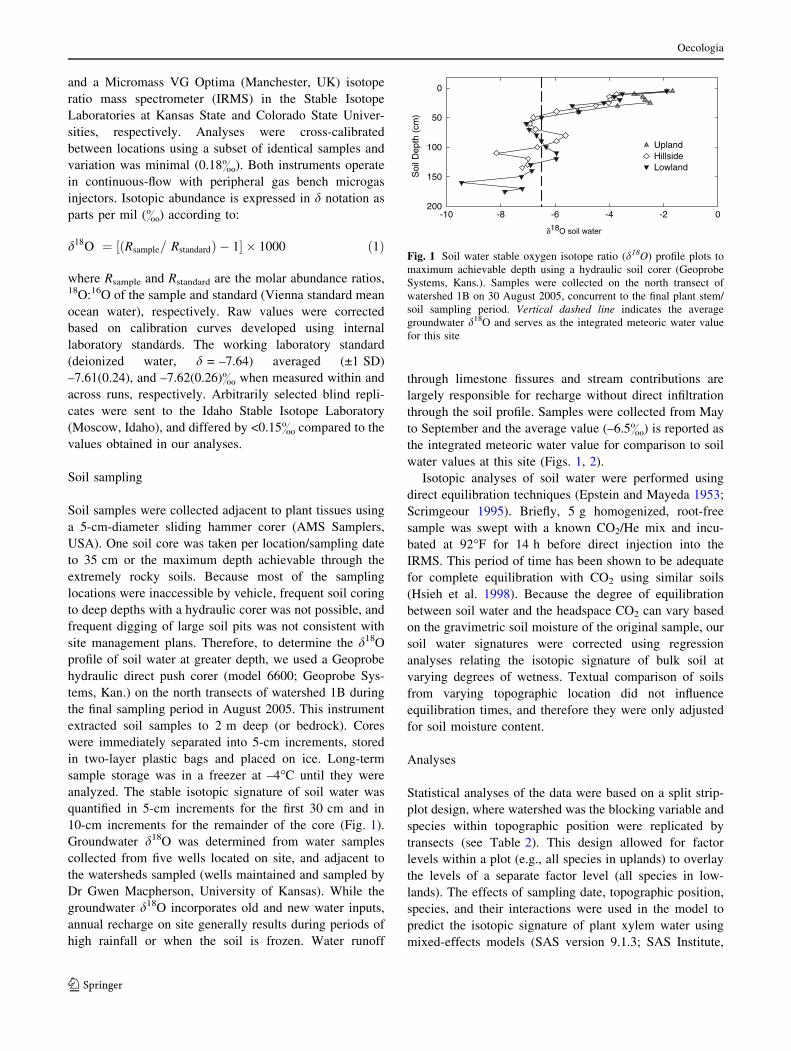
10-cm increments for the remainder of the core (Fig. 1).
Groundwater d18O was determined from water samples
collected from five wells located on site, and adjacent to
the watersheds sampled (wells maintained and sampled by
Dr Gwen Macpherson, University of Kansas). While the
groundwater d18O incorporates old and new water inputs,
annual recharge on site generally results during periods of
high rainfall or when the soil is frozen. Water runoff
through limestone fissures and stream contributions are
largely responsible for recharge without direct infiltration
through the soil profile. Samples were collected from May
to September and the average value (–6.5&) is reported as
the integrated meteoric water value for comparison to soil
water values at this site (Figs. 1, 2).
Isotopic analyses of soil water were performed using
direct equilibration techniques (Epstein and Mayeda 1953;
Scrimgeour 1995). Briefly, 5 g homogenized, root-free
sample was swept with a known CO2/He mix and incu-
bated at 92�F for 14 h before direct injection into the
IRMS. This period of time has been shown to be adequate
for complete equilibration with CO2 using similar soils
(Hsieh et al. 1998). Because the degree of equilibration
between soil water and the headspace CO2 can vary based
on the gravimetric soil moisture of the original sample, our
soil water signatures were corrected using regression
analyses relating the isotopic signature of bulk soil at
varying degrees of wetness. Textual comparison of soils
from varying topographic location did not influence
equilibration times, and therefore they were only adjusted
for soil moisture content.
Analyses
Statistical analyses of the data were based on a split strip-
plot design, where watershed was the blocking variable and
species within topographic position were replicated by
transects (see Table 2). This design allowed for factor
levels within a plot (e.g., all species in uplands) to overlay
the levels of a separate factor level (all species in low-
lands). The effects of sampling date, topographic position,
species, and their interactions were used in the model to
predict the isotopic signature of plant xylem water using
mixed-effects models (SAS version 9.1.3; SAS Institute,
δ18O soil water
-10 -8 -6 -4 -2 0
)mc( htpe
D lioS
0
50
100
150
200
UplandHillsideLowland
Fig. 1 Soil water stable oxygen isotope ratio (d18O) profile plots to
maximum achievable depth using a hydraulic soil corer (Geoprobe
Systems, Kans.). Samples were collected on the north transect of
watershed 1B on 30 August 2005, concurrent to the final plant stem/
soil sampling period. Vertical dashed line indicates the average
groundwater d18O and serves as the integrated meteoric water value
for this site
Oecologia
123
Cary, N.C.). The Satterthwaite approximation was used in
the estimate of denominator df. The random effects struc-
ture of the model included multiple separate error terms:
watershed, the interaction of watershed with transect and
species individually, and watershed · transect · species.
Sample date was not used as a repeated measure since
different individuals per species were randomly selected
and sampled at successive intervals. The assumptions of
homogeneity of variance and the residual normality were
tested and met in all analyses.
To determine the percent contribution of soil water at
depth to the signature of water within the plant’s xylem, an
isotopic mixing model was used (Phillips et al. 2005). For
the xylem water mixture for each species · time period, we
calculated all possible solutions consistent with isotopic
mass balance from each soil water source (0–30 cm, in
5-cm increments) and a proxy of deep soil water. This
proxy was winter precipitation (October–March: –10.3 and
–10.1& in 2003–2004 and 2004–2005, respectively;
Fig. 3). Winter precipitation infiltrates to deeper soil layers
without the evapotranspirational demand common in
shallow soil layers during the growing season. Because the
uncertainty associated with the frequency distributions
from seven contributing sources was high, we summed all
feasible solutions from each model iteration for the surface
soil layers (0–30 cm) using the a posteriori approach out-
lined by Phillips et al. (2005). Based on these new
‘‘aggregate’’ sources (0–30 cm soil and ‘‘deep soil’’), new
frequency distributions were calculated in 2% increments
for proportional water source use for each species · time
period. The frequency distributions were normalized to
make species comparisons more interpretable by multi-
plying each frequency by 100 and dividing by the total
number of possible solutions (commonly over 45,000).
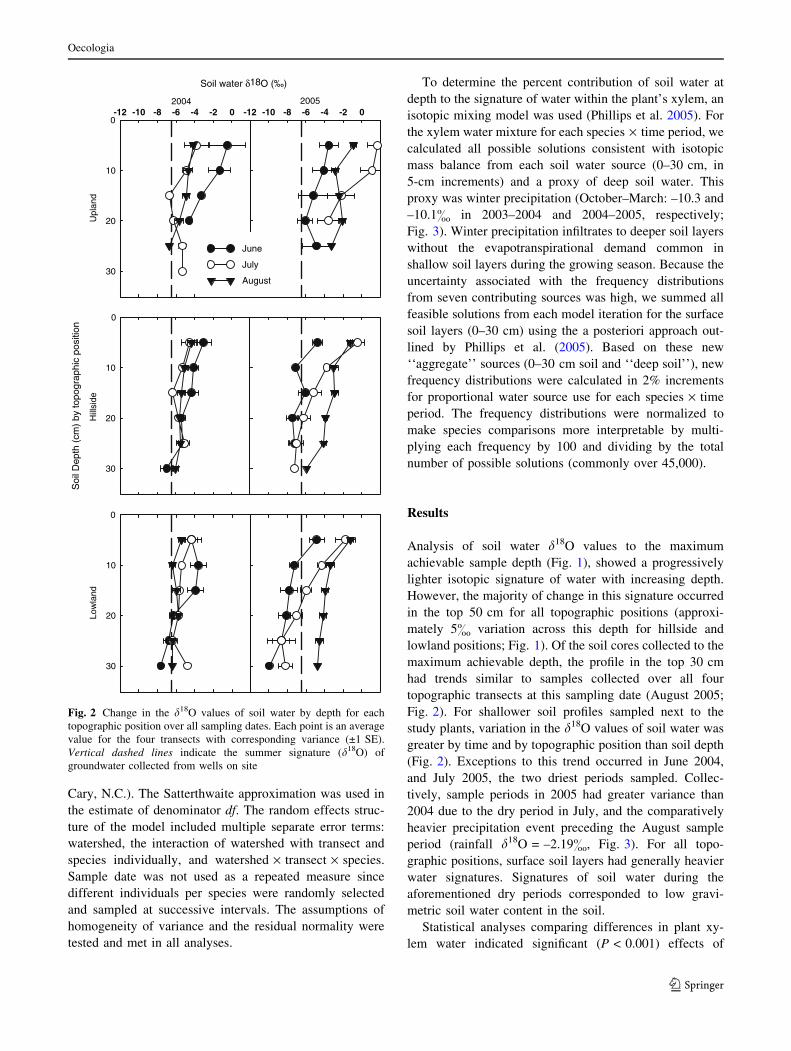
Results
Analysis of soil water d18O values to the maximum
achievable sample depth (Fig. 1), showed a progressively
lighter isotopic signature of water with increasing depth.
However, the majority of change in this signature occurred
in the top 50 cm for all topographic positions (approxi-
mately 5& variation across this depth for hillside and
lowland positions; Fig. 1). Of the soil cores collected to the
maximum achievable depth, the profile in the top 30 cm
had trends similar to samples collected over all four
topographic transects at this sampling date (August 2005;
Fig. 2). For shallower soil profiles sampled next to the
study plants, variation in the d18O values of soil water was
greater by time and by topographic position than soil depth
(Fig. 2). Exceptions to this trend occurred in June 2004,
and July 2005, the two driest periods sampled. Collec-
tively, sample periods in 2005 had greater variance than
2004 due to the dry period in July, and the comparatively
heavier precipitation event preceding the August sample
period (rainfall d18O = –2.19&, Fig. 3). For all topo-
graphic positions, surface soil layers had generally heavier
water signatures. Signatures of soil water during the
aforementioned dry periods corresponded to low gravi-
metric soil water content in the soil.
Statistical analyses comparing differences in plant xy-
lem water indicated significant (P < 0.001) effects of
Soil water δ18O (‰)
-12 -10 -8 -6 -4 -2 0
dnalpU
0
10
20
30
2004-12 -10 -8 -6 -4 -2 0
2005
noitisop cihpargopot yb )mc( htpe
D lioS
0
10
20
30
dnalwoL
0
10
20
30
June
July
August
edislliH
Fig. 2 Change in the d18O values of soil water by depth for each
topographic position over all sampling dates. Each point is an average
value for the four transects with corresponding variance (±1 SE).
Vertical dashed lines indicate the summer signature (d18O) of
groundwater collected from wells on site
Oecologia
123

sampling date, topographic position and species main ef-
fects on the isotopic signature of water within the plant
stems. The interactions of date · topography and
date · species were also highly significant (P < 0.001).
Henceforth, interpretations of water use and xylem water
differences are expressed in terms of these two-way
interactions. A significant (P = 0.004) three-way interac-
tion between predictor variables was present, but did not
provide any further relevance to the hypotheses tested.
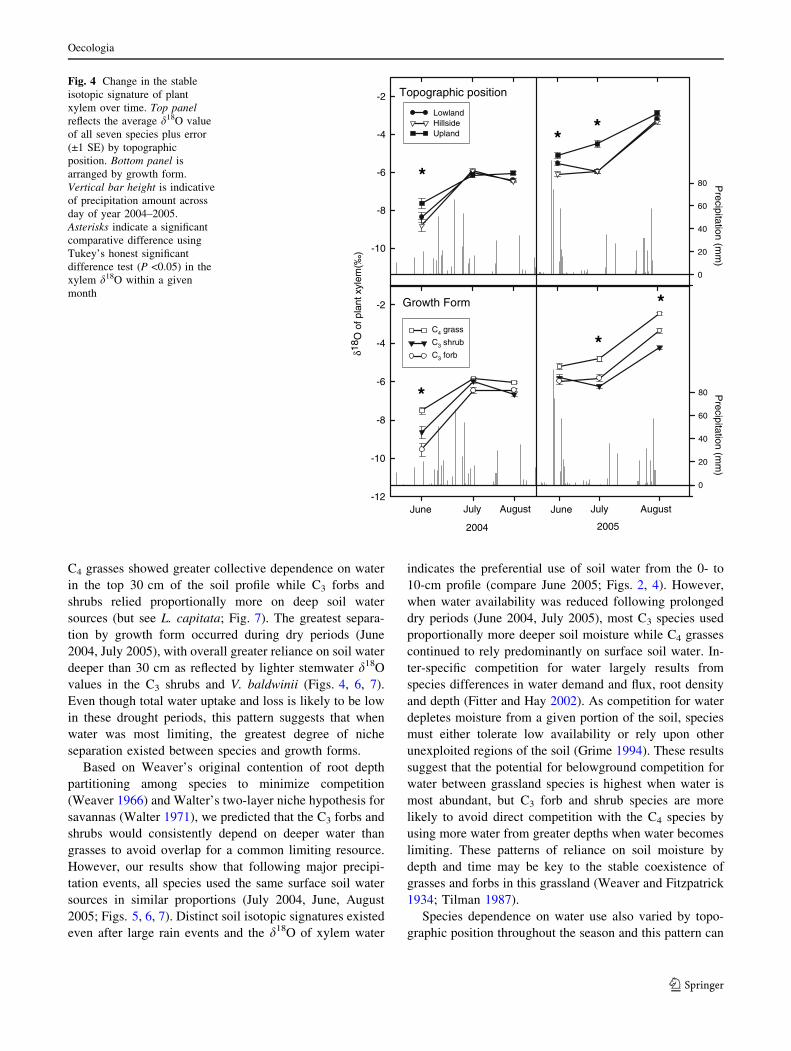
The average xylem d18O values varied by nearly 5&
over both growing seasons (Fig. 4). This variation in the
xylem signature reflects the precipitation history and dif-
ferences between topographic positions over time (Fig. 4).
Precipitation was collected regularly on KPBS and ana-
lyzed for d18O (Fig. 3). The d18O of the rainfall exhibited
clear seasonal variations that reflect the influence of tem-
perature and storm size as ambient fractionation factors in
the hydrologic cycle (Gat 1996). When analyzed by topo-
graphic position, samples collected soon after rainfall
events had xylem water signatures that were more similar
compared to drier periods (Fig. 4). Following several
weeks with minimal rainfall, uplands had collectively
heavier isotopic signatures than hillside and lowlands,
respectively. Heavier signatures reflect increased evapora-
tive enrichment of soil water resulting at upland locations
from reduced plant cover and shallower soils. Plants
growing in the hillside and lowland positions had similar
signatures indicative of precipitation inputs and deeper
water use (Fig. 4).
When patterns of xylem d18O values were analyzed by
growth form, differences in the magnitude of d18O varied
over time (Fig. 4). C4 grass species had a collective xylem
signature that was heavier than that of the C3 shrubs and
forbs following dry periods (June 2004, July 2005).
However, following major precipitation events, xylem
signatures were more similar among growth forms, sug-
gesting greater convergence on similar water sources. The
plasticity of altering water source use appears greatest
during June and early July, as relative shifts in water use
between growth forms were marginal from July to August
of both years, despite varying precipitation patterns be-
tween 2004 and 2005 (Fig. 4).
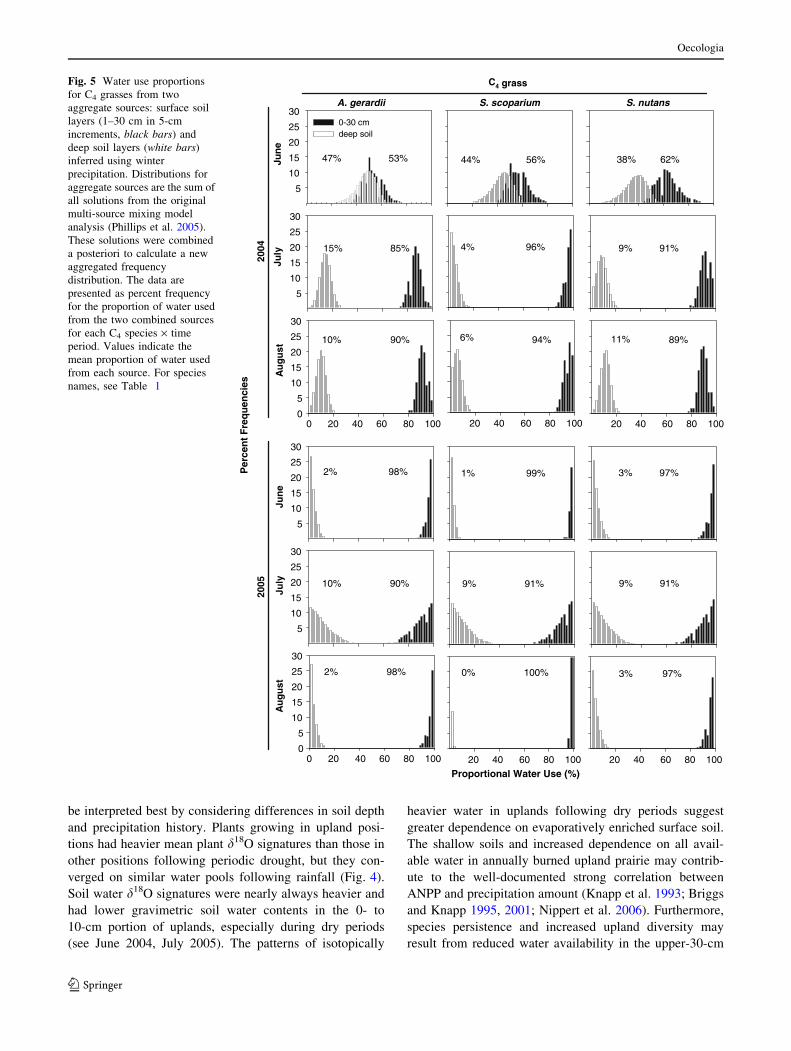
Soil water and winter precipitation d18O values were
used in an isotopic mixing model to determine water
sources contributing to the d18O value of xylem water.
Generally, this approach provided discrete frequency dis-
tributions for the sources of water used by species and time
period (Figs. 5, 6, 7). The only exception was July 2005,
when dry conditions led to more uncertainty for the C3
species predictions (Figs. 6, 7). Except for the sampling
performed during June 2004, water originating from the
surface 30 cm was the most common source for all species
(Figs. 5, 6, 7). Sampling periods following large rainfall
events (4 July, 5 June, 5 August) show a high proportional
dependence on surface soil water by all species (Figs. 5, 6,
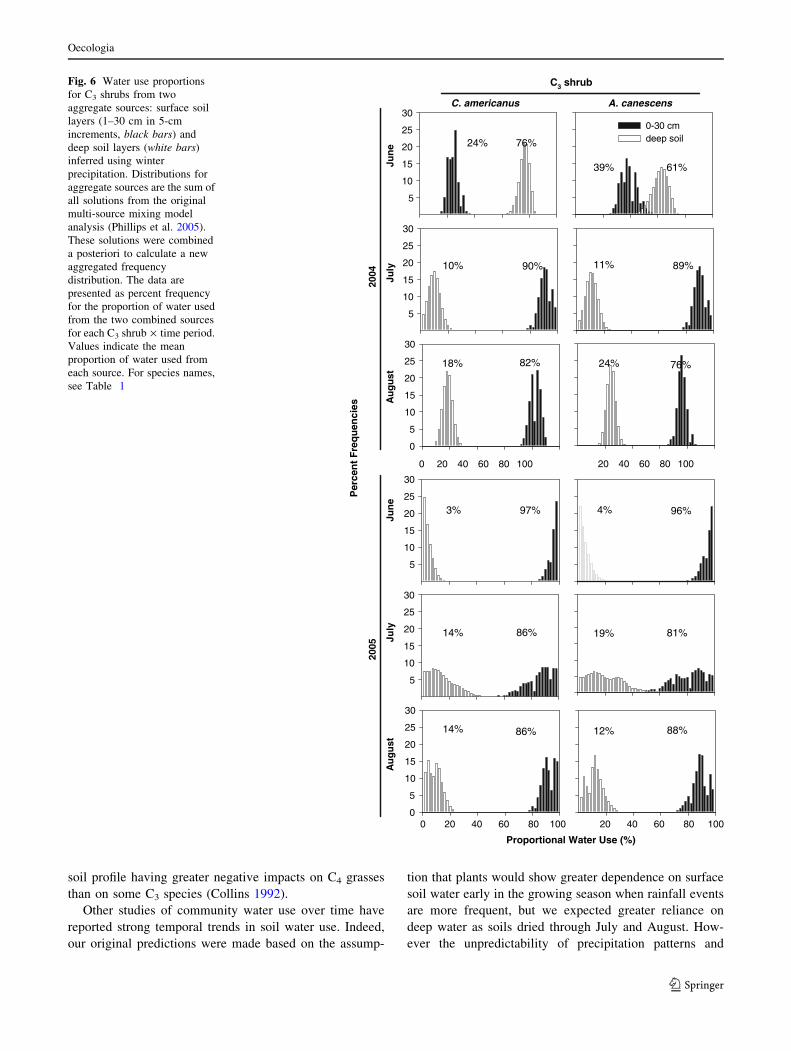
7). Sampling periods conducted after several weeks of
minimal rainfall show more distinct species and growth
form differences in the proportional source of water used (4
June, 5 July) with C3 shrubs and the C3 forb V. baldwinii
having greater proportional reliance on deep water com-
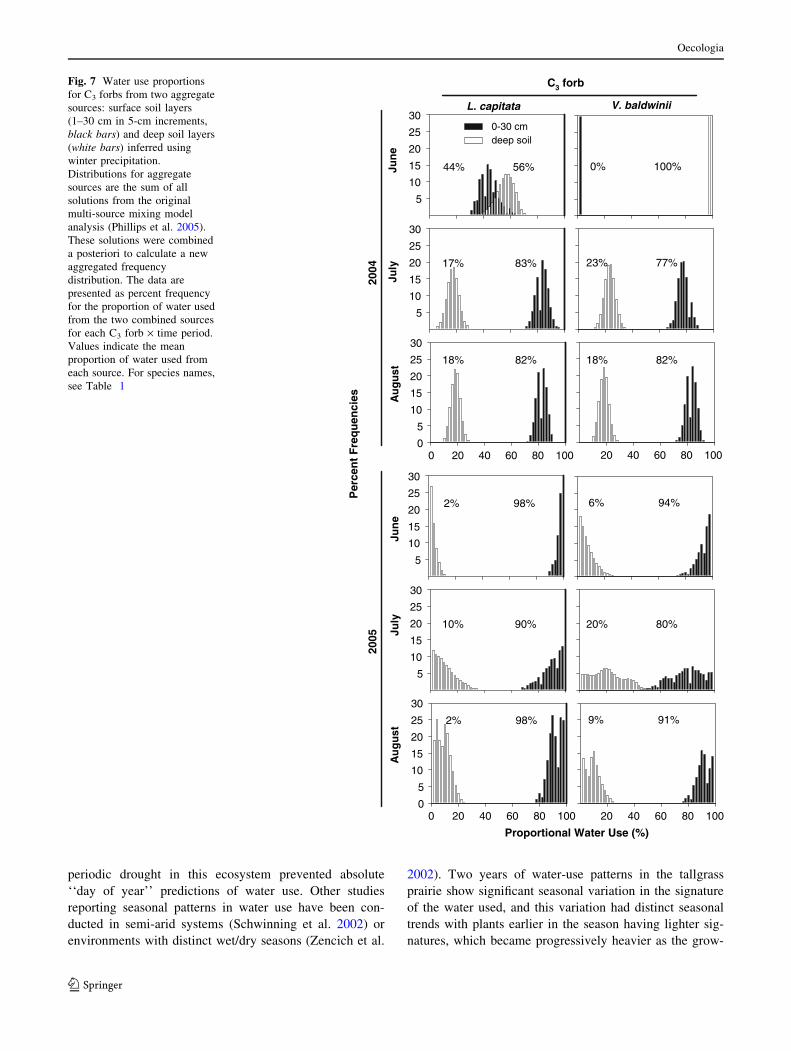
pared to the grasses and L. capitata. (Figs. 6, 7). The
source of water use was generally similar by species within
growth forms. C4 species had a greater average reliance on
shallow soil water and were the least dependent on deep
soil water (Fig. 5). The two C3 shrubs responded similarly
by sampling date, while the response of the C3 forbs was
more varied. V. baldwinii had a stronger reliance on deep
soil water more similar to that of the shrubs than L. capi-
tata, which responded more like the C4 grasses.
Discussion
The use of d18O values as a natural tracer to assess patterns
of water use among co-occurring species is now common
in ecological studies (Le Roux et al. 1995; Thorburn and
Ehleringer 1995; Schulze et al. 1996). Our study used
natural variation in the isotopic signature of precipitation
and soil moisture to provide insight into the potential link
between root function (water uptake) and previously doc-
umented patterns of root deployment in this grassland
(Weaver 1966). We asked the question, do differences in
root distribution among co-occurring tallgrass prairie spe-
cies translate to functional differences in water use as
spatial and temporal patterns in soil moisture vary?
Our results identified a range of species-dependence on
soil water pools, with the most consistent differences
occurring between growth forms (Fig. 4). In general, the
noitatipicerP
δ81
O
-16
-14
-12
-10
-8
-6
-4
-2
0
)m
m( t
nuo
ma n
o ita ti
pice
rP
0
20
40
60
80
100
120
140
07/19/0301/01/03 02/04/04 08/22/04 03/10/05
Fig. 3 Isotopic signature of ambient precipitation events from
rainfall collected on Konza Prairie Biological Station between 17
December 2002 and 25 August 2005. Arrows indicate sampling dates
for plant stem and soil water collections. Bar height on the second x-
axis corresponds to precipitation amount over time on the right y-axis
Oecologia
123
C4 grasses showed greater collective dependence on water
in the top 30 cm of the soil profile while C3 forbs and
shrubs relied proportionally more on deep soil water
sources (but see L. capitata; Fig. 7). The greatest separa-
tion by growth form occurred during dry periods (June
2004, July 2005), with overall greater reliance on soil water
deeper than 30 cm as reflected by lighter stemwater d18O
values in the C3 shrubs and V. baldwinii (Figs. 4, 6, 7).
Even though total water uptake and loss is likely to be low
in these drought periods, this pattern suggests that when
water was most limiting, the greatest degree of niche
separation existed between species and growth forms.
Based on Weaver’s original contention of root depth
partitioning among species to minimize competition
(Weaver 1966) and Walter’s two-layer niche hypothesis for
savannas (Walter 1971), we predicted that the C3 forbs and
shrubs would consistently depend on deeper water than
grasses to avoid overlap for a common limiting resource.
However, our results show that following major precipi-
tation events, all species used the same surface soil water
sources in similar proportions (July 2004, June, August
2005; Figs. 5, 6, 7). Distinct soil isotopic signatures existed
even after large rain events and the d18O of xylem water
indicates the preferential use of soil water from the 0- to
10-cm profile (compare June 2005; Figs. 2, 4). However,
when water availability was reduced following prolonged
dry periods (June 2004, July 2005), most C3 species used
proportionally more deeper soil moisture while C4 grasses
continued to rely predominantly on surface soil water. In-
ter-specific competition for water largely results from
species differences in water demand and flux, root density
and depth (Fitter and Hay 2002). As competition for water
depletes moisture from a given portion of the soil, species
must either tolerate low availability or rely upon other
unexploited regions of the soil (Grime 1994). These results
suggest that the potential for belowground competition for
water between grassland species is highest when water is
most abundant, but C3 forb and shrub species are more
likely to avoid direct competition with the C4 species by
using more water from greater depths when water becomes
limiting. These patterns of reliance on soil moisture by
depth and time may be key to the stable coexistence of
grasses and forbs in this grassland (Weaver and Fitzpatrick
1934; Tilman 1987).
Species dependence on water use also varied by topo-
graphic position throughout the season and this pattern can
δ81
)‰(
melyx tnalp fo O
-12
-10
-8
-6
-4
-2
)m
m( n
oi tat i
pice
rP
0
20
40
60
80
C4 grass
C3 shrub
C3 forb
June July August June July August
2004 2005
Topographic position
-10
-8
-6
-4
-2
)m
m( n
oitat i
pice
rP
0
20
40
60
80
LowlandHillsideUpland
Growth Form
*
**
*
*
*
Fig. 4 Change in the stable
isotopic signature of plant
xylem over time. Top panelreflects the average d18O value
of all seven species plus error
(±1 SE) by topographic
position. Bottom panel is
arranged by growth form.
Vertical bar height is indicative
of precipitation amount across
day of year 2004–2005.
Asterisks indicate a significant
comparative difference using
Tukey’s honest significant
difference test (P <0.05) in the
xylem d18O within a given
month
Oecologia
123
be interpreted best by considering differences in soil depth
and precipitation history. Plants growing in upland posi-
tions had heavier mean plant d18O signatures than those in
other positions following periodic drought, but they con-
verged on similar water pools following rainfall (Fig. 4).
Soil water d18O signatures were nearly always heavier and
had lower gravimetric soil water contents in the 0- to
10-cm portion of uplands, especially during dry periods
(see June 2004, July 2005). The patterns of isotopically
heavier water in uplands following dry periods suggest
greater dependence on evaporatively enriched surface soil.
The shallow soils and increased dependence on all avail-
able water in annually burned upland prairie may contrib-
ute to the well-documented strong correlation between
ANPP and precipitation amount (Knapp et al. 1993; Briggs
and Knapp 1995, 2001; Nippert et al. 2006). Furthermore,
species persistence and increased upland diversity may
result from reduced water availability in the upper-30-cm
5
10
15
20
25
30
53%47%
5
10
15
20
25
30
0-30 cm deep soil
15% 85%
0 20 40 60 80 1000
5
10
15
20
25
30
10% 90%
20 40 60 80 100 20 40 60 80 100
5
10
15
20
25
30
2% 98%
5
10
15
20
25
30
10% 90%
0 20 40 60 80 1000
5
10
15
20
25
30
2% 98%
20 40 60 80 100 20 40 60 80 100
A. gerardii S. scoparium S. nutans
seicne
uqer
F tnecre
P
en
uJyl
uJts
ug
uA
en
uJyl
uJt s
ug
uA
C4 grass
44% 56%
4% 96%
6% 94%
1% 99%
9% 91%
0% 100%
38% 62%
9% 91%
11% 89%
3% 97%
9% 91%
3% 97%
400250 02
Proportional Water Use (%)
Fig. 5 Water use proportions
for C4 grasses from two
aggregate sources: surface soil
layers (1–30 cm in 5-cm
increments, black bars) and
deep soil layers (white bars)
inferred using winter
precipitation. Distributions for
aggregate sources are the sum of
all solutions from the original
multi-source mixing model
analysis (Phillips et al. 2005).
These solutions were combined
a posteriori to calculate a new
aggregated frequency
distribution. The data are
presented as percent frequency
for the proportion of water used
from the two combined sources
for each C4 species · time
period. Values indicate the
mean proportion of water used
from each source. For species
names, see Table 1
Oecologia
123
soil profile having greater negative impacts on C4 grasses
than on some C3 species (Collins 1992).
Other studies of community water use over time have
reported strong temporal trends in soil water use. Indeed,
our original predictions were made based on the assump-
tion that plants would show greater dependence on surface
soil water early in the growing season when rainfall events
are more frequent, but we expected greater reliance on
deep water as soils dried through July and August. How-
ever the unpredictability of precipitation patterns and
5
10
15
20
25
300-30 cmdeep soil
5
10
15
20
25
30
0 20 40 60 80 100
0
5
10
15
20
25
30
20 40 60 80 100
5
10
15
20
25
30
5
10
15
20
25
30
0 20 40 60 80 1000
5
10
15
20
25
30
20 40 60 80 100
C. americanus A. canescens
C3 shrub
61%39%
4% 96%
89%11%
19%
12%
81%
88%
24% 76%
76%24%
10% 90%
18% 82%
3% 97%
14%
14%
86%
86%
seicne
uqer
F tnecre
P
40025002
Proportional Water Use (%)
en
uJyl
uJts
ug
uA
en
uJyl
uJts
ug
uA
Fig. 6 Water use proportions
for C3 shrubs from two
aggregate sources: surface soil
layers (1–30 cm in 5-cm
increments, black bars) and
deep soil layers (white bars)
inferred using winter
precipitation. Distributions for
aggregate sources are the sum of
all solutions from the original
multi-source mixing model
analysis (Phillips et al. 2005).
These solutions were combined
a posteriori to calculate a new
aggregated frequency
distribution. The data are
presented as percent frequency
for the proportion of water used
from the two combined sources
for each C3 shrub · time period.
Values indicate the mean
proportion of water used from
each source. For species names,
see Table 1
Oecologia
123
periodic drought in this ecosystem prevented absolute
‘‘day of year’’ predictions of water use. Other studies
reporting seasonal patterns in water use have been con-
ducted in semi-arid systems (Schwinning et al. 2002) or
environments with distinct wet/dry seasons (Zencich et al.
2002). Two years of water-use patterns in the tallgrass
prairie show significant seasonal variation in the signature
of the water used, and this variation had distinct seasonal
trends with plants earlier in the season having lighter sig-
natures, which became progressively heavier as the grow-
seicne
uqer
F tnec re
P
400250 02
en
uJyl
uJts
ug
uA
en
uJyl
uJts
ug
uA
C3 forb
5
10
15
20
25
30
5
10
15
20
25
30
0 20 40 60 80 1000
5
10
15
20
25
30
20 40 60 80 100
5
10
15
20
25
30
5
10
15
20
25
30
0 20 40 60 80 1000
5
10
15
20
25
30
20 40 60 80 100
L. capitata V. baldwinii
2% 98%
44% 56%
17% 83%
18% 82%
2% 98%
10% 90%
9% 91%
20% 80%
6% 94%
18% 82%
23% 77%
0% 100%
0-30 cmdeep soil
Proportional Water Use (%)
Fig. 7 Water use proportions
for C3 forbs from two aggregate
sources: surface soil layers
(1–30 cm in 5-cm increments,
black bars) and deep soil layers
(white bars) inferred using
winter precipitation.
Distributions for aggregate
sources are the sum of all
solutions from the original
multi-source mixing model
analysis (Phillips et al. 2005).
These solutions were combined
a posteriori to calculate a new
aggregated frequency
distribution. The data are
presented as percent frequency
for the proportion of water used
from the two combined sources
for each C3 forb · time period.
Values indicate the mean
proportion of water used from
each source. For species names,
see Table 1
Oecologia
123

ing season progressed (Fig. 4). However, these differences
appeared to be regulated predominantly by prevailing iso-
topic signatures in precipitation and the preceding drought
conditions prior to rainfall. We would have expected
greater temporal symmetry between years, if plant water
use was influenced more by other factors (such as seasonal
patterns of plant development).
In summary, our results support the conditional accep-
tance of Weaver’s contention that differences in rooting
pattern and depth can provide insight into functional dif-
ferences among grassland species with respect to their
reliance on varying soil water sources. For common tall-
grass prairie species, the functional difference in water use
among C4 grasses and C3 forbs and shrubs varies based on
water availability in surface soils driven by recent precip-
itation history. As Weaver speculated, most C3 species are
using proportionally more water from depth than the C4
grasses during drought. However, when water in the 0- to
30-cm soil depth was plentiful, each of the species we
measured used proportionally similar amounts of this re-
source, contrary to Weaver’s speculation. Therefore, the
greatest potential for competition in this grassland exists
when water is most available, while the greatest degree of
resource partitioning occurs when water is most limiting.
Acknowledgements We thank John Blair, Mike Ryan, and Gene
Kelly for revisions, which significantly improved this manuscript. We
also acknowledge Roxane Fagan, Danielle Bilyeu, Sanjay Advani,
Dan Reuss and Bob Brander for analytical assistance. Don Phillips
provided advice improving our mixing-model analysis. Juan de Dios
Miranda Lopez Marin, Michelle Lett, Amy Seery, Shane Neal, Aaron
Heuter, Grover Reitz, and Jobie Carlisle provided outstanding field
expertise. We received financial and technical support from the NSF
Long-Term Ecological Research Program, the Division of Biology at
Kansas State University, and the Department of Biology at Colorado
State University.
References
Albertson FW (1937) Ecology of mixed prairie in west central
Kansas. Ecol Monogr 7:481–547
Boutton TW, Archer SW, Midwood AJ (1999) Stable isotopes in
ecosystem science: structure, function and dynamics of a
subtropical savanna. Rapid Commun Mass Spectrom 13:
1263–1277
Briggs JM, Knapp AK (1995) Interannual variability in primary
productivity in tallgrass prairie: climate, soil moisture, topo-
graphic position, and fire as determinants of aboveground
biomass. Am J Bot 82:1024–1030
Briggs JM, Knapp AK (2001) Determinants of C3 forb growth and
production in a C4 dominated grassland. Plant Ecol 152:93–100
Canadell J, Jackson RB, Ehleringer JR, Mooney HA, Sala OE,
Schulze E-D (1996) Maximum rooting depth of vegetation at the
global scale. Oecologia 108:583–595
Chapin FS (1991) Integrated responses of plants to stress. BioScience
41:29–36
Collins SL (1992) Fire frequency and community heterogeneity in
tallgrass prairie vegetation. Ecology 73:2001–2006
Craine JM, Wedin DA, Chapin FS III, Reich PB (2002)
Relationship beween the structure of root systems and
resource use for 11 North American grassland plants. Plant
Ecol 165:85–100
Dawson TE, Ehleringer JR (1991) Streamside trees that do not use
stream water: evidence from hydrogen isotope ratios. Nature
350:335–337
Ehleringer JR, Dawson TE (1992) Water uptake by plants: perspec-
tives from stable isotope composition. Plant Cell Environ
15:1073–1082
Ehleringer JR, Osmond CB (1989) Stable isotopes. In: Pearcy RW,
Ehleringer JR, Mooney HA, Rundel PW (eds) Plant physiolog-
ical ecology field methods and instrumentation. Chapman & Hall,
London, pp 281–300
Epstein S, Mayeda T (1953) Variation of 18O content of waters from
natural sources. Geochim Cosmochim Acta 4:213–224
Fitter AH, Hay RKM (2002) Environmental physiology of plants.
Academic Press, San Diego, Calif.
Gat JR. (1996) Oxygen and hydrogen isotopes in the hydrologic
cycle. Annu Rev Earth Planet Sci 24:225–262
Grime JP (1994) The role of plasticity in exploiting environmental
heterogeneity. In: Caldwell MM, Pearcy RW (eds) Exploitation
of environmental heterogeneity by plants. Academic Press, San
Diego, Calif., pp 1–19
Hsieh JCC, Savin SM, Kelly EF, Chadwick OA (1998) Measurement
of soil–water d18O by direct equilibration with CO2. Geoderma
82:255–268
Knapp AK, Smith MD (2001) Variation among biomes in temporal
dynamics of aboveground primary production. Science 291:481–
484
Knapp AK, Fahnestock JT, Hamburg SP, Statland LB, Seastedt TR,
Schimel DS (1993) Landscape patterns in soil–plant water
relations and primary productivity in tallgrass prairie. Ecology
74:549–560
Le Roux X, Bariac T, Mariotti A (1995) Spatial partitioning of the
soil water resource between grass and shrub components in a
West African humid savanna. Oecologia 104:147–155
Nippert JB, Knapp AK, Briggs JM (2006) Intra-annual rainfall
variability and grassland productivity: can the past predict the
future? Plant Ecol 184:65–74
Oviatt CG (1998) Geomorphology of Konza prairie. In: Knapp AK,
Briggs JM, Hartnett DC, Collins SL (eds) Grassland dynamics:
long-term ecological research in tallgrass prairie. LTER, New
York, pp 35–47
Phillips DL, Newsome SD, Gregg JW (2005) Combining sources in
stable isotope mixing models: alternative methods. Oecologia
144:520–527
Polley HW, Johnson HB, Mayeux HS (1992) Determination of root
biomasses of three species grown in a mixture using stable
isotopes of carbon and nitrogen. Plant Soil 142:97–106
Ransom MD, Rice CW, Todd TC, Wehmueller WA (1998) Soils and
soil biota. In: Knapp AK, Briggs JM, Hartnett DC, Collins SL
(eds) Grassland dynamics: long-term ecological research in
tallgrass prairie. LTER, New York, pp 48–68
Schimel DS, Kittel TGF, Knapp AK, Seastedt TR, Parton WJ, Brown
VB (1991) Physiological interactions along resource gradients in
tallgrass prairie. Ecology 72:672–684
Schulze E-D, Mooney HA, Sala OE, Jobbagy E, Buchmann N, Bauer
G, Canadell J, Jackson RB, Loreti J, Oesterheld M, Ehleringer
JR (1996) Rooting depth, water availability, and vegetation
cover along an aridity gradient in Patagonia. Oecologia 108:503–
511
Schwinning S, Davis K, Richardson L, Ehleringer JR (2002)
Deuterium enriched irrigation indicates different forms of rain
use in shrub/grasss species of the Colorado Plateau. Oecologia
130:345–355
Oecologia
123

Scrimgeour CM (1995) Measurement of plant and soil water isotope
composition by direct equilibration methods. J Hydrol 172:261–
274
Smith MD, Knapp AK (2003) Dominant species maintain ecosystem
function with non-random species loss. Ecol Lett 6:509–517
Sun G, Coffin DP, Lauenroth WK (1997) Comparison of root
distributions of species in North American grasslands using GIS.
J Veg Sci 8:587–596
Thorburn PJ, Ehleringer JR (1995) Root water uptake of field-
growing plants indicated by measurements of natural-abundance
deuterium. Plant Soil 177:225–233
Tilman D (1987) The importance of the mechanisms of interspecific
competition. Am Nat 129:769–774
Turner CL, Knapp AK (1996) Responses of a C4 grass and three C3
forbs to variation in nitrogen and light in tallgrass prairie.
Ecology 77:1738–1749
Turner CL, Kneisler JR, Knapp AK (1995) Comparative gas
exchange and nitrogen responses of the dominant C4 grass
Andropogon gerardii and five C3 forbs to fire and topographic
position in tallgrass prairie during a wet year. Int J Plant Sci
156:216–226
Walter H (1971) Ecology of tropical and subtropical vegetation In:
Burnett JH (ed) Oliver and Boyd, Edinburgh
Weaver JE (1919) The ecological relations of roots. Carnegie Institute
Washington publication no 286. Carnegie Institute, Washington,
D.C.
Weaver JE (1926) Root development of field crops. McGraw-Hill,
New York
Weaver JE (1954) A seventeen-year study of plant succession in
prairie. Am J Bot 41:31–38
Weaver JE (1966) Prairie plants and their environment: a fifty-year
study in the Midwest. University of Nebraska Press, Lincoln,
Neb.
Weaver JE, Albertson FW (1943) Resurvey of grasses forbs, and the
underground plant parts at the end of the great drought. Ecol
Monogr 13:63–117
Weaver JE, Darland RW (1949) Quantitative study of root systems in
different soil types. Science 110:164–165
Weaver JE, Fitzpatrick TJ (1934) The prairie. Ecol Monogr 4:111–
295
Webb EA, Longstaffe FJ (2003) The relationship between phytolith-
and plant-water d18O values in grasses. Geochim Cosmochim
Acta 67:1437–1449
White JWC, Cook ER, Lawrence JR, Broecker WS (1985) The D/Hratios of sap in trees: implications for water sources and tree ring
D/H ratios. Geochim Cosmochim Acta 49:237–246
Zencich SJ, Froend RH, Turner JV, Gailitis V (2002) Influence of
groundwater depth on the seasonal sources of water accessed by
Banksia tree species on a shallow, sandy coastal aquifer.
Oecologia 131:8–19
Oecologia
123