Embed Size (px)
Citation preview
Linking TOEFL iBT ™ Scores to IELTS® Scores –
A Research Report
ETSDecember 17, 2010
Linking TOEFL iBT ™ Scores to IELTS® Scores – A Research Report
1
Abstract
TOEFL® test scores have been widely accepted as evidence of nonnative English speakers’ proficiency in the use of English. The TOEFL test measures test takers’ ability to communicate in English‐medium colleges and universities. The TOEFL iBT™ test measures a candidate’s ability to combine listening, reading, speaking and writing skills with authentic and innovative integrated tasks, making it the most comprehensive English‐language proficiency test. Accepted by over 7,500 score users in more than 130 countries, the TOEFL test is the most widely recognized English‐language test in the world. Recently, ETS conducted score comparison research between the TOEFL test and an alternative test, IELTS (International English Language Testing System). For the research, ETS obtained a sample of 1,153 students who had both IELTS and TOEFL scores. Using equipercentile linking, the corresponding TOEFL score that would pass the same percentage of test takers for each IELTS scores was obtained. The score comparison results for each section (Listening, Speaking, Reading, and Writing) and the total test showed that most of the students scored in the middle to mid‐high score ranges on both tests. Limitations of the research and suggestions for future research are also discussed.
Linking TOEFL iBT ™ Scores to IELTS® Scores – A Research Report
2
Linking TOEFL iBT™ Scores to IELTS Scores
Introduction
TOEFL® test scores have been widely accepted by educational and other institutions throughout the world as
evidence of nonnative English speakers’ proficiency in English language use, and the TOEFL test has received
very positive feedback from score users and instructors in the English as a Second Language (ESL) community.
There are many occasions when scores from different tests or even from different versions of the same test
need to be linked for decision making or other purposes. For example, the scores on the SAT® I and ACT®
tests, two well known college admissions tests in the United States, have been linked to each other to help
university admissions offices use the scores to evaluate applicants. A research study was carried out by both
ETS and ACT research staff to develop a score comparison table for this purpose (Pommerich, Hanson, Harris,
& Sconing, 2000.) Another example is that, when the TOEFL iBT test, was developed to be taken via the
Internet and to replace the computer‐adaptive test (cBT) version, a study was conducted to link TOEFL iBT
scores to TOEFL cBT scores (Wang, Eignor, & Enright, 2007.)
Recently, ETS conducted score comparison research between the TOEFL test and an alternative test, IELTS
(International English Language Testing System). As a best practice required by the Guidelines for Practice by
the International Language Testing Association (ILTA, 2007), the Standards for Educational and Psychological
Testing (AERA, APA, NCME, 1999), and the ETS standards (ETS, 2002, p. 45,), appropriate psychometric
procedures should always be used to link scores from two different assessments if the scores are to be
compared. To comply with this standard, ETS psychometric staff conducted a research study to explore and
establish empirical relationships between the scores on the two tests. This research was designed and carried
out to answer the following two research questions:
1. What TOEFL iBT section scores are comparable to IELTS section scores?
2. What TOEFL iBT total scores are comparable to IELTS total scores?
Linking TOEFL iBT ™ Scores to IELTS® Scores – A Research Report
3
Finding the corresponding TOEFL iBT scores for each of the IELTS scores was accomplished by what is known
as score linking or score comparison (called score comparison hereafter in this report) in the field of
educational measurement.
In this report, the samples and the analyses will be described in the Method section. The section for Results
will present score comparisons for the four skill sections and the total scores. This is followed by the
Discussion section that considers the interpretation of the results and their implications in terms of the
generalization of the findings from this study, evaluates the limitations of the research, and makes
suggestions for future research.
Linking TOEFL iBT ™ Scores to IELTS® Scores – A Research Report
4
Method
Data Collection
In order to acquire empirical evidence for linking the scores on the two tests, scores were obtained from
students who had taken both tests (Pommerich, 2007). The data collection effort for this research started in
2008 and continued into 2009. The first batch of data, obtained in 2008, contained 217 students who
submitted to ETS copies of their TOEFL and IELTS score reports. In order to increase the sample size and the
stability of the results, ETS then contacted a large number of test takers via e‐mail and encouraged the
participants to submit their latest scores on both tests to ETS. Over 1,000 students responded and reported
their scores on the two tests to ETS. The two batches of data were then combined for the study.
Before any analyses started, the first task was to clean the data, which involved removing unusable records.
Records that had missing scores on one or more sections or that had invalid scores were removed from
subsequent analyses. For example, one reported IELTS score of 4.7 was identified as an invalid score and was
eliminated from the analysis data set1. After this data cleaning procedure, 1,153 records were retained for
the analyses described in the next section. Close to 1,000 records included the participants’ country of
testing information, including about 70 countries from around the world. The largest group was from China
including Hong Kong (41%), followed by USA (6%), and Japan (5%). The others were all below 4%.
Data Analysis
To understand the statistical characteristics of the scores on the two tests from the final sample of 1,153
students and to establish the relationships between the scores on the two tests, the following types of
analysis were conducted. The findings from the analyses are presented in the Results section.
1. Descriptive statistics were computed to evaluate such information as the average scores on each test at
both the section and the total score level, and how much variation (standard deviation) was observed in the
scores. The correlation between the scores on the two tests was also computed to see to what extent the
scores on the two tests were related to each other.
1 IELTS scores have 9 bands in one‐half increments (e.g., 3, 3.5, 4, 4.5...)
Linking TOEFL iBT ™ Scores to IELTS® Scores – A Research Report
5
2. Linking scores is basically a transformation from a score on one scale to a score on the other scale
(Holland, 2007) and can be accomplished in a variety of ways depending on the nature of the data and the
purpose of the linking (Kolen & Brennan, 1995; Holland & Dorans, 2006). To find the correspondence
between the TOEFL iBT and IELTS tests for each section and for the total score, ETS psychometric staff
conducted extensive analyses between March and August 2009 using a variety of statistical methods
including regression‐based prediction, conditional probability‐based score matching, and equipercentile
linking. In reviewing the results and in consideration of the purpose of this research, we deemed it most
appropriate to use the equipercentile linking method. This approach has been used extensively in a variety of
settings (e.g. the linking of the SAT test with the ACT test) and allowed us to identify the corresponding
TOEFL iBT scores which would restrict/pass a similar percentage of the students in the sample as would the
IELTS scores. Given the need for both tests to screen out applicants in a comparable manner, we believe this
to be the most defensible and straightforward approach.
Results
Descriptive Statistics of the Sample
TOEFL iBT scores range from 0 to 30 for each section and 0 to 120 for the total test; the total test score is the
sum of the four sections. IELTS reports both section and total scores on a 9‐band scale in one‐half (0.5) band
increments; the total test score is the average of the four sections. This general information about the
different score scales of the two tests can help put the scores of the research sample in perspective. For
example, because of the compact IELTS score scales, IELTS scales will show much smaller score variation
(standard deviation values in Table 1) than the TOEFL iBT scales. Also, for some IELTS scores in Tables 3 to 7,
the corresponding TOEFL iBT scores will show score ranges due to the larger TOEFL scales.
Table 1 gives the sample size, the mean scores, and the score variations (standard deviation, score range) of
the two tests. On IELTS, the Reading and Listening mean scores were both 6.8, and the Speaking and Writing
means were 6.3 and 6.1, respectively. The total test mean score was 6.6. On the TOEFL iBT scale, the Reading
and Listening mean scores were both close to 21 and the Speaking and Writing mean scores were 20 and
21.6, respectively. The total mean score was 83.6.
To evaluate the overall performance of the students in this research sample, the 2009 test performance
information on the two tests was obtained from the respective websites and is presented in the column for
2009 population mean in Table 1.
Linking TOEFL iBT ™ Scores to IELTS® Scores – A Research Report
6
Generally speaking, the students in this sample, as a group, scored higher on both tests than their respective
populations did in 2009. In other words, this sample appeared to be more able than the general populations
of IELTS and TOEFL iBT test takers, respectively. This could be the outcome of self selection of the
participants in that students having higher test scores might have been more willing to report their scores
than those having lower scores. As a result, there were very few low scores in the data but relatively more
scores at the middle to mid‐high levels. Our level of confidence in the results for the low score levels would
then be relatively lower than that for the middle to mid‐high levels.
Linking TOEFL iBT ™ Scores to IELTS® Scores – A Research Report
7
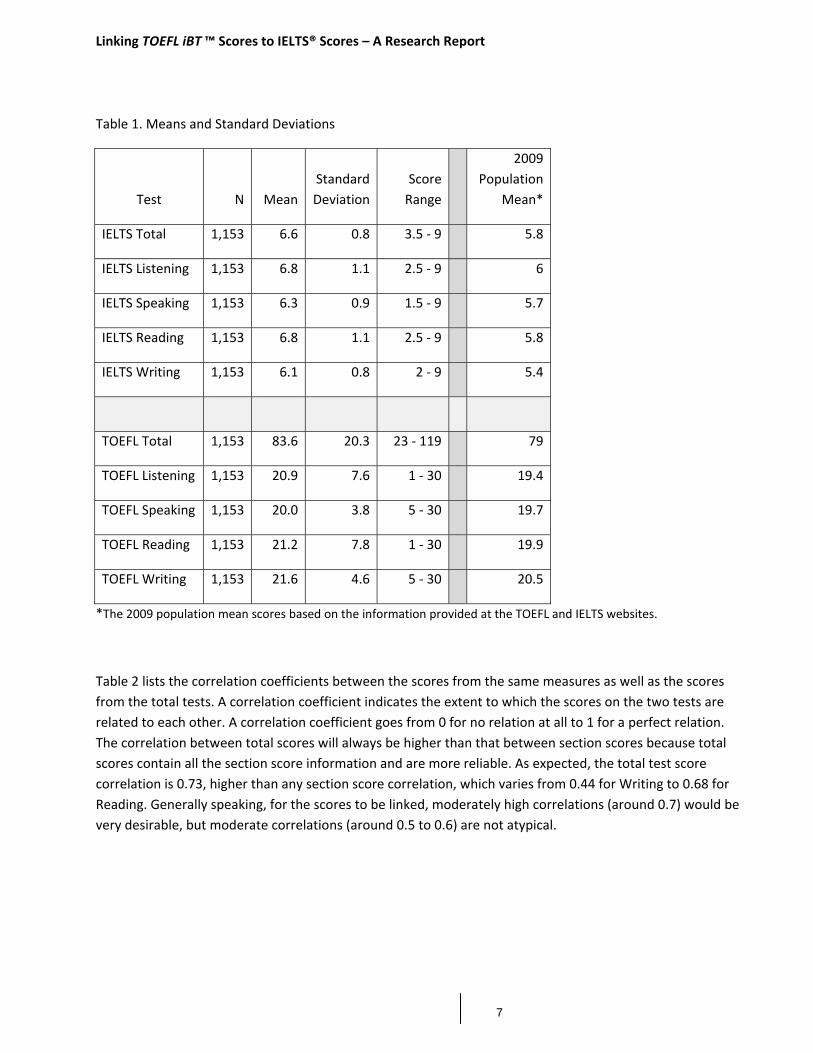
Table 1. Means and Standard Deviations
Test N Mean
Standard
Deviation
Score
Range
2009
Population
Mean*
IELTS Total 1,153 6.6 0.8 3.5 ‐ 9 5.8
IELTS Listening 1,153 6.8 1.1 2.5 ‐ 9 6
IELTS Speaking 1,153 6.3 0.9 1.5 ‐ 9 5.7
IELTS Reading 1,153 6.8 1.1 2.5 ‐ 9 5.8
IELTS Writing 1,153 6.1 0.8 2 ‐ 9 5.4
TOEFL Total 1,153 83.6 20.3 23 ‐ 119 79
TOEFL Listening 1,153 20.9 7.6 1 ‐ 30 19.4
TOEFL Speaking 1,153 20.0 3.8 5 ‐ 30 19.7
TOEFL Reading 1,153 21.2 7.8 1 ‐ 30 19.9
TOEFL Writing 1,153 21.6 4.6 5 ‐ 30 20.5
*The 2009 population mean scores based on the information provided at the TOEFL and IELTS websites.
Table 2 lists the correlation coefficients between the scores from the same measures as well as the scores
from the total tests. A correlation coefficient indicates the extent to which the scores on the two tests are
related to each other. A correlation coefficient goes from 0 for no relation at all to 1 for a perfect relation.
The correlation between total scores will always be higher than that between section scores because total
scores contain all the section score information and are more reliable. As expected, the total test score
correlation is 0.73, higher than any section score correlation, which varies from 0.44 for Writing to 0.68 for
Reading. Generally speaking, for the scores to be linked, moderately high correlations (around 0.7) would be
very desirable, but moderate correlations (around 0.5 to 0.6) are not atypical.
Linking TOEFL iBT ™ Scores to IELTS® Scores – A Research Report
8
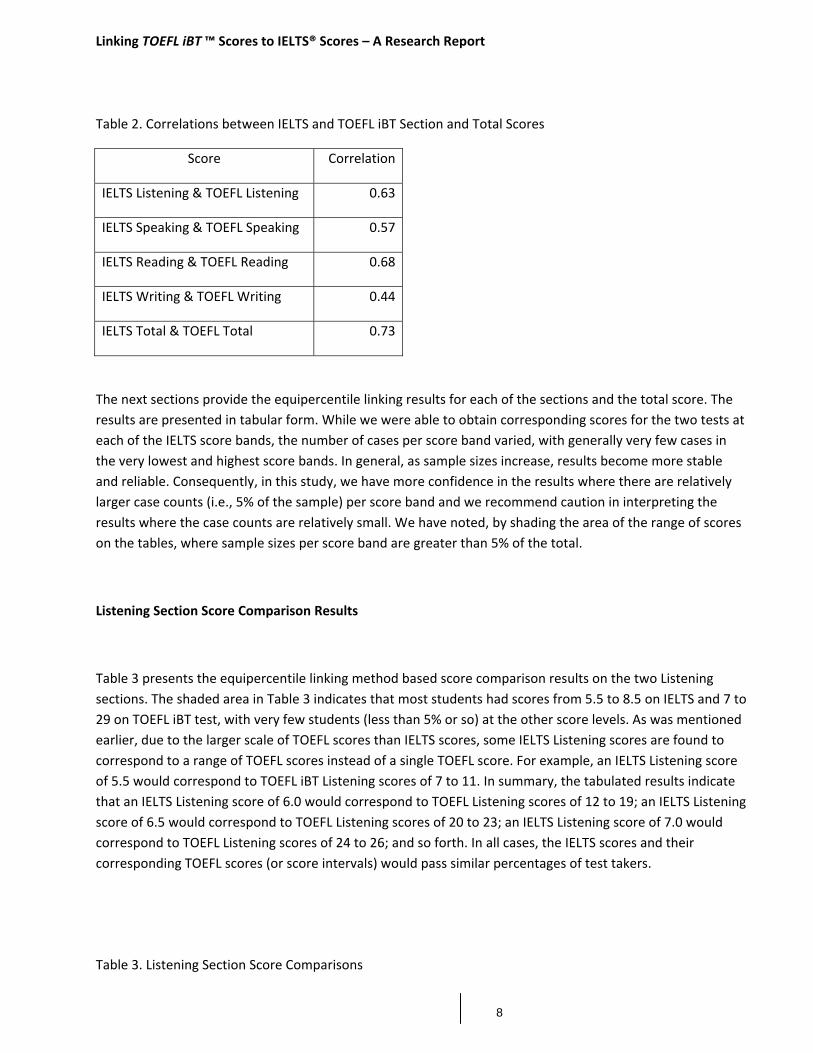
Table 2. Correlations between IELTS and TOEFL iBT Section and Total Scores
Score Correlation
IELTS Listening & TOEFL Listening 0.63
IELTS Speaking & TOEFL Speaking 0.57
IELTS Reading & TOEFL Reading 0.68
IELTS Writing & TOEFL Writing 0.44
IELTS Total & TOEFL Total 0.73
The next sections provide the equipercentile linking results for each of the sections and the total score. The
results are presented in tabular form. While we were able to obtain corresponding scores for the two tests at
each of the IELTS score bands, the number of cases per score band varied, with generally very few cases in
the very lowest and highest score bands. In general, as sample sizes increase, results become more stable
and reliable. Consequently, in this study, we have more confidence in the results where there are relatively
larger case counts (i.e., 5% of the sample) per score band and we recommend caution in interpreting the
results where the case counts are relatively small. We have noted, by shading the area of the range of scores
on the tables, where sample sizes per score band are greater than 5% of the total.
Listening Section Score Comparison Results
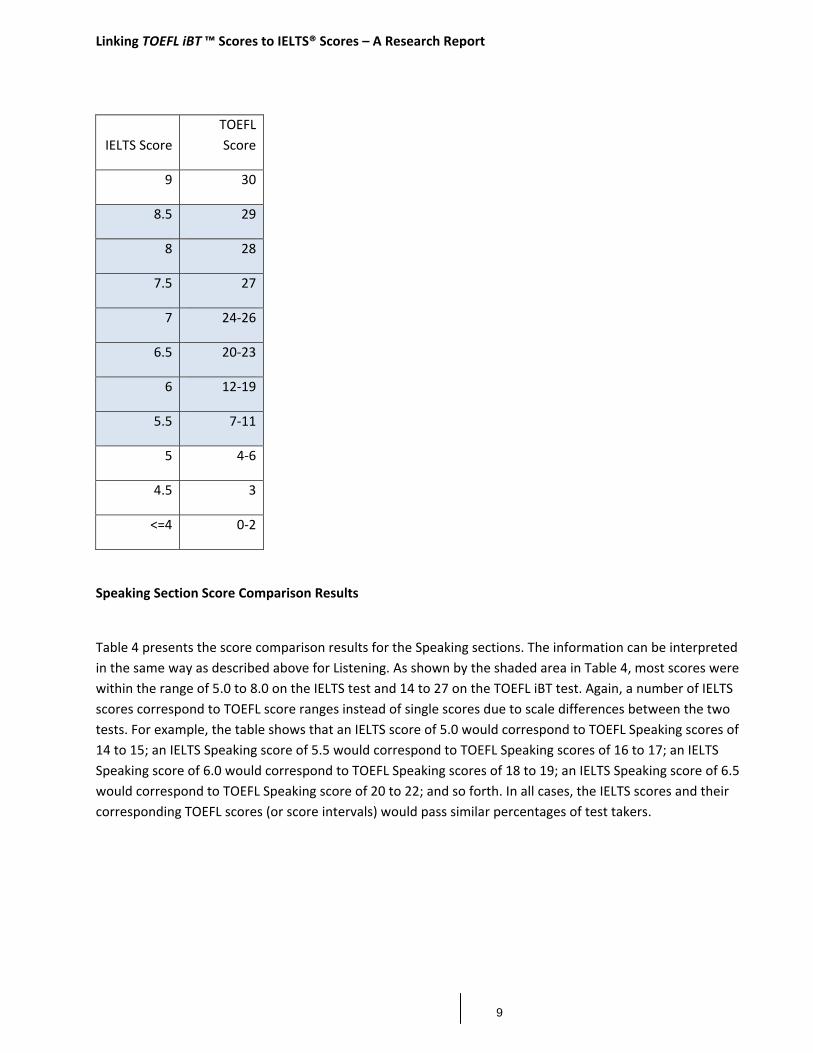
Table 3 presents the equipercentile linking method based score comparison results on the two Listening
sections. The shaded area in Table 3 indicates that most students had scores from 5.5 to 8.5 on IELTS and 7 to
29 on TOEFL iBT test, with very few students (less than 5% or so) at the other score levels. As was mentioned
earlier, due to the larger scale of TOEFL scores than IELTS scores, some IELTS Listening scores are found to
correspond to a range of TOEFL scores instead of a single TOEFL score. For example, an IELTS Listening score
of 5.5 would correspond to TOEFL iBT Listening scores of 7 to 11. In summary, the tabulated results indicate
that an IELTS Listening score of 6.0 would correspond to TOEFL Listening scores of 12 to 19; an IELTS Listening
score of 6.5 would correspond to TOEFL Listening scores of 20 to 23; an IELTS Listening score of 7.0 would
correspond to TOEFL Listening scores of 24 to 26; and so forth. In all cases, the IELTS scores and their
corresponding TOEFL scores (or score intervals) would pass similar percentages of test takers.
Table 3. Listening Section Score Comparisons
Linking TOEFL iBT ™ Scores to IELTS® Scores – A Research Report
9
IELTS Score
TOEFL
Score
9 30
8.5 29
8 28
7.5 27
7 24‐26
6.5 20‐23
6 12‐19
5.5 7‐11
5 4‐6
4.5 3
<=4 0‐2
Speaking Section Score Comparison Results
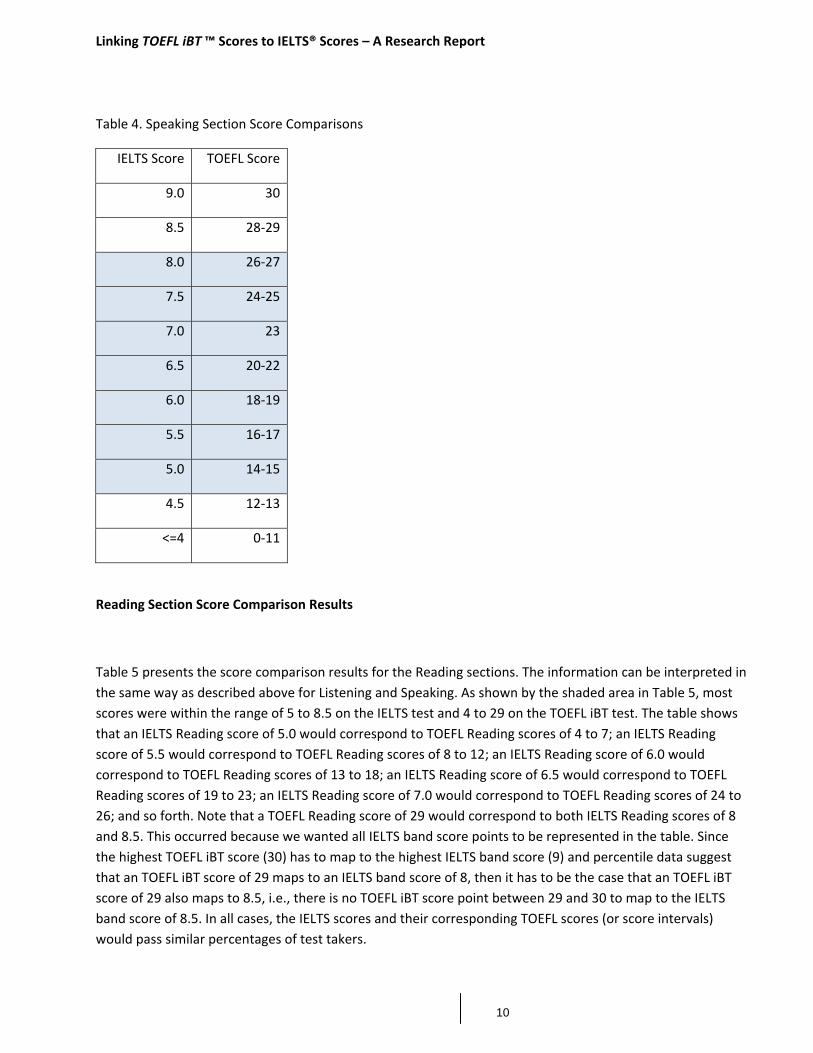
Table 4 presents the score comparison results for the Speaking sections. The information can be interpreted
in the same way as described above for Listening. As shown by the shaded area in Table 4, most scores were
within the range of 5.0 to 8.0 on the IELTS test and 14 to 27 on the TOEFL iBT test. Again, a number of IELTS
scores correspond to TOEFL score ranges instead of single scores due to scale differences between the two
tests. For example, the table shows that an IELTS score of 5.0 would correspond to TOEFL Speaking scores of
14 to 15; an IELTS Speaking score of 5.5 would correspond to TOEFL Speaking scores of 16 to 17; an IELTS
Speaking score of 6.0 would correspond to TOEFL Speaking scores of 18 to 19; an IELTS Speaking score of 6.5
would correspond to TOEFL Speaking score of 20 to 22; and so forth. In all cases, the IELTS scores and their
corresponding TOEFL scores (or score intervals) would pass similar percentages of test takers.
Linking TOEFL iBT ™ Scores to IELTS® Scores – A Research Report
10
Table 4. Speaking Section Score Comparisons
IELTS Score TOEFL Score
9.0 30
8.5 28‐29
8.0 26‐27
7.5 24‐25
7.0 23
6.5 20‐22
6.0 18‐19
5.5 16‐17
5.0 14‐15
4.5 12‐13
<=4 0‐11
Reading Section Score Comparison Results
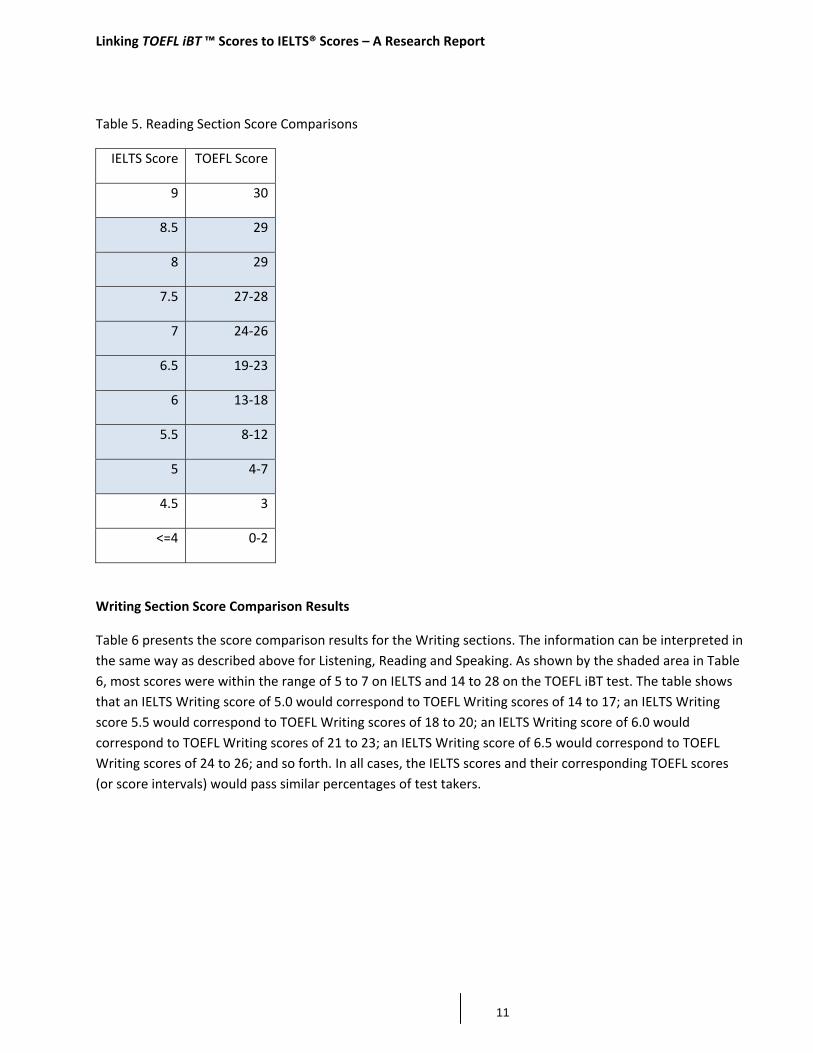
Table 5 presents the score comparison results for the Reading sections. The information can be interpreted in
the same way as described above for Listening and Speaking. As shown by the shaded area in Table 5, most
scores were within the range of 5 to 8.5 on the IELTS test and 4 to 29 on the TOEFL iBT test. The table shows
that an IELTS Reading score of 5.0 would correspond to TOEFL Reading scores of 4 to 7; an IELTS Reading
score of 5.5 would correspond to TOEFL Reading scores of 8 to 12; an IELTS Reading score of 6.0 would
correspond to TOEFL Reading scores of 13 to 18; an IELTS Reading score of 6.5 would correspond to TOEFL
Reading scores of 19 to 23; an IELTS Reading score of 7.0 would correspond to TOEFL Reading scores of 24 to
26; and so forth. Note that a TOEFL Reading score of 29 would correspond to both IELTS Reading scores of 8
and 8.5. This occurred because we wanted all IELTS band score points to be represented in the table. Since
the highest TOEFL iBT score (30) has to map to the highest IELTS band score (9) and percentile data suggest
that an TOEFL iBT score of 29 maps to an IELTS band score of 8, then it has to be the case that an TOEFL iBT
score of 29 also maps to 8.5, i.e., there is no TOEFL iBT score point between 29 and 30 to map to the IELTS
band score of 8.5. In all cases, the IELTS scores and their corresponding TOEFL scores (or score intervals)
would pass similar percentages of test takers.
Linking TOEFL iBT ™ Scores to IELTS® Scores – A Research Report
11
Table 5. Reading Section Score Comparisons
IELTS Score TOEFL Score
9 30
8.5 29
8 29
7.5 27‐28
7 24‐26
6.5 19‐23
6 13‐18
5.5 8‐12
5 4‐7
4.5 3
<=4 0‐2
Writing Section Score Comparison Results
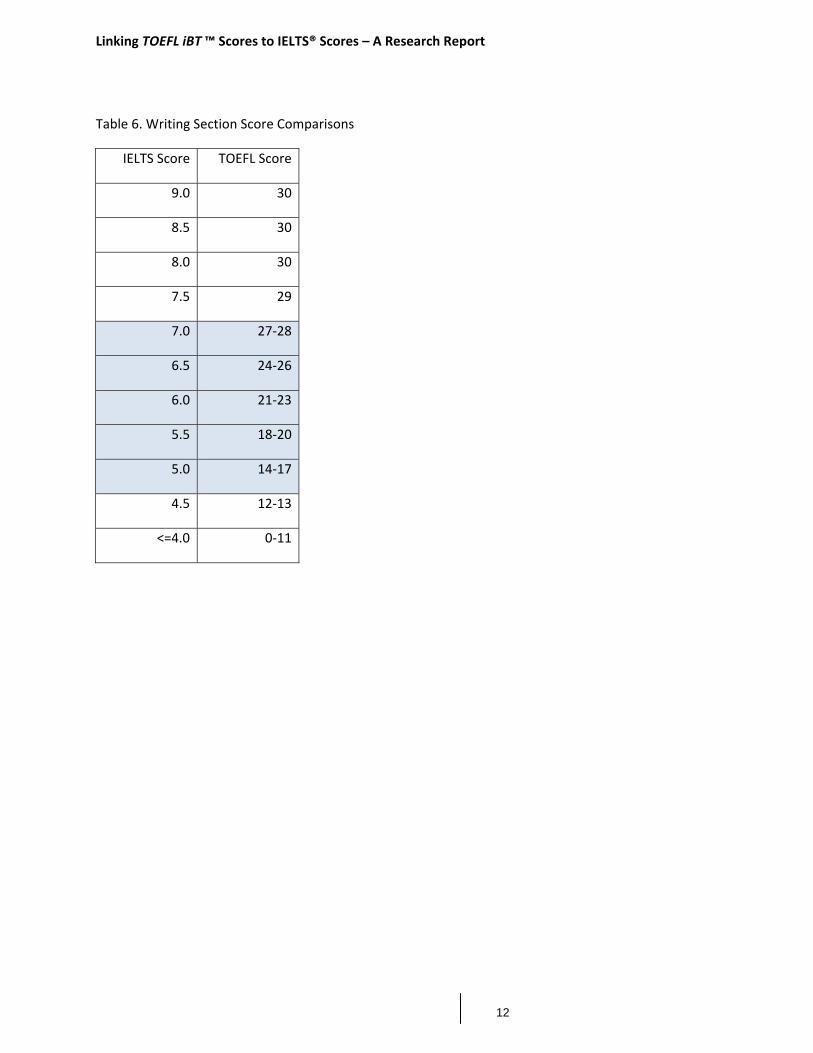
Table 6 presents the score comparison results for the Writing sections. The information can be interpreted in
the same way as described above for Listening, Reading and Speaking. As shown by the shaded area in Table
6, most scores were within the range of 5 to 7 on IELTS and 14 to 28 on the TOEFL iBT test. The table shows
that an IELTS Writing score of 5.0 would correspond to TOEFL Writing scores of 14 to 17; an IELTS Writing
score 5.5 would correspond to TOEFL Writing scores of 18 to 20; an IELTS Writing score of 6.0 would
correspond to TOEFL Writing scores of 21 to 23; an IELTS Writing score of 6.5 would correspond to TOEFL
Writing scores of 24 to 26; and so forth. In all cases, the IELTS scores and their corresponding TOEFL scores
(or score intervals) would pass similar percentages of test takers.
Linking TOEFL iBT ™ Scores to IELTS® Scores – A Research Report
12
Table 6. Writing Section Score Comparisons
IELTS Score TOEFL Score
9.0 30
8.5 30
8.0 30
7.5 29
7.0 27‐28
6.5 24‐26
6.0 21‐23
5.5 18‐20
5.0 14‐17
4.5 12‐13
<=4.0 0‐11
Linking TOEFL iBT ™ Scores to IELTS® Scores – A Research Report
13
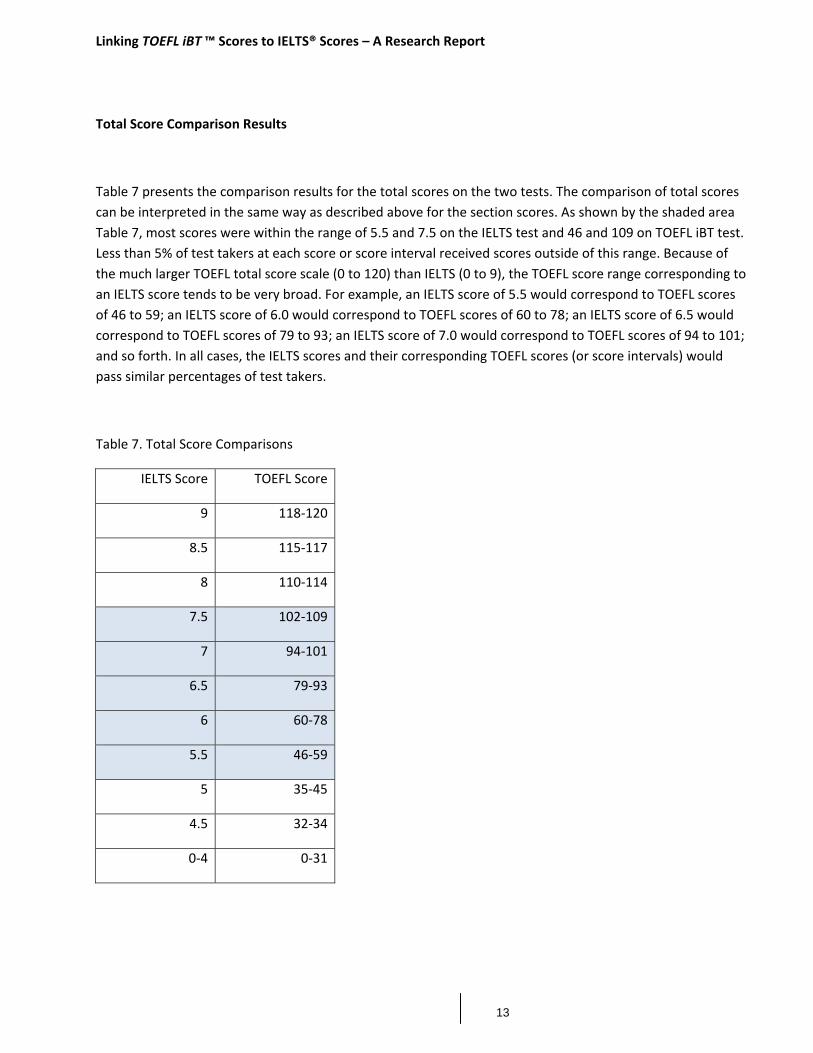
Total Score Comparison Results
Table 7 presents the comparison results for the total scores on the two tests. The comparison of total scores
can be interpreted in the same way as described above for the section scores. As shown by the shaded area
Table 7, most scores were within the range of 5.5 and 7.5 on the IELTS test and 46 and 109 on TOEFL iBT test.
Less than 5% of test takers at each score or score interval received scores outside of this range. Because of
the much larger TOEFL total score scale (0 to 120) than IELTS (0 to 9), the TOEFL score range corresponding to
an IELTS score tends to be very broad. For example, an IELTS score of 5.5 would correspond to TOEFL scores
of 46 to 59; an IELTS score of 6.0 would correspond to TOEFL scores of 60 to 78; an IELTS score of 6.5 would
correspond to TOEFL scores of 79 to 93; an IELTS score of 7.0 would correspond to TOEFL scores of 94 to 101;
and so forth. In all cases, the IELTS scores and their corresponding TOEFL scores (or score intervals) would
pass similar percentages of test takers.
Table 7. Total Score Comparisons
IELTS Score TOEFL Score
9 118‐120
8.5 115‐117
8 110‐114
7.5 102‐109
7 94‐101
6.5 79‐93
6 60‐78
5.5 46‐59
5 35‐45
4.5 32‐34
0‐4 0‐31
Linking TOEFL iBT ™ Scores to IELTS® Scores – A Research Report
14
Discussion
To better understand the score comparison results on both the section and the total test levels, it is
important to evaluate the results in the context of the characteristics of the tests, the research sample
employed, the intended use of the results, and the limitations of the study. It is also worthwhile to think
about what further research can be conducted in the future to enhance the quality of the score comparisons.
Evaluation of the Score Comparison Results and Limitations
There are two considerations regarding the interpretation of the results. The first is the characteristics of the
two tests. It is recognized that the TOEFL and IELTS tests, while they have the same number of sections
measuring similar skills and underlying constructs, were built from different frameworks and different test
blueprints. For example, the TOEFL iBT test is the latest version of the TOEFL test and is built on the
framework of communicative competency based on current second language acquisition theory and practice.
The TOEFL iBT test contains numerous innovative task types that can only be presented on a computer‐based
test and tap into a wider array of English proficiency skills than a paper‐based test. As a result, TOEFL iBT
scores do not mean exactly the same thing as IELTS scores, and moderate correlations2 between the scores,
as seen in Table 2, can be expected. As previously noted, for the scores to be linked, moderately high
correlations (around 0.7) would be very desirable, but moderate correlations (around 0.5 to 0.6) are not
atypical.
The second consideration is the sample. As in many other studies of this nature, a self‐selected group of
participants volunteered to report their IELTS and TOEFL scores to ETS, which would limit generalizing the
results to samples that differ significantly from this research sample. In particular, the numbers of
participants with relatively low and very high scores were small. Future samples that include more cases with
lower and higher scores would be recommended if an understanding of the mapping of scores at these score
levels is desired. While the present case counts are sufficient to evaluate the mapping in the middle of the
score scales, caution should be exercised when comparing the lower and higher scores. As described
previously, the tables include shading to indicate those score levels where we have relatively more
confidence in the score comparability.
2 Correlation can be used as an index that is used in evaluating the potential for linking the scores from different tests
that are intended to measure similar constructs but are constructed according to different frameworks.
Linking TOEFL iBT ™ Scores to IELTS® Scores – A Research Report
15
Future Research
The score comparison results from this research were grounded in the empirical information that was
obtained from the students who took both IELTS and TOEFL iBT tests, and were based on an appropriate
psychometric procedure that used scores from the two tests to establish the relationships between the two
sets of scores. As in any other score comparison research, the current research and the findings for the score
comparison between the IELTS and TOEFL iBT tests will benefit from more research in the future, especially
from future research studies based on more controlled samples in terms of sample size, sample selection,
data collection, and student background information such as nationality, native language, years of learning
English, etc. With a larger and better controlled sample, the data collection quality will be improved and a
sufficient number of students across all scores will be provided to enhance the score comparison results.
Linking TOEFL iBT ™ Scores to IELTS® Scores – A Research Report
16
Reference
American Educational Research Association, American Psychological Association, & National Council on
Measurement in Education. (1999). Standards for educational and psychological testing. Washington, DC:
American Educational Research Association.
ETS. (2002). ETS Standards for quality and fairness. Princeton, NJ: ETS.
Holland, P. W. (2007). A framework and history for score linking. In N. J. Dorans, M. Pommerich, & P. W.
Holland (Eds.), Linking and aligning scores and scales (pp. 5‐30). New York, NY: Springer.
Holland, P. W., & N. J. (2006). Linking and equating. In R. L. Brennan (Ed.), Educational measurement (4the
ed., pp. 187‐220). Westport, CT: Praeger Publishers.
International Language Testing Association. (June 2007). ILTA Guideline for Practice. Retrieved May 12, 2010
from http://www.iltaonline.com/index.php?option=com_content&view=article&id=122&Itemid=133
Kolen, M. J., & Brennan, R. L. (1995). Test equating methods and practices. New York, NY: Springer.
Pommerich, M., Hanson, B. A., Harris, D. J., & Sconing, J. A. (2000). Issues in creating and reporting
concordance results based on equipercentile methods (ACT Research Rep. No. 2000‐1). Iowa City, IA: ACT.
Pommerich, M. (2007). Concordance: The Good, the Bad, and the Ugly. In N. J. Dorans, M. Pommerich, & P. W. Holland (Eds.), Linking and aligning scores and scales (pp. 199‐216). New York, NY: Springer. Wang, L., Eignor, D.R., & Enright, M.K. (2008). A Final Analysis. In C. A. Chapelle, M. K. Enright, & J. Jamieson (Eds.), Building a Validity Argument for a new Test of English as a Foreign Language (pp. 259‐318). New York, NY: Routledge.
Copyright © 2010 by Educational Testing Service. All rights reserved. The ETS logo, LISTENING. LEARNING. LEADING. and TOEFL are registered trademarks of Educational Testing Service (ETS). TOEFL iBT is a trademark of ETS. IELTS is a registered trademark jointly owned by the British Council, IDP Education PTY Ltd, and University of Cambridge Local Examinations Syndicate.