Embed Size (px)
DESCRIPTION
Linking Sport and Health through Purposeful Activity. Len Almond Loughborough University. My Task today:. Raise the priority and significance of Purposeful Activity and Health on your agenda. Identify priorities Propose what we can do?. Sport and Health:we share the same aspirations. - PowerPoint PPT Presentation
Citation preview
b a c k n e x th o m e
Linking Sport and Health through
Purposeful Activity
Len Almond
Loughborough University

My Task today:
Raise the priority and significance of Purposeful Activity and Health on your agenda.
Identify priorities
Propose what we can do?
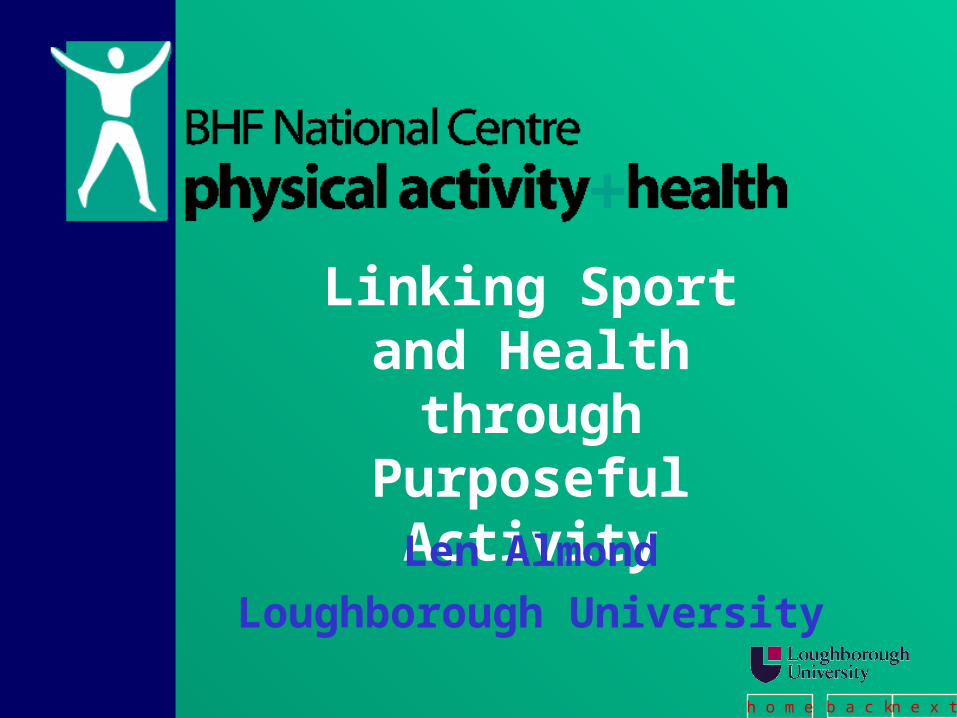
Sport and Health:we share the same aspirations
Sedentary population Insufficiently active
Productive/purposeful use of leisure-time
b a c k n e x th o m e
Is there any evidence that Health and Sport need to work together?
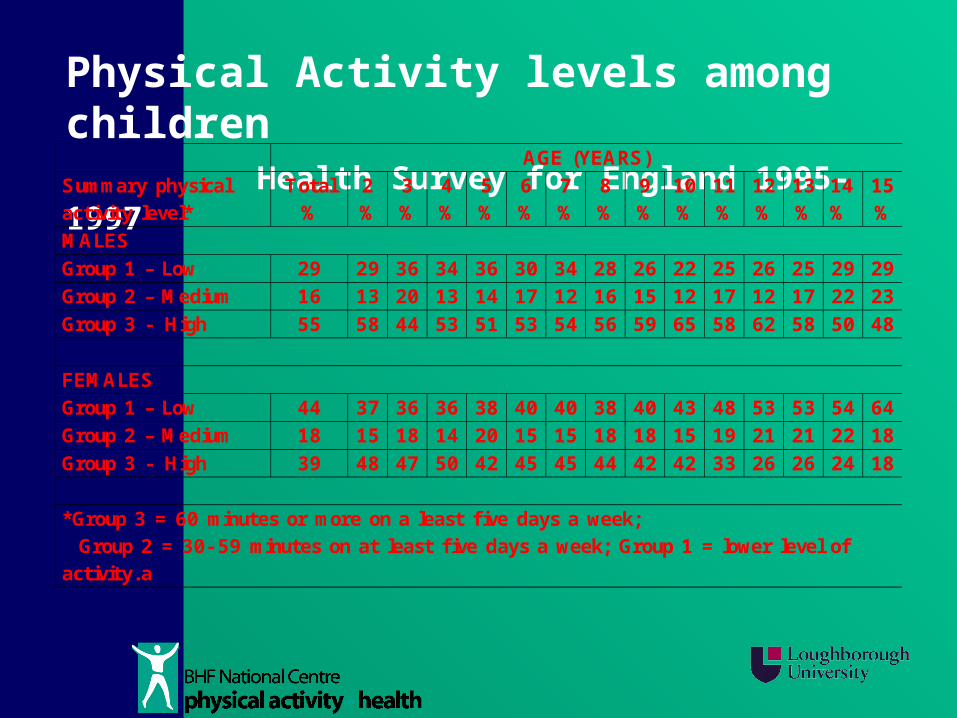
Physical Activity levels among children
Health Survey for England 1995-1997
AGE (YEARS) Summary physical activity level*
Total %
2 %
3 %
4 %
5 %
6 %
7 %
8 %
9 %
10 %
11 %
12 %
13 %
14 %
15 %
MALES Group 1 – Low 29 29 36 34 36 30 34 28 26 22 25 26 25 29 29 Group 2 – Medium 16 13 20 13 14 17 12 16 15 12 17 12 17 22 23 Group 3 - High 55 58 44 53 51 53 54 56 59 65 58 62 58 50 48
FEMALES Group 1 – Low 44 37 36 36 38 40 40 38 40 43 48 53 53 54 64 Group 2 – Medium 18 15 18 14 20 15 15 18 18 15 19 21 21 22 18 Group 3 - High 39 48 47 50 42 45 45 44 42 42 33 26 26 24 18
*Group 3 = 60 minutes or more on a least five days a week; Group 2 = 30- 59 minutes on at least five days a week; Group 1 = lower level of activity.a
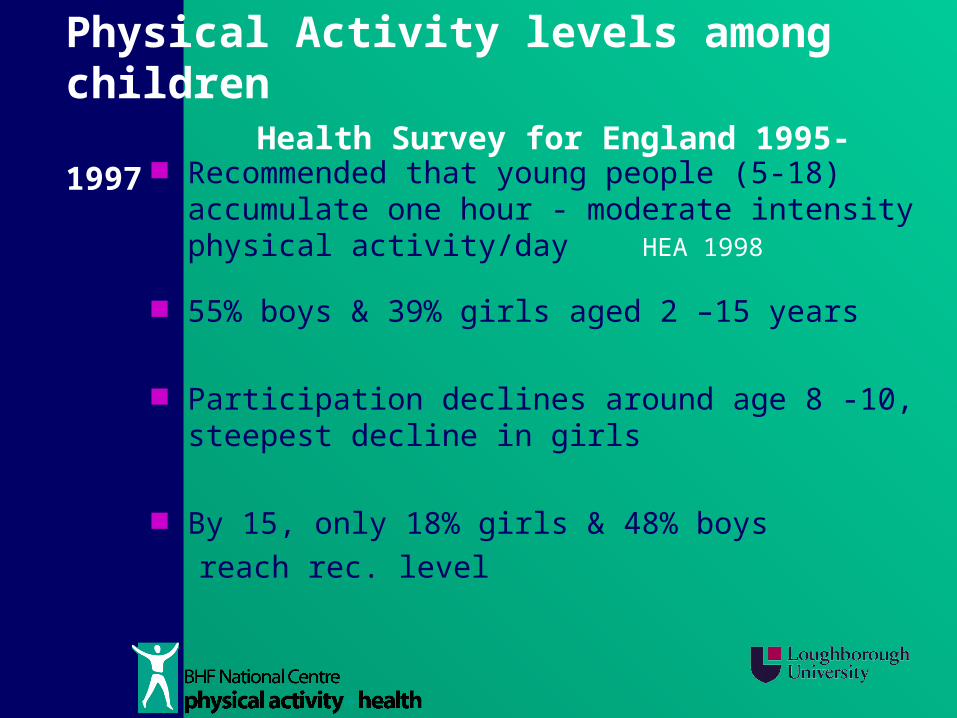
Physical Activity levels among children
Health Survey for England 1995-1997 Recommended that young people (5-18)
accumulate one hour - moderate intensity physical activity/day HEA 1998
55% boys & 39% girls aged 2 –15 years
Participation declines around age 8 -10, steepest decline in girls
By 15, only 18% girls & 48% boys reach rec. level
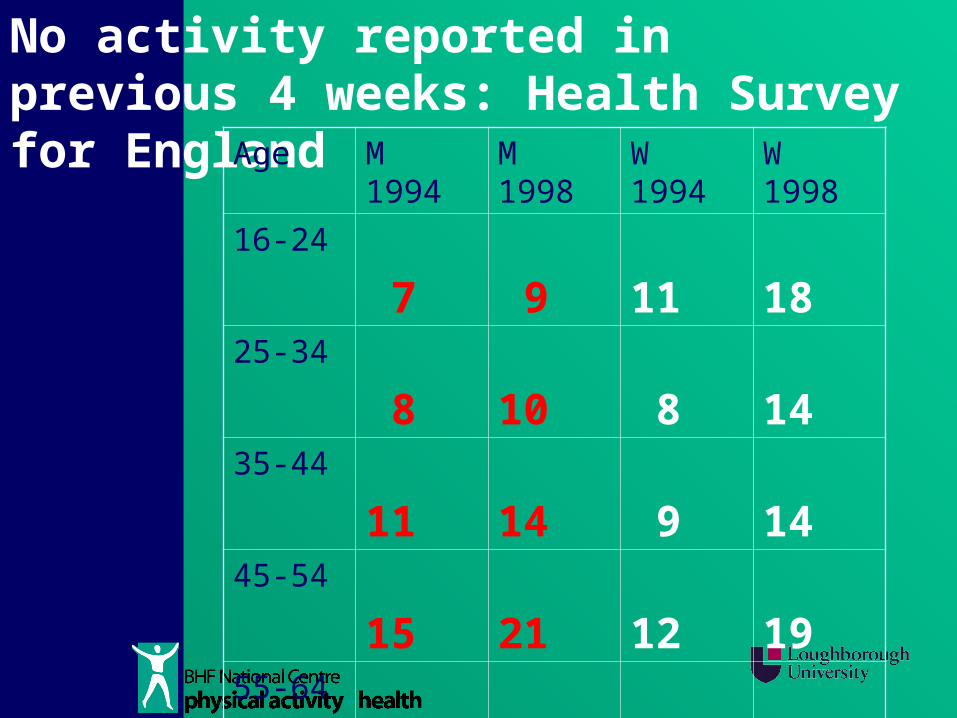
No activity reported in previous 4 weeks: Health Survey for England
Age M 1994 M 1998 W 1994 W 1998
16-24 7 9 11 1825-34 8 10 8 1435-44 11 14 9 1445-54 15 21 12 1955-64 24 34 18 2865-74 29 36 33 4575+ 53 57 62 71
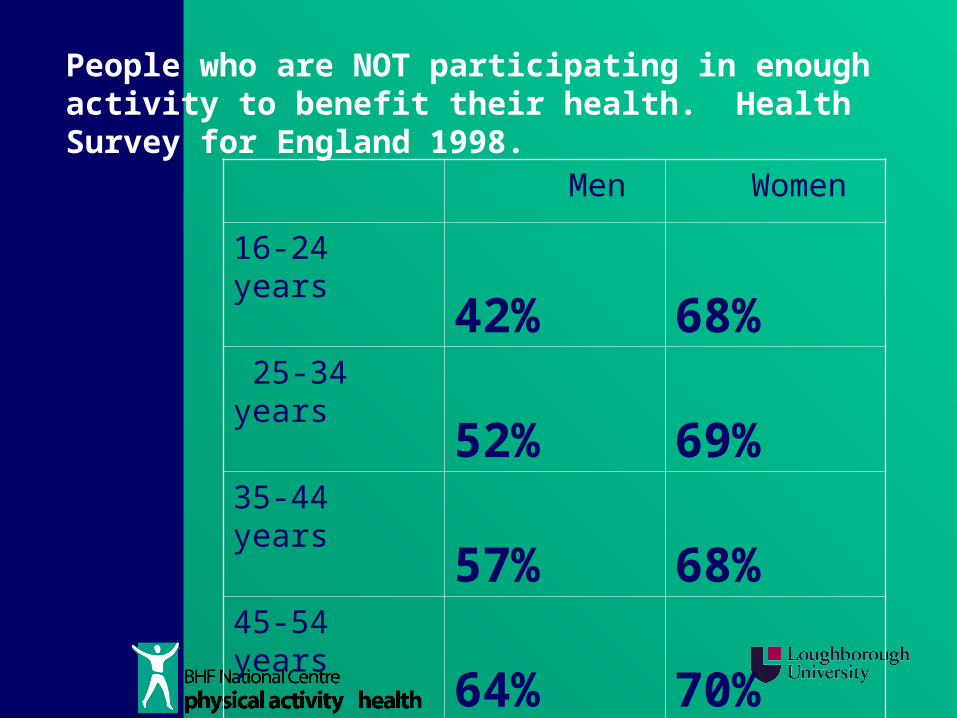
People who are NOT participating in enough activity to benefit their health. Health Survey for England 1998.
Men Women
16-24 years 42% 68% 25-34 years 52% 69%35-44 years 57% 68%45-54 years 64% 70%55-64 years 68% 79%65-74 years 83% 88%
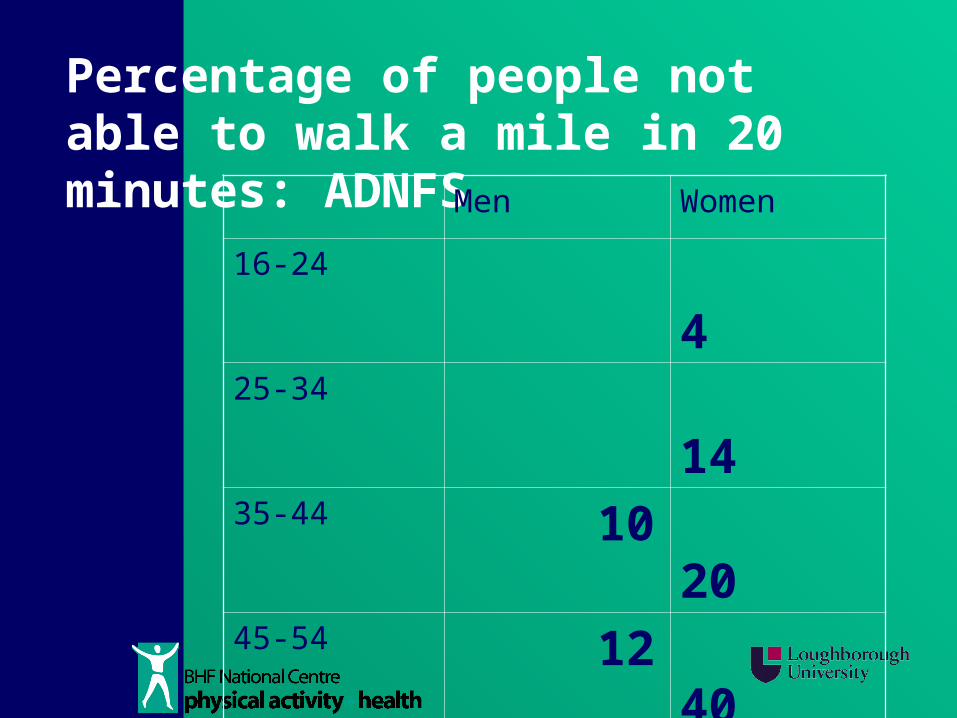
Percentage of people not able to walk a mile in 20 minutes: ADNFS
Men Women
16-24 4 25-34 1435-44 10 2045-54 12 4055-64 30 5065+ 45 80
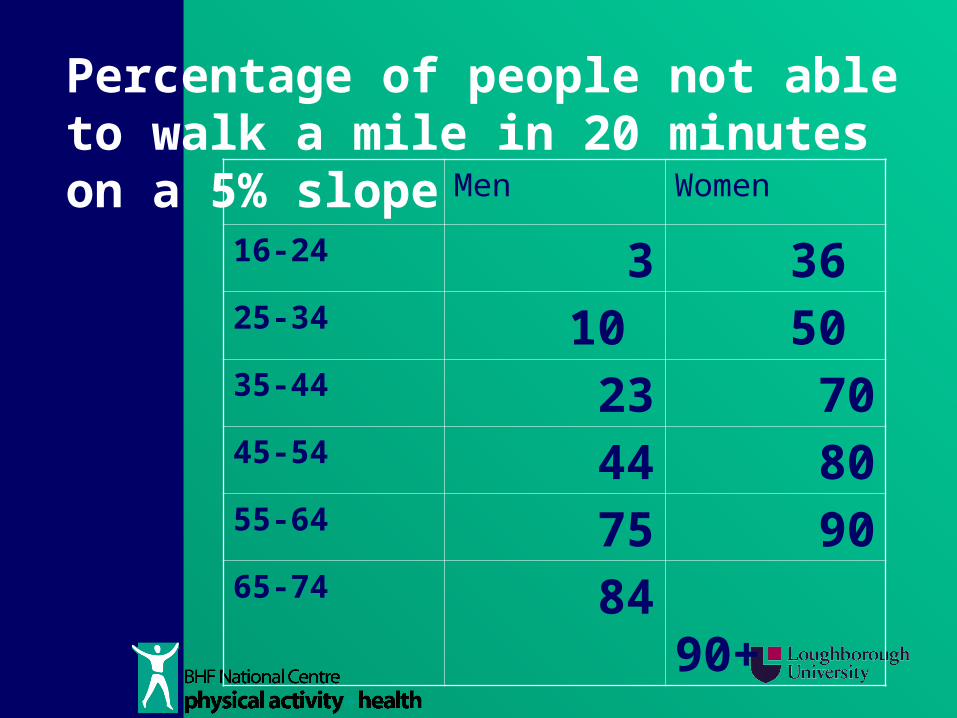
Percentage of people not able to walk a mile in 20 minutes on a 5% slope
Men Women
16-24 3 3625-34 10 5035-44 23 7045-54 44 8055-64 75 9065-74 84 90+
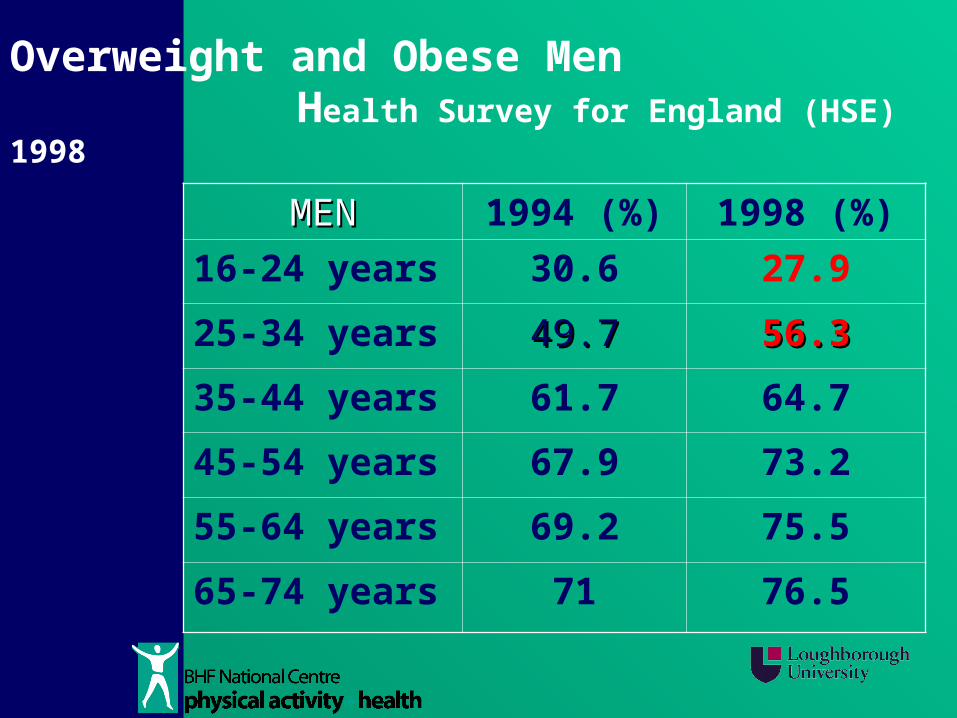
Overweight and Obese MenHealth Survey for England (HSE)
1998
MENMEN 1994 (%) 1998 (%)
16-24 years 30.6 27.9
25-34 years 49.749.7 56.356.3
35-44 years 61.7 64.7
45-54 years 67.9 73.2
55-64 years 69.2 75.5
65-74 years 71 76.5
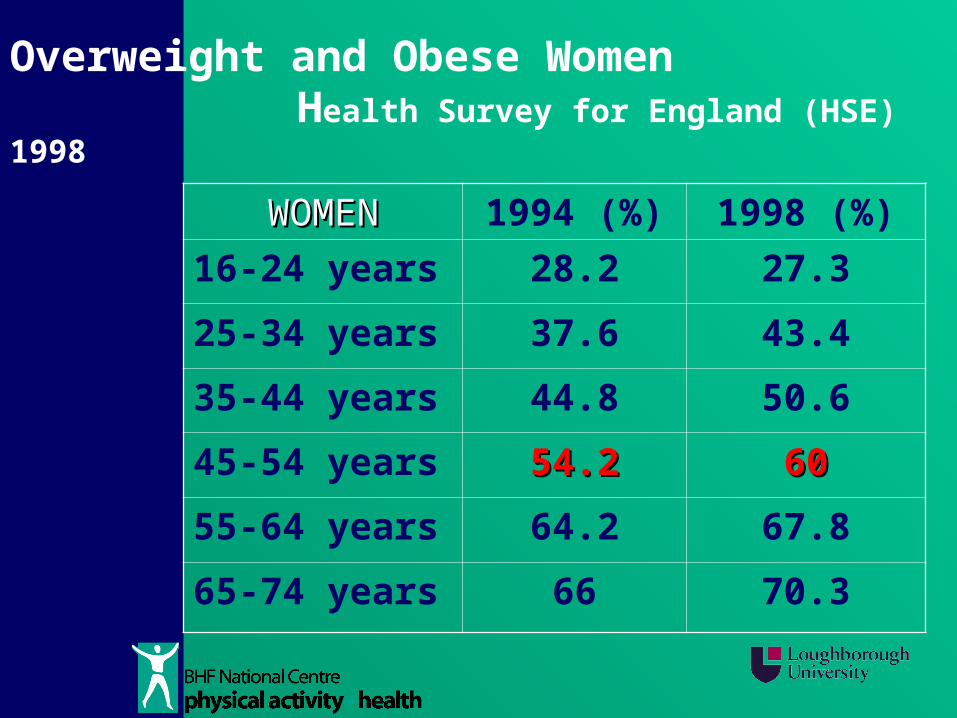
Overweight and Obese WomenHealth Survey for England (HSE)
1998
WOMENWOMEN 1994 (%) 1998 (%)
16-24 years 28.2 27.3
25-34 years 37.6 43.4
35-44 years 44.8 50.6
45-54 years 54.254.2 6060
55-64 years 64.2 67.8
65-74 years 66 70.3
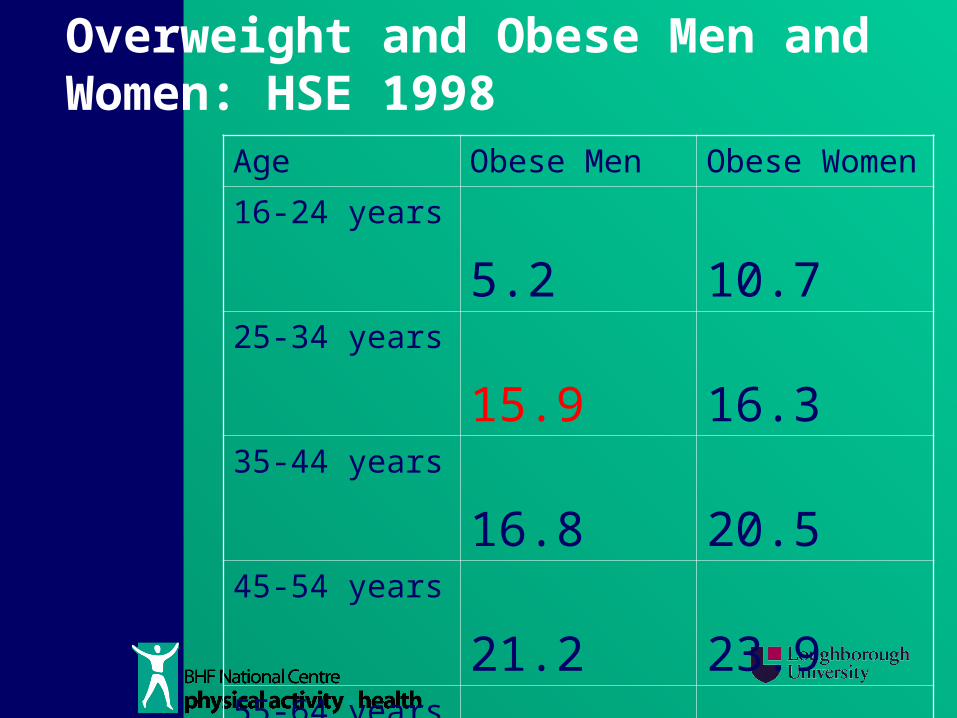
Overweight and Obese Men and Women: HSE 1998
Age Obese Men Obese Women
16-24 years 5.2 10.725-34 years 15.9 16.335-44 years 16.8 20.545-54 years 21.2 23.955-64 years 23.3 28.665-74 years 21.2 2975+ 15.9 20.7
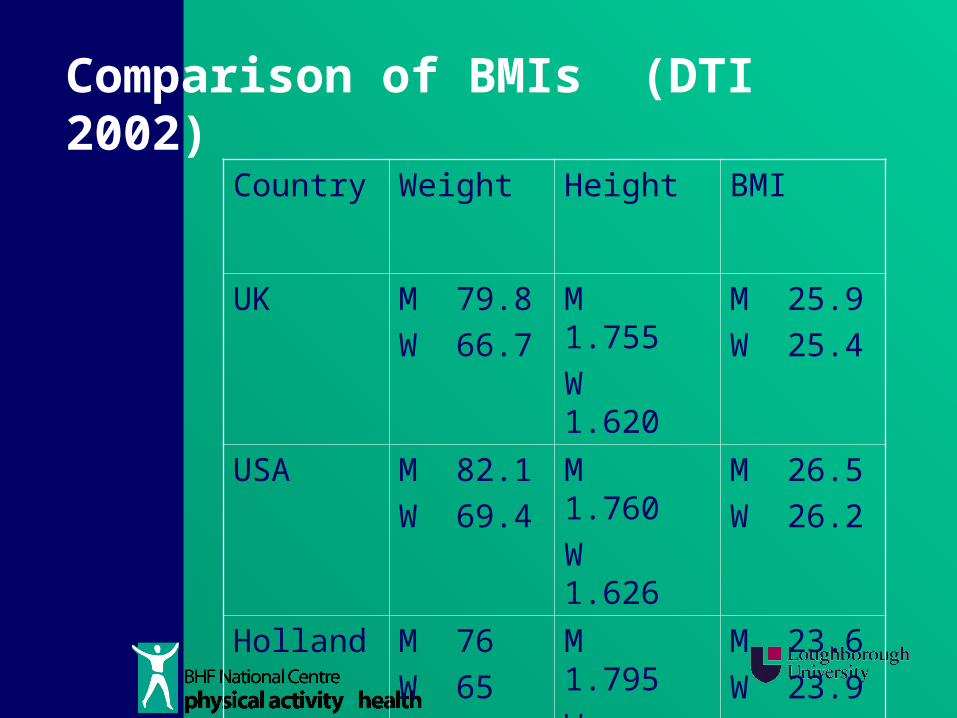
Comparison of BMIs (DTI 2002)
Country Weight Height BMI
UK M 79.8
W 66.7
M 1.755
W 1.620
M 25.9
W 25.4
USA M 82.1
W 69.4
M 1.760
W 1.626
M 26.5
W 26.2
Holland M 76
W 65
M 1.795
W 1.650
M 23.6
W 23.9
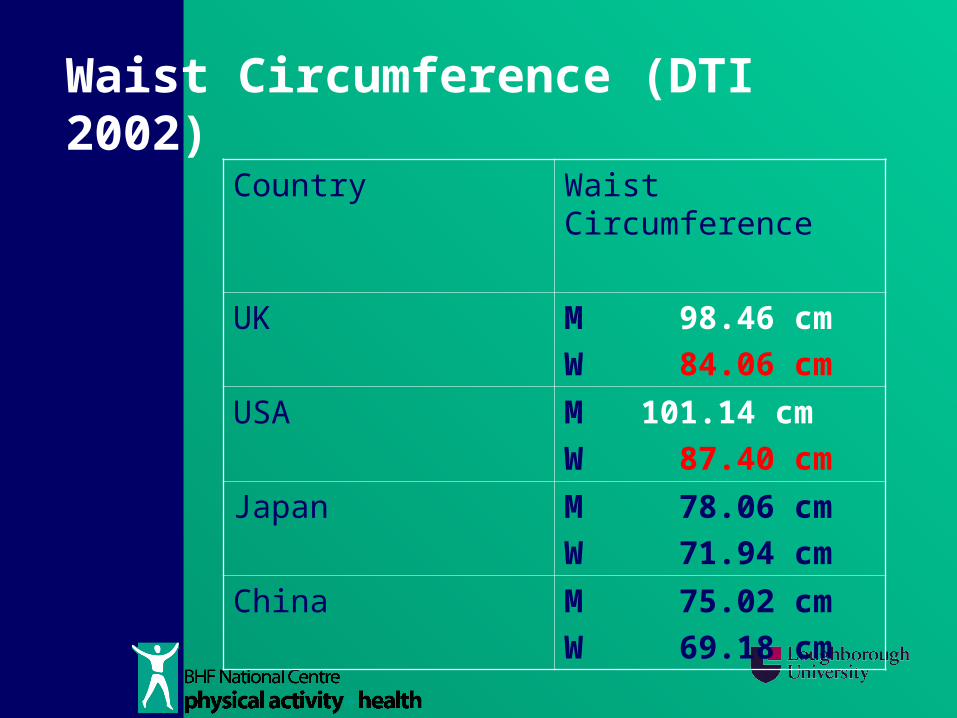
Waist Circumference (DTI 2002)
Country Waist Circumference
UK M 98.46 cm
W 84.06 cm
USA M 101.14 cm
W 87.40 cm
Japan M 78.06 cm
W 71.94 cm
China M 75.02 cm
W 69.18 cm
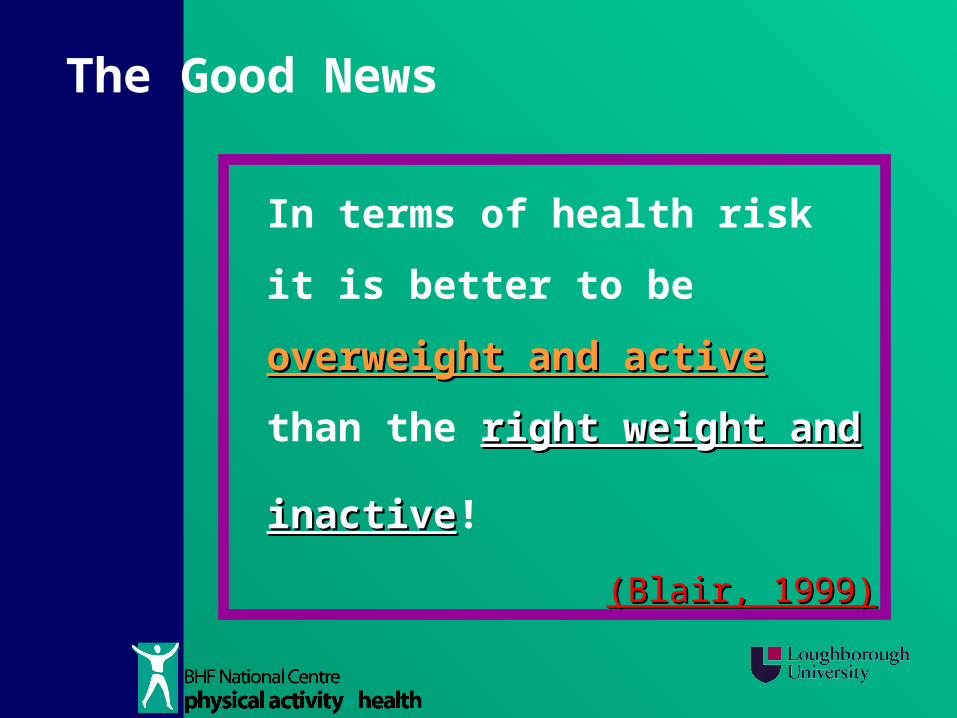
The Good News
In terms of health risk it
is better to be overweight overweight
and activeand active than the right right
weight and inactiveweight and inactive!
(Blair, 1999)(Blair, 1999)
Added Complication for Post 40s
By this age most people who are sedentary or insufficiently active will start to lose muscle mass and their strength thus reducing functional decline is also a priority.
Making a More Rigorous Case
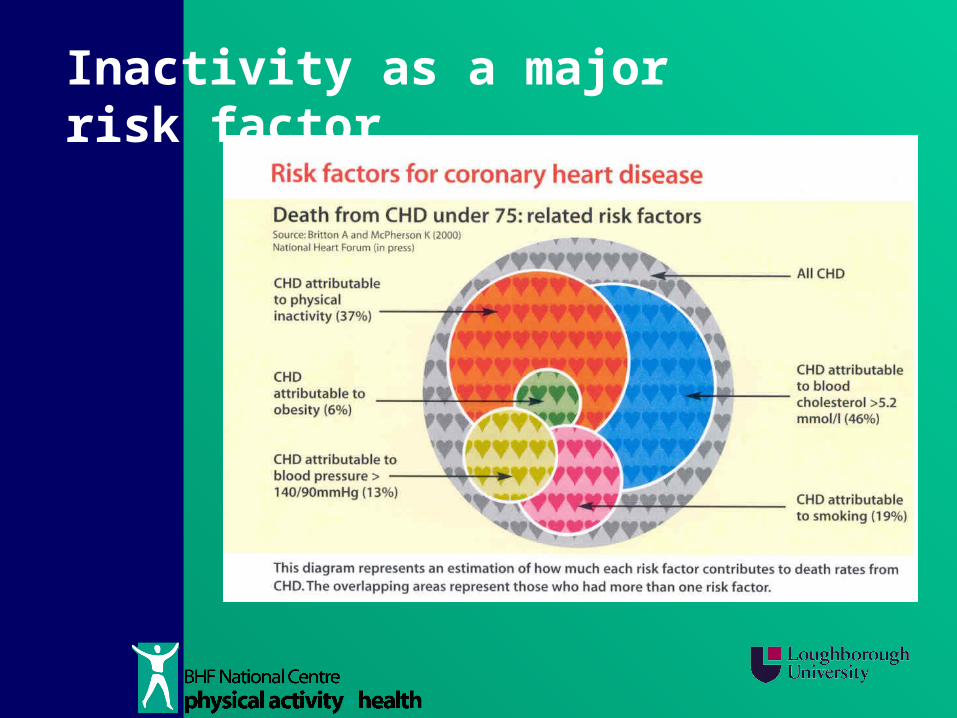
Inactivity as a major risk factor
Preventable Hazards to Population Health: Disability Adjusted Life Years (DALYS)
Occupational hazards Illicit drugs Cholesterol Low fruit/vegetables Obesity Alcohol abuse Hypertension Physical inactivity SmokingMathers (1999) Burden of Disease and Injury in Australian
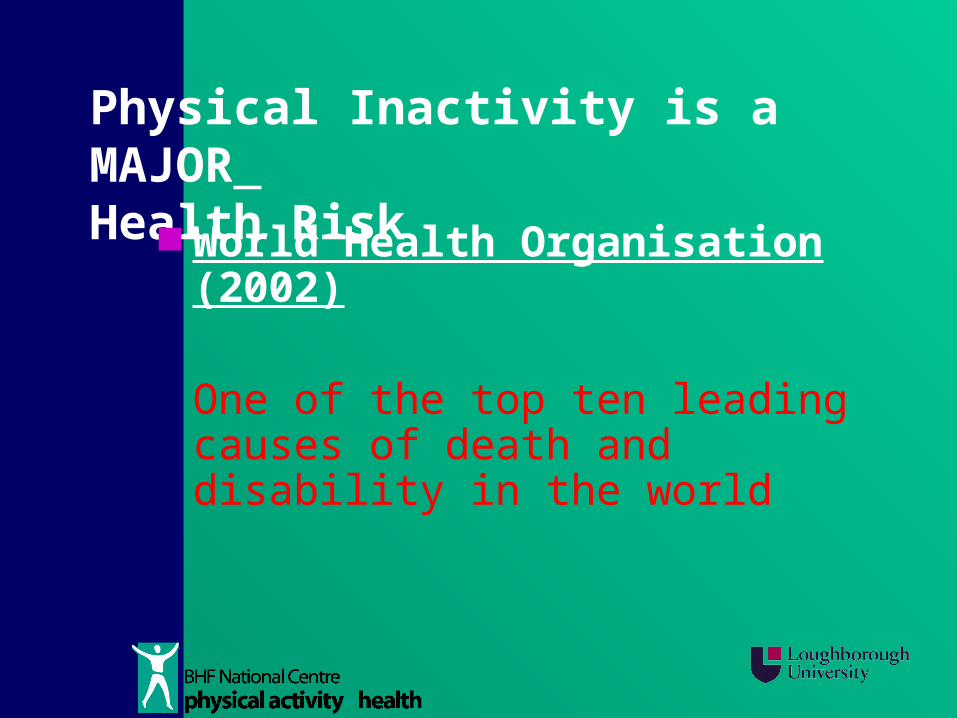
Physical Inactivity is a MAJOR Health Risk World Health Organisation
(2002)
One of the top ten leading causes of death and disability in the world
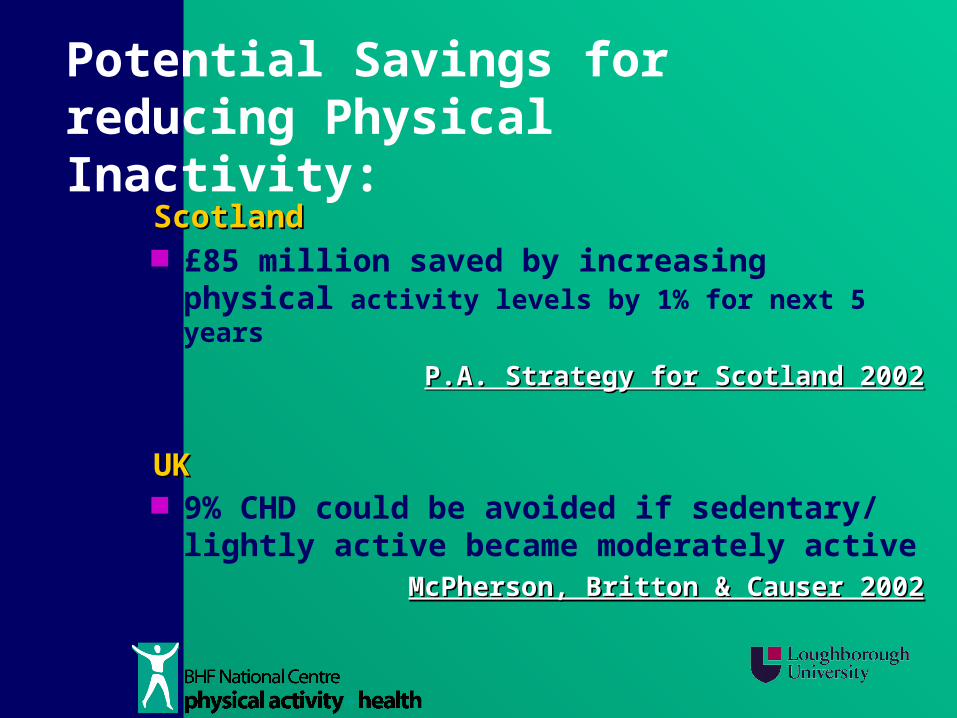
Potential Savings for reducing Physical Inactivity:
ScotlandScotland £85 million saved by increasing physical
activity levels by 1% for next 5 years
P.A. Strategy for Scotland 2002P.A. Strategy for Scotland 2002
UKUK 9% CHD could be avoided if sedentary/
lightly active became moderately active
McPherson, Britton & Causer 2002McPherson, Britton & Causer 2002
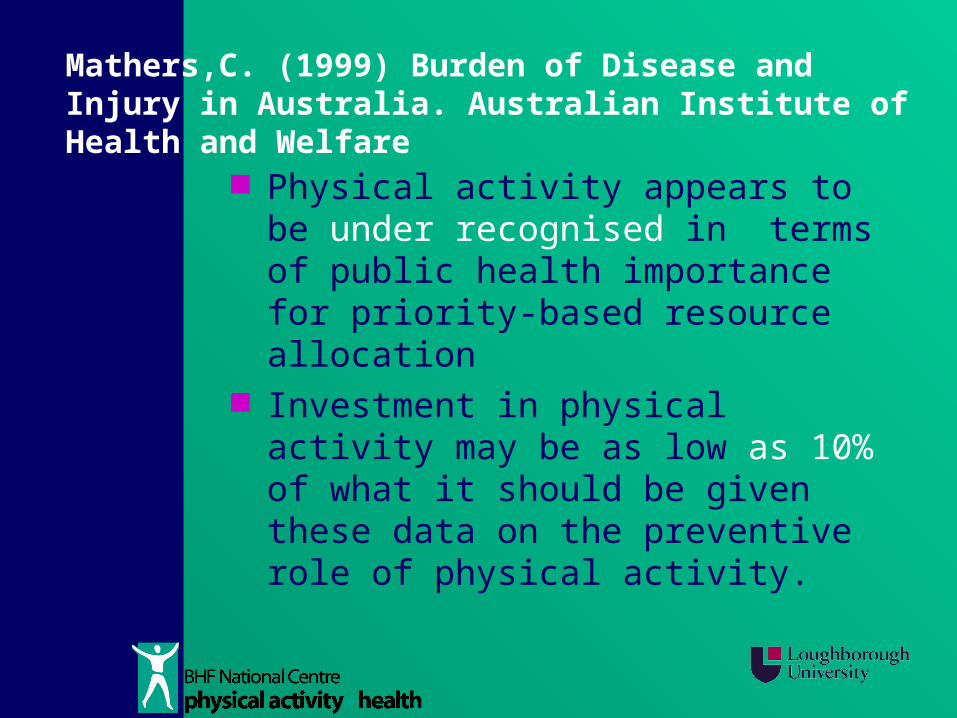
Mathers,C. (1999) Burden of Disease and Injury in Australia. Australian Institute of Health and Welfare
Physical activity appears to be under recognised in terms of public health importance for priority-based resource allocation
Investment in physical activity may be as low as 10% of what it should be given these data on the preventive role of physical activity.

What Should we do?
Raise the priority given to promoting Purposeful Activity and Health by:
MPsCivil ServantsPublic Health OfficialsRegional AssembliesLocal Councils
All Sport BodiesRecognise the
significance of Health as an added value to Sport as enrichment of our cultural wealth
A Different Perspective
Sport needs to accommodate another dimension
Rusty Ladies example

All of us need to:
Recognise what it is that we need to promote
Sport and Health:INCREASE ACTIVITY LEVELS
OF Sedentary population Insufficiently active
PROMOTE MORE Productive/purposeful use of
leisure-time
THREE KEY AREAS FOR HEALTH GAINS
16-25
Post 35
Post 60
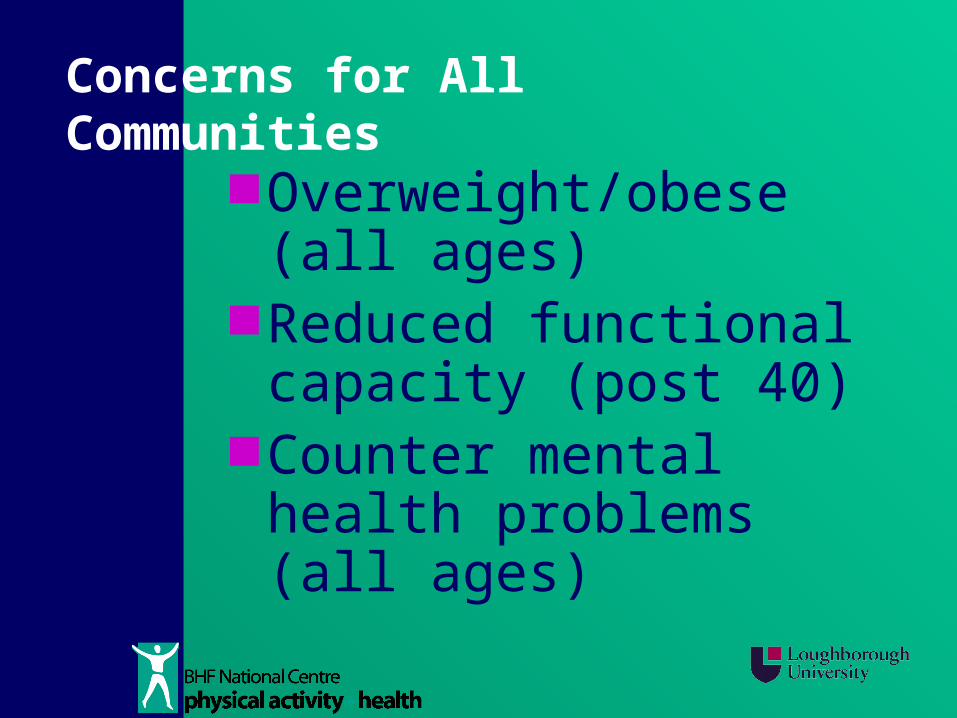
Concerns for All Communities
Overweight/obese (all ages)
Reduced functional capacity (post 40)
Counter mental health problems (all ages)
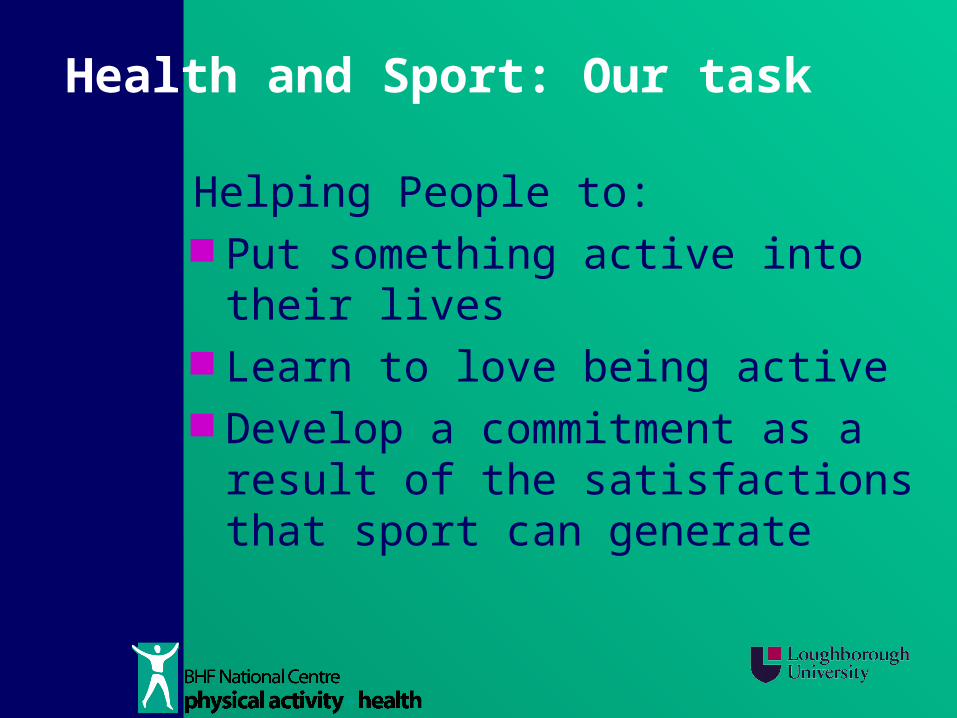
Health and Sport: Our task
Helping People to: Put something active into their
lives Learn to love being active Develop a commitment as a
result of the satisfactions that sport can generate
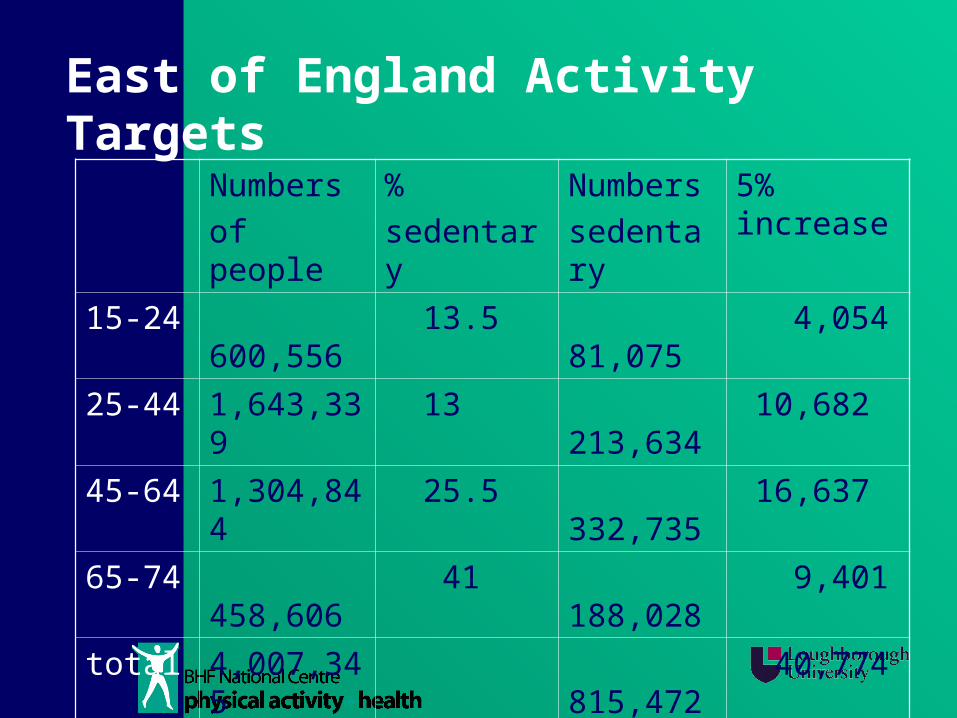
East of England Activity Targets
Age Range
Numbers
of people
%
sedentary
Numbers
sedentary
5% increase
15-24 600,556 13.5 81,075 4,054
25-44 1,643,339 13 213,634 10,682
45-64 1,304,844 25.5 332,735 16,637
65-74 458,606 41 188,028 9,401
total 4,007,345 815,472 40,774
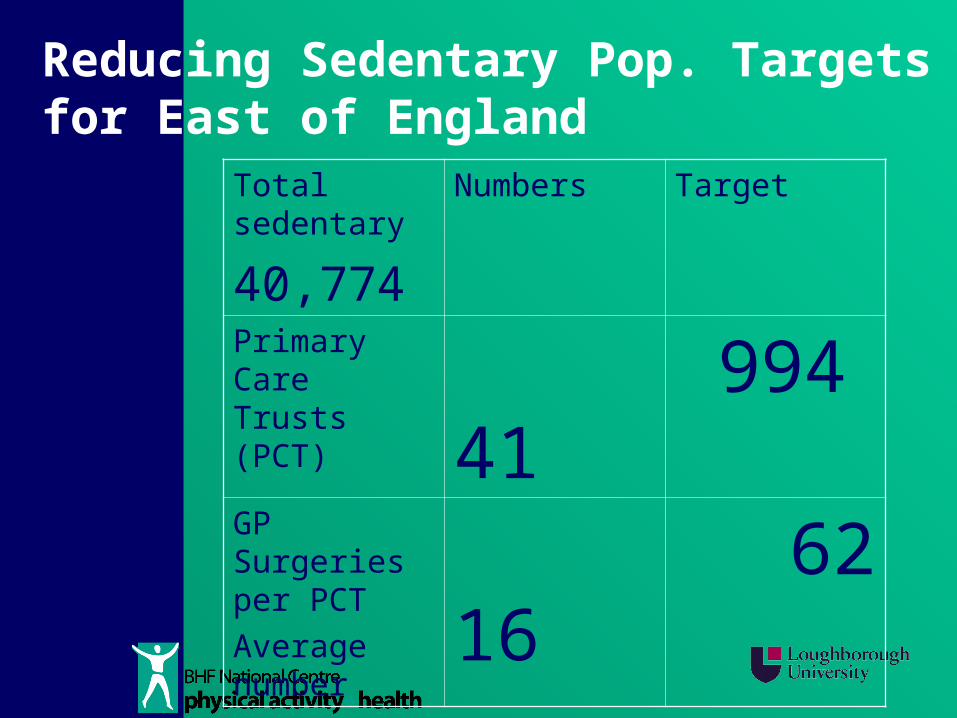
Reducing Sedentary Pop. Targets for East of England
Total sedentary
40,774
Numbers Target
Primary Care Trusts (PCT) 41 994
GP Surgeries per PCT
Average number
16 62
Thank You
With your help we can put purposefulPhysical Activity into everyone’s lives.
WE REALLY CAN MAKE A DIFFERENCE
Contact:
Len AlmondBHF National Centre for Physical
Activity and HealthLoughborough UniversityLoughborough LE11 3TUTel. 01509 223329Fax. 01509 223972Email: [email protected]: www.bhfactive.org.uk