Embed Size (px)
Citation preview

Linking Research, Audit, Quality Improvement and Evidence-
Based Medicine
Dr Chris Cairns
2010
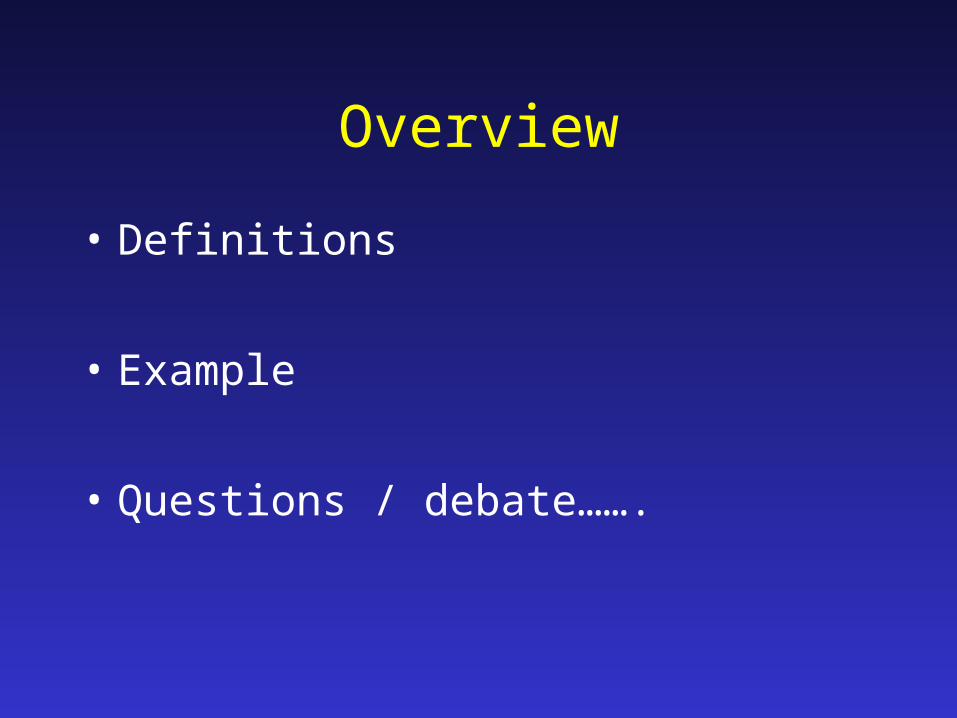
Overview
• Definitions
• Example
• Questions / debate…….
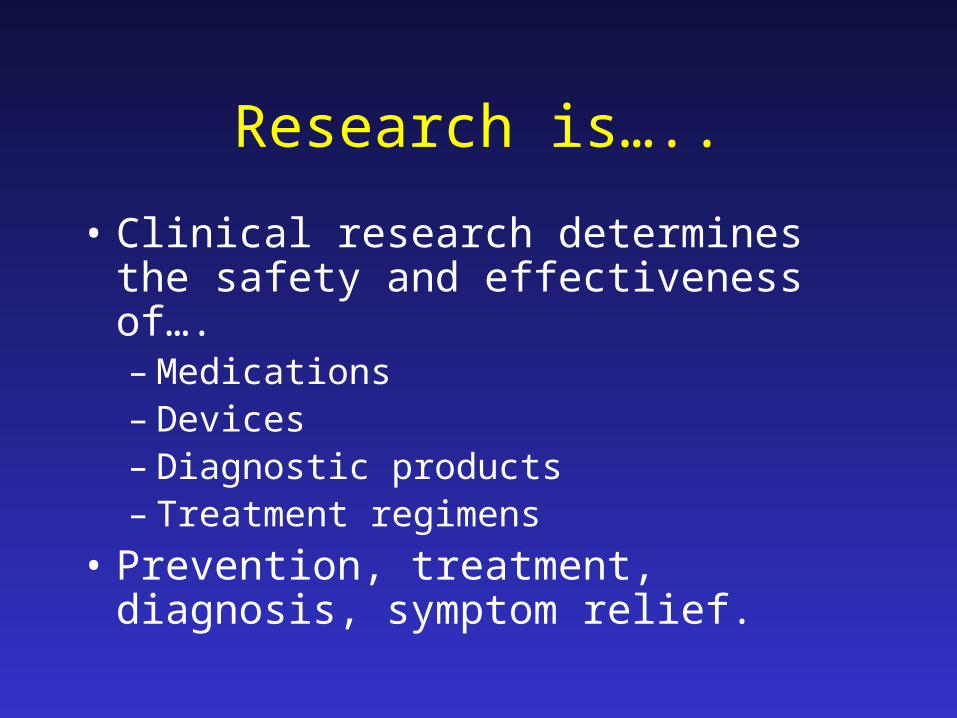
Research is…..
• Clinical research determines the safety and effectiveness of….– Medications– Devices– Diagnostic products– Treatment regimens
• Prevention, treatment, diagnosis, symptom relief.
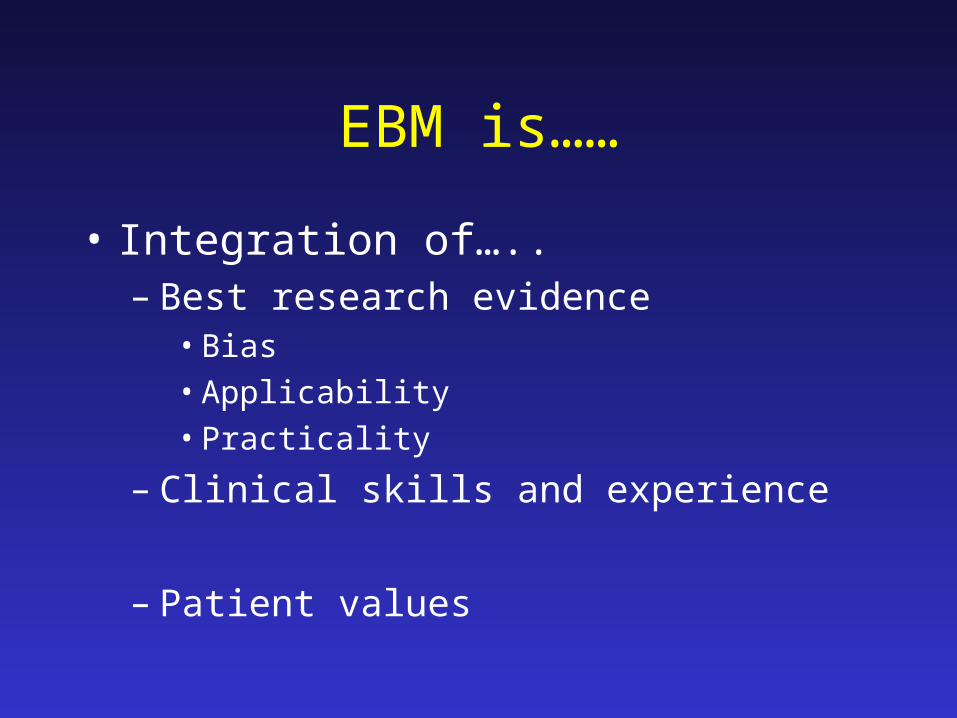
EBM is……
• Integration of…..– Best research evidence
• Bias• Applicability• Practicality
– Clinical skills and experience
– Patient values
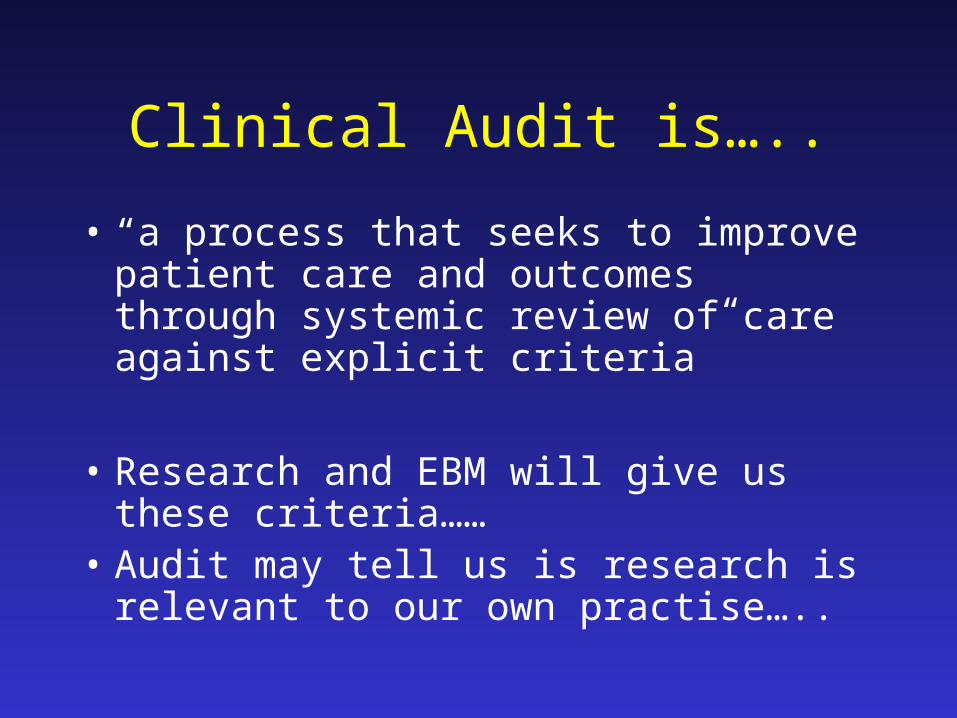
Clinical Audit is…..
• “a process that seeks to improve patient care and outcomes through systemic review of care against explicit criteria”
• Research and EBM will give us these criteria……
• Audit may tell us is research is relevant to our own practise…..
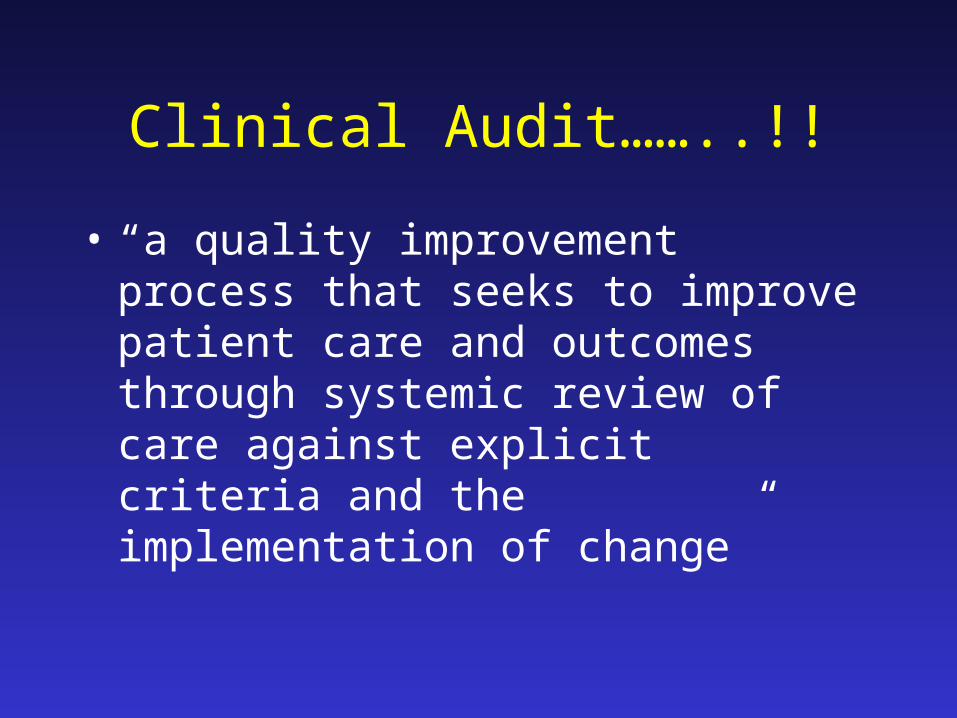
Clinical Audit……..!!
• “a quality improvement process that seeks to improve patient care and outcomes through systemic review of care against explicit criteria and the implementation of change”
Quality improvement is…
• Not quite so simple…….
• Improving patient care…..but how…..in what way….to what end…..??
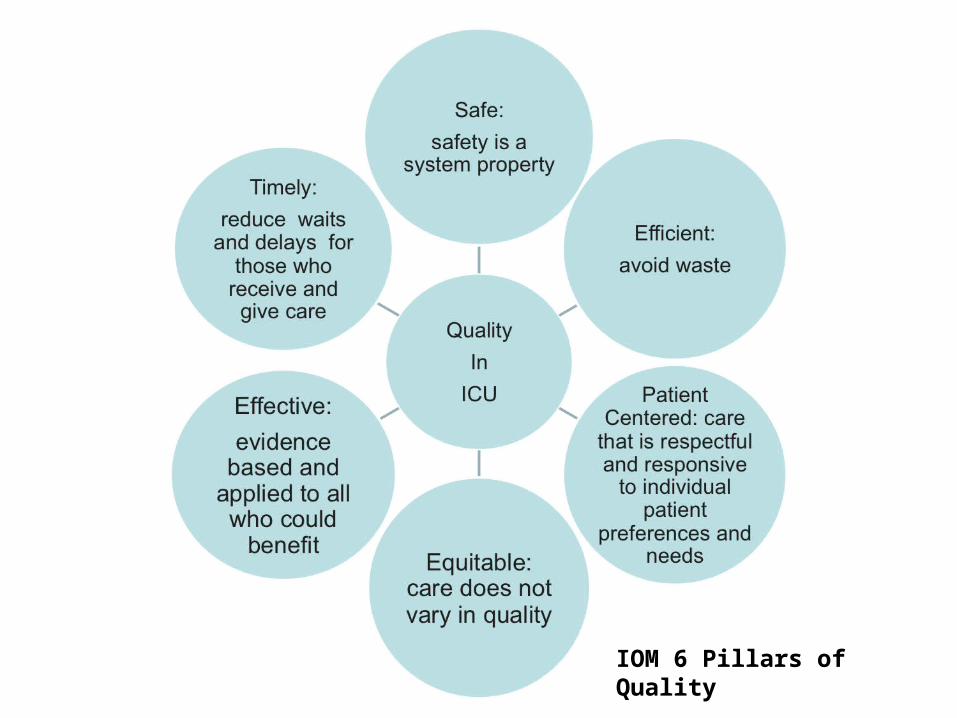
IOM 6 Pillars of Quality
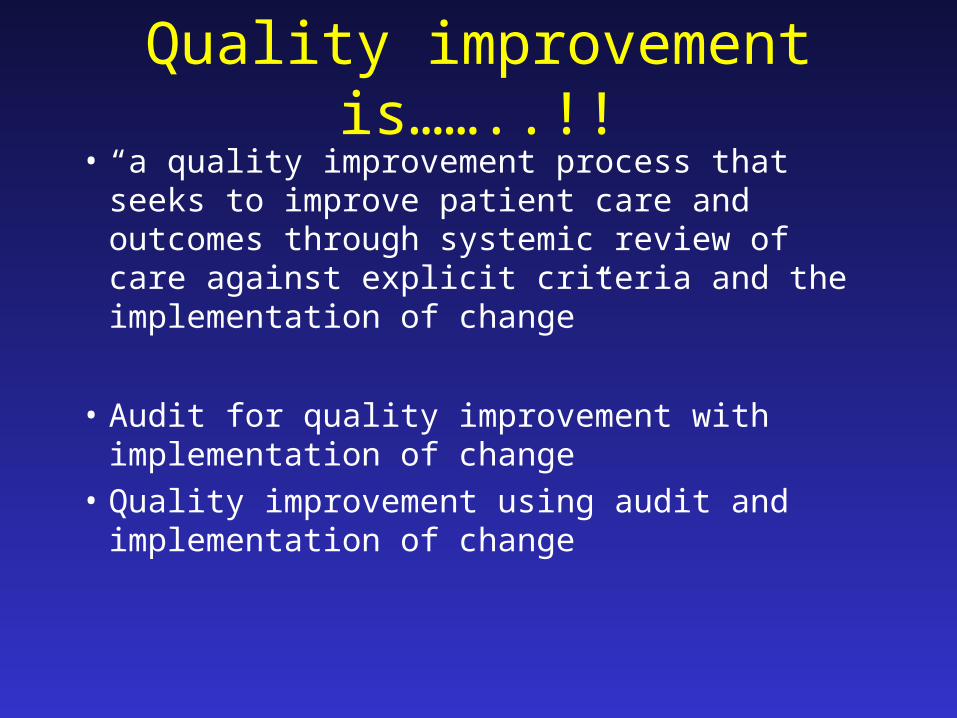
Quality improvement is……..!!• “a quality improvement process that seeks to
improve patient care and outcomes through systemic review of care against explicit criteria and the implementation of change”
• Audit for quality improvement with implementation of change
• Quality improvement using audit and implementation of change
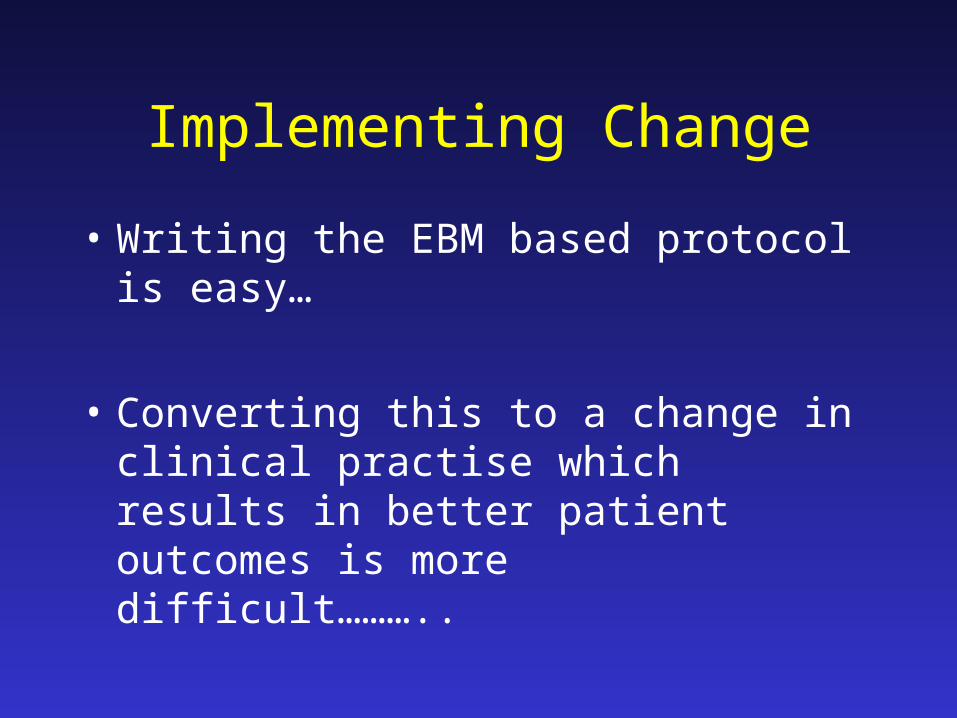
Implementing Change
• Writing the EBM based protocol is easy…
• Converting this to a change in clinical practise which results in better patient outcomes is more difficult………..
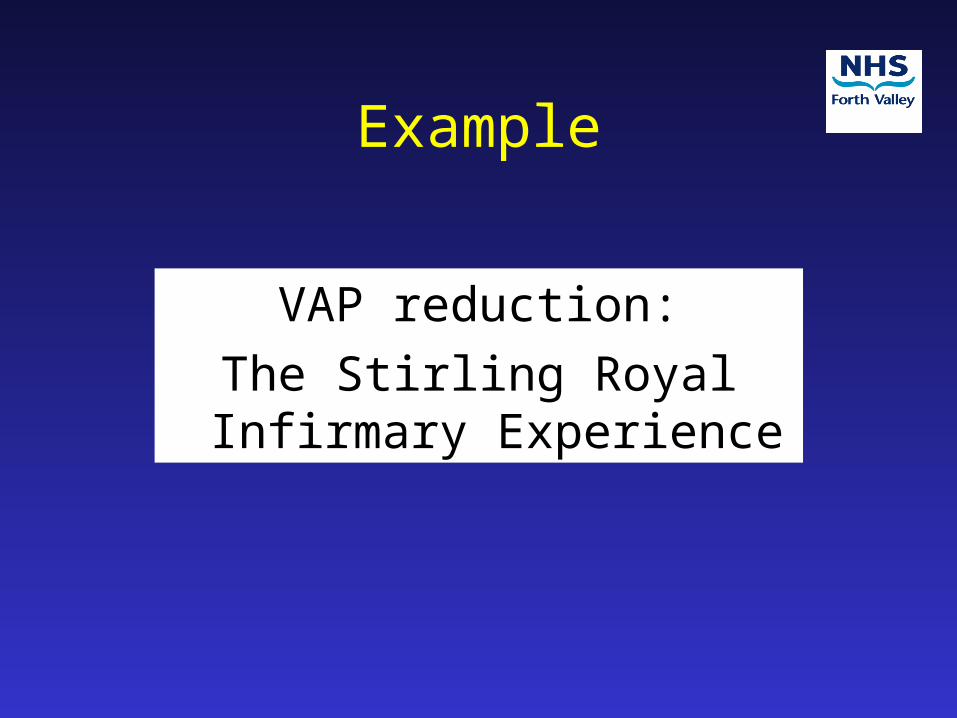
Example
VAP reduction:
The Stirling Royal Infirmary Experience
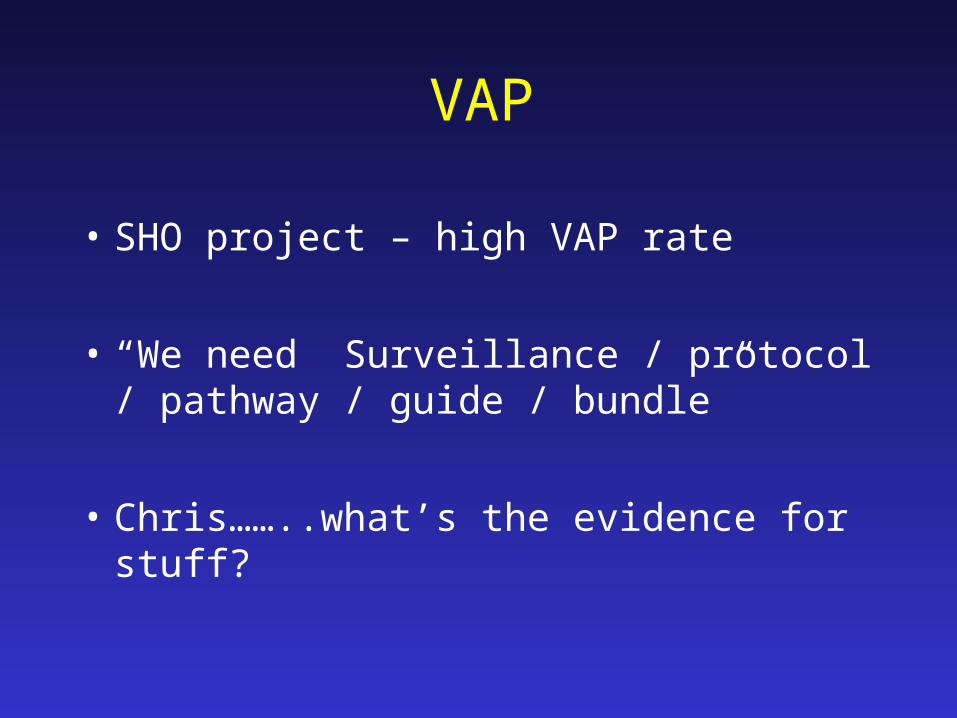
VAP
• SHO project – high VAP rate
• “We need Surveillance / protocol / pathway / guide / bundle”
• Chris……..what’s the evidence for stuff?
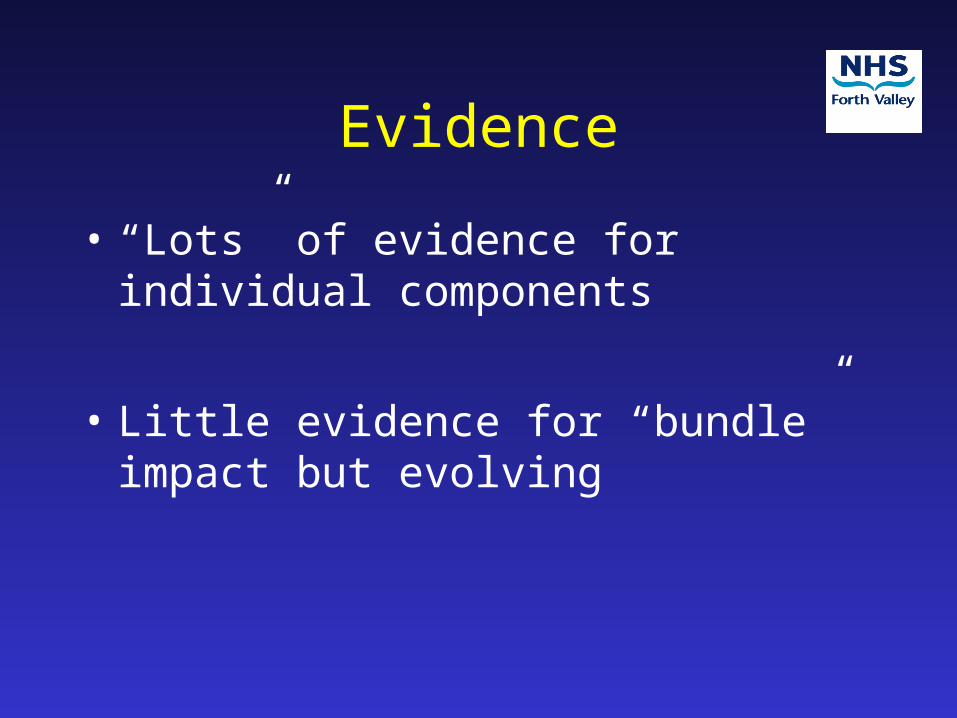
Evidence
• “Lots” of evidence for individual components
• Little evidence for “bundle” impact but evolving
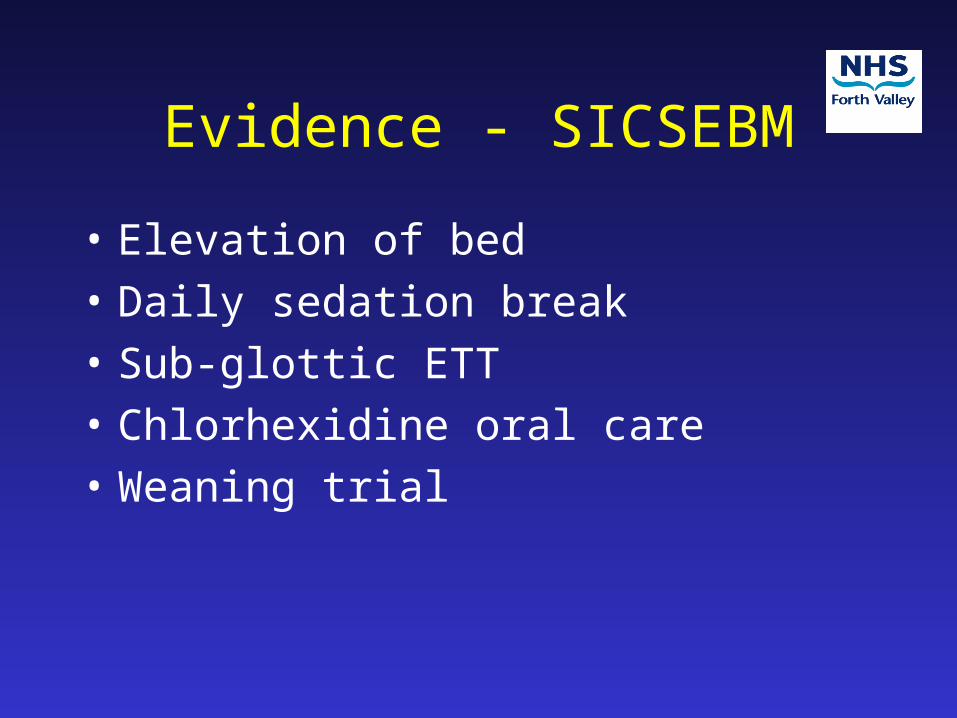
Evidence - SICSEBM
• Elevation of bed
• Daily sedation break
• Sub-glottic ETT
• Chlorhexidine oral care
• Weaning trial
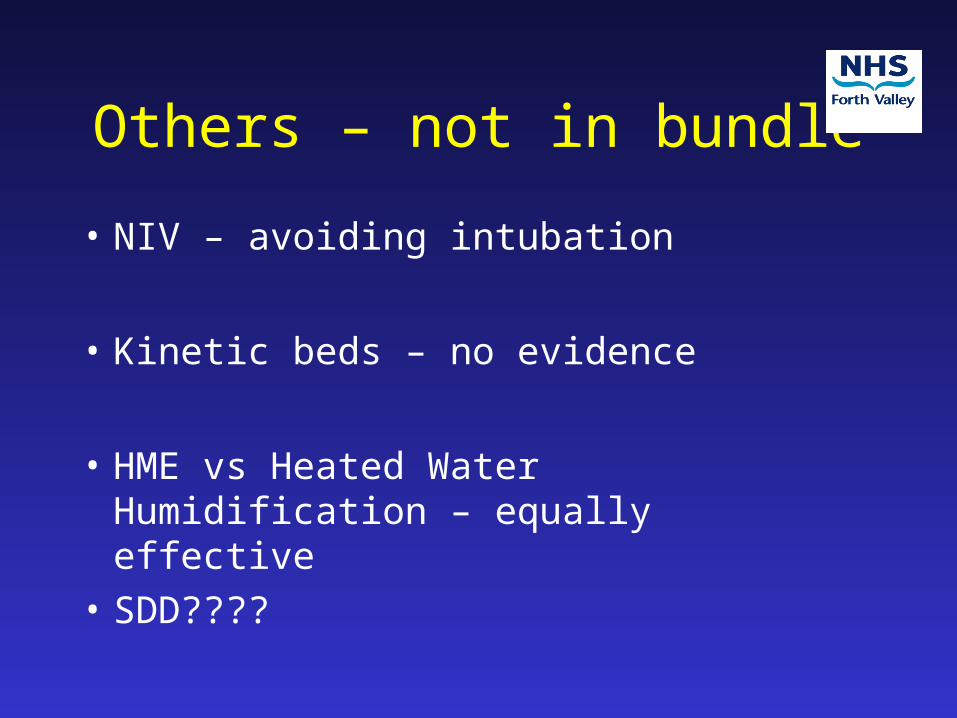
Others – not in bundle
• NIV – avoiding intubation
• Kinetic beds – no evidence
• HME vs Heated Water Humidification – equally effective
• SDD????
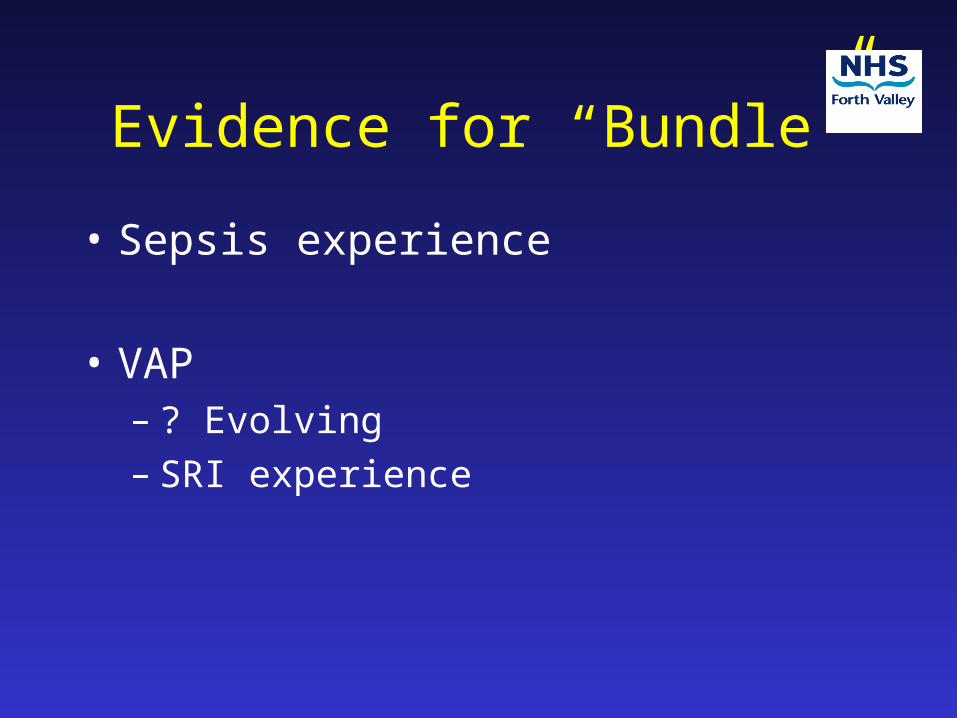
Evidence for “Bundle”
• Sepsis experience
• VAP – ? Evolving– SRI experience

SRI Experience – Nov 2005
• VAP Prevention Bundle • 30 - 45o positioning• daily sedation holiday• daily weaning
assessment
• chlorhexidine mouthwash • subglottic aspiration tube • tubing management
– appropriate humidification– avoidance of contamination

Additionally
• S/C enoxaparin pre-printed
• Ranitidine pre-printed
• Enteral feeding encouraged – if tolerated ranitidine cessation considered.
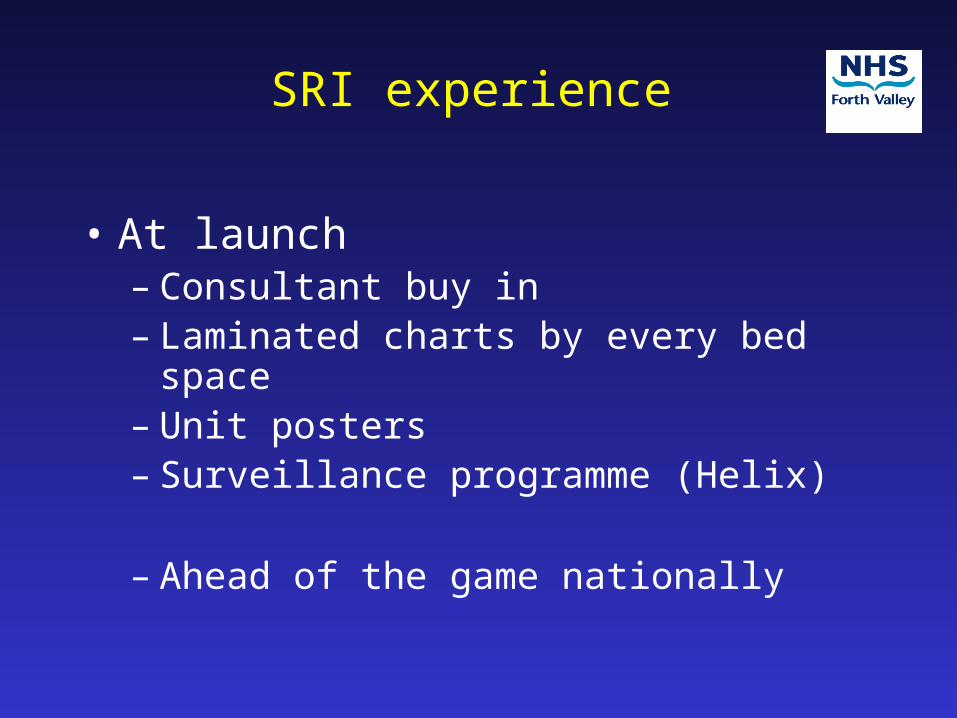
SRI experience
• At launch– Consultant buy in – Laminated charts by every bed space– Unit posters– Surveillance programme (Helix)
– Ahead of the game nationally

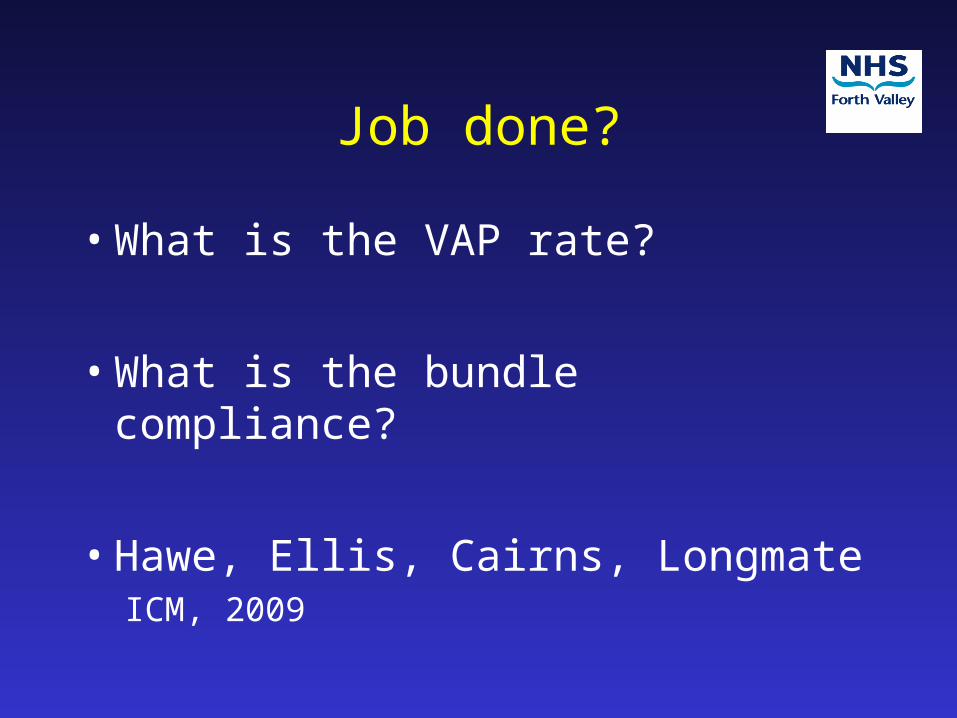
Job done?
• What is the VAP rate?
• What is the bundle compliance?
• Hawe, Ellis, Cairns, Longmate ICM, 2009
Job done?
• What is the VAP rate?
• What is the bundle compliance?
• Hawe, Ellis, Cairns, Longmate ICM, 2009
0
50
100
150
200
250
300
3501 4 7 10 13 16 19 22 25 28 31 34 37 40 43 46 49 52 55 58 61 64 67
Nu
mb
er o
f at
ris
k ve
nti
lati
on
day
s b
etw
een
.
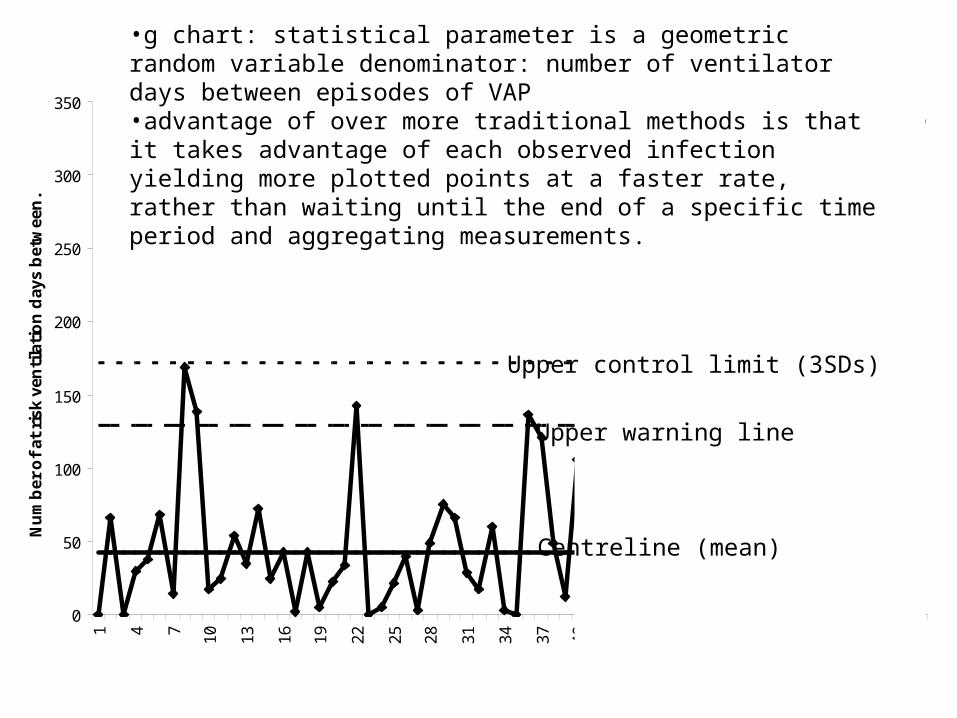
•g chart: statistical parameter is a geometric random variable denominator: number of ventilator days between episodes of VAP•advantage of over more traditional methods is that it takes advantage of each observed infection yielding more plotted points at a faster rate, rather than waiting until the end of a specific time period and aggregating measurements.
Upper control limit (3SDs)
Upper warning line
Centreline (mean)
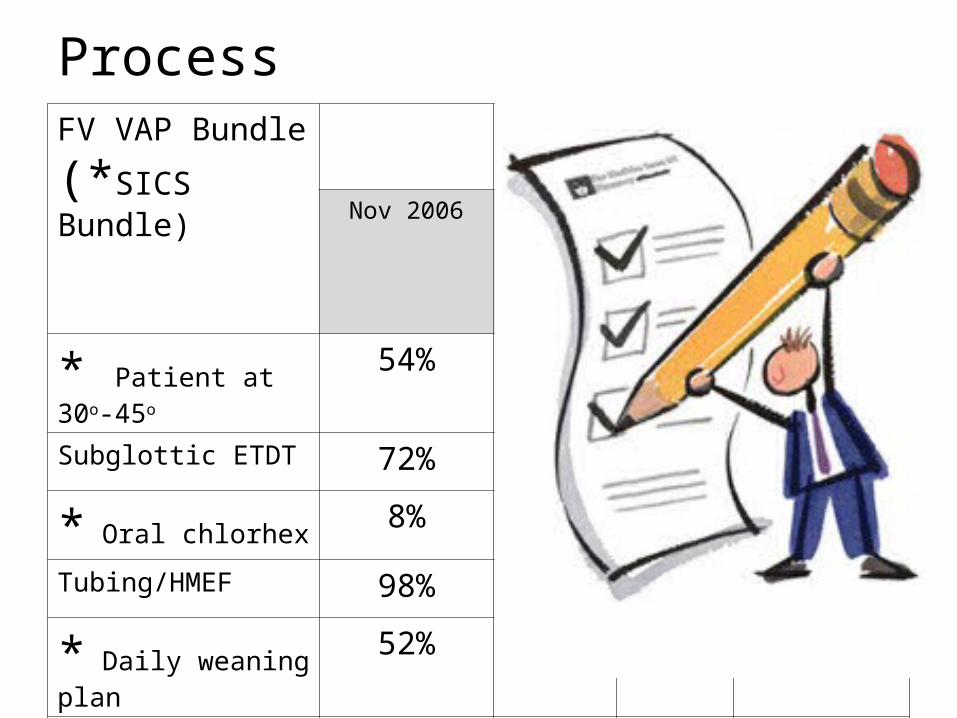
FV VAP Bundle
(*SICS Bundle)
Postinterventions Chi-squared p value(Nov 2006 vs Oct 2007)
Nov 2006 May 2007 Oct 2007
* Patient at 30o-45o 54% 80% 94% <0.001
Subglottic ETDT 72% 92% 92% <0.001
* Oral chlorhex8% 94% 100% <0.001
Tubing/HMEF 98% 98% 100% 0.31
* Daily weaning plan52% 72% 72% 0.039
* Sedation stop72% 86% 82% 0.23
All elements 0% 48% 54% <0.0001
Process
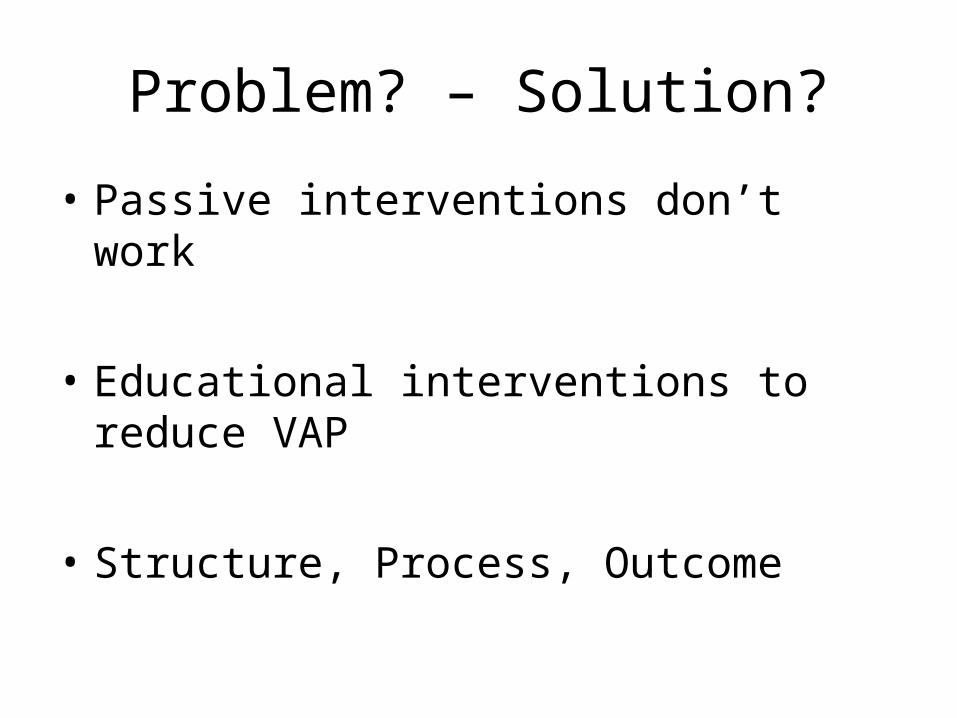
Problem? – Solution?
• Passive interventions don’t work
• Educational interventions to reduce VAP
• Structure, Process, Outcome
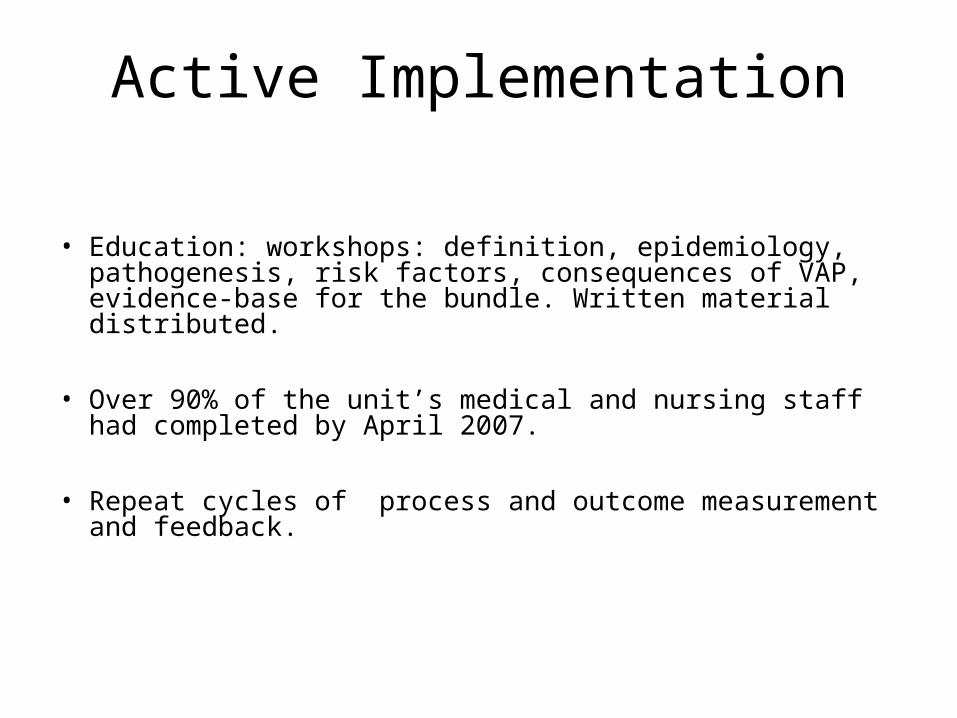
Active Implementation
• Education: workshops: definition, epidemiology, pathogenesis, risk factors, consequences of VAP, evidence-base for the bundle. Written material distributed.
• Over 90% of the unit’s medical and nursing staff had completed by April 2007.
• Repeat cycles of process and outcome measurement and feedback.
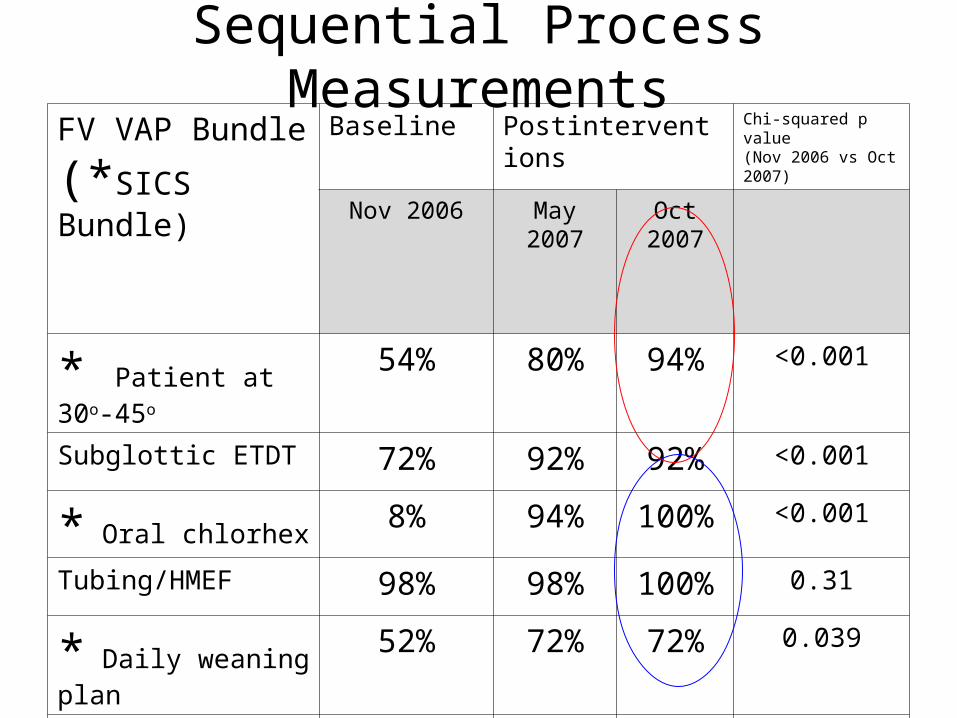
FV VAP Bundle
(*SICS Bundle)
Baseline Postinterventions Chi-squared p value(Nov 2006 vs Oct 2007)
Nov 2006 May 2007 Oct 2007
* Patient at 30o-45o 54% 80% 94% <0.001
Subglottic ETDT 72% 92% 92% <0.001
* Oral chlorhex8% 94% 100% <0.001
Tubing/HMEF 98% 98% 100% 0.31
* Daily weaning plan52% 72% 72% 0.039
* Sedation stop72% 86% 82% 0.23
All elements 0% 48% 54% <0.0001
Sequential Process Measurements
0
50
100
150
200
250
300
3501 4 7 10 13 16 19 22 25 28 31 34 37 40 43 46 49 52 55 58 61 64 67
Nu
mb
er o
f at
ris
k ve
nti
lati
on
day
s b
etw
een
.
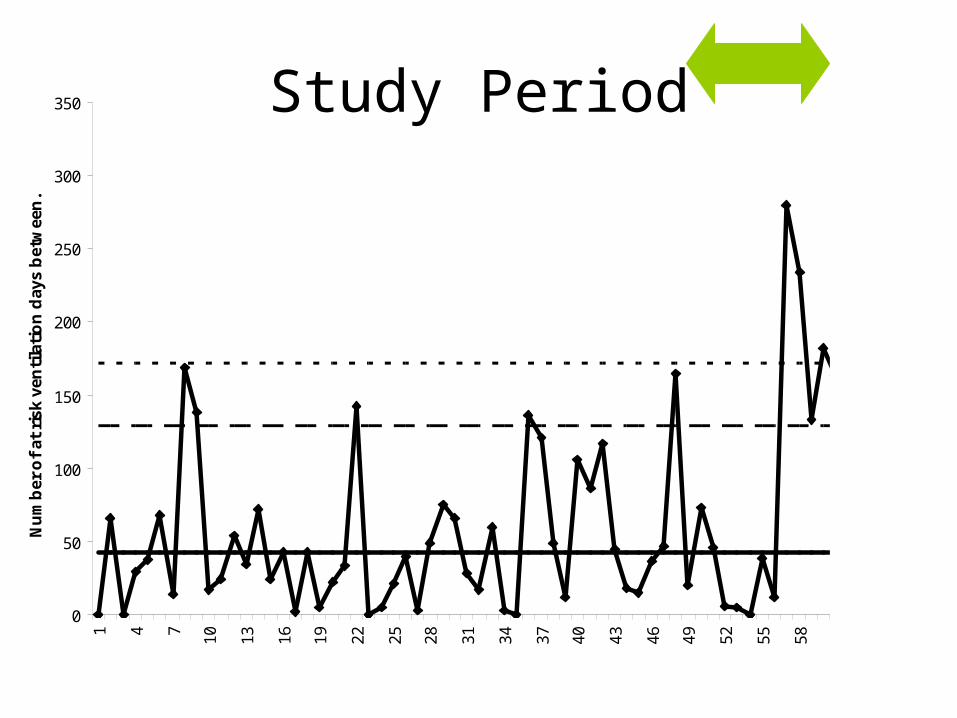
Study Period
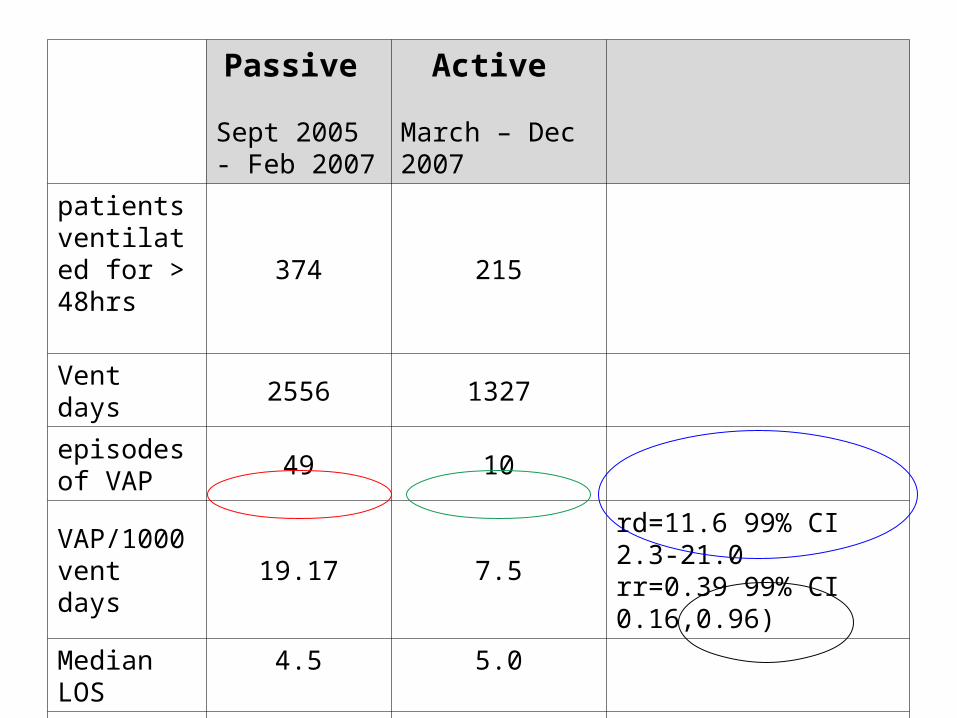
Passive
Sept 2005 - Feb 2007
Active
March – Dec 2007
patients ventilated for > 48hrs
374 215
Vent days 2556 1327
episodes of VAP
49 10
VAP/1000 vent days
19.17 7.5rd=11.6 99% CI 2.3-21.0rr=0.39 99% CI 0.16,0.96)
Median LOS 4.5 5.0
Mortality (112/374) 30% (49/215) 23% p=0.06
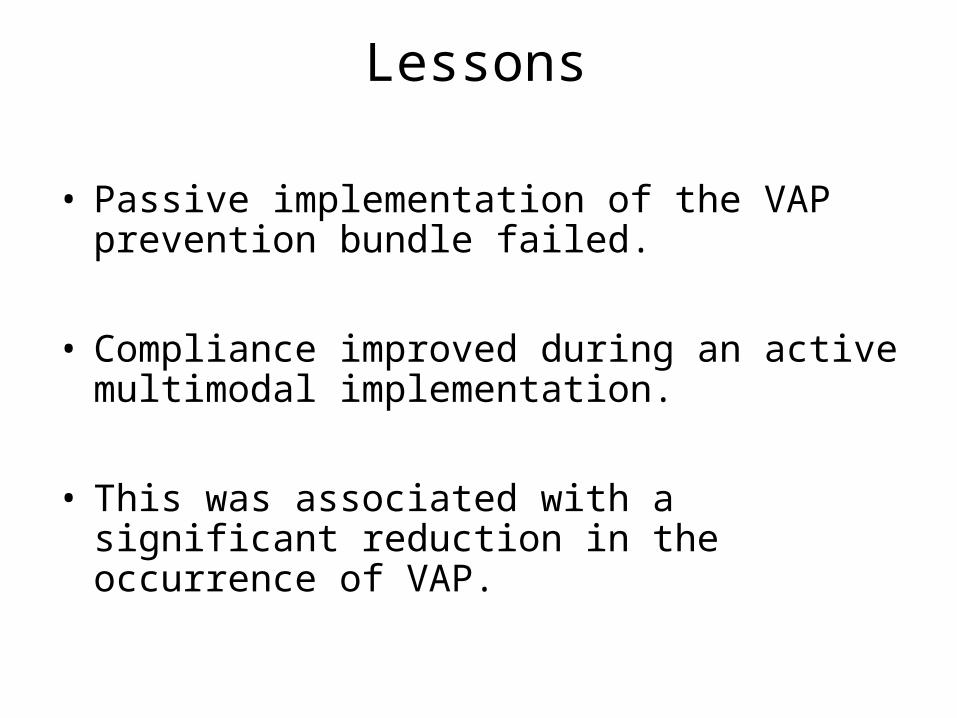
Lessons
• Passive implementation of the VAP prevention bundle failed.
• Compliance improved during an active multimodal implementation.
• This was associated with a significant reduction in the occurrence of VAP.
The Scottish Patient Safety Programme
Title of the session & name of faculty
Since then………………..
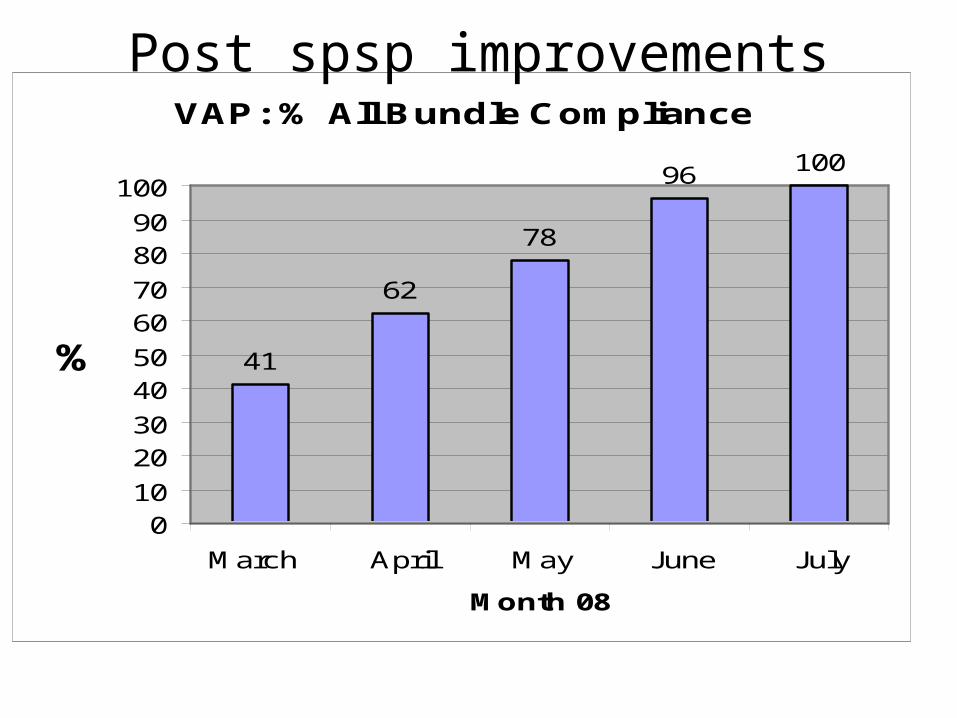
VAP: % All Bundle Compliance
41
62
78
96 100
010
2030
4050
6070
8090
100
March April May June July
Month 08
%
Post spsp improvements
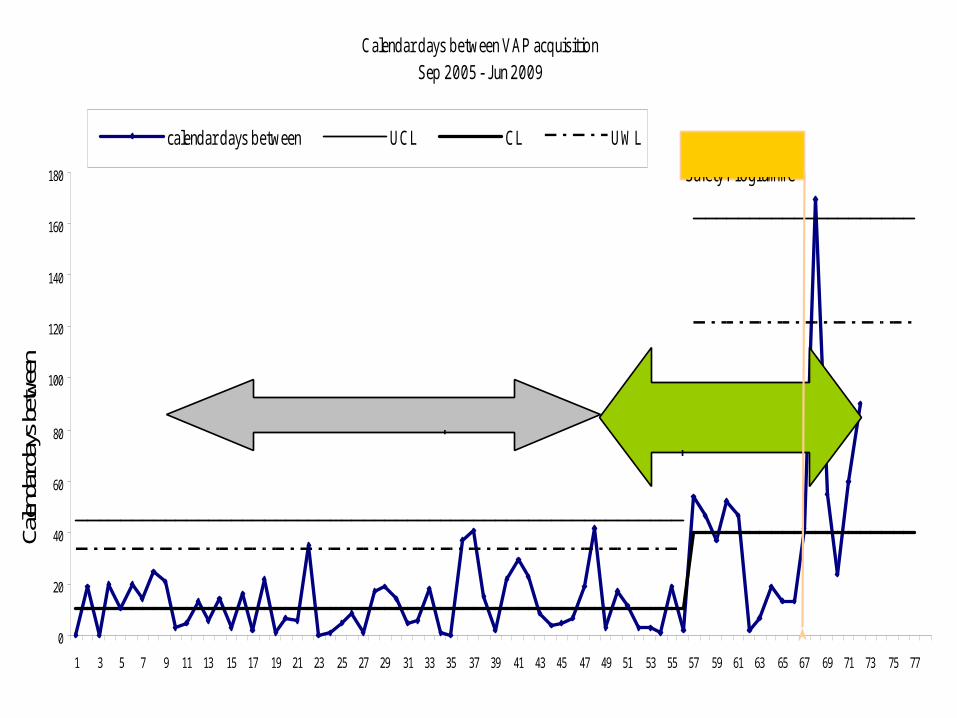
Calendar days between VAP acquisition Sep 2005 - J un 2009
0
20
40
60
80
100
120
140
160
180
1 3 5 7 9 11 13 15 17 19 21 23 25 27 29 31 33 35 37 39 41 43 45 47 49 51 53 55 57 59 61 63 65 67 69 71 73 75 77
Calen
dar d
ays
betw
een
calendar days between UCL CL UWL
Passive intervention period Active intervention & compliance feedback
Scottish Patient Safety Programme
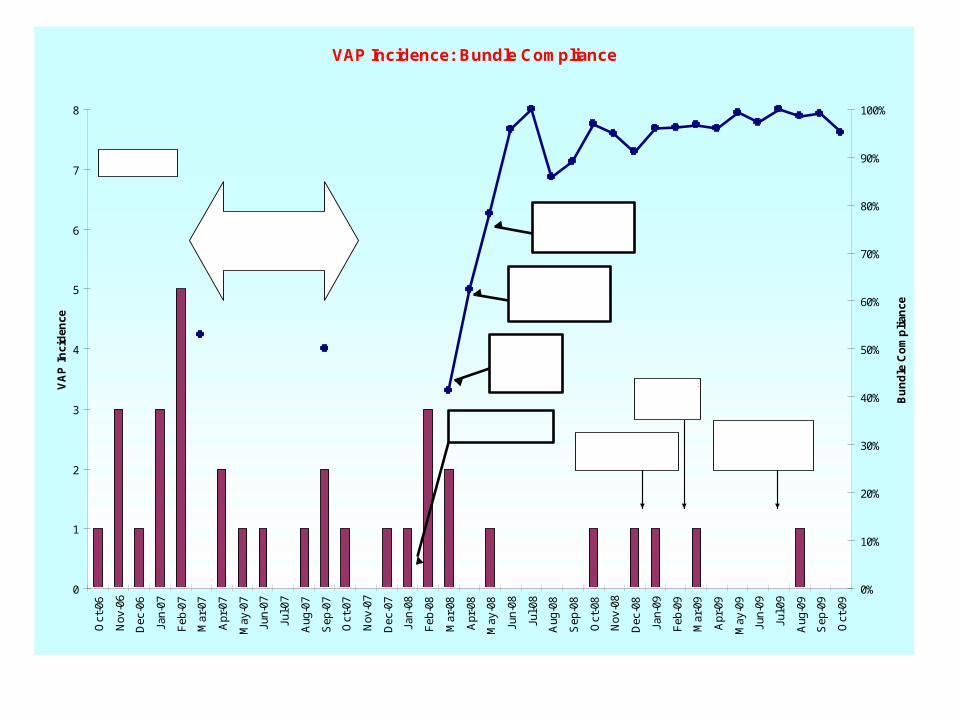
VAP Incidence: Bundle Compliance
0
1
2
3
4
5
6
7
8O
ct-0
6
Nov
-06
Dec
-06
Jan-
07
Feb
-07
Mar
-07
Apr
-07
May
-07
Jun-
07
Jul-0
7
Aug
-07
Sep
-07
Oct
-07
Nov
-07
Dec
-07
Jan-
08
Feb
-08
Mar
-08
Apr
-08
May
-08
Jun-
08
Jul-0
8
Aug
-08
Sep
-08
Oct
-08
Nov
-08
Dec
-08
Jan-
09
Feb
-09
Mar
-09
Apr
-09
May
-09
Jun-
09
Jul-0
9
Aug
-09
Sep
-09
Oct
-09
VA
P I
nci
den
ce
0%
10%
20%
30%
40%
50%
60%
70%
80%
90%
100%
Bu
nd
le C
om
pli
ance
Patient Safety Programme begins
Tw ice daily w ean screen sticker added to 24hr chart
VAP bundle prompts added to daily goals sheet.
Active period: Bundle implementation,
audit & education
Continuous measurement initiated
VAP - Pt constantly pulling at trachy, poorly compliant with head up & mouthwash
VAP - Long term pt vent for more than 150 days
VAP - poorly compliant pt, refusing to sit up refusing chlohex. Handling trachy and tubing. Not clear cut!
HELICS surveillance
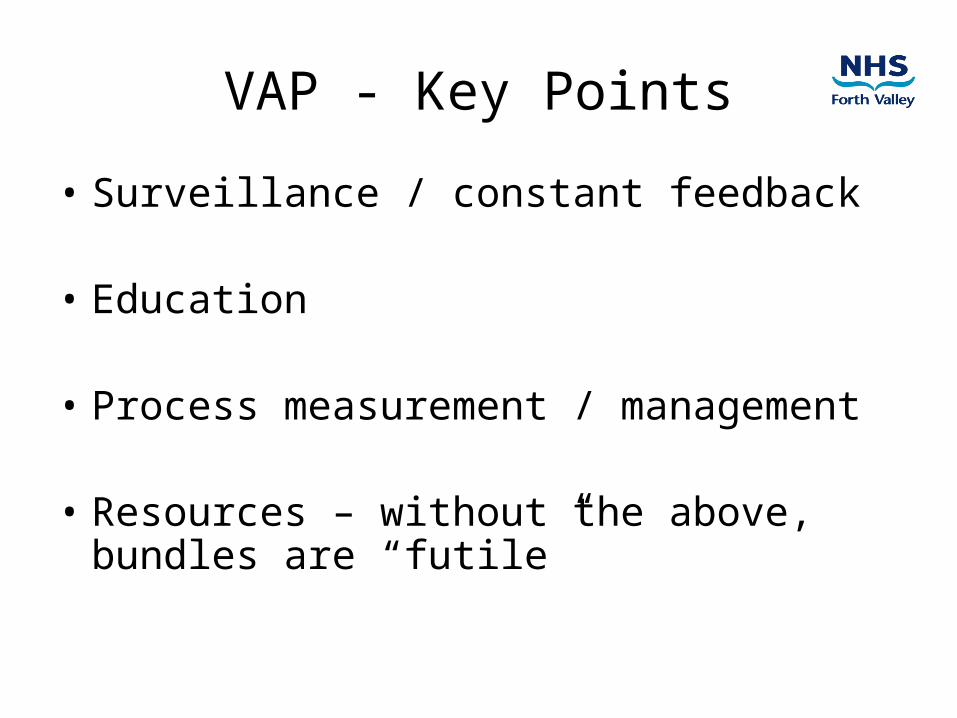
VAP - Key Points
• Surveillance / constant feedback
• Education
• Process measurement / management
• Resources – without the above, bundles are “futile”
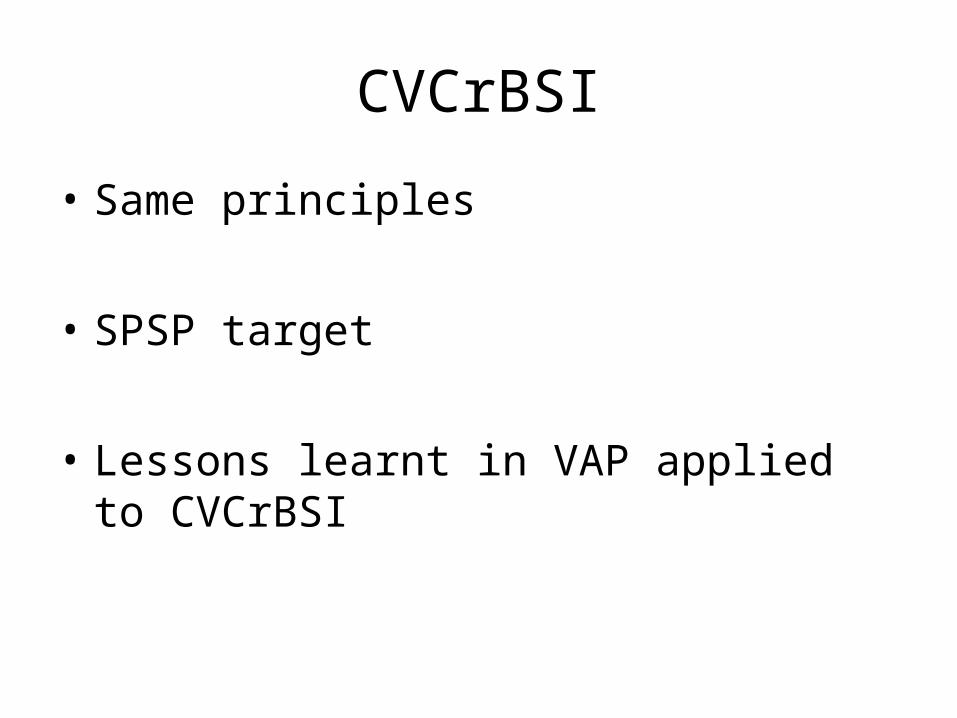
CVCrBSI
• Same principles
• SPSP target
• Lessons learnt in VAP applied to CVCrBSI
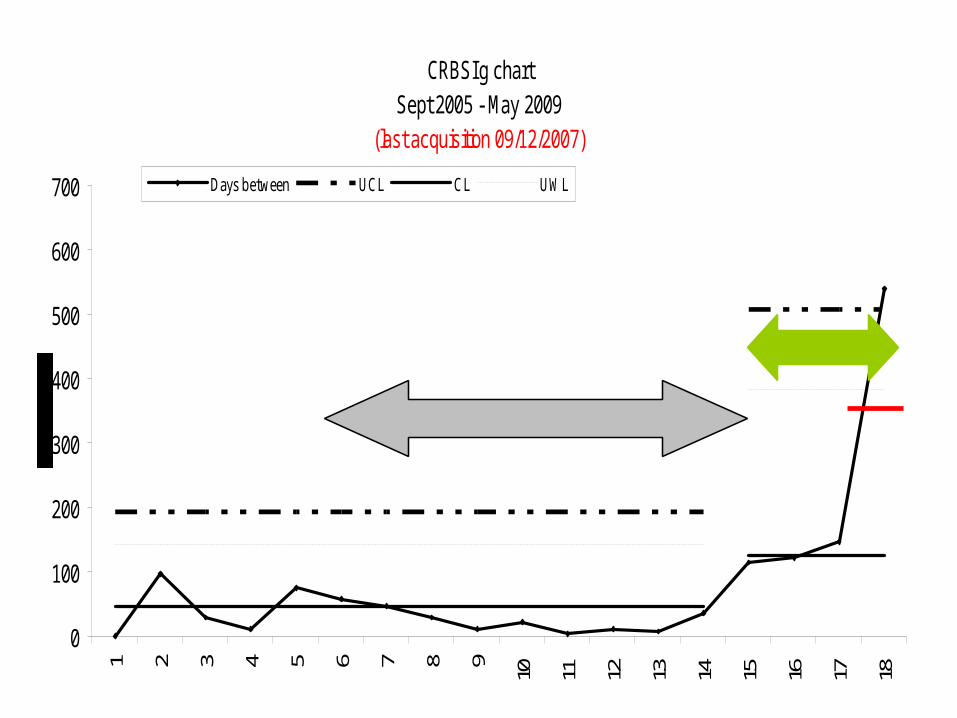
CRBSI g chart Sept 2005 - May 2009
(last acquisition 09/12/2007)
0
100
200
300
400
500
600
700
1 2 3 4 5 6 7 8 9 10 11 12 13 14 15 16 17 18
Days between UCL CL UWL
Passive intervention
Active intervention
CVC
0
1
2
3
4
5
6
7
8
9
10O
ct-0
6
Nov
-06
Dec
-06
Jan-
07
Feb
-07
Mar
-07
Apr
-07
May
-07
Jun-
07
Jul-0
7
Aug
-07
Sep
-07
Oct
-07
Nov
-07
Dec
-07
Jan-
08
Feb
-08
Mar
-08
Apr
-08
May
-08
Jun-
08
Jul-0
8
Aug
-08
Sep
-08
Oct
-08
Nov
-08
Dec
-08
Jan-
09
Feb
-09
Mar
-09
Apr
-09
May
-09
Jun-
09
Jul-0
9
Aug
-09
Sep
-09
Oct
-09
0%
20%
40%
60%
80%
100%monthly incidence (Numerator)
CRBSI Prevention% Bundle compliance
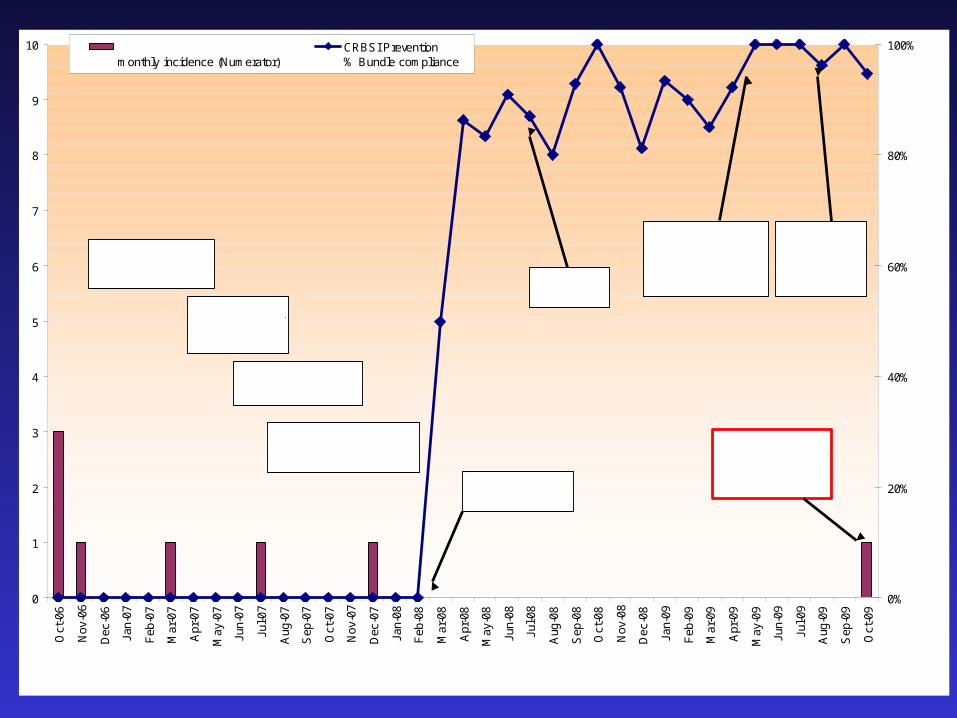
CRBSI Rate Compared to CVC Insertion Bundle Compliance
Insertion Pack introduced
CVC Maintenance bundle -prompt added to 24 hr chart
Establishment of team of nurses to take ow nership of CVC inserion & maintenance bundles and measurement
Continuous measurement begins
Insertion bundle questions added to Wardw atcher
Insertion bundle sticker developed for pt notes
Online educational resource devloped for CVC insertion bundle and maintenance bundle
CRBSI - Line migrated & TPN leaking from line site, line not removed immediately.
HELICS surveillance begins
Summary
• Definitions
• Example
• Questions / debate…….
Debate
• How do we link these all together nationally?
• What should we me measuring?
• Is quality improvement part of the remit of SICSAG or……?
• Is quality improvement a sub-specialty?


![DOsDON'TsManagingSeismicDataArchive Cairns[1]](https://img.pdfslide.us/doc/110x75/577ce7611a28abf103950300/dosdontsmanagingseismicdataarchive-cairns1.jpg)