Embed Size (px)
Citation preview
Linking organizational culture and customer
satisfaction: Results from two companies in different
industries
Michael A. GillespieDenison Consulting, Ann Arbor, MI, USA
Daniel R. DenisonInternational Institute for Management Development, Lausanne, Switzerland
Stephanie HaalandLinfield College, McMinnville, OR, USA
Ryan SmerekUniversity of Michigan, Ann Arbor, MI, USA
William S. NealeDenison Consulting, Ann Arbor, MI, USA
This article presents a test of the relationship between organizational cultureand customer satisfaction using business-unit data from two differentcompanies. The first study examines 32 regional markets of a residentialhome-building company and the second study examines 148 automobiledealerships. The Denison Organizational Culture Survey (DOCS) is used tomeasure organizational culture, while customer satisfaction data were collectedfrom customers themselves by independent third parties. With a few exceptions,the culture measures related significantly to customer satisfaction, explaining
Correspondence should be addressed to Daniel R. Denison, International Institute for
Management Development, Chemin de Bellerive 23, Lausanne, Switzerland 1001.
E-mail: [email protected]
We would like to thank the organizations that participated in this research and IMD—the
International Institute for Management Development in Lausanne, Switzerland—for the
support they provided for this research. An earlier version of this manuscript was presented at
the 17th annual conference of the Society for Industrial and Organizational Psychology,
Toronto, ON, 2002.
sankarr 11/11/07 09:38 PEWO_A_255939 (XML)
EUROPEAN JOURNAL OF WORK AND
ORGANIZATIONAL PSYCHOLOGY
0000, 00 (0), 000 – 000
� 2007 Psychology Press, an imprint of the Taylor & Francis Group, an Informa business
http://www.psypress.com/ejwop DOI: 10.1080/13594320701560820
28% of the variance for the home-building markets and 11 – 28% of thevariance for the auto dealerships.
A number of researchers have shown that a company’s culture has a close linkto its effectiveness (Denison, 1990; Kotter & Heskett, 1992; Ouchi, 1981). Andin today’s competitive business environment, customer satisfaction is anincreasingly important component of an effective organization (Berry &Parasuraman, 1992; Fornell, Mithas, Morgeson, & Krishnan, 2006). None-theless, only a few empirical studies have examined the connection between thecharacteristics of an organization’s work environment and this importantaspect of organizational effectiveness (e.g., Conrad, Brown, & Harmon, 1997).
Most of the studies that have examined this impact have focused on therelationship between service-oriented climates and customer satisfaction(Johnson, 1996; Schneider & Bowen, 1995; Schneider, White, & Paul, 1998).These studies, while making a very important contribution, have tended tofocus on the impact of a ‘‘climate for service’’ or ‘‘service climate’’ oncustomer satisfaction. In doing so, they may run the risk of neglecting moregeneral organizational characteristics that can impact a broader range oforganizational outcomes.
Thus, the current study presents a test of the impact that four broadcharacteristics of organizational culture have on customer satisfaction. Wetest this relationship using samples of business units from two companies indifferent industries. This focus on broad characteristics holds the promisethat efforts to improve customer satisfaction can go hand-in-hand withefforts to improve more general aspects of organizational functioning, anddo not have to come at the expense of innovation, efficiency, or bottom-lineperformance (Benko, 2001; Nunes & Driggs, 2006; Voss & Voss, 2000).
ORGANIZATIONAL CULTURE
The social context in which organizational members operate has been shownto relate to several important outcomes both for employees and theorganization as a whole. Some researchers have investigated whetherparticular dimensions or facets of the social environment relate to the attitudesand behaviour of individual employees (e.g., Pritchard & Karasick, 1973;Schnake, 1983; Schneider & Snyder, 1975; Spector, 1997). Other researchershave related those facets to organizational or group-level outcomes (e.g.,Cameron & Freeman, 1991; Denison, 1984, 1990, 2000; Denison & Mishra,1995; Johnson, 1996; Rogg, Schmidt, Shull, & Schmitt, 2001; Schneider,Bowen, Erhart, & Holcombe, 2000; Schneider et al., 1998). Still otherresearchers have investigated the ‘‘strength’’ or intensity of the environment asit relates to organizational effectiveness (e.g., Calori & Sarnin, 1991; Gordon&DiTomaso, 1992; Kotter & Heskett, 1992; Sorensen, 2002).
2 GILLESPIE ET AL.
For example, our previous research has shown that a firm’s return oninvestment and return on sales can be predicted by the way in which theirwork environment is structured, such that companies with (1) a close linkbetween individual and organizational goals, that can be (2) adapted tochanging conditions, where (3) decisions are made at the appropriatelevel, and (4) goals are clear and reasonable, outperform companies thatdon’t fit this description. Also, companies with a participative culturehave a greater return on assets and nearly twice as high of a return oninvestment than those that do not (Denison, 1984, 1990). Turning ourfocus to individual-level outcomes, participative management alsorelates to employee’s job satisfaction and organizational commitment.Interestingly, job satisfaction is also predicted by an environmentcharacterized by achievement, hierarchy, structure, and extrinsic rewards(Carr, Schmidt, Ford, & DeShon, 2003). Finally, customer satisfaction asan outcome has been predicted by an organization’s service orientation(Schneider et al., 1998) and a general organizational climate con-struct comprised of four factors: cooperation/coordination, customerorientation, employee commitment, and managerial consistency (Rogget al., 2001).
These various studies tend to be classified by the respective researchers as‘‘climate’’ or ‘‘culture’’ studies, representing different but overlappinginterpretations of the same phenomenon. However, the primary distinctionbetween these two labels is often a simple matter of the epistemologicalapproach that the researchers bring to bear on the issue (Ashkanasy,Wilderom, & Peterson, 2000; Denison, 1996). Climate researchers generallymeasure individuals’ perceptions (or a group’s shared perceptions) of theseconstructs using some sort of standard questionnaire with which they cancompare respondents across groups or organizations. Such researchtypically focuses on relatively narrow-bandwidth characteristics of theenvironment as they relate to individual and organizational outcomes of asimilar breadth. While targeting a specific climate ‘‘for something’’(Johnson, 1996; Schneider et al., 2000; Schneider & Reichers, 1983) maybe a useful approach to affect change in a specific area identified bymanagement as in need of improvement (or assessment), it presupposes ahigher-level and broader knowledge of how this specific slice ofthe organizations’ social context fits within the overall objectives of theorganization. This also clearly directs resources and attention to onespecific area of organizational functioning. Assuming organizations andtheir members have a relatively fixed pool of resources to draw from,this means a relative decrease in focus from other systems that are alsovital to the effectiveness of the organization, such as its strategy anddirection, capability to execute efficiently, and employees’ engagement andempowerment.
ORGANIZATIONAL CULTURE AND CUSTOMER SATISFACTION 3
By contrast, scholars and practitioners of organizational culture havetaken a slightly different approach—one that first attempts to understand oruncover the key issues faced by the organization. Historically, investigationof an organizations’ culture has entailed in-depth qualitative methodologieswith sociological or anthropological origins to identify the unique valuesand beliefs that characterize a group or organization (e.g., Deal & Kennedy,1982; Ouchi, 1981; Pettigrew, 1979; Wilkins & Ouchi, 1983). A commontheme of these efforts has been a focus on the ‘‘shared basic assumptionsthat the group learned as it solved its problems of external adaptation andinternal integration’’ (Schein, 1992, p. 12). In general, questionnairespurported to measure organizational culture tend to focus on a broader setof characteristics (e.g., Cameron & Quinn, 1999; Denison & Neale, 2000;Kotter & Heskett, 1992; O’Reilly, Chatman, & Caldwell, 1991) thanquestionnaires purported to measure organizational climate (e.g., Dillard,Wigand, & Boster, 1986; Johnson, 1996; Schneider et al., 1998; Witt &Boerkrem, 1989; Zohar, 2000; cf. Carr et al., 2003; Ostroff, 1993).Comparative organizational culture surveys also tend to focus on the‘‘values-level’’ of culture (Ashkanasy, Broadfoot, & Falkus, 2000; Denison,1996, 2000).
The current study builds on the organizational culture framework ofDenison and colleagues (Denison, 1990; Denison & Mishra, 1995; Fey &Denison, 2003), which was developed using a combination of qualitative andquantitative investigations of organizational culture. We conceptualizeorganizational culture along four dimensions that have shown to relate toorganizational effectiveness: involvement, consistency, adaptability, andmission. The learned responses to the problems of internal integration areobserved by the traits of involvement and consistency. Survival in theexternal environment is characterized by the adaptability and mission traits.These respective traits describe the extent to which a company is customerfocused and strategically oriented.
Taken together, the four traits measure ‘‘[t]he underlying values, beliefs,and principles that serve as a foundation for an organization’s managementsystem as well as the set of management practices and behaviors that bothexemplify and reinforce those basic principles’’ (Denison, 1990, p. 2). Thisorganizational culture model provides a systems approach to impactingorganizational effectiveness (Denison, 2000). By focusing on the system as awhole, companies may be better able to satisfy their customers, but in theprocess also identify areas in need of improvement with respect to theirmission, the interaction among employees, and the systems and structuresthat encourage efficient operations. In addition, a higher, broader, systemsfocus is more useful in understanding longer-term trends, whereas morespecific and lower level measures may be better for understanding short-term impacts (Denison, 1990).
4 GILLESPIE ET AL.
The involvement trait focuses on employees’ commitment and sense ofownership, involvement in decisions that affect them, and team orientation.Effective organizations empower their employees, use teamwork, andcontinuously develop the capacity of their employees (Becker, 1964; Deal &Kennedy, 1982; Denison, 2000; Fey & Denison, 2003; Lawler, 1996; Likert,1961; Peters & Waterman, 1982).
Consistency refers to the existence of organizational systems andprocesses that promote real alignment and efficiency over time. It is thefocus on a common set of management principles, consensus regarding rightand wrong ways to do things, and coordination and integration across theorganization. ‘‘The fundamental concept is that implicit control systems,based on internalized values, are a more effective means of achievingcoordination than external control systems that rely on explicit rules andregulations’’ (Denison, 1990, p. 9). Organizations are more effectivewhen they are consistent and well-integrated (Saffold, 1988). Effectiveorganizations combine involvement and consistency in a continual cyclesuch that ‘‘[i]nvolvement is used to generate potential ideas andsolutions, which are then refined into a more precise set of principles’’(Denison, 1990, p. 11).
Adaptability is the organization’s capacity for internal change in responseto external conditions (Denison & Mishra, 1995). Companies that are highlyinternally focused and integrated can have difficulty adapting to externalmarket demands (Lawrence & Lorsch, 1967); hence it is important to ensurea capacity for creating change, understanding the customer and meetingtheir needs, and continuing to learn as an organization (Fey & Denison,2003; Nadler, 1998).
Finally, mission refers to the degree to which an organization isclear on why it exists and where it is headed. Effective organizationspursue a mission containing economic and noneconomic objectivesthat provide meaning and direction for their employees (Denison &Mishra, 1995). More specifically, these organizations have a clearpurpose and direction, goals and objectives, and a vision for the future(Fey & Denison, 2003; Mintzberg, 1987, 1994). Operationally, each ofthese four traits is comprised of three factors or indexes, as shown inTable 1.
CUSTOMER SATISFACTION
The purpose of this study is to relate the corporate culture modeldescribed above to customer satisfaction. Customer satisfaction is a keycomponent of a successful and prosperous organization. It has been linkedto higher profit margins and greater employee satisfaction, custo-mer retention, and repeat purchases (Appiah-Adu & Singh, 1999;
ORGANIZATIONAL CULTURE AND CUSTOMER SATISFACTION 5
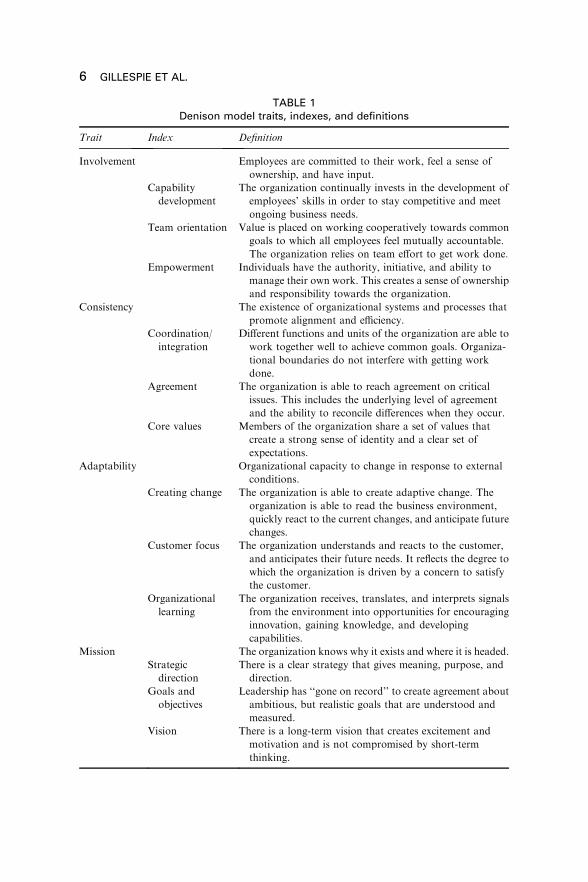
TABLE 1Denison model traits, indexes, and definitions
Trait Index Definition
Involvement Employees are committed to their work, feel a sense of
ownership, and have input.
Capability
development
The organization continually invests in the development of
employees’ skills in order to stay competitive and meet
ongoing business needs.
Team orientation Value is placed on working cooperatively towards common
goals to which all employees feel mutually accountable.
The organization relies on team effort to get work done.
Empowerment Individuals have the authority, initiative, and ability to
manage their own work. This creates a sense of ownership
and responsibility towards the organization.
Consistency The existence of organizational systems and processes that
promote alignment and efficiency.
Coordination/
integration
Different functions and units of the organization are able to
work together well to achieve common goals. Organiza-
tional boundaries do not interfere with getting work
done.
Agreement The organization is able to reach agreement on critical
issues. This includes the underlying level of agreement
and the ability to reconcile differences when they occur.
Core values Members of the organization share a set of values that
create a strong sense of identity and a clear set of
expectations.
Adaptability Organizational capacity to change in response to external
conditions.
Creating change The organization is able to create adaptive change. The
organization is able to read the business environment,
quickly react to the current changes, and anticipate future
changes.
Customer focus The organization understands and reacts to the customer,
and anticipates their future needs. It reflects the degree to
which the organization is driven by a concern to satisfy
the customer.
Organizational
learning
The organization receives, translates, and interprets signals
from the environment into opportunities for encouraging
innovation, gaining knowledge, and developing
capabilities.
Mission The organization knows why it exists and where it is headed.
Strategic
direction
There is a clear strategy that gives meaning, purpose, and
direction.
Goals and
objectives
Leadership has ‘‘gone on record’’ to create agreement about
ambitious, but realistic goals that are understood and
measured.
Vision There is a long-term vision that creates excitement and
motivation and is not compromised by short-term
thinking.
6 GILLESPIE ET AL.
Berry & Parasuraman, 1992; Conrad et al., 1997; Jones & Sasser, 1995;Schneider & Bowen, 1995). Competitors within similar industries with thesame types of technology, pricing strategies, etc., look increasingly tocustomer satisfaction to create a competitive advantage (Koch-Laabs,2001). Organizations must consider customer satisfaction as a key leveragepoint to differentiate themselves from other organizations. In fact,customer loyalty may be a ‘‘strategic mandate’’ in today’s service markets(Ganesh, Arnold, & Reynolds, 2000).
An organization’s social environment—whether it is called ‘‘culture’’ or‘‘climate’’—is an important driver of customer satisfaction. For example,organizational climate has been found to mediate the relationship betweenhuman resource practices and customer satisfaction, supporting a socialcontext model (Ferris et al., 1998) for predicting customer satisfaction (Rogget al., 2001). In another study, Conrad et al. (1997) investigated therelationship between executives’ reports of the cultural ‘‘type’’ of theircompany and how much customer-focused activities they engaged in.Executives who said that their company was best described as a ‘‘clan’’ or an‘‘adhocracy’’ (vs. a ‘‘market’’ or a ‘‘hierarchy’’) reported the most customer-focused activities.
The current study extends existing research in several ways. First, wepresent an empirical test of the relationship between four organizationalculture traits (measured by 12 indexes) and customer satisfaction. Weextend existing research on this relationship by (a) allowing each culturetrait to relate independently to customer satisfaction, and (b) obtainingcustomer satisfaction ratings from customers themselves. Second, whilethese methodological issues have been addressed in some facet-specificclimate research, we supplement the existing literature by providingrelationships between the broader attributes of an effective culture andcustomer satisfaction. Third, we test these relationships across twodifferent companies in two different industries, yielding some informationabout the extent to which these relationships may generalize acrossorganizations. And finally, we extend previous research on Denison’smodel of organizational culture to include a focus on customersatisfaction.
Hypotheses
We hypothesize that each of the four organizational culture traits willrelate to customer satisfaction. The trait of adaptability is related themost obviously to customer satisfaction, as it involves the capacity torespond to changing market demands and even includes ‘‘customerfocus’’ as one of its indexes. Together, adaptability and mission representan external focus, which—via the organization’s mission—include goals
ORGANIZATIONAL CULTURE AND CUSTOMER SATISFACTION 7
and strategies to meet customer demands. Hence, mission should alsorelate to customer satisfaction. In theory, the traits of consistency andinvolvement are more internally focused and at first glance may not seemto relate clearly to customer satisfaction. However, through the focus onbuilding shared values, systems, and an infrastructure (consistency) andmaintaining employee functioning and ownership (involvement),the organization is equipped to serve the needs of customers better inthe long run. Therefore, we also expect that organizations higher on thetraits of consistency and involvement will have greater customersatisfaction.
Hypothesis 1: Business units with higher scores on the trait ofinvolvement will also have more satisfied customers.Hypothesis 2: Business units with higher scores on the trait of consistencywill also have more satisfied customers.Hypothesis 3: Business units with higher scores on the trait of adaptabilitywill also have more satisfied customers.Hypothesis 4: Business units with higher scores on the trait of mission willalso have more satisfied customers.
While we hypothesize that all four organizational culture traits shouldrelate positively to customer satisfaction, certain of these traits may havea stronger, more direct, relationship. For example, adaptability isexplicitly customer focused. Therefore, it seems the most directly relevantto customer satisfaction as an outcome. Further, this study came about inpart because the two focal organizations were specifically interested inimproving customer satisfaction as a central component of their businessstrategy, which makes the mission trait clearly relevant. And mission—like adaptability—is externally focused. Therefore, mission should beconsidered second only to adaptability with respect to its relationshipwith customer satisfaction. As internally focused characteristics oforganizational culture, involvement, and consistency should demonstratea relatively weaker relationship with customer satisfaction. However, ofthe two, involvement—by way of empowering employees—shouldfacilitate the capacity to satisfy customers. By contrast, consistency tendsto oppose adaptability, the most customer focused of the four traits. Insum, the relationship between culture traits and customer satisfaction ishypothesized to show the following trend from strongest to weakest:adaptability, mission, involvement, and consistency.
Hypothesis 5: The four cultural traits will relate to customer satisfactionto varying degrees. The hypothesized order from strongest to weakest is:adaptability, mission, involvement, and consistency.
8 GILLESPIE ET AL.
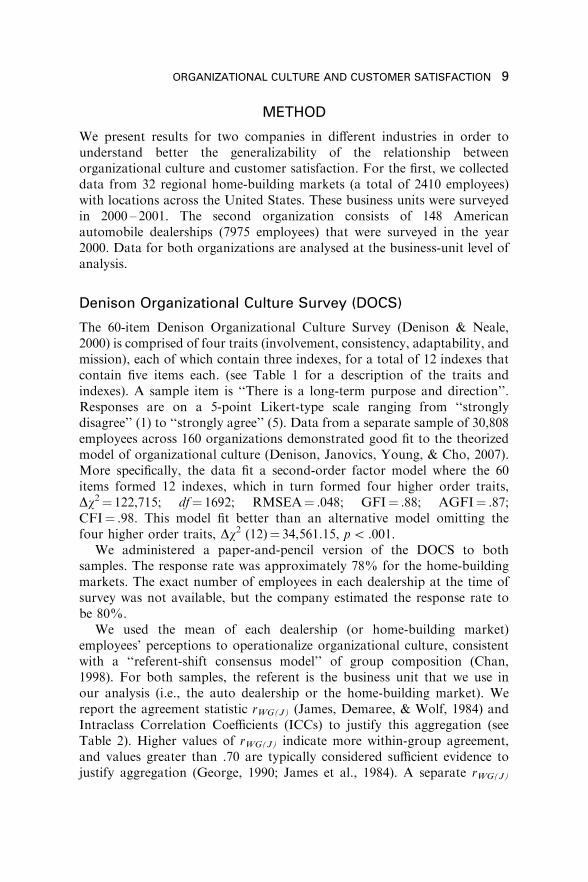
METHOD
We present results for two companies in different industries in order tounderstand better the generalizability of the relationship betweenorganizational culture and customer satisfaction. For the first, we collecteddata from 32 regional home-building markets (a total of 2410 employees)with locations across the United States. These business units were surveyedin 2000 – 2001. The second organization consists of 148 Americanautomobile dealerships (7975 employees) that were surveyed in the year2000. Data for both organizations are analysed at the business-unit level ofanalysis.
Denison Organizational Culture Survey (DOCS)
The 60-item Denison Organizational Culture Survey (Denison & Neale,2000) is comprised of four traits (involvement, consistency, adaptability, andmission), each of which contain three indexes, for a total of 12 indexes thatcontain five items each. (see Table 1 for a description of the traits andindexes). A sample item is ‘‘There is a long-term purpose and direction’’.Responses are on a 5-point Likert-type scale ranging from ‘‘stronglydisagree’’ (1) to ‘‘strongly agree’’ (5). Data from a separate sample of 30,808employees across 160 organizations demonstrated good fit to the theorizedmodel of organizational culture (Denison, Janovics, Young, & Cho, 2007).More specifically, the data fit a second-order factor model where the 60items formed 12 indexes, which in turn formed four higher order traits,Dw2¼ 122,715; df¼ 1692; RMSEA¼ .048; GFI¼ .88; AGFI¼ .87;CFI¼ .98. This model fit better than an alternative model omitting thefour higher order traits, Dw2 (12)¼ 34,561.15, p5 .001.
We administered a paper-and-pencil version of the DOCS to bothsamples. The response rate was approximately 78% for the home-buildingmarkets. The exact number of employees in each dealership at the time ofsurvey was not available, but the company estimated the response rate tobe 80%.
We used the mean of each dealership (or home-building market)employees’ perceptions to operationalize organizational culture, consistentwith a ‘‘referent-shift consensus model’’ of group composition (Chan,1998). For both samples, the referent is the business unit that we use inour analysis (i.e., the auto dealership or the home-building market). Wereport the agreement statistic rWG(J) (James, Demaree, & Wolf, 1984) andIntraclass Correlation Coefficients (ICCs) to justify this aggregation (seeTable 2). Higher values of rWG(J) indicate more within-group agreement,and values greater than .70 are typically considered sufficient evidence tojustify aggregation (George, 1990; James et al., 1984). A separate rWG(J)
ORGANIZATIONAL CULTURE AND CUSTOMER SATISFACTION 9
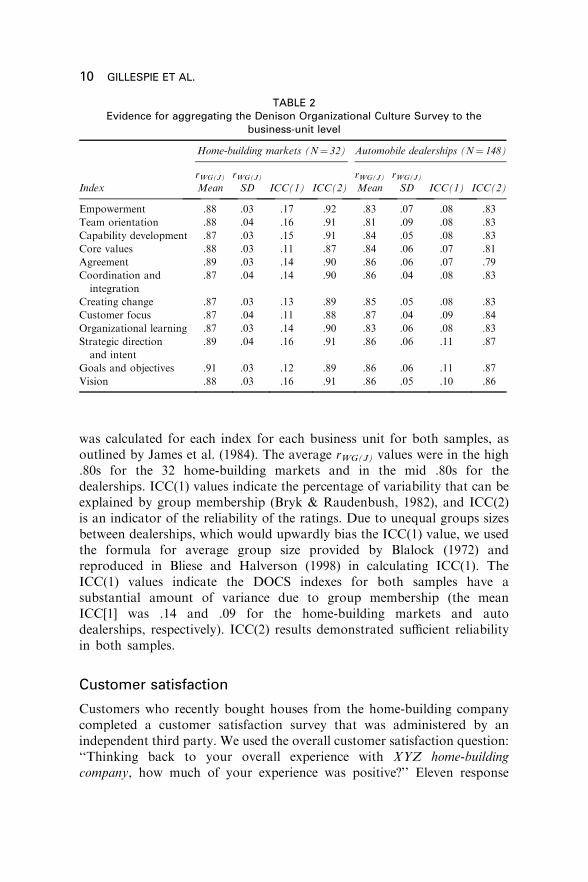
was calculated for each index for each business unit for both samples, asoutlined by James et al. (1984). The average rWG(J) values were in the high.80s for the 32 home-building markets and in the mid .80s for thedealerships. ICC(1) values indicate the percentage of variability that can beexplained by group membership (Bryk & Raudenbush, 1982), and ICC(2)is an indicator of the reliability of the ratings. Due to unequal groups sizesbetween dealerships, which would upwardly bias the ICC(1) value, we usedthe formula for average group size provided by Blalock (1972) andreproduced in Bliese and Halverson (1998) in calculating ICC(1). TheICC(1) values indicate the DOCS indexes for both samples have asubstantial amount of variance due to group membership (the meanICC[1] was .14 and .09 for the home-building markets and autodealerships, respectively). ICC(2) results demonstrated sufficient reliabilityin both samples.
Customer satisfaction
Customers who recently bought houses from the home-building companycompleted a customer satisfaction survey that was administered by anindependent third party. We used the overall customer satisfaction question:‘‘Thinking back to your overall experience with XYZ home-buildingcompany, how much of your experience was positive?’’ Eleven response
TABLE 2Evidence for aggregating the Denison Organizational Culture Survey to the
business-unit level
Home-building markets (N¼ 32) Automobile dealerships (N¼ 148)
Index
rWG(J)
Mean
rWG(J)
SD ICC(1) ICC(2)
rWG(J)
Mean
rWG(J)
SD ICC(1) ICC(2)
Empowerment .88 .03 .17 .92 .83 .07 .08 .83
Team orientation .88 .04 .16 .91 .81 .09 .08 .83
Capability development .87 .03 .15 .91 .84 .05 .08 .83
Core values .88 .03 .11 .87 .84 .06 .07 .81
Agreement .89 .03 .14 .90 .86 .06 .07 .79
Coordination and
integration
.87 .04 .14 .90 .86 .04 .08 .83
Creating change .87 .03 .13 .89 .85 .05 .08 .83
Customer focus .87 .04 .11 .88 .87 .04 .09 .84
Organizational learning .87 .03 .14 .90 .83 .06 .08 .83
Strategic direction
and intent
.89 .04 .16 .91 .86 .06 .11 .87
Goals and objectives .91 .03 .12 .89 .86 .06 .11 .87
Vision .88 .03 .16 .91 .86 .05 .10 .86
10 GILLESPIE ET AL.
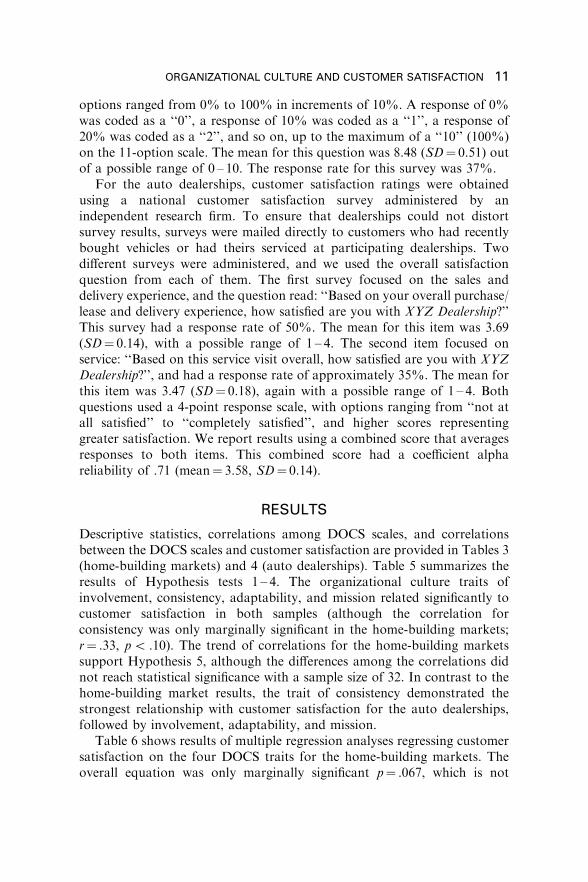
options ranged from 0% to 100% in increments of 10%. A response of 0%was coded as a ‘‘0’’, a response of 10% was coded as a ‘‘1’’, a response of20% was coded as a ‘‘2’’, and so on, up to the maximum of a ‘‘10’’ (100%)on the 11-option scale. The mean for this question was 8.48 (SD¼ 0.51) outof a possible range of 0 – 10. The response rate for this survey was 37%.
For the auto dealerships, customer satisfaction ratings were obtainedusing a national customer satisfaction survey administered by anindependent research firm. To ensure that dealerships could not distortsurvey results, surveys were mailed directly to customers who had recentlybought vehicles or had theirs serviced at participating dealerships. Twodifferent surveys were administered, and we used the overall satisfactionquestion from each of them. The first survey focused on the sales anddelivery experience, and the question read: ‘‘Based on your overall purchase/lease and delivery experience, how satisfied are you with XYZ Dealership?’’This survey had a response rate of 50%. The mean for this item was 3.69(SD¼ 0.14), with a possible range of 1 – 4. The second item focused onservice: ‘‘Based on this service visit overall, how satisfied are you with XYZDealership?’’, and had a response rate of approximately 35%. The mean forthis item was 3.47 (SD¼ 0.18), again with a possible range of 1 – 4. Bothquestions used a 4-point response scale, with options ranging from ‘‘not atall satisfied’’ to ‘‘completely satisfied’’, and higher scores representinggreater satisfaction. We report results using a combined score that averagesresponses to both items. This combined score had a coefficient alphareliability of .71 (mean¼ 3.58, SD¼ 0.14).
RESULTS
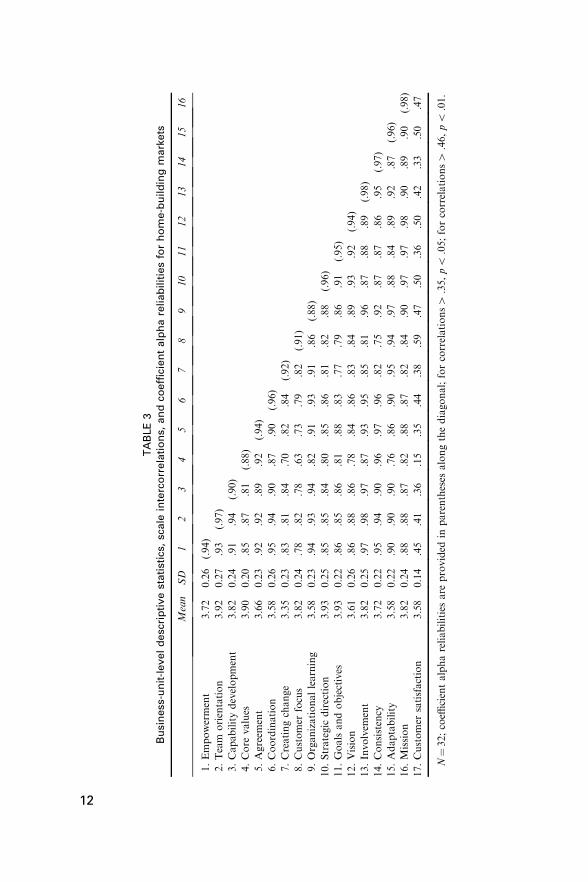
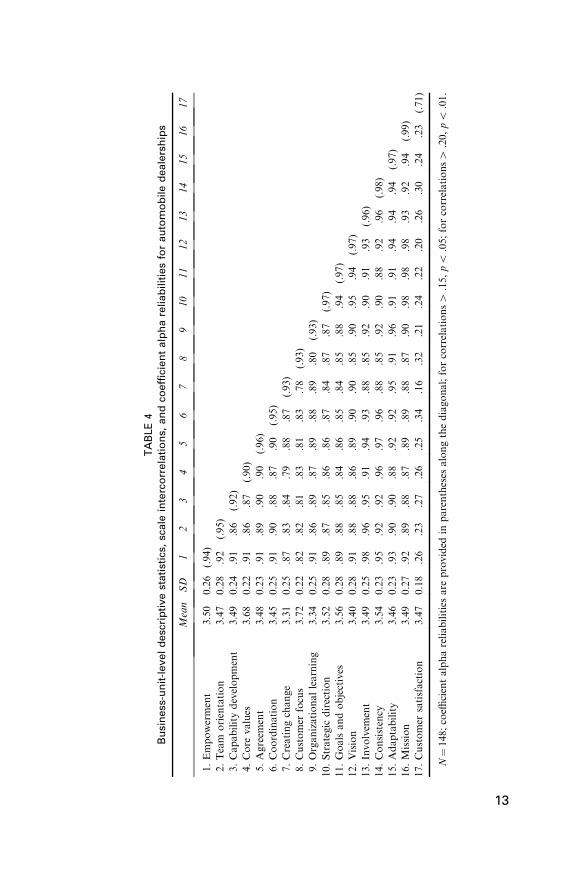
Descriptive statistics, correlations among DOCS scales, and correlationsbetween the DOCS scales and customer satisfaction are provided in Tables 3(home-building markets) and 4 (auto dealerships). Table 5 summarizes theresults of Hypothesis tests 1 – 4. The organizational culture traits ofinvolvement, consistency, adaptability, and mission related significantly tocustomer satisfaction in both samples (although the correlation forconsistency was only marginally significant in the home-building markets;r¼ .33, p5 .10). The trend of correlations for the home-building marketssupport Hypothesis 5, although the differences among the correlations didnot reach statistical significance with a sample size of 32. In contrast to thehome-building market results, the trait of consistency demonstrated thestrongest relationship with customer satisfaction for the auto dealerships,followed by involvement, adaptability, and mission.
Table 6 shows results of multiple regression analyses regressing customersatisfaction on the four DOCS traits for the home-building markets. Theoverall equation was only marginally significant p¼ .067, which is not
ORGANIZATIONAL CULTURE AND CUSTOMER SATISFACTION 11
TA
BL
E3
Bu
sin
ess
-un
it-l
ev
el
de
scri
pti
ve
sta
tist
ics,
sca
lein
terc
orr
ela
tio
ns,
an
dco
eff
icie
nt
alp
ha
relia
bilit
ies
for
ho
me
-bu
ild
ing
ma
rke
ts
Mean
SD
12
34
56
78
910
11
12
13
14
15
16
1.Empowerment
3.72
0.26
(.94)
2.Team
orientation
3.92
0.27
.93
(.97)
3.Capabilitydevelopment
3.82
0.24
.91
.94
(.90)
4.Core
values
3.90
0.20
.85
.87
.81
(.88)
5.Agreem
ent
3.66
0.23
.92
.92
.89
.92
(.94)
6.Coordination
3.58
0.26
.95
.94
.90
.87
.90
(.96)
7.Creatingchange
3.35
0.23
.83
.81
.84
.70
.82
.84
(.92)
8.Customer
focus
3.82
0.24
.78
.82
.78
.63
.73
.79
.82
(.91)
9.Organizationallearning
3.58
0.23
.94
.93
.94
.82
.91
.93
.91
.86
(.88)
10.Strategic
direction
3.93
0.25
.85
.85
.84
.80
.85
.86
.81
.82
.88
(.96)
11.Goalsandobjectives
3.93
0.22
.86
.85
.86
.81
.88
.83
.77
.79
.86
.91
(.95)
12.Vision
3.61
0.26
.86
.88
.86
.78
.84
.86
.83
.84
.89
.93
.92
(.94)
13.Involvem
ent
3.82
0.25
.97
.98
.97
.87
.93
.95
.85
.81
.96
.87
.88
.89
(.98)
14.Consistency
3.72
0.22
.95
.94
.90
.96
.97
.96
.82
.75
.92
.87
.87
.86
.95
(.97)
15.Adaptability
3.58
0.22
.90
.90
.90
.76
.86
.90
.95
.94
.97
.88
.84
.89
.92
.87
(.96)
16.Mission
3.82
0.24
.88
.88
.87
.82
.88
.87
.82
.84
.90
.97
.97
.98
.90
.89
.90
(.98)
17.Customer
satisfaction
3.58
0.14
.45
.41
.36
.15
.35
.44
.38
.59
.47
.50
.36
.50
.42
.33
.50
.47
N¼32;coeffi
cientalphareliabilitiesare
provided
inparentheses
alongthediagonal;forcorrelations4
.35,p5
.05;forcorrelations4
.46,p5
.01.
12
TA
BL
E4
Bu
sin
ess
-un
it-l
ev
el
de
scri
pti
ve
sta
tist
ics,
sca
lein
terc
orr
ela
tio
ns,
an
dco
eff
icie
nt
alp
ha
relia
bilit
ies
for
au
tom
ob
ile
de
ale
rsh
ips
Mean
SD
12
34
56
78
910
11
12
13
14
15
16
17
1.Empowerment
3.50
0.26
(.94)
2.Team
orientation
3.47
0.28
.92
(.95)
3.Capabilitydevelopment
3.49
0.24
.91
.86
(.92)
4.Core
values
3.68
0.22
.91
.86
.87
(.90)
5.Agreem
ent
3.48
0.23
.91
.89
.90
.90
(.96)
6.Coordination
3.45
0.25
.91
.90
.88
.87
.90
(.95)
7.Creatingchange
3.31
0.25
.87
.83
.84
.79
.88
.87
(.93)
8.Customer
focus
3.72
0.22
.82
.82
.81
.83
.81
.83
.78
(.93)
9.Organizationallearning
3.34
0.25
.91
.86
.89
.87
.89
.88
.89
.80
(.93)
10.Strategic
direction
3.52
0.28
.89
.87
.85
.86
.86
.87
.84
.87
.87
(.97)
11.Goalsandobjectives
3.56
0.28
.89
.88
.85
.84
.86
.85
.84
.85
.88
.94
(.97)
12.Vision
3.40
0.28
.91
.88
.88
.86
.89
.90
.90
.85
.90
.95
.94
(.97)
13.Involvem
ent
3.49
0.25
.98
.96
.95
.91
.94
.93
.88
.85
.92
.90
.91
.93
(.96)
14.Consistency
3.54
0.23
.95
.92
.92
.96
.97
.96
.88
.85
.92
.90
.88
.92
.96
(.98)
15.Adaptability
3.46
0.23
.93
.90
.90
.88
.92
.92
.95
.91
.96
.91
.91
.94
.94
.94
(.97)
16.Mission
3.49
0.27
.92
.89
.88
.87
.89
.89
.88
.87
.90
.98
.98
.98
.93
.92
.94
(.99)
17.Customer
satisfaction
3.47
0.18
.26
.23
.27
.26
.25
.34
.16
.32
.21
.24
.22
.20
.26
.30
.24
.23
(.71)
N¼148;coeffi
cientalphareliabilitiesare
provided
inparentheses
alongthediagonal;forcorrelations4
.15,p5
.05;forcorrelations4
.20,p5
.01.
13
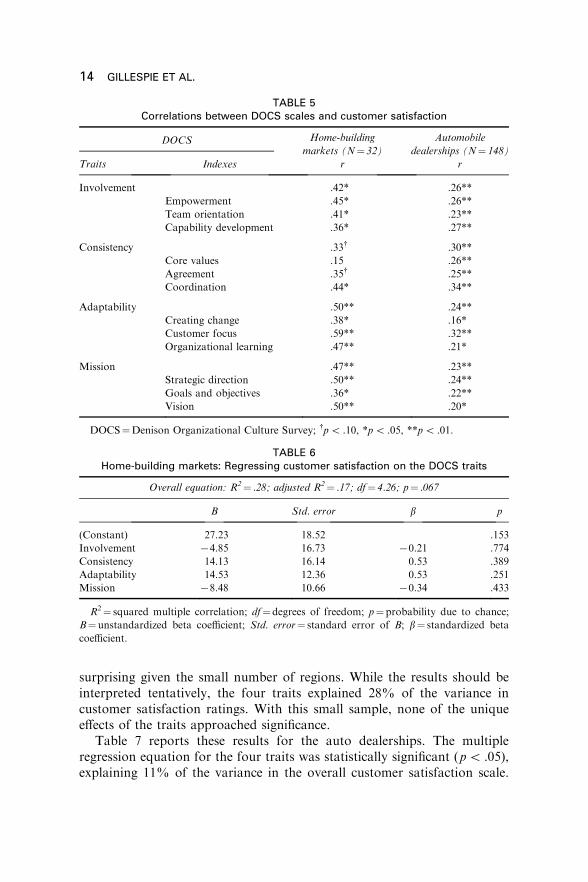
surprising given the small number of regions. While the results should beinterpreted tentatively, the four traits explained 28% of the variance incustomer satisfaction ratings. With this small sample, none of the uniqueeffects of the traits approached significance.
Table 7 reports these results for the auto dealerships. The multipleregression equation for the four traits was statistically significant (p5 .05),explaining 11% of the variance in the overall customer satisfaction scale.
TABLE 5Correlations between DOCS scales and customer satisfaction
DOCS Home-building
markets (N¼ 32)
Automobile
dealerships (N¼ 148)
Traits Indexes r r
Involvement .42* .26**
Empowerment .45* .26**
Team orientation .41* .23**
Capability development .36* .27**
Consistency .33{ .30**
Core values .15 .26**
Agreement .35{ .25**
Coordination .44* .34**
Adaptability .50** .24**
Creating change .38* .16*
Customer focus .59** .32**
Organizational learning .47** .21*
Mission .47** .23**
Strategic direction .50** .24**
Goals and objectives .36* .22**
Vision .50** .20*
DOCS¼Denison Organizational Culture Survey; {p5 .10, *p5 .05, **p5 .01.
TABLE 6Home-building markets: Regressing customer satisfaction on the DOCS traits
Overall equation: R2¼ .28; adjusted R2¼ .17; df¼ 4.26; p¼ .067
B Std. error b p
(Constant) 27.23 18.52 .153
Involvement 74.85 16.73 70.21 .774
Consistency 14.13 16.14 0.53 .389
Adaptability 14.53 12.36 0.53 .251
Mission 78.48 10.66 70.34 .433
R2¼ squared multiple correlation; df¼degrees of freedom; p¼probability due to chance;
B¼unstandardized beta coefficient; Std. error¼ standard error of B; b¼ standardized beta
coefficient.
14 GILLESPIE ET AL.
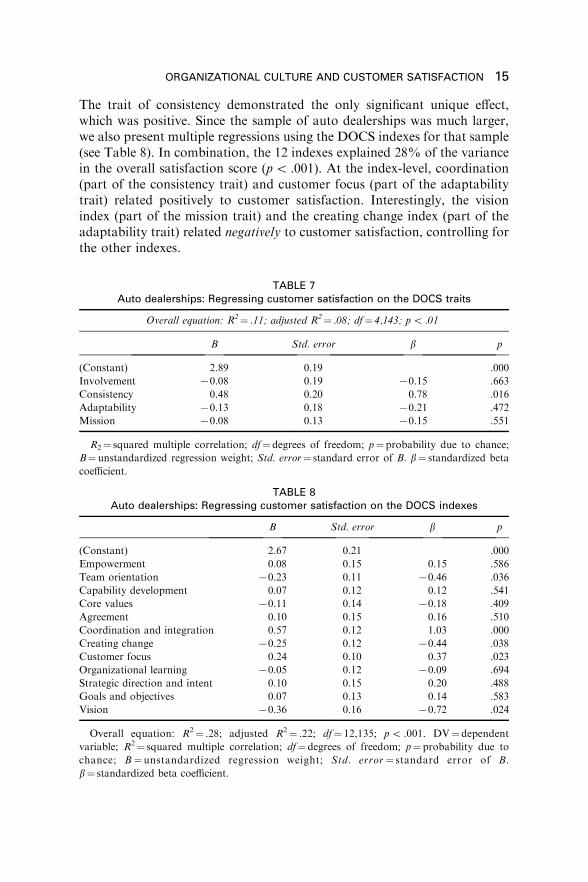
The trait of consistency demonstrated the only significant unique effect,which was positive. Since the sample of auto dealerships was much larger,we also present multiple regressions using the DOCS indexes for that sample(see Table 8). In combination, the 12 indexes explained 28% of the variancein the overall satisfaction score (p5 .001). At the index-level, coordination(part of the consistency trait) and customer focus (part of the adaptabilitytrait) related positively to customer satisfaction. Interestingly, the visionindex (part of the mission trait) and the creating change index (part of theadaptability trait) related negatively to customer satisfaction, controlling forthe other indexes.
TABLE 7Auto dealerships: Regressing customer satisfaction on the DOCS traits
Overall equation: R2¼ .11; adjusted R2¼ .08; df¼ 4,143; p5 .01
B Std. error b p
(Constant) 2.89 0.19 .000
Involvement 70.08 0.19 70.15 .663
Consistency 0.48 0.20 0.78 .016
Adaptability 70.13 0.18 70.21 .472
Mission 70.08 0.13 70.15 .551
R2¼ squared multiple correlation; df¼degrees of freedom; p¼probability due to chance;
B¼unstandardized regression weight; Std. error¼ standard error of B. b¼ standardized beta
coefficient.
TABLE 8Auto dealerships: Regressing customer satisfaction on the DOCS indexes
B Std. error b p
(Constant) 2.67 0.21 .000
Empowerment 0.08 0.15 0.15 .586
Team orientation 70.23 0.11 70.46 .036
Capability development 0.07 0.12 0.12 .541
Core values 70.11 0.14 70.18 .409
Agreement 0.10 0.15 0.16 .510
Coordination and integration 0.57 0.12 1.03 .000
Creating change 70.25 0.12 70.44 .038
Customer focus 0.24 0.10 0.37 .023
Organizational learning 70.05 0.12 70.09 .694
Strategic direction and intent 0.10 0.15 0.20 .488
Goals and objectives 0.07 0.13 0.14 .583
Vision 70.36 0.16 70.72 .024
Overall equation: R2¼ .28; adjusted R2¼ .22; df¼ 12,135; p5 .001. DV¼dependent
variable; R2¼ squared multiple correlation; df¼degrees of freedom; p¼probability due to
chance; B¼unstandardized regression weight; Std. error¼ standard error of B.
b¼ standardized beta coefficient.
ORGANIZATIONAL CULTURE AND CUSTOMER SATISFACTION 15
DISCUSSION
This study found that organizational culture relates significantly andpositively to customer satisfaction. Nonetheless, the interpretation of thisrelationship differs somewhat between the correlation and regression results.We discuss both sets of analyses next, beginning with the bivariatecorrelations and following with the multiple regression results that showthe unique effects of each trait or index.
With the organizational culture ratings from the companies’ employeesand customer satisfaction ratings from the customers themselves, thecorrelational findings were replicated across two companies from differentindustries, providing some support for Hypotheses 1 – 4. The observedrelationships were stronger for the home-building markets than the autodealerships. While differences among correlations within and betweensamples were not statistically significant, the pattern of results for the home-building markets was in the hypothesized order (strongest to weakest:adaptability, mission, involvement, consistency), providing tentative sup-port for Hypothesis 5 within this sample. Conversely, for the autodealerships, involvement and consistency appeared to be more importantthan adaptability and mission.
These findings suggest that the culture of an organization relatessubstantially to the satisfaction of its customers. By extension, diagnosingand changing an organization’s culture may thus be a viable way to improvecustomer satisfaction. More specifically, this type of comparative analysis oforganizational culture and related change efforts can be expected to relate tocustomer satisfaction across a range of companies, industries, and consumermarkets. While these data are encouraging, it is also important to considerthe results from the multiple regression analyses.
The overall multiple regression equation for the home-building companywas only marginally significant and—with a sample size of 32—none of thetraits provided statistically significant unique effects. For the auto dealer-ships, the trait of consistency demonstrated the only unique effect oncustomer satisfaction. In other words, it is the extent to which consistency isemphasized in excess of the other indexes that relates positively to customersatisfaction.
For the auto dealerships, the index-level regression analyses provide amore detailed follow-up on the results we found at the trait level. The resultsshowed that the unique contribution of coordination—one of the indexes ofconsistency—was positively related to customer satisfaction. Therefore, weconclude that it is coordination in particular that carries the unique effect oncustomer satisfaction. That is, while higher scores on all of the organiza-tional culture indexes are associated with greater customer satisfaction, it isimportant beyond this that employees are able to coordinate well to achieve
16 GILLESPIE ET AL.
common goals. Similarly, the degree to which customer focus wasemphasized in excess of the other indexes was also related positively tocustomer satisfaction, which makes intuitive sense.
While the customer focus finding is not surprising and is consistent withexisting research on the relationship between service climate and customersatisfaction (Johnson, 1996; Schneider & Bowen, 1995; Schneider et al.,1998), our findings with respect to the consistency trait and the coordinationindex appear to make a unique contribution to the literature. In fact, wehypothesized that consistency would be the least-relevant trait, partly basedon our own theory and partly based on the existing literature onorganizational culture and climate. This finding appears to indicate thatthe ability to coordinate service delivery in a consistent way is a criticallyimportant aspect of customer satisfaction in auto dealerships.
This study also generated several seemingly counterintuitive findings. Forexample, an overemphasis on vision related negatively to customersatisfaction. The vision index taps a long-term versus short-term point ofview. We speculate that while long-term vision may be important forsustained effectiveness, customers’ satisfaction with the immediate salesexperience is negatively affected when the dominant approach over-emphasizes a long-term perspective. A second counterintuitive findingshowed that team orientation was negatively related to satisfaction withservice, after accounting for the other indexes. It may be that customersappreciate having one point-person who is responsible for their service,rather than having a team where they are uncertain who is ultimatelyaccountable to them. It may also be that employees who feel they are part ofa service team in fact do not feel the same sense of accountability that lessteam-oriented service environments have. In addition, the creating changeindex also showed a significant and negative unique relationship withcustomer satisfaction. This is again supportive of the idea that consistencyand coordination (vs. change) leads to satisfied auto dealership customers.Taken together, these findings suggest that satisfying customers requires notonly promises and commitments that address a customer’s wants and needs,but that it also requires delivering on those promises. The combination ofcustomer focus and coordination is a powerful one, implying that both thefront end and the back end of the supply chain must operate well in order tosatisfy the customer. Unfortunately, we don’t have the data to test thesemore specific interpretations.
This study has some limitations that should be considered wheninterpreting these results. First, the correlations between the organizationalculture traits and customer satisfaction are fairly similar across the traits.The culture indexes and traits also have a large degree of intercorrelation,suggesting that—in general—respondents tend to perceive the business unitsas effective overall or not effective overall. This makes it important to
ORGANIZATIONAL CULTURE AND CUSTOMER SATISFACTION 17
consider the bivariate correlations in combination with results from themultiple regression analyses that test the net impact of each trait (or index)on customer satisfaction, controlling for the sizeable overlap it has with theremaining traits (or indexes).
Second, a qualitative follow-up would clearly strengthen the conclusionswe can draw from our quantitative results. This ‘‘depth of analysis’’ is anecessary aspect of the cultural diagnostics and organizational changeprocess (Denison, 2000). In addition to providing a comparative frameworkfor organizational culture research and practice, the DOCS providesorganizational members and consultants with a starting point for identifyingthe more deeply held beliefs and assumptions that become targets for changein order for the organization to become more effective. It is the mutualinvestment in this total process that truly supports our framework as amodel of organizational culture.
Third, research on this topic would benefit from a longitudinal orexperimental investigation, particularly one that focuses on the change inculture and in effectiveness. Clearly, we cannot claim based on these resultsthat culture causes customer satisfaction—we merely report an associationbetween the two. And finally, we were also unable to obtain data on thelocal economic conditions of the organizations and business units underinvestigation. While we have no reason to believe the inclusion of such datawould change the results substantively, it is nevertheless an alternativeexplanation of our results that remains to be ruled out.
Finally, it would be interesting to see future research on customersatisfaction that also includes a broad range of effectiveness criteria in thesame sample. This, combined with a longitudinal design or a fieldexperiment, would greatly increase our capacity to draw conclusions abouthow an organizations’ culture can be changed or harnessed toimprove organizational effectiveness generally and customer satisfactionspecifically.
In sum, we conclude that a relatively broad conception of the workenvironment can relate to rather specific outcomes such as customersatisfaction. This is particularly important considering that one of thelargest drivers of this relationship for the auto dealerships, consistency,seems to be a cultural attribute that would not have been measured with anarrow-bandwidth measure of the environment that specifically targetsservice climate. At the same time, consistency was the least relevant trait forthe home-building markets, indicating that the relative magnitude of eachtrait’s importance may vary across companies or industries. Our findings,taken together with existing research (Denison, 1984, 1990, 2000; Denison &Mishra, 1995; Kotter & Heskett, 1992), suggest that organizational culturecan be a key lever for driving long-term organizational effectiveness, andthat big-picture culture change efforts may manifest not only in outcomes
18 GILLESPIE ET AL.
such as return on investment, assets, or sales, but also in customersatisfaction.
REFERENCES
Appiah-Adu, K., & Singh, S. (1999). Marketing culture and performance in UK service firms.
Service Industries Journal, 19, 152 – 170.
Ashkanasy, N. M., Broadfoot, L. E., & Falkus, S. (2000). Questionnaire measures of
organizational culture. In N. M. Ashkanasy, C. P. M. Wilderom, & M. F. Peterson (Eds.),
Handbook of organizational culture and climate (pp. 131 – 147). Thousand Oaks, CA: Sage.
Ashkanasy, N. M., Wilderom, C. P. M., & Peterson, M. F. (2000). Introduction.
In N. M. Ashkanasy, C. P. M. Wilderom, & M. F. Peterson (Eds.), Handbook of
organizational culture and climate (pp. 1 – 18). Thousand Oaks, CA: Sage.
Becker, G. (1964). Human capital: A theoretical and empirical analysis with special reference to
education. New York: Columbia University Press.
Benko, L. B. (2001). Getting the royal treatment. Modern Healthcare, 39, 28 – 32.
Berry, L. L., & Parasuraman, A. (1992). Prescriptions for a service quality revolution in
America. Organizational Dynamics, 20, 5 – 15.
Blalock, H. M., Jr. (1972). Social statistics (2nd ed.). New York: McGraw-Hill.
Bliese, P. D., & Halverson, R. R. (1998). Group size and measures of group-level properties: An
examination of eta-squared and ICC values. Journal of Management, 24, 157 – 172.
Bryk, A. S., & Raudenbush, S. W. (1992). Hierarchical linear models. Thousand Oaks, CA:
Sage.
Calori, R., & Sarnin, P. (1991). Corporate culture and economic performance: A French study.
Organization Studies, 12, 49 – 74.
Cameron, K. S., & Freeman, S. J. (1991). Cultural congruence, strength, and type: Relationships
to effectiveness. Research in Organizational Change and Development, 5, 23 – 58.
Cameron, K. S., & Quinn, R. E. (1999). Diagnosing and changing organizational culture: Based
on the competing values framework. Reading, MA: Addison-Wesley.
Carr, J. Z., Schmidt, A. M., Ford, J. K., & DeShon, R. P. (2003). Climate perceptions matter: A
meta-analytic path analysis relating molar climate, cognitive and affective states, and
individual level work outcomes. Journal of Applied Psychology, 88, 605 – 619.
Chan, D. (1998). Functional relations among constructs in the same content domain at different
levels of analysis: A typology of composition models. Journal of Applied Psychology, 83,
234 – 246.
Conrad, C. A., Brown, G., & Harmon, H. A. (1997). Customer satisfaction and corporate
culture: A profile deviation analysis of a relationship marketing outcome. Psychology and
Marketing, 14, 663 – 674.
Deal, T. E., & Kennedy, A. A. (1982). Corporate cultures. Reading, MA: Addison-Wesley.
Denison, D. R. (1984). Bringing corporate culture to the bottom line. Organizational Dynamics,
13, 4 – 22.
Denison, D. R. (1990). Corporate culture and organizational effectiveness. New York: Wiley.
Denison, D. R. (1996). What IS the difference between organizational culture and
organizational climate? A native’s point of view on a decade of paradigm wars. Academy
of Management Review, 21, 619 – 654.
Denison, D. R. (2000). Organizational culture: Can it be a key lever for driving organizational
change? In C. L. Cooper, S. Cartwright, & P. C. Earley (Eds.), The international handbook of
organizational culture and climate (pp. 347 – 372). Chichester: John Wiley & Sons.
ORGANIZATIONAL CULTURE AND CUSTOMER SATISFACTION 19
Denison, D. R., Janovics, J., Young, J., & Cho, H. J. (2007). Diagnosing organizational cultures:
Validating a model and method. Manuscript submitted for publication.
Denison, D. R., & Mishra, A. K. (1995). Toward a theory of organizational culture and
effectiveness. Organizational Science, 6, 204 – 223.
Denison, D. R., & Neale, W. (2000). Denison Organizational Culture Survey. Ann Arbor, MI:
Denison Consulting.
Dillard, J. P., Wigand, R. T., & Boster, F. J. (1986). Communication climate and its role in
organizations. Communications, 12, 83 – 101.
Ferris, G. R., Arthur, M. M., Berkson, H. M., Kaplan, D. M., Harrell-Cook, G., & Frink, D. D.
(1998). Toward a social context theory of the human resource management – organizational
effectiveness relationship. Human Resource Management Review, 8, 235 – 264.
Fey, C. F., & Denison, D. R. (2003). Organizational culture and effectiveness: Can American
theory be applied in Russia? Organizational Science, 14, 686 – 706.
Fornell, C., Mithas, S., Morgeson, F. V., & Krishnan, M. S. (2006). Customer satisfaction and
stock prices: High returns, low risk. Journal of Marketing, 70, 3 – 14.
Ganesh, J., Arnold, M. J., & Reynolds, K. E. (2000). Understanding the customer base of
service providers: An examination of the difference between switchers and stayers. Journal of
Marketing, 64, 65 – 87.
George, J. M. (1990). Personality, affect, and behavior in groups. Journal of Applied Psychology,
75, 107 – 116.
Gordon, G., & DiTomaso, N. (1992). Predicting corporate performance from organizational
culture. Journal of Management Studies, 29, 783 – 798.
James, L. R., Demaree, R. G., & Wolf, G. (1984). Estimating within-group interrater reliability
with and without response bias. Journal of Applied Psychology, 69, 85 – 98.
Johnson, J. W. (1996). Linking employee perceptions of service climate to customer satisfaction.
Personnel Psychology, 49, 831 – 851.
Jones, T. O., & Sasser, W. E., Jr. (1995). Why satisfied customers defect. Harvard Business
Review, 73, 88 – 99.
Koch-Laabs, J. (2001). Serving up a new level of customer service at Quebecor. Workforce, 80,
40 – 41.
Kotter, J., & Heskett, J. (1992). Corporate culture and performance. New York: Free Press.
Lawler, E. E., III. (1996). From the ground up: Six principles for building the new logic
corporation. San Francisco: Jossey-Bass.
Lawrence, P., & Lorsch, J. (1967). Differentiation and integration in complex organizations.
Administrative Science Quarterly, 12, 1 – 30.
Likert, R. (1961). New patterns of management. New York: McGraw-Hill.
Mintzberg, H. (1987). Crafting strategy. Harvard Business Review, 65, 66 – 75.
Mintzberg, H. (1994). The rise and fall of strategic planning: Reconciling for planning, plans,
planners. New York: Free Press.
Nadler, D. (1998). Champions of change: How CEOs and their companies are mastering the skills
of radical change. San Francisco: Jossey-Bass.
Nunes, P. F., & Driggs, W. W. (2006). What serves the customer best?Harvard Business Review,
84, 37 – 50.
O’Reilly, C., Chatman, J., & Caldwell, D. (1991). People and organizational culture: A profile
comparison approach to assessing person – environment fit. Academy of Management
Journal, 34, 487 – 516.
Ostroff, C. (1993). The effects of climate and personal influences on individual behavior and
attitudes in organizations. Organizational Behavior and Human Decision Processes, 56,
56 – 90.
Ouchi, W. G. (1981). Theory Z: How American business can meet the Japanese challenge.
New York: Avon Books.
20 GILLESPIE ET AL.
Peters, T. J., & Waterman, R. H. (1982). In search of excellence: Lessons from America’s best-run
companies. New York: Harper & Row.
Pettigrew, A. (1979). On studying organizational cultures. Administrative Science Quarterly, 24,
570 – 581.
Pritchard, R. D., & Karasick, B. W. (1973). The effects of organizational climate on managerial
job performance and job satisfaction. Organizational Behavior and Human Decision
Processes, 9, 126 – 146.
Rogg, K. L., Schmidt, D. B., Shull, C., & Schmitt, N. (2001). Human resource practices,
organizational climate, and customer satisfaction. Journal of Management, 27, 431 – 449.
Saffold, G. (1988). Culture traits, strength, and organizational performance: Moving beyond
‘‘strong’’ culture. Academy of Management Review, 13, 546 – 558.
Schein, E. H. (1992). Organizational culture and leadership (2nd ed.). San Francisco: Jossey-
Bass.
Schnake, M. E. (1983). An empirical assessment of the effects of affective response in the
measurement of organizational climate. Personnel Psychology, 36, 791 – 807.
Schneider, B., & Bowen, D. (1995). (Eds.). Winning the service game. Boston: Harvard Business
School Press.
Schneider, B., Bowen, D., Erhart, M. E., & Holcombe, K. M. (2000). The climate for service:
Evolution of a construct. In N. M. Ashkanasy, C. Wilderom, & M. F. Peterson (Eds.),
Handbook of organizational culture and climate (pp. 21 – 36). Thousand Oaks, CA: Sage.
Schneider, B., & Reichers, A. E. (1983). On the etiology of climates. Personnel Psychology, 36,
19 – 39.
Schneider, B., & Snyder, R. A. (1975). Some relationships between job satisfaction and
organization climate. Journal of Applied Psychology, 60, 318 – 328.
Schneider, B., White, S. S., & Paul, M. C. (1998). Linking service climate and customer
perceptions of service quality: Test of a causal model. Journal of Applied Psychology, 83,
150 – 163.
Sorensen, J. B. (2002). The strength of corporate culture and the reliability of firm performance.
Administrative Science Quarterly, 47, 70 – 91.
Spector, P. (1997). Job satisfaction: Application, assessment, causes, and consequences. Thousand
Oaks, CA: Sage.
Voss, G. B., & Voss, Z. G. (2000). Strategic orientation and firm performance in an artistic
environment. Journal of Marketing, 64, 67 – 83.
Wilkins, A., & Ouchi, W. (1983). Efficient cultures: Exploring the relationship between culture
and organizational performance. Administrative Science Quarterly, 28, 468 – 481.
Witt, L. A., & Boerkrem, M. N. (1989). Climate for creative productivity as a predictor of
research usefulness and organizational effectiveness in an R&D organization. Creativity
Research Journal, 2, 30 – 40.
Zohar, D. (2000). A group-level model of safety climate: Testing the effect of group climate on
microaccidents in manufacturing jobs. Journal of Applied Psychology, 65, 96 – 102.
First published online month/year
ORGANIZATIONAL CULTURE AND CUSTOMER SATISFACTION 21