Embed Size (px)
Citation preview
1
Linking Exploits from the Dark Web to Known Vulnerabilities
for Proactive Cyber Threat Intelligence: An Attention-based
Deep Structured Semantic Model
***Forthcoming at MIS Quarterly***
Sagar Samtani
Department of Operations and Decision Technologies, Indiana University, Bloomington, IN 47405,
U.S.A. {[email protected]}
Yidong Chai
School of Management, Hefei University of Technology, Hefei, Anhui 230009, China.
Hsinchun Chen
Department of Management Information Systems, University of Arizona, Tucson, AZ 85721, U.S.A.
Sagar Samtani is an Assistant Professor and Grant Thornton Scholar in the Department of Operations and
Decision Technologies at the Kelley School of Business at Indiana University. Samtani graduated with his
Ph.D. in Management Information Systems from the University of Arizona’s Artificial Intelligence (AI)
Lab in May 2018, where he served as a CyberCorps Scholarship-for-Service Fellow. Samtani’s AI for
Cybersecurity and Dark Web analytics research initiatives have received funding from the National Science
Foundation CRII, CICI, and SaTC-EDU programs. Samtani has published over 40 peer reviewed articles
in journals and conferences including MIS Quarterly, Journal of MIS, IEEE Intelligent Systems, ACM
Transactions on Privacy and Security, IEEE S&P, IEEE ICDM, IEEE ISI, and others. He is currently an
Associate Editor at Information and Management and has served as a Guest Editor at IEEE Transactions
on Dependable and Secure Computing and ACM Transactions on MIS. His research has received multiple
awards and significant media coverage and citations from outlets such as the Miami Herald, Fox News, and
Science. He is a member of the IEEE, ACM, AIS, and INFORMS.
Yidong Chai is a professor at the School of Management at the Hefei University of Technology. He
received his Ph.D. degree from the Department of Management Science and Engineering of Tsinghua
University. His research centers around machine learning for health informatics, cyber threat intelligence,
and business intelligence. His work has appeared in journals including MIS Quarterly, Information
Processing and Management, Knowledge-Based Systems and Applied Soft Computing, as well as
conferences and workshops including IEEE S&P, INFORMS Workshop on Data Science, Workshop on
Information Technology Systems, International Conference on Smart Health, and International Conference
on Information Systems.
Hsinchun Chen is Regents Professor and Thomas R. Brown Chair in Management and Technology in the
Management Information Systems Department at the Eller College of Management, University of Arizona.
He received his Ph.D. in Information Systems from New York University. He is the author/editor of 20
books, 300 SCI journal articles, and 200 refereed conference articles covering digital library, data/text/web
mining, business analytics, security informatics, and health informatics. He founded the Artificial
Intelligence Lab at The University of Arizona in 1989, which has received $50M+ research funding from
the NSF, National Institutes of Health, National Library of Medicine, Department of Defense, Department
of Justice, Central Intelligence Agency, Department of Homeland Security, and other agencies (100+
grants, 50+ from NSF). He has served as Editor-in-Chief, Senior Editor or AE of major ACM/IEEE (ACM
2
TMIS, ACM TOIS, IEEE IS, IEEE SMC), MIS (MISQ, DSS) and Springer (JASIST) journals and
conference/program chair of major ACM/IEEE/MIS conferences in digital library (ACM/IEEE JCDL,
ICADL), information systems (ICIS), security informatics (IEEE ISI), and health informatics (ICSH). His
COPLINK/i2 system for security analytics was commercialized in 2000 and acquired by IBM as its leading
government analytics product in 2011. The COPLINK/i2 system is used in 5,000+ law enforcement
jurisdictions and intelligence agencies in the U.S. and Europe, making a significant contribution to public
safety worldwide. Dr. Chen is director of the UA AZSecure Cybersecurity Program, with $10M+ funding
from NSF SFS, SaTC, and CICI programs and CAE-CD/CAE-R cybersecurity designations from
NSA/DHS. He is a fellow of ACM, IEEE, and AAAS.
Acknowledgments: We are grateful to the Senior Editor, Associate Editor, and three anonymous reviewers
for their constructive comments and feedback. This material is based upon work supported by the National
Science Foundation (NSF) under the grants OAC-1917117 (CICI), DGE-1921485 (SFS), CNS-1850352
(CRII SaTC), DGE-1303362 (SFS), and SES-1303362 (SBE SaTC TTP). Sagar Samtani and Yidong Chai
are the corresponding authors. We are thankful to seminar participants at the University of Nevada Las
Vegas (UNLV), University of South Florida (USF), Indiana University (IU), University of Minnesota
(UMN), IU Center for Applied Cybersecurity Research (CACR), and Conference on Applied Machine
Learning on Information Security (CAMLIS) for their thoughtful feedback. We also thank Dr. Hongyi Zhu
at University of Texas, San Antonio for his input and advice on this work.
3
Linking Exploits from the Dark Web to Known Vulnerabilities
for Proactive Cyber Threat Intelligence: An Attention-based
Deep Structured Semantic Model
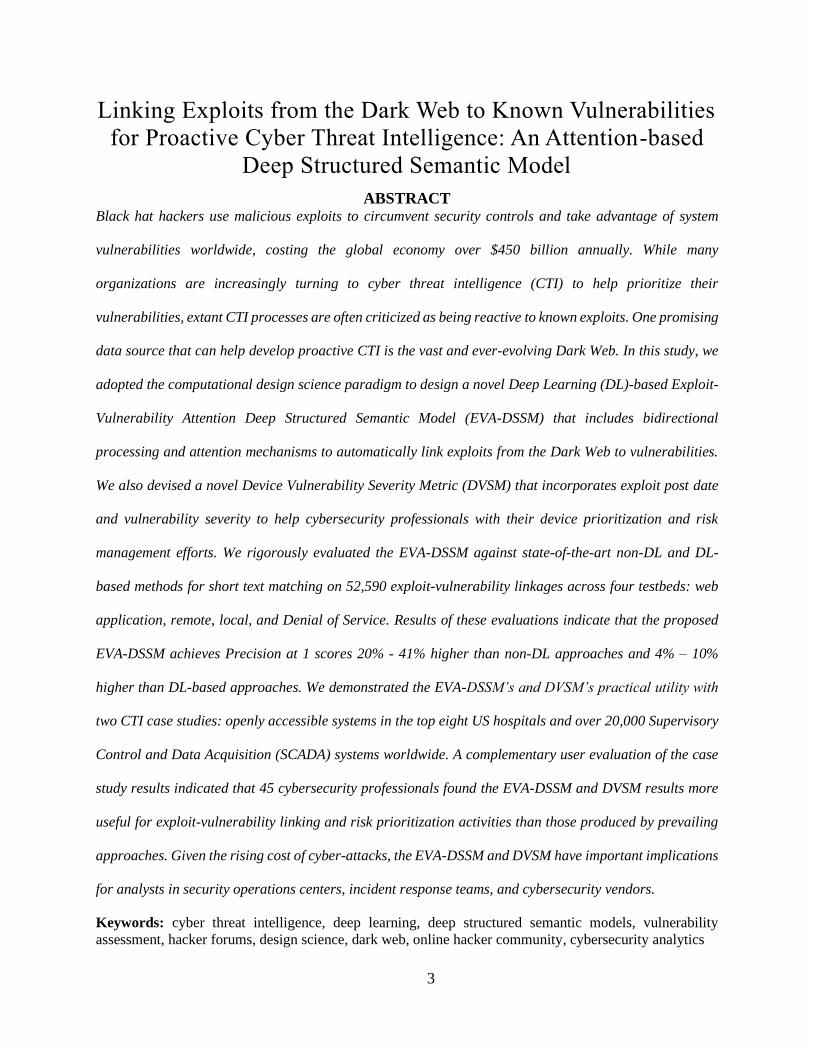
ABSTRACT Black hat hackers use malicious exploits to circumvent security controls and take advantage of system
vulnerabilities worldwide, costing the global economy over $450 billion annually. While many
organizations are increasingly turning to cyber threat intelligence (CTI) to help prioritize their
vulnerabilities, extant CTI processes are often criticized as being reactive to known exploits. One promising
data source that can help develop proactive CTI is the vast and ever-evolving Dark Web. In this study, we
adopted the computational design science paradigm to design a novel Deep Learning (DL)-based Exploit-
Vulnerability Attention Deep Structured Semantic Model (EVA-DSSM) that includes bidirectional
processing and attention mechanisms to automatically link exploits from the Dark Web to vulnerabilities.
We also devised a novel Device Vulnerability Severity Metric (DVSM) that incorporates exploit post date
and vulnerability severity to help cybersecurity professionals with their device prioritization and risk
management efforts. We rigorously evaluated the EVA-DSSM against state-of-the-art non-DL and DL-
based methods for short text matching on 52,590 exploit-vulnerability linkages across four testbeds: web
application, remote, local, and Denial of Service. Results of these evaluations indicate that the proposed
EVA-DSSM achieves Precision at 1 scores 20% - 41% higher than non-DL approaches and 4% – 10%
higher than DL-based approaches. We demonstrated the EVA-DSSM’s and DVSM’s practical utility with
two CTI case studies: openly accessible systems in the top eight US hospitals and over 20,000 Supervisory
Control and Data Acquisition (SCADA) systems worldwide. A complementary user evaluation of the case
study results indicated that 45 cybersecurity professionals found the EVA-DSSM and DVSM results more
useful for exploit-vulnerability linking and risk prioritization activities than those produced by prevailing
approaches. Given the rising cost of cyber-attacks, the EVA-DSSM and DVSM have important implications
for analysts in security operations centers, incident response teams, and cybersecurity vendors.
Keywords: cyber threat intelligence, deep learning, deep structured semantic models, vulnerability
assessment, hacker forums, design science, dark web, online hacker community, cybersecurity analytics
4
INTRODUCTION
The rapid proliferation of computing technologies has afforded modern society with unprecedented
benefits. Industry, government, and academia use databases, communication networks, and other
information systems (IS) to execute day-to-day operations with unparalleled efficiency and effectiveness.
Unfortunately, black hat hackers often use malicious exploits to circumvent security controls and take
advantage of system vulnerabilities for cyberwarfare, hacktivism, espionage, or financial purposes. These
cyber-attacks cost the global economy over $450 billion annually (Graham 2017). To combat this societal
issue, many organizations are increasingly developing cyber threat intelligence (CTI) to manage knowledge
about hackers and emerging threats (Samtani et al. 2020a). A common step within the CTI process is
vulnerability assessment, where organizations assess the flaws of their systems using automated tools such
as Nessus. Vulnerability assessment results help analysts collect relevant data from log files located in
databases, firewalls, and servers. Analytics such as malware analysis, event correlation, and forensics derive
intelligence for CTI professionals to prioritize vulnerable devices for subsequent remediation and
mitigation.
Despite the maturity of CTI procedures, experts note that the reliance on past events (e.g., log files)
creates reactive intelligence (Bromiley, 2016). Major industry firms such as Ernst & Young have long
expressed that “organizations need to take a more proactive approach to cybersecurity” (EY, 2014).
Similarly, the internationally recognized SANS Institute has consistently urged organizations to use
“external threat intelligence sources to help alert the organization of threats it was not previously aware of”
(Bromiley, 2016). One promising and emerging data source that can help CTI professionals proactively
identify exploits is the online hacker community or “Dark Web” (Benjamin et al. 2019). The Dark Web is
an appealing data source for CTI as it contains millions of hacking tools from hackers in the US, Russia,
the Middle East, and China. The Dark Web comprises four major platforms (Benjamin et al. 2019): forums,
Internet-Relay-Chat (IRC), DarkNet Markets (DNMs), and carding shops. While each platform offers CTI
value, forums are the largest (often tens of millions of posts in a forum) and allow hackers to freely share
5
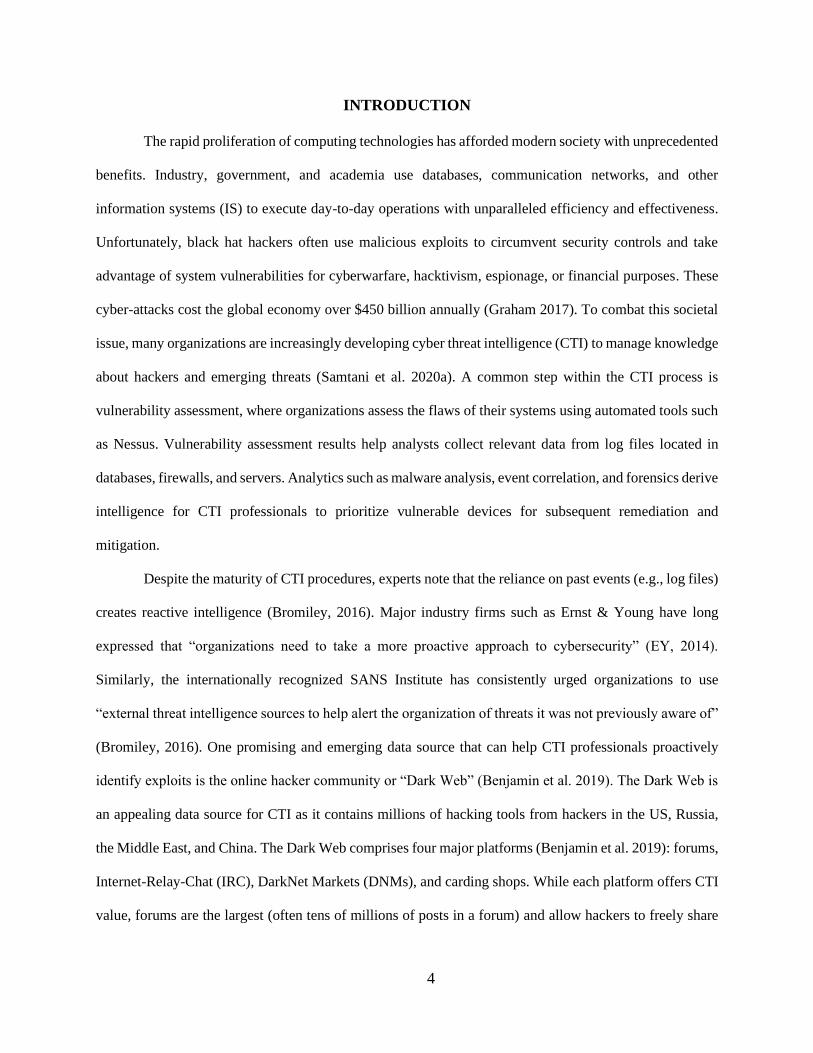
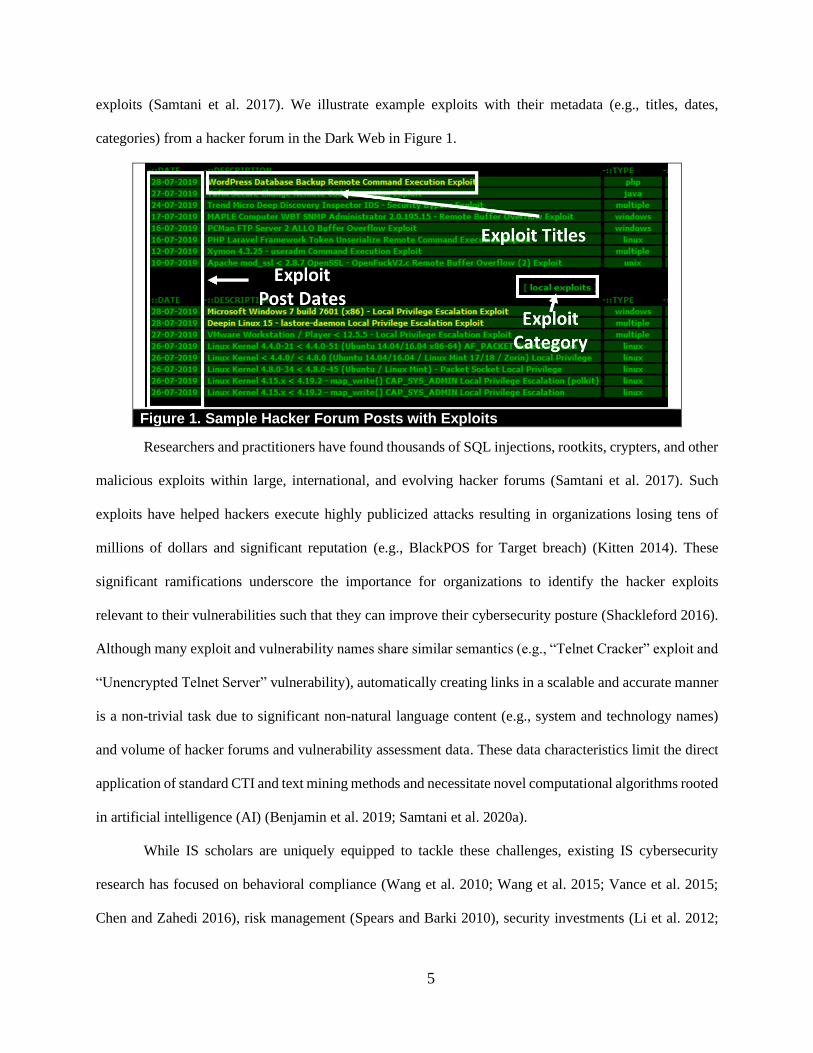
exploits (Samtani et al. 2017). We illustrate example exploits with their metadata (e.g., titles, dates,
categories) from a hacker forum in the Dark Web in Figure 1.
Figure 1. Sample Hacker Forum Posts with Exploits
Researchers and practitioners have found thousands of SQL injections, rootkits, crypters, and other
malicious exploits within large, international, and evolving hacker forums (Samtani et al. 2017). Such
exploits have helped hackers execute highly publicized attacks resulting in organizations losing tens of
millions of dollars and significant reputation (e.g., BlackPOS for Target breach) (Kitten 2014). These
significant ramifications underscore the importance for organizations to identify the hacker exploits
relevant to their vulnerabilities such that they can improve their cybersecurity posture (Shackleford 2016).
Although many exploit and vulnerability names share similar semantics (e.g., “Telnet Cracker” exploit and
“Unencrypted Telnet Server” vulnerability), automatically creating links in a scalable and accurate manner
is a non-trivial task due to significant non-natural language content (e.g., system and technology names)
and volume of hacker forums and vulnerability assessment data. These data characteristics limit the direct
application of standard CTI and text mining methods and necessitate novel computational algorithms rooted
in artificial intelligence (AI) (Benjamin et al. 2019; Samtani et al. 2020a).
While IS scholars are uniquely equipped to tackle these challenges, existing IS cybersecurity
research has focused on behavioral compliance (Wang et al. 2010; Wang et al. 2015; Vance et al. 2015;
Chen and Zahedi 2016), risk management (Spears and Barki 2010), security investments (Li et al. 2012;
6
Ransbotham et al. 2012; Kwon and Johnson 2014), and market effects of cybersecurity (Gupta and Zhdanov
2012; Kim and Kim 2014). Studies in each area use behavioral or economic methods to make excellent
contributions to our understanding of cybersecurity. The unique characteristics of hacker forum and
vulnerability assessment data combined with CTI’s emphasis on the rapid development of novel systems
and algorithms necessitates novel computational information technology (IT) artifacts (Rai 2017;
Mahmood et al. 2010; Samtani et al. 2020a). Motivated by the ever-increasing attention on developing
proactive CTI from the online hacker community and by the lack of IS and cybersecurity analytics studies,
we adopted the computational design science paradigm to develop a CTI framework with two contributions:
1. Exploit Vulnerability Attention Deep Structured Semantic Model (EVA-DSSM). We designed a
novel Deep Learning (DL)-based EVA-DSSM that automatically links exploits from hacker forums to
vulnerabilities detected by prevailing vulnerability assessment tools. EVA-DSSM incorporates
principles from emerging methods such as the Deep Structured Semantic Model (DSSM) from neural
information retrieval and attention mechanisms from interpretable DL to automatically extract and
weight the sequential dependencies and global relationships present in exploit and vulnerability names
to create exploit-vulnerability linkages.
2. Device Vulnerability Severity Metric (DVSM). Based on the exploit-vulnerability linkages generated
from the EVA-DSSM, we devised a new DVSM that incorporates exploit and vulnerability metadata
such as exploit post date and vulnerability severity into a single score. DVSM aims to provide a holistic
metric to help cybersecurity professionals execute their device prioritization, vulnerability remediation,
and risk management efforts.
Consistent with the computational design science paradigm (Rai 2017), we rigorously evaluated
the EVA-DSSM against state-of-the-art non-DL and DL-based short text matching methods with a series
of technical benchmark experiments on four large-scale testbeds of exploits: web application, remote, local,
and Denial of Service (DoS). We demonstrated the EVA-DSSM’s and DVSM’s practical utility with two
CTI case studies: openly accessible systems in major US hospitals and Supervisory Control and Data
Acquisition (SCADA) systems. Finally, we conducted a complementary user evaluation with 45
7
cybersecurity professionals that examined the usefulness of the EVA-DSSM and DVSM results against
those generated by prevailing benchmark approaches for the hospital and SCADA case studies. Taken
together, the EVA-DSSM and DVSM have implications for analysts in Security Operations Centers
(SOCs), Incident Response (IR) teams, and cybersecurity vendors.
RELATED WORK
We review four streams of literature to ground and guide our work: (1) hacker community (Dark
Web) research to provide an overview of major platforms and identify how past studies have examined
exploits within hacker forums, (2) vulnerability assessment principles to understand the prevailing
approaches for discovering, assessing, and ranking vulnerabilities, (3) the DSSM to understand how the
prevailing DL-based approach for short text matching operates, and (4) attention mechanisms identify how
they can be incorporated into the DSSM to improve exploit-vulnerability linking performance.
Hacker Community (Dark Web) Research
As indicated in the introduction, hackers from the US, Russia, China, and the Middle East often
congregate on hacker forums, DarkNet Markets, IRC, and carding shops to exchange malicious tools,
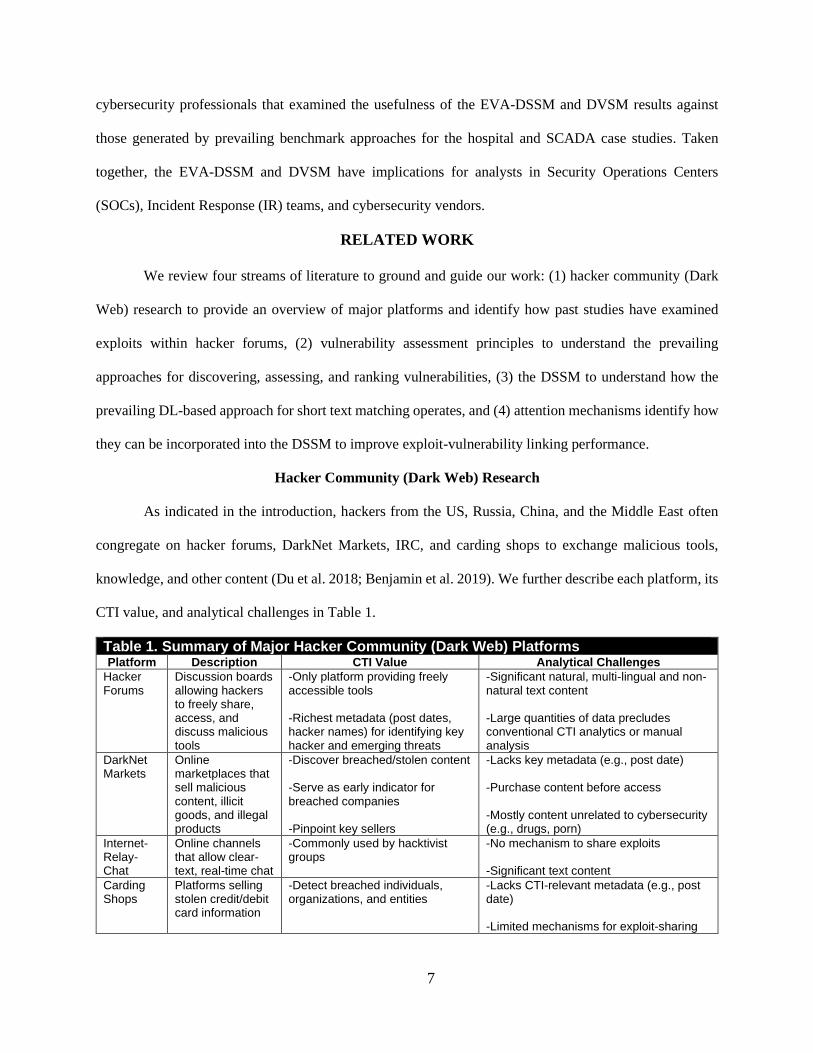
knowledge, and other content (Du et al. 2018; Benjamin et al. 2019). We further describe each platform, its
CTI value, and analytical challenges in Table 1.
Table 1. Summary of Major Hacker Community (Dark Web) Platforms
Platform Description CTI Value Analytical Challenges
Hacker Forums
Discussion boards allowing hackers to freely share, access, and discuss malicious tools
-Only platform providing freely accessible tools -Richest metadata (post dates, hacker names) for identifying key hacker and emerging threats
-Significant natural, multi-lingual and non-natural text content -Large quantities of data precludes conventional CTI analytics or manual analysis
DarkNet Markets
Online marketplaces that sell malicious content, illicit goods, and illegal products
-Discover breached/stolen content -Serve as early indicator for breached companies -Pinpoint key sellers
-Lacks key metadata (e.g., post date) -Purchase content before access -Mostly content unrelated to cybersecurity (e.g., drugs, porn)
Internet-Relay-Chat
Online channels that allow clear-text, real-time chat
-Commonly used by hacktivist groups
-No mechanism to share exploits -Significant text content
Carding Shops
Platforms selling stolen credit/debit card information
-Detect breached individuals, organizations, and entities
-Lacks CTI-relevant metadata (e.g., post date) -Limited mechanisms for exploit-sharing
8
Hacker forums contain thousands of freely available exploits, have rich metadata (e.g., post date),
and focus on major themes (e.g., carding, exploits only). DNMs often contain considerable non-
cybersecurity related content (e.g., porn, drugs) and lack valuable CTI metadata (e.g., date) (Ebrahimi et al.
2020). Moreover, products must be purchased (a significant risk for researchers) to gain additional details.
IRC and carding shops allow plain-text conversations or posting of stolen credit cards, respectively, but
prevent hackers from posting exploits (Benjamin et al. 2016; Li et al. 2016). Given the analytical challenges
that DNMs, IRC, and carding shops present, hacker forums are often preferred by cybersecurity researchers
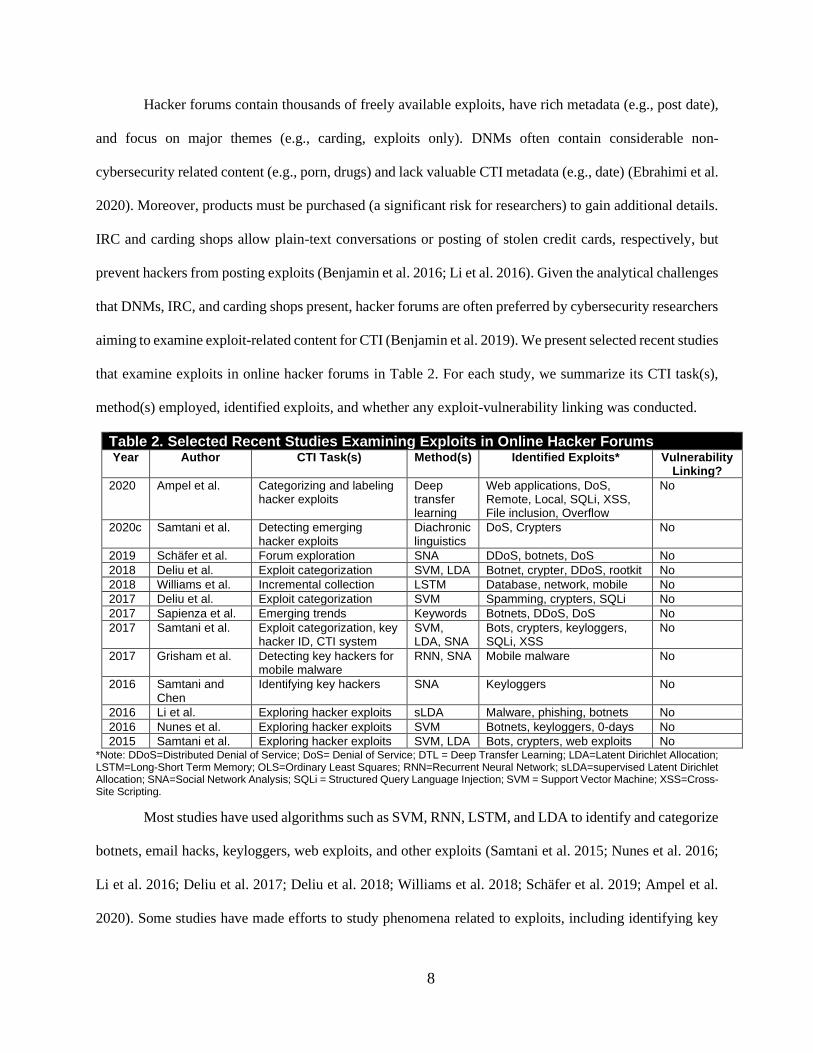
aiming to examine exploit-related content for CTI (Benjamin et al. 2019). We present selected recent studies
that examine exploits in online hacker forums in Table 2. For each study, we summarize its CTI task(s),
method(s) employed, identified exploits, and whether any exploit-vulnerability linking was conducted.
Table 2. Selected Recent Studies Examining Exploits in Online Hacker Forums Year Author CTI Task(s) Method(s) Identified Exploits* Vulnerability
Linking?
2020 Ampel et al. Categorizing and labeling hacker exploits
Deep transfer learning
Web applications, DoS, Remote, Local, SQLi, XSS, File inclusion, Overflow
No
2020c Samtani et al. Detecting emerging hacker exploits
Diachronic linguistics
DoS, Crypters No
2019 Schäfer et al. Forum exploration SNA DDoS, botnets, DoS No
2018 Deliu et al. Exploit categorization SVM, LDA Botnet, crypter, DDoS, rootkit No
2018 Williams et al. Incremental collection LSTM Database, network, mobile No
2017 Deliu et al. Exploit categorization SVM Spamming, crypters, SQLi No
2017 Sapienza et al. Emerging trends Keywords Botnets, DDoS, DoS No
2017 Samtani et al. Exploit categorization, key hacker ID, CTI system
SVM, LDA, SNA
Bots, crypters, keyloggers, SQLi, XSS
No
2017 Grisham et al. Detecting key hackers for mobile malware
RNN, SNA Mobile malware No
2016 Samtani and Chen
Identifying key hackers SNA Keyloggers No
2016 Li et al. Exploring hacker exploits sLDA Malware, phishing, botnets No
2016 Nunes et al. Exploring hacker exploits SVM Botnets, keyloggers, 0-days No
2015 Samtani et al. Exploring hacker exploits SVM, LDA Bots, crypters, web exploits No *Note: DDoS=Distributed Denial of Service; DoS= Denial of Service; DTL = Deep Transfer Learning; LDA=Latent Dirichlet Allocation; LSTM=Long-Short Term Memory; OLS=Ordinary Least Squares; RNN=Recurrent Neural Network; sLDA=supervised Latent Dirichlet Allocation; SNA=Social Network Analysis; SQLi = Structured Query Language Injection; SVM = Support Vector Machine; XSS=Cross-Site Scripting.
Most studies have used algorithms such as SVM, RNN, LSTM, and LDA to identify and categorize
botnets, email hacks, keyloggers, web exploits, and other exploits (Samtani et al. 2015; Nunes et al. 2016;
Li et al. 2016; Deliu et al. 2017; Deliu et al. 2018; Williams et al. 2018; Schäfer et al. 2019; Ampel et al.
2020). Some studies have made efforts to study phenomena related to exploits, including identifying key
9
hackers sharing exploits (Samtani et al. 2016; Grisham et al. 2017) and emerging threats (Sapienza et al.
2017; Samtani et al. 2020c). While each study provides valuable knowledge about exploits in Dark Web
forums, we are unaware of any studies that have identified how exploits link to an organization’s
vulnerabilities. Designing a forum-based approach to automatically link tens of thousands of exploits and
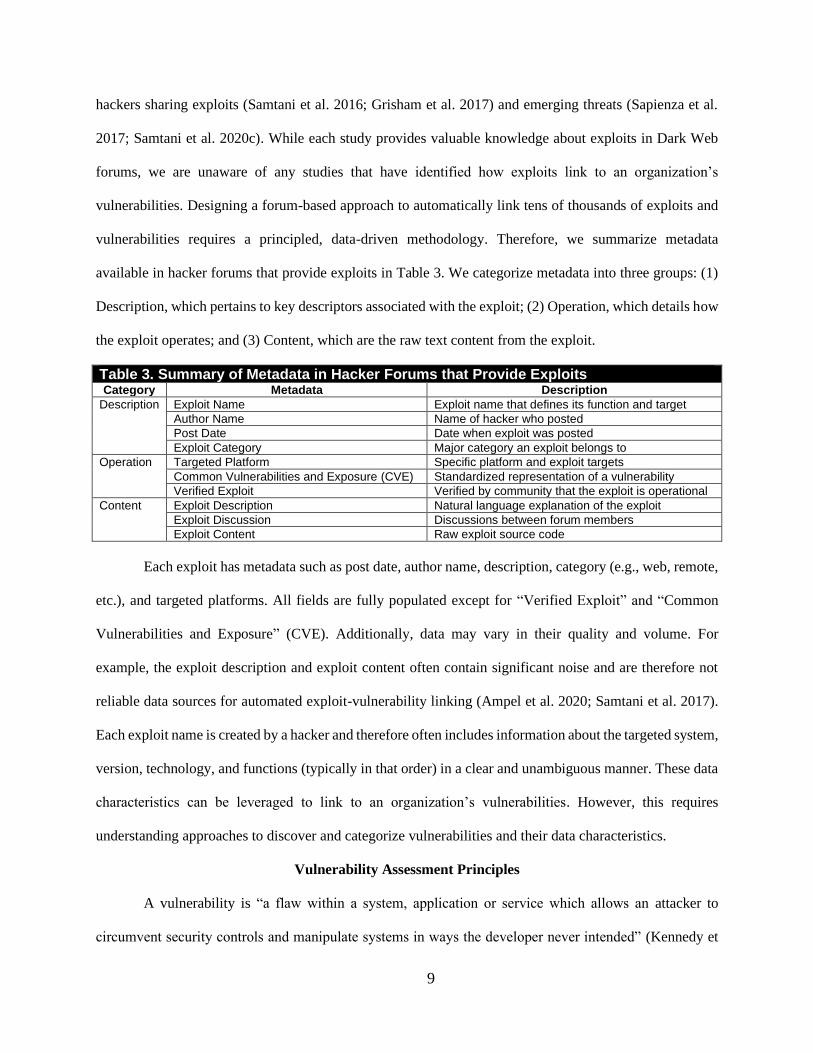
vulnerabilities requires a principled, data-driven methodology. Therefore, we summarize metadata
available in hacker forums that provide exploits in Table 3. We categorize metadata into three groups: (1)
Description, which pertains to key descriptors associated with the exploit; (2) Operation, which details how
the exploit operates; and (3) Content, which are the raw text content from the exploit.
Table 3. Summary of Metadata in Hacker Forums that Provide Exploits Category Metadata Description
Description Exploit Name Exploit name that defines its function and target
Author Name Name of hacker who posted
Post Date Date when exploit was posted
Exploit Category Major category an exploit belongs to
Operation Targeted Platform Specific platform and exploit targets
Common Vulnerabilities and Exposure (CVE) Standardized representation of a vulnerability
Verified Exploit Verified by community that the exploit is operational
Content Exploit Description Natural language explanation of the exploit
Exploit Discussion Discussions between forum members
Exploit Content Raw exploit source code
Each exploit has metadata such as post date, author name, description, category (e.g., web, remote,
etc.), and targeted platforms. All fields are fully populated except for “Verified Exploit” and “Common
Vulnerabilities and Exposure” (CVE). Additionally, data may vary in their quality and volume. For
example, the exploit description and exploit content often contain significant noise and are therefore not
reliable data sources for automated exploit-vulnerability linking (Ampel et al. 2020; Samtani et al. 2017).
Each exploit name is created by a hacker and therefore often includes information about the targeted system,
version, technology, and functions (typically in that order) in a clear and unambiguous manner. These data
characteristics can be leveraged to link to an organization’s vulnerabilities. However, this requires
understanding approaches to discover and categorize vulnerabilities and their data characteristics.
Vulnerability Assessment Principles
A vulnerability is “a flaw within a system, application or service which allows an attacker to
circumvent security controls and manipulate systems in ways the developer never intended” (Kennedy et
10
al. 2011). Organizations often use assessment tools to automatically identify, categorize, and prioritize tens
of thousands of vulnerabilities including web application issues, unpatched technology, and default logins
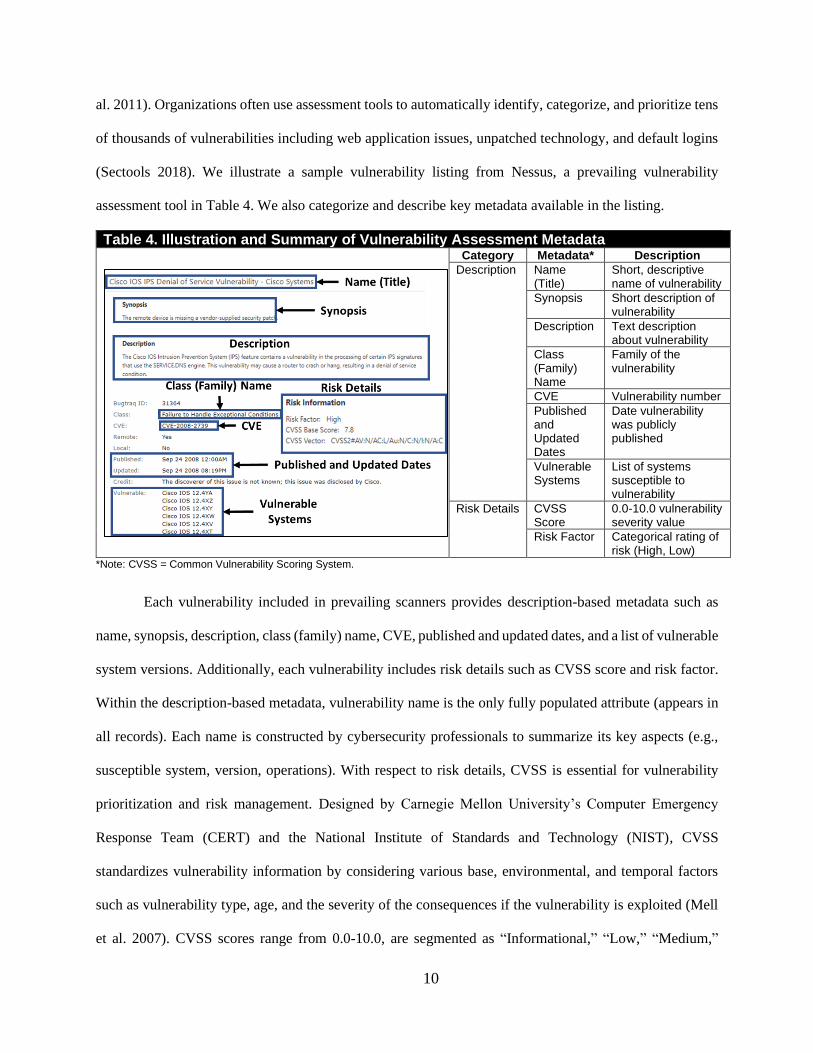
(Sectools 2018). We illustrate a sample vulnerability listing from Nessus, a prevailing vulnerability
assessment tool in Table 4. We also categorize and describe key metadata available in the listing.
Table 4. Illustration and Summary of Vulnerability Assessment Metadata
Category Metadata* Description
Description Name (Title)
Short, descriptive name of vulnerability
Synopsis Short description of vulnerability
Description Text description about vulnerability
Class (Family) Name
Family of the vulnerability
CVE Vulnerability number
Published and Updated Dates
Date vulnerability was publicly published
Vulnerable Systems
List of systems susceptible to vulnerability
Risk Details CVSS Score
0.0-10.0 vulnerability severity value
Risk Factor Categorical rating of risk (High, Low)
*Note: CVSS = Common Vulnerability Scoring System.
Each vulnerability included in prevailing scanners provides description-based metadata such as
name, synopsis, description, class (family) name, CVE, published and updated dates, and a list of vulnerable
system versions. Additionally, each vulnerability includes risk details such as CVSS score and risk factor.
Within the description-based metadata, vulnerability name is the only fully populated attribute (appears in
all records). Each name is constructed by cybersecurity professionals to summarize its key aspects (e.g.,
susceptible system, version, operations). With respect to risk details, CVSS is essential for vulnerability
prioritization and risk management. Designed by Carnegie Mellon University’s Computer Emergency
Response Team (CERT) and the National Institute of Standards and Technology (NIST), CVSS
standardizes vulnerability information by considering various base, environmental, and temporal factors
such as vulnerability type, age, and the severity of the consequences if the vulnerability is exploited (Mell
et al. 2007). CVSS scores range from 0.0-10.0, are segmented as “Informational,” “Low,” “Medium,”
11
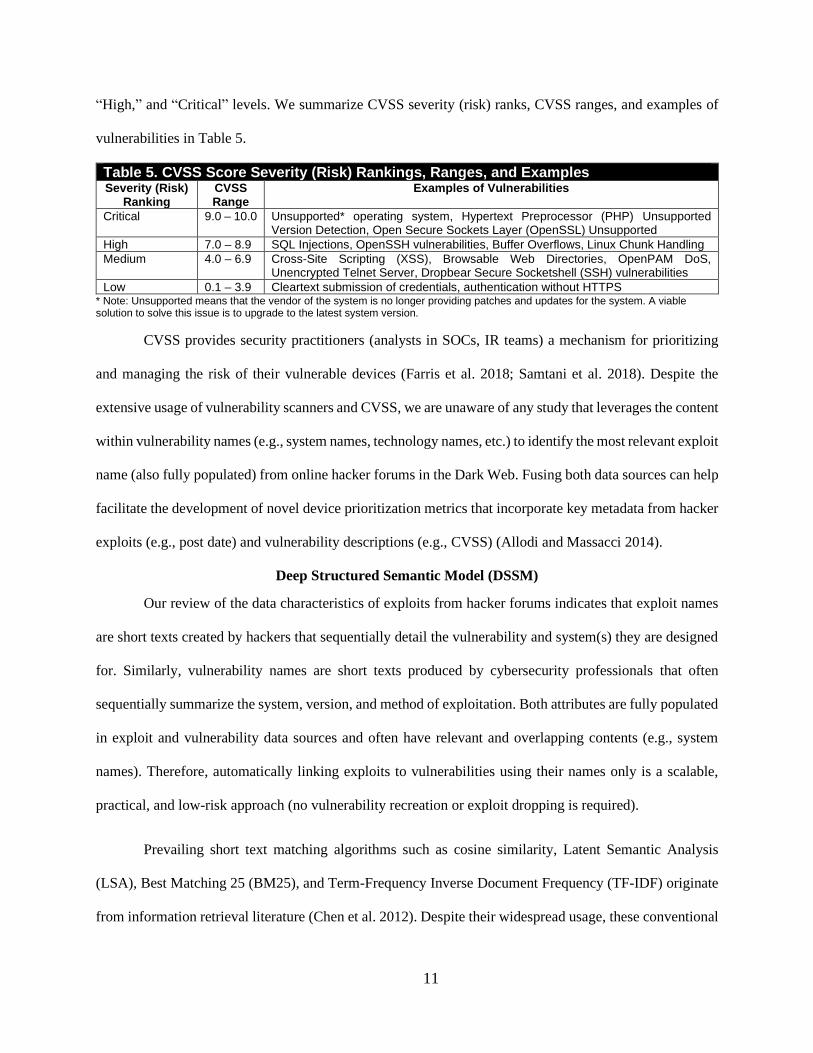
“High,” and “Critical” levels. We summarize CVSS severity (risk) ranks, CVSS ranges, and examples of
vulnerabilities in Table 5.
Table 5. CVSS Score Severity (Risk) Rankings, Ranges, and Examples Severity (Risk)
Ranking CVSS Range
Examples of Vulnerabilities
Critical 9.0 – 10.0 Unsupported* operating system, Hypertext Preprocessor (PHP) Unsupported Version Detection, Open Secure Sockets Layer (OpenSSL) Unsupported
High 7.0 – 8.9 SQL Injections, OpenSSH vulnerabilities, Buffer Overflows, Linux Chunk Handling
Medium 4.0 – 6.9 Cross-Site Scripting (XSS), Browsable Web Directories, OpenPAM DoS, Unencrypted Telnet Server, Dropbear Secure Socketshell (SSH) vulnerabilities
Low 0.1 – 3.9 Cleartext submission of credentials, authentication without HTTPS * Note: Unsupported means that the vendor of the system is no longer providing patches and updates for the system. A viable solution to solve this issue is to upgrade to the latest system version.
CVSS provides security practitioners (analysts in SOCs, IR teams) a mechanism for prioritizing
and managing the risk of their vulnerable devices (Farris et al. 2018; Samtani et al. 2018). Despite the
extensive usage of vulnerability scanners and CVSS, we are unaware of any study that leverages the content
within vulnerability names (e.g., system names, technology names, etc.) to identify the most relevant exploit
name (also fully populated) from online hacker forums in the Dark Web. Fusing both data sources can help
facilitate the development of novel device prioritization metrics that incorporate key metadata from hacker
exploits (e.g., post date) and vulnerability descriptions (e.g., CVSS) (Allodi and Massacci 2014).
Deep Structured Semantic Model (DSSM)
Our review of the data characteristics of exploits from hacker forums indicates that exploit names
are short texts created by hackers that sequentially detail the vulnerability and system(s) they are designed
for. Similarly, vulnerability names are short texts produced by cybersecurity professionals that often
sequentially summarize the system, version, and method of exploitation. Both attributes are fully populated
in exploit and vulnerability data sources and often have relevant and overlapping contents (e.g., system
names). Therefore, automatically linking exploits to vulnerabilities using their names only is a scalable,
practical, and low-risk approach (no vulnerability recreation or exploit dropping is required).
Prevailing short text matching algorithms such as cosine similarity, Latent Semantic Analysis
(LSA), Best Matching 25 (BM25), and Term-Frequency Inverse Document Frequency (TF-IDF) originate
from information retrieval literature (Chen et al. 2012). Despite their widespread usage, these conventional
12
algorithms often suffer in performance when analyzing user- or machine-generated text corpora that contain
misspellings, variations, and non-natural language, especially for cybersecurity applications (Nunes et al.
2018). These limitations have ushered in DL-based short text similarity methods from neural information
retrieval literature. DL uses multiple layers of neural networks with non-linear activation functions to
automatically learn feature representations from data (Goodfellow et al. 2016; LeCun et al. 2015). DL has
achieved unprecedented performance in malware analysis, DNM language translation, and other
cybersecurity applications (Samtani et al. 2020a). The prevailing DL-based short text matching algorithm
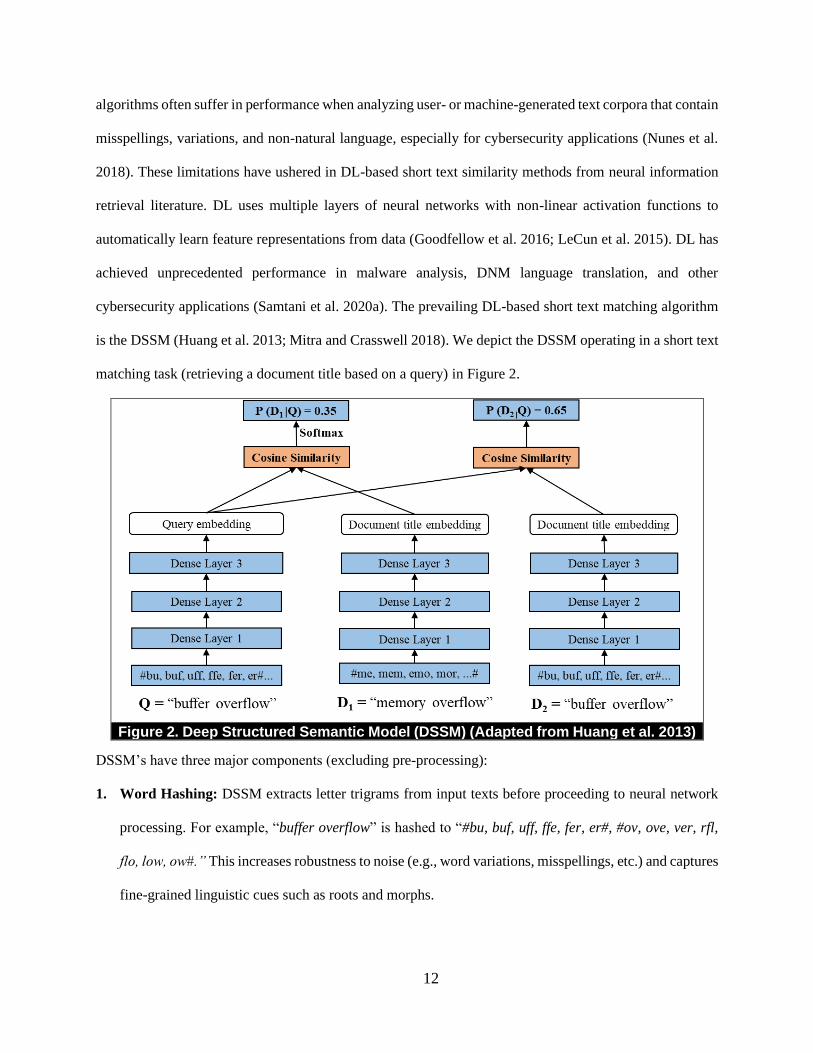
is the DSSM (Huang et al. 2013; Mitra and Crasswell 2018). We depict the DSSM operating in a short text
matching task (retrieving a document title based on a query) in Figure 2.
Figure 2. Deep Structured Semantic Model (DSSM) (Adapted from Huang et al. 2013)
DSSM’s have three major components (excluding pre-processing):
1. Word Hashing: DSSM extracts letter trigrams from input texts before proceeding to neural network
processing. For example, “buffer overflow” is hashed to “#bu, buf, uff, ffe, fer, er#, #ov, ove, ver, rfl,
flo, low, ow#.” This increases robustness to noise (e.g., word variations, misspellings, etc.) and captures
fine-grained linguistic cues such as roots and morphs.
13
2. Deep Neural Network (DNN) Processing: Each hashed phrase is inputted as a bag-of-trigrams into a
fully connected (i.e., dense) feed-forward DNN layer for conversion into a low-dimensional
embedding. Multiple layers can be stacked to reduce dimensionality (e.g., layer 1 → 30K dimensions
to 300, layer 2 → 300 to 128 dimensions) and identify semantics missed by non-DL approaches.
3. Computing Embedding Similarity: Cosine similarity calculates the distance between embeddings. A
softmax function calculates the conditional probability (i.e., P(D|Q)) for a document (D) – query (Q)
pair. The document title with the highest conditional probability with the query is the most relevant.
During training, this probability is compared with the ground truth. The residual error is backpropagated
to update the weights of the DNN.
Past studies have adjusted DSSM by substituting the feed-forward network with a convolutional
neural network (CNN) to capture word co-occurrences from input text (Mitra et al. 2016; Pang et al. 2016b;
Shen et al. 2014b). In situations where word orders or sequential dependencies exist in the input text,
scholars have replaced the first dense layer with a Long-Short Term Memory (LSTM) layer (Wan et al.
2016; Wang and Jiang 2017). DSSM-based models have been used for searching news articles (Guo et al.
2016; Pang et al. 2016a), retrieving social media posts (Jaech et al. 2017; Song et al. 2016), ranking web
pages (Shen et al. 2014a), digital assistant systems (Sarikaya 2017), community question answering (Zhou
et al. 2016), and recommender systems (Zhang et al. 2019).
Despite its widespread usage, DSSM processes input texts separately until the final embedding
comparison. As a result, DSSM cannot capture global relationships across input texts during the training
process to improve overall matching performance. However, exploit and vulnerability names often have
overlapping contents (e.g., system names) and similar semantics; processing them separately cannot weigh
and prioritize their overlapping input text features to improve exploit-vulnerability linking performance.
An emerging and promising approach that can capture relationships across input texts and feature
importance during DL training is the use of attention mechanisms (Du et al. 2019), which we review next.
Attention Mechanisms
14
Attention mechanisms belong to an emerging branch of machine learning known as interpretable
deep learning (IDL). Two major categories of IDL exist: post-hoc and intrinsic (Du et al. 2019). Post-hoc
approaches use a second method to examine major model components and/or individual parameters after
training (after model convergence) to identify how they contribute to the final output. Intrinsic approaches
integrate self-explanatory models into a DL architecture and operate during training (e.g., feed-forward,
backpropagate, and weight updates). Two major categories of intrinsic approaches exist: (1) global, that
include mechanisms such as capsule networks (Sabour et al. 2017) and wide and deep networks (Cheng et
al. 2016), and (2) local, which primarily comprise attention mechanisms. The selection of an IDL approach
is dependent on the task, data, and requirements of a particular study (Du et al. 2019; Samtani et al. 2020b).
Attention mechanisms are often preferred when aiming to assign trainable weights to individual features
within a data input, using feature weights to improve model performance, and/or identifying how input data
features affect end model performance (Du et al. 2019). Since exploit and vulnerability names often contain
overlapping features (global relationships) that could be leveraged to improve exploit-vulnerability linking
performance, we further examine attention mechanisms.
Attention mechanisms are implemented as carefully formulated layers within a neural network
architecture (Du et al. 2019). Formally, an attention mechanism is denoted by a query Q and a key-value
pair (K, V). The attention is computed as the weighted sum of value V and the weight assigned for each
value is determined by the scoring function which measures the similarity between the query Q and the key
K. For instance, in the sequence-to-sequence model for language translation, at each step, the query Q is
the hidden state of the last timestep in the decoder while the hidden states from the encoder act as both Q
and K. Based on similarity distance computed by the scoring function, the weights for the inputted features
are updated and indexed with a softmax function. Features are iteratively re-weighted during training until
model convergence. Attention mechanisms can be customized to focus on entire input sequences or
portions, depending on the data characteristics and/or network architecture. To date, attention mechanisms
have improved the performance of conventional DL architectures (e.g., DNN, recurrent neural network,
convolutional neural network, variational autoencoders) for neural machine translation (Luong et al. 2015),
15
sentiment analysis (Letarte et al. 2018), image classification (Schlemper et al. 2019), adverse event
detection (Ahmad et al. Forthcoming), and other applications. Evaluation is typically executed by
comparing the extended model against the original on a gold-standard (i.e., ground-truth) dataset (Du et al.
2019). Despite its increasing usage, we are unaware of any attention mechanisms designed for DSSMs to
support exploit-vulnerability linking.
RESEARCH GAPS AND QUESTIONS
We identified several key research gaps from the literature review. First, most hacker forum studies
have focused only on exploring hacker exploits. We are unaware of any integrated hacker forum-data driven
approach linking exploits to vulnerabilities. Since organizations have limited security budgets and must
prioritize exploits based on their vulnerabilities, simply exploring exploits has minimal CTI value. Second,
while automated tools exist for conducting vulnerability assessments, there lacks literature examining
vulnerability text to create exploit-vulnerability links. This prevents a holistic perspective of what exploits
can target vulnerabilities and precludes the development of advanced vulnerability severity metrics for
enhanced device prioritization or risk management. Third, DSSM processes input texts separately until
embedding comparison and therefore cannot capture and prioritize overlapping input text features (e.g.,
system names) and semantics between exploit and vulnerability names to improve linking performance.
Attention mechanisms can be a viable approach for addressing these issues and can enhance DSSM’s
performance in creating exploit-vulnerability linkages. However, we are unaware of any design artifacts
that integrate attention mechanisms into DSSMs for exploit-vulnerability tasks. Taking these gaps together,
we pose the following research questions for study:
• What vulnerabilities do hacker exploits from hacker forums target?
• How can device-level severity scores be calculated that incorporate vulnerability and hacker exploit
metadata to facilitate CTI?
• How can attention mechanisms be incorporated into the DSSM to capture and prioritize
overlapping features within exploit and vulnerability names to create exploit-vulnerability links?
16
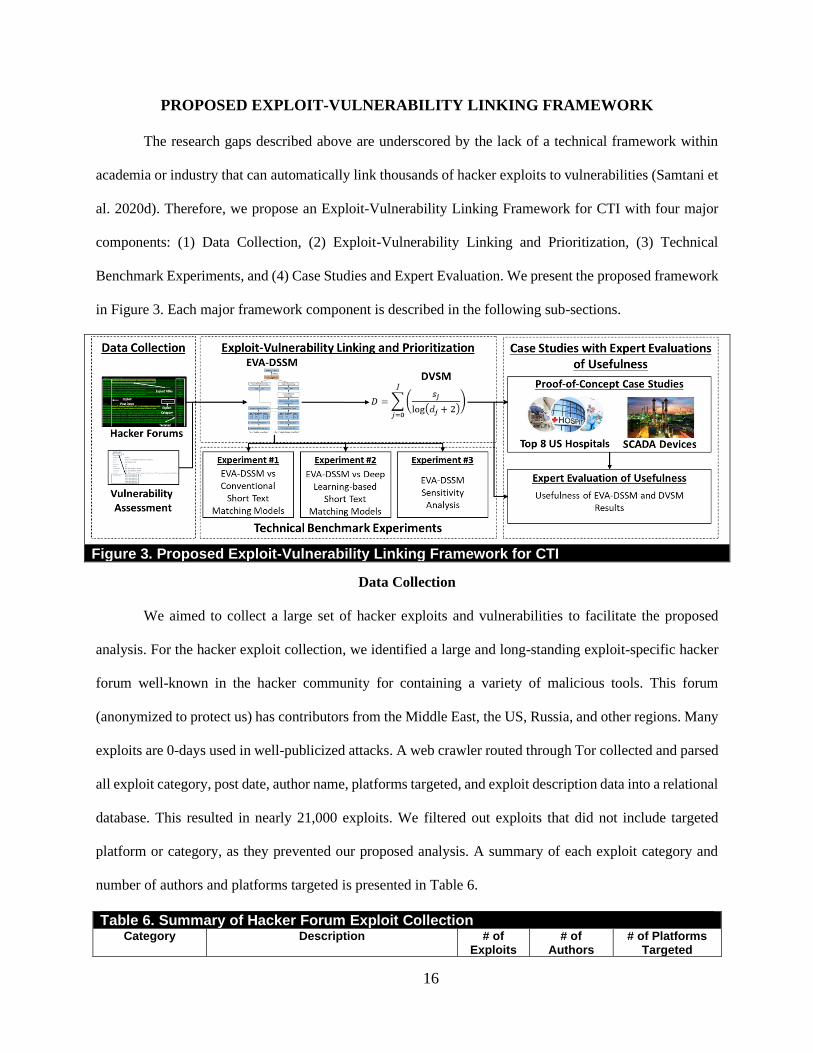
PROPOSED EXPLOIT-VULNERABILITY LINKING FRAMEWORK
The research gaps described above are underscored by the lack of a technical framework within
academia or industry that can automatically link thousands of hacker exploits to vulnerabilities (Samtani et
al. 2020d). Therefore, we propose an Exploit-Vulnerability Linking Framework for CTI with four major
components: (1) Data Collection, (2) Exploit-Vulnerability Linking and Prioritization, (3) Technical
Benchmark Experiments, and (4) Case Studies and Expert Evaluation. We present the proposed framework
in Figure 3. Each major framework component is described in the following sub-sections.
Figure 3. Proposed Exploit-Vulnerability Linking Framework for CTI
Data Collection
We aimed to collect a large set of hacker exploits and vulnerabilities to facilitate the proposed
analysis. For the hacker exploit collection, we identified a large and long-standing exploit-specific hacker
forum well-known in the hacker community for containing a variety of malicious tools. This forum
(anonymized to protect us) has contributors from the Middle East, the US, Russia, and other regions. Many
exploits are 0-days used in well-publicized attacks. A web crawler routed through Tor collected and parsed
all exploit category, post date, author name, platforms targeted, and exploit description data into a relational
database. This resulted in nearly 21,000 exploits. We filtered out exploits that did not include targeted
platform or category, as they prevented our proposed analysis. A summary of each exploit category and
number of authors and platforms targeted is presented in Table 6.
Table 6. Summary of Hacker Forum Exploit Collection Category Description # of
Exploits # of
Authors # of Platforms
Targeted
17
* Note: Authors are overlapping (i.e., single author can post exploits in multiple categories). The number presented is the number of unique authors. Similarly, a single exploit category can target multiple platforms, and the number presented in the unique platforms.
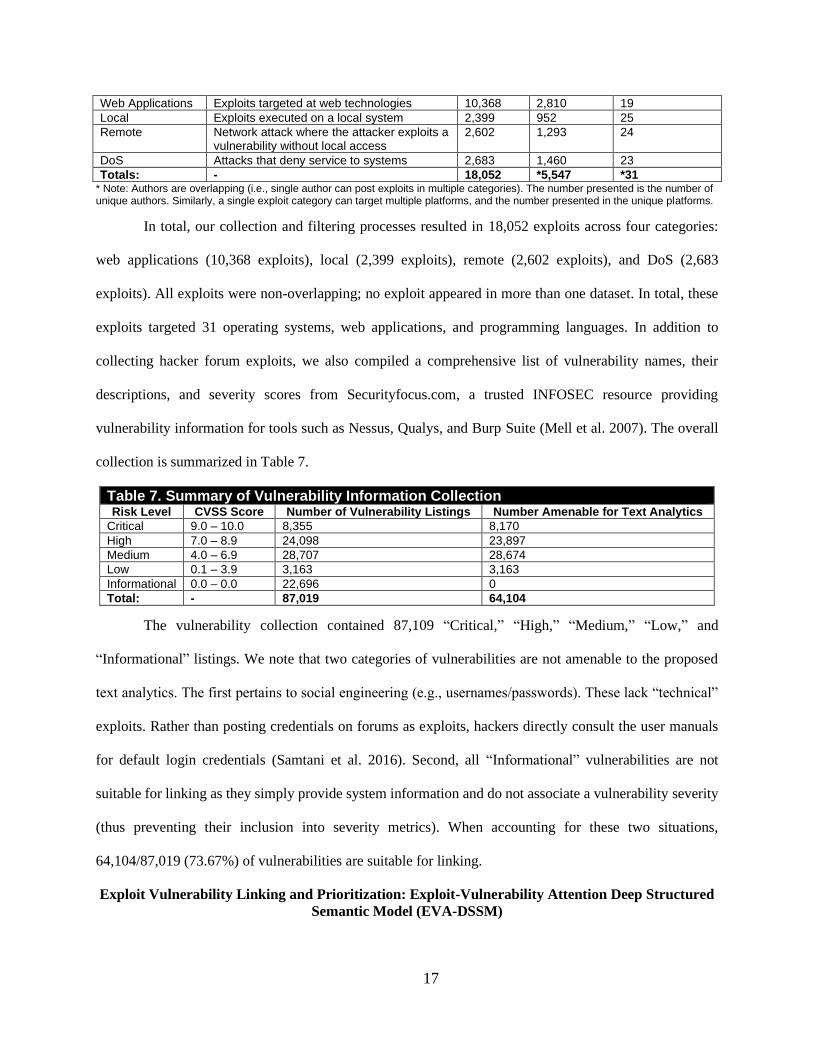
In total, our collection and filtering processes resulted in 18,052 exploits across four categories:
web applications (10,368 exploits), local (2,399 exploits), remote (2,602 exploits), and DoS (2,683
exploits). All exploits were non-overlapping; no exploit appeared in more than one dataset. In total, these
exploits targeted 31 operating systems, web applications, and programming languages. In addition to
collecting hacker forum exploits, we also compiled a comprehensive list of vulnerability names, their
descriptions, and severity scores from Securityfocus.com, a trusted INFOSEC resource providing
vulnerability information for tools such as Nessus, Qualys, and Burp Suite (Mell et al. 2007). The overall
collection is summarized in Table 7.
Table 7. Summary of Vulnerability Information Collection Risk Level CVSS Score Number of Vulnerability Listings Number Amenable for Text Analytics
Critical 9.0 – 10.0 8,355 8,170 High 7.0 – 8.9 24,098 23,897 Medium 4.0 – 6.9 28,707 28,674 Low 0.1 – 3.9 3,163 3,163 Informational 0.0 – 0.0 22,696 0 Total: - 87,019 64,104
The vulnerability collection contained 87,109 “Critical,” “High,” “Medium,” “Low,” and
“Informational” listings. We note that two categories of vulnerabilities are not amenable to the proposed
text analytics. The first pertains to social engineering (e.g., usernames/passwords). These lack “technical”
exploits. Rather than posting credentials on forums as exploits, hackers directly consult the user manuals
for default login credentials (Samtani et al. 2016). Second, all “Informational” vulnerabilities are not
suitable for linking as they simply provide system information and do not associate a vulnerability severity
(thus preventing their inclusion into severity metrics). When accounting for these two situations,
64,104/87,019 (73.67%) of vulnerabilities are suitable for linking.
Exploit Vulnerability Linking and Prioritization: Exploit-Vulnerability Attention Deep Structured
Semantic Model (EVA-DSSM)
Web Applications Exploits targeted at web technologies 10,368 2,810 19
Local Exploits executed on a local system 2,399 952 25
Remote Network attack where the attacker exploits a vulnerability without local access
2,602 1,293 24
DoS Attacks that deny service to systems 2,683 1,460 23
Totals: - 18,052 *5,547 *31
18
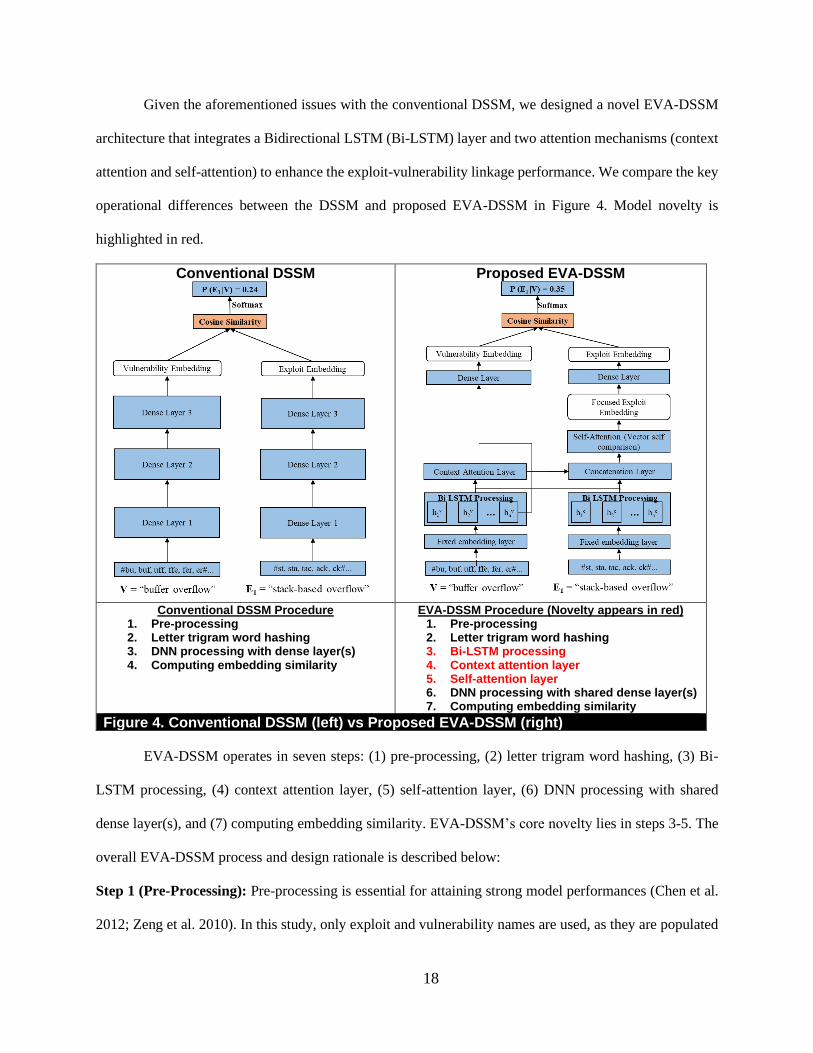
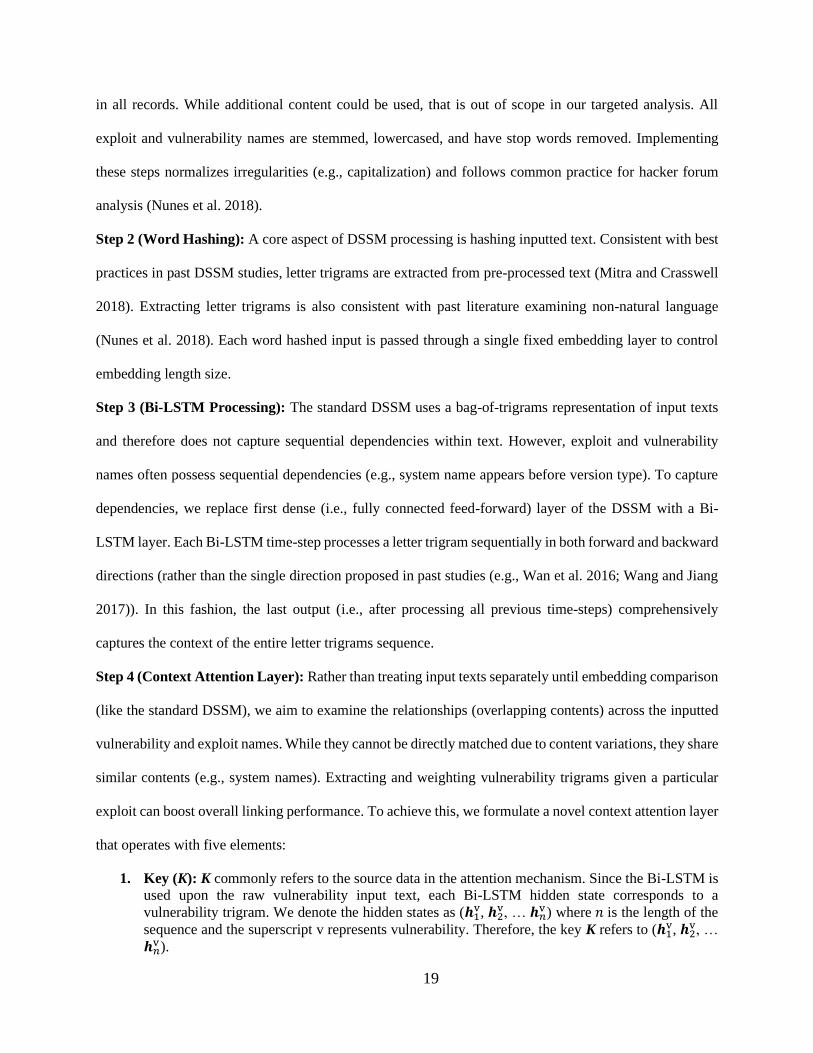
Given the aforementioned issues with the conventional DSSM, we designed a novel EVA-DSSM
architecture that integrates a Bidirectional LSTM (Bi-LSTM) layer and two attention mechanisms (context
attention and self-attention) to enhance the exploit-vulnerability linkage performance. We compare the key
operational differences between the DSSM and proposed EVA-DSSM in Figure 4. Model novelty is
highlighted in red.
Conventional DSSM
Proposed EVA-DSSM
Conventional DSSM Procedure 1. Pre-processing 2. Letter trigram word hashing 3. DNN processing with dense layer(s) 4. Computing embedding similarity
EVA-DSSM Procedure (Novelty appears in red) 1. Pre-processing 2. Letter trigram word hashing 3. Bi-LSTM processing 4. Context attention layer 5. Self-attention layer 6. DNN processing with shared dense layer(s) 7. Computing embedding similarity
Figure 4. Conventional DSSM (left) vs Proposed EVA-DSSM (right)
EVA-DSSM operates in seven steps: (1) pre-processing, (2) letter trigram word hashing, (3) Bi-
LSTM processing, (4) context attention layer, (5) self-attention layer, (6) DNN processing with shared
dense layer(s), and (7) computing embedding similarity. EVA-DSSM’s core novelty lies in steps 3-5. The
overall EVA-DSSM process and design rationale is described below:
Step 1 (Pre-Processing): Pre-processing is essential for attaining strong model performances (Chen et al.
2012; Zeng et al. 2010). In this study, only exploit and vulnerability names are used, as they are populated
19
in all records. While additional content could be used, that is out of scope in our targeted analysis. All
exploit and vulnerability names are stemmed, lowercased, and have stop words removed. Implementing
these steps normalizes irregularities (e.g., capitalization) and follows common practice for hacker forum
analysis (Nunes et al. 2018).
Step 2 (Word Hashing): A core aspect of DSSM processing is hashing inputted text. Consistent with best
practices in past DSSM studies, letter trigrams are extracted from pre-processed text (Mitra and Crasswell
2018). Extracting letter trigrams is also consistent with past literature examining non-natural language
(Nunes et al. 2018). Each word hashed input is passed through a single fixed embedding layer to control
embedding length size.
Step 3 (Bi-LSTM Processing): The standard DSSM uses a bag-of-trigrams representation of input texts
and therefore does not capture sequential dependencies within text. However, exploit and vulnerability
names often possess sequential dependencies (e.g., system name appears before version type). To capture
dependencies, we replace first dense (i.e., fully connected feed-forward) layer of the DSSM with a Bi-
LSTM layer. Each Bi-LSTM time-step processes a letter trigram sequentially in both forward and backward
directions (rather than the single direction proposed in past studies (e.g., Wan et al. 2016; Wang and Jiang
2017)). In this fashion, the last output (i.e., after processing all previous time-steps) comprehensively
captures the context of the entire letter trigrams sequence.
Step 4 (Context Attention Layer): Rather than treating input texts separately until embedding comparison
(like the standard DSSM), we aim to examine the relationships (overlapping contents) across the inputted
vulnerability and exploit names. While they cannot be directly matched due to content variations, they share
similar contents (e.g., system names). Extracting and weighting vulnerability trigrams given a particular
exploit can boost overall linking performance. To achieve this, we formulate a novel context attention layer
that operates with five elements:
1. Key (K): K commonly refers to the source data in the attention mechanism. Since the Bi-LSTM is
used upon the raw vulnerability input text, each Bi-LSTM hidden state corresponds to a
vulnerability trigram. We denote the hidden states as (𝒉1v, 𝒉2
v, … 𝒉𝑛v ) where 𝑛 is the length of the
sequence and the superscript v represents vulnerability. Therefore, the key K refers to (𝒉1v, 𝒉2
v, …
𝒉𝑛v ).
20
2. Query (Q): for the 𝑖-th exploit trigram, the corresponding hidden state 𝒉𝑖e (superscript e represents
exploits) from the Bi-LSTM is a query.
3. Value (V): Since the Bi-LSTM operates directly upon the source data, the key and the value are
the same in the EVA-DSSM.
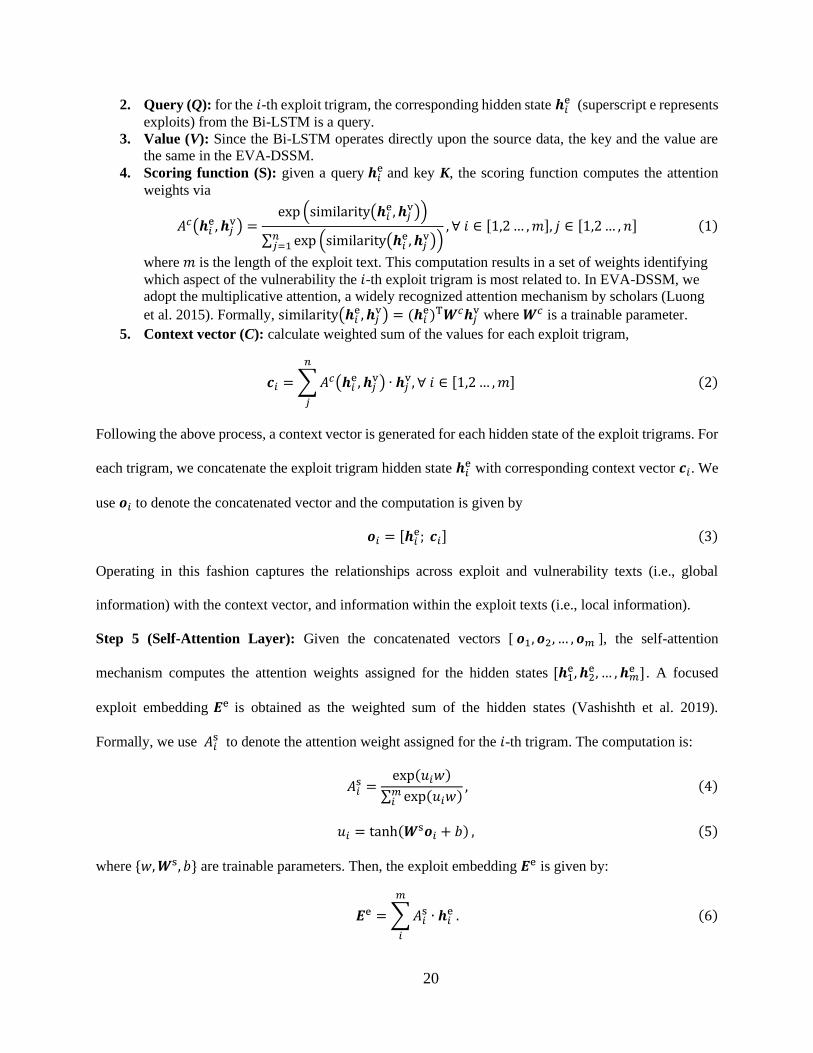
4. Scoring function (S): given a query 𝒉𝑖e and key K, the scoring function computes the attention
weights via
𝐴𝑐(𝒉𝑖e, 𝒉𝑗
v) =exp (similarity(𝒉𝑖
e, 𝒉𝑗v))
∑ exp (similarity(𝒉𝑖e, 𝒉𝑗
v))𝑛𝑗=1
, ∀ 𝑖 ∈ [1,2 … , 𝑚], 𝑗 ∈ [1,2 … , 𝑛] (1)
where 𝑚 is the length of the exploit text. This computation results in a set of weights identifying
which aspect of the vulnerability the 𝑖-th exploit trigram is most related to. In EVA-DSSM, we
adopt the multiplicative attention, a widely recognized attention mechanism by scholars (Luong
et al. 2015). Formally, similarity(𝒉𝑖e, 𝒉𝑗
v) = (𝒉𝑖e)T𝑾𝑐𝒉𝑗
v where 𝑾𝑐 is a trainable parameter.
5. Context vector (C): calculate weighted sum of the values for each exploit trigram,
𝒄𝑖 = ∑ 𝐴𝑐(𝒉𝑖e, 𝒉𝑗
v)
𝑛
𝑗
∙ 𝒉𝑗v, ∀ 𝑖 ∈ [1,2 … , 𝑚] (2)
Following the above process, a context vector is generated for each hidden state of the exploit trigrams. For
each trigram, we concatenate the exploit trigram hidden state 𝒉𝑖e with corresponding context vector 𝒄𝑖. We
use 𝒐𝑖 to denote the concatenated vector and the computation is given by
𝒐𝑖 = [𝒉𝑖e; 𝒄𝑖] (3)
Operating in this fashion captures the relationships across exploit and vulnerability texts (i.e., global
information) with the context vector, and information within the exploit texts (i.e., local information).
Step 5 (Self-Attention Layer): Given the concatenated vectors [ 𝒐1, 𝒐2, … , 𝒐𝑚 ], the self-attention
mechanism computes the attention weights assigned for the hidden states [𝒉1e, 𝒉2
e , … , 𝒉𝑚e ]. A focused
exploit embedding 𝑬e is obtained as the weighted sum of the hidden states (Vashishth et al. 2019).
Formally, we use 𝐴𝑖s to denote the attention weight assigned for the 𝑖-th trigram. The computation is:
𝐴𝑖s =
exp(𝑢𝑖𝑤)
∑ exp(𝑢𝑖𝑤)𝑚𝑖
, (4)
𝑢𝑖 = tanh(𝑾s𝒐𝑖 + 𝑏) , (5)
where {𝑤, 𝑾s, 𝑏} are trainable parameters. Then, the exploit embedding 𝑬e is given by:
𝑬e = ∑ 𝐴𝑖s ∙ 𝒉𝑖
e
𝑚
𝑖
. (6)
21
In this way, the embedding 𝑬e summarizes the exploit texts information according to the relationships
across exploit and vulnerability texts and the relationship within the exploit texts.
Step 6 (DNN Processing with Shared Dense Layer(s)): The focused exploit embedding 𝑬e and the last
output of the Bi-LSTM assigned to the vulnerability text 𝒉𝑛v (that summarizes information of all
vulnerability letter trigrams) are both embeddings that summarize the input trigram sequences. To facilitate
embedding similarity calculation, we input both generated embeddings into shared dense layers to project
them into the same embedding space (Step 7). Formally, 𝑹e = ShareDense(𝑬e), 𝑹v = ShareDense(𝒉𝑛v )
where ShareDense(∙) refers to the projection of the same dense layers.
Step 7 (Computing Embedding Similarity): Cosine similarity computes the distance between 𝑹e and 𝑹v.
Consistent with Huang et al. (2013), the softmax is used to obtain conditional probability of 𝑃(E|V) and
the loss function is defined as
ℒ = − log ∏ 𝑃(E|V+)
E,V+
(7)
where 𝑉+ denote the relevant vulnerabilities. During the model training phase, the loss is backpropagated
to update network parameters according to gradient-based methods.
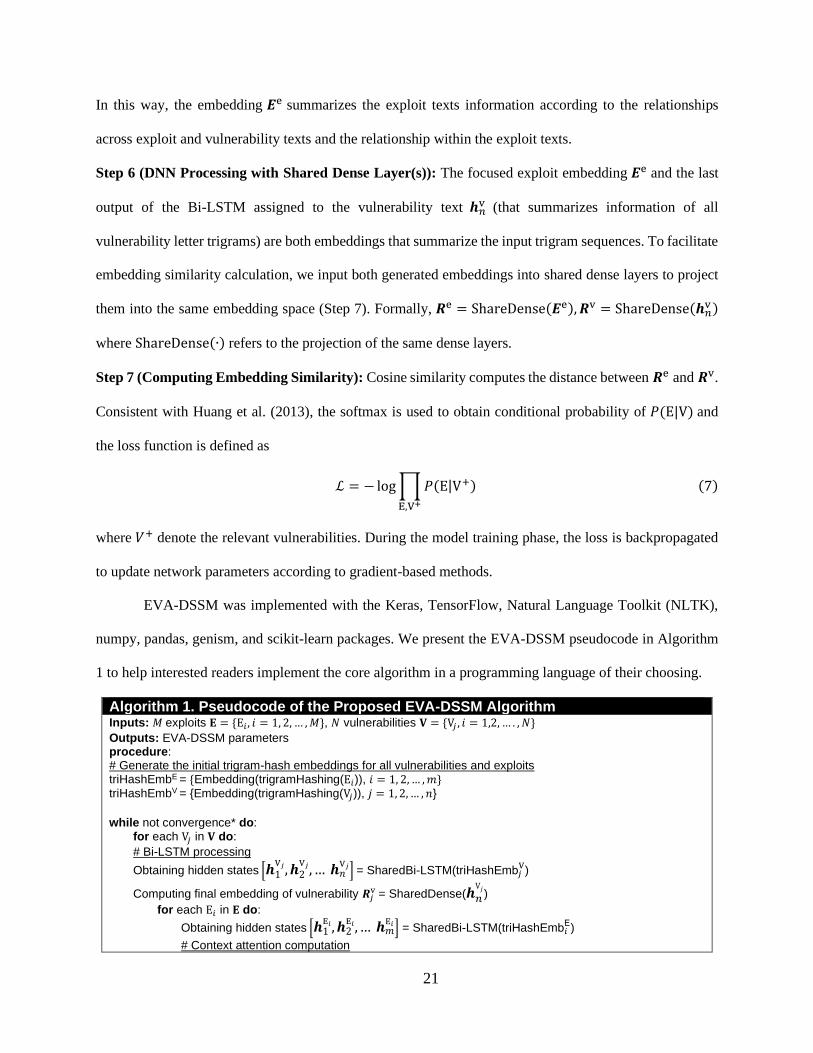
EVA-DSSM was implemented with the Keras, TensorFlow, Natural Language Toolkit (NLTK),
numpy, pandas, genism, and scikit-learn packages. We present the EVA-DSSM pseudocode in Algorithm
1 to help interested readers implement the core algorithm in a programming language of their choosing.
Algorithm 1. Pseudocode of the Proposed EVA-DSSM Algorithm
Inputs: 𝑀 exploits 𝐄 = {E𝑖 , 𝑖 = 1, 2, … , 𝑀}, 𝑁 vulnerabilities 𝐕 = {V𝑗 , 𝑖 = 1,2, … . , 𝑁}
Outputs: EVA-DSSM parameters procedure: # Generate the initial trigram-hash embeddings for all vulnerabilities and exploits triHashEmbE = {Embedding(trigramHashing(E𝑖)), 𝑖 = 1, 2, … , 𝑚} triHashEmbV = {Embedding(trigramHashing(V𝑗)), 𝑗 = 1, 2, … , 𝑛}
while not convergence* do:
for each V𝑗 in 𝐕 do:
# Bi-LSTM processing
Obtaining hidden states [𝒉1V𝑗, 𝒉2
V𝑗, … 𝒉𝑛V𝑗] = SharedBi-LSTM(triHashEmb𝑗
V)
Computing final embedding of vulnerability 𝑹𝑗v = SharedDense(𝒉𝑛
V𝑗)
for each E𝑖 in 𝐄 do:
Obtaining hidden states [𝒉1E𝑖, 𝒉2
E𝑖, … 𝒉𝑚E𝑖 ] = SharedBi-LSTM(triHashEmb𝑖
E)
# Context attention computation
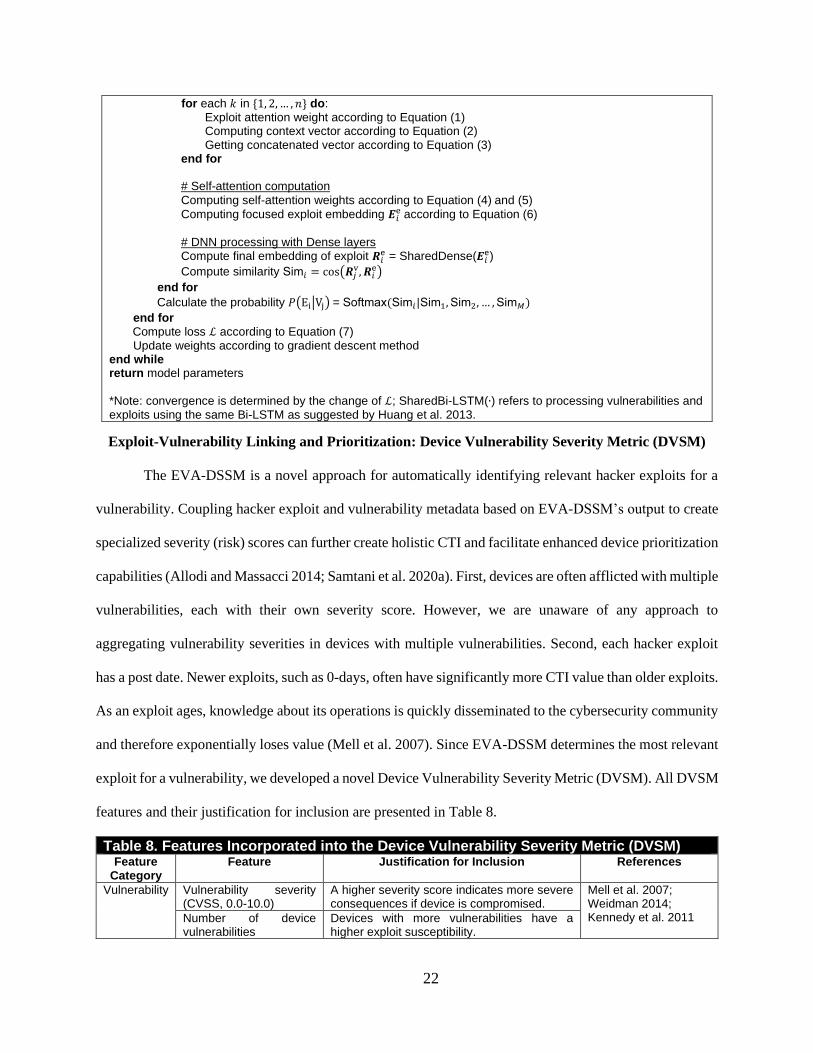
22
for each 𝑘 in {1, 2, … , 𝑛} do: Exploit attention weight according to Equation (1) Computing context vector according to Equation (2) Getting concatenated vector according to Equation (3)
end for
# Self-attention computation
Computing self-attention weights according to Equation (4) and (5)
Computing focused exploit embedding 𝑬𝑖e according to Equation (6)
# DNN processing with Dense layers Compute final embedding of exploit 𝑹𝑖
e = SharedDense(𝑬𝑖e)
Compute similarity Sim𝑖 = cos(𝑹𝑗v, 𝑹𝑖
e)
end for
Calculate the probability 𝑃(Ei|Vj) = Softmax(Sim𝑖|Sim1, Sim2, … , Sim𝑀)
end for Compute loss ℒ according to Equation (7)
Update weights according to gradient descent method end while return model parameters *Note: convergence is determined by the change of ℒ; SharedBi-LSTM(∙) refers to processing vulnerabilities and exploits using the same Bi-LSTM as suggested by Huang et al. 2013.
Exploit-Vulnerability Linking and Prioritization: Device Vulnerability Severity Metric (DVSM)
The EVA-DSSM is a novel approach for automatically identifying relevant hacker exploits for a
vulnerability. Coupling hacker exploit and vulnerability metadata based on EVA-DSSM’s output to create
specialized severity (risk) scores can further create holistic CTI and facilitate enhanced device prioritization
capabilities (Allodi and Massacci 2014; Samtani et al. 2020a). First, devices are often afflicted with multiple
vulnerabilities, each with their own severity score. However, we are unaware of any approach to
aggregating vulnerability severities in devices with multiple vulnerabilities. Second, each hacker exploit
has a post date. Newer exploits, such as 0-days, often have significantly more CTI value than older exploits.
As an exploit ages, knowledge about its operations is quickly disseminated to the cybersecurity community
and therefore exponentially loses value (Mell et al. 2007). Since EVA-DSSM determines the most relevant
exploit for a vulnerability, we developed a novel Device Vulnerability Severity Metric (DVSM). All DVSM
features and their justification for inclusion are presented in Table 8.
Table 8. Features Incorporated into the Device Vulnerability Severity Metric (DVSM) Feature
Category Feature Justification for Inclusion References
Vulnerability Vulnerability severity (CVSS, 0.0-10.0)
A higher severity score indicates more severe consequences if device is compromised.
Mell et al. 2007; Weidman 2014; Kennedy et al. 2011 Number of device
vulnerabilities Devices with more vulnerabilities have a higher exploit susceptibility.
23
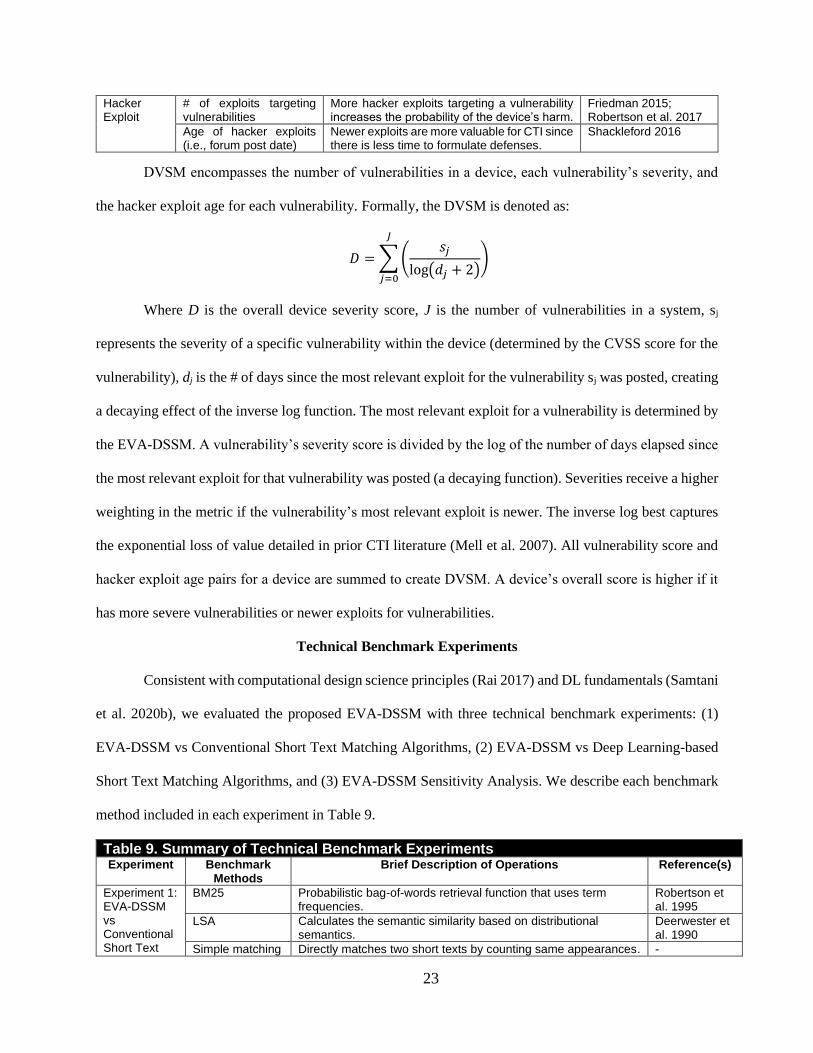
Hacker Exploit
# of exploits targeting vulnerabilities
More hacker exploits targeting a vulnerability increases the probability of the device’s harm.
Friedman 2015; Robertson et al. 2017
Age of hacker exploits (i.e., forum post date)
Newer exploits are more valuable for CTI since there is less time to formulate defenses.
Shackleford 2016
DVSM encompasses the number of vulnerabilities in a device, each vulnerability’s severity, and
the hacker exploit age for each vulnerability. Formally, the DVSM is denoted as:
𝐷 = ∑ (𝑠𝑗
log(𝑑𝑗 + 2))
𝐽
𝑗=0
Where D is the overall device severity score, J is the number of vulnerabilities in a system, sj
represents the severity of a specific vulnerability within the device (determined by the CVSS score for the
vulnerability), dj is the # of days since the most relevant exploit for the vulnerability sj was posted, creating
a decaying effect of the inverse log function. The most relevant exploit for a vulnerability is determined by
the EVA-DSSM. A vulnerability’s severity score is divided by the log of the number of days elapsed since
the most relevant exploit for that vulnerability was posted (a decaying function). Severities receive a higher
weighting in the metric if the vulnerability’s most relevant exploit is newer. The inverse log best captures
the exponential loss of value detailed in prior CTI literature (Mell et al. 2007). All vulnerability score and
hacker exploit age pairs for a device are summed to create DVSM. A device’s overall score is higher if it
has more severe vulnerabilities or newer exploits for vulnerabilities.
Technical Benchmark Experiments
Consistent with computational design science principles (Rai 2017) and DL fundamentals (Samtani
et al. 2020b), we evaluated the proposed EVA-DSSM with three technical benchmark experiments: (1)
EVA-DSSM vs Conventional Short Text Matching Algorithms, (2) EVA-DSSM vs Deep Learning-based
Short Text Matching Algorithms, and (3) EVA-DSSM Sensitivity Analysis. We describe each benchmark
method included in each experiment in Table 9.
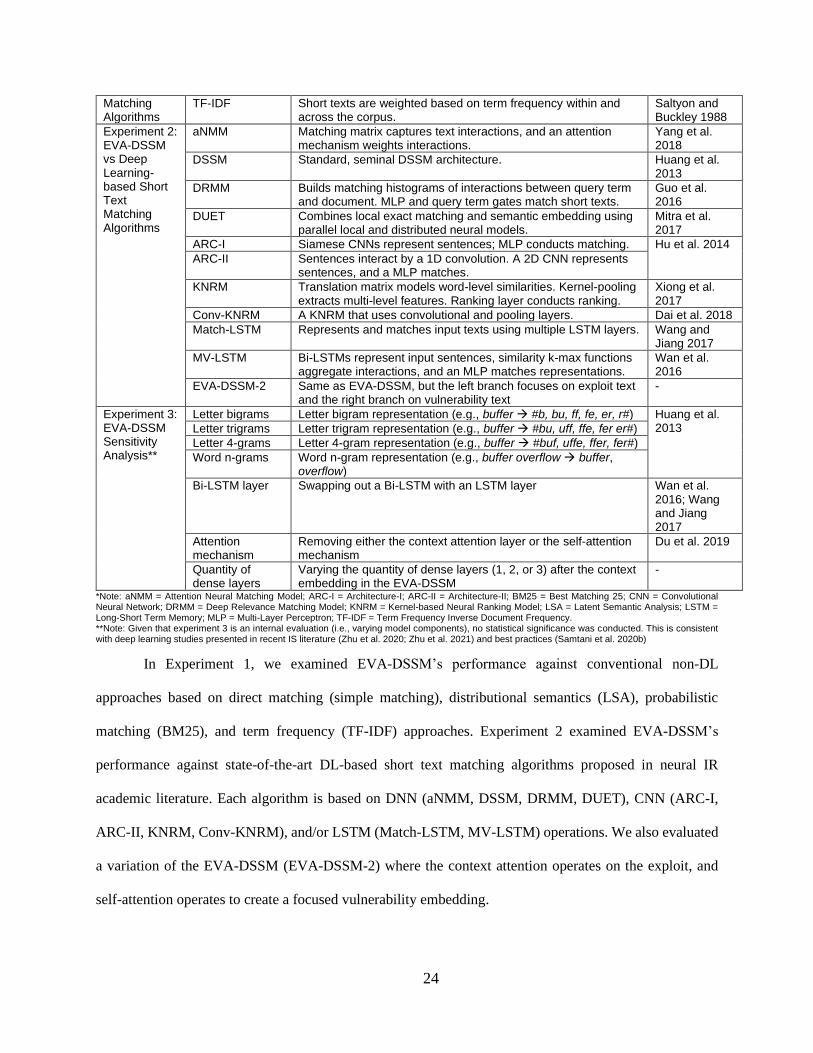
Table 9. Summary of Technical Benchmark Experiments Experiment Benchmark
Methods Brief Description of Operations Reference(s)
Experiment 1: EVA-DSSM vs Conventional Short Text
BM25 Probabilistic bag-of-words retrieval function that uses term frequencies.
Robertson et al. 1995
LSA Calculates the semantic similarity based on distributional semantics.
Deerwester et al. 1990
Simple matching Directly matches two short texts by counting same appearances. -
24
Matching Algorithms
TF-IDF Short texts are weighted based on term frequency within and across the corpus.
Saltyon and Buckley 1988
Experiment 2: EVA-DSSM vs Deep Learning-based Short Text Matching Algorithms
aNMM Matching matrix captures text interactions, and an attention mechanism weights interactions.
Yang et al. 2018
DSSM Standard, seminal DSSM architecture. Huang et al. 2013
DRMM Builds matching histograms of interactions between query term and document. MLP and query term gates match short texts.
Guo et al. 2016
DUET Combines local exact matching and semantic embedding using parallel local and distributed neural models.
Mitra et al. 2017
ARC-I Siamese CNNs represent sentences; MLP conducts matching. Hu et al. 2014
ARC-II Sentences interact by a 1D convolution. A 2D CNN represents sentences, and a MLP matches.
KNRM Translation matrix models word-level similarities. Kernel-pooling extracts multi-level features. Ranking layer conducts ranking.
Xiong et al. 2017
Conv-KNRM A KNRM that uses convolutional and pooling layers. Dai et al. 2018
Match-LSTM Represents and matches input texts using multiple LSTM layers. Wang and Jiang 2017
MV-LSTM Bi-LSTMs represent input sentences, similarity k-max functions aggregate interactions, and an MLP matches representations.
Wan et al. 2016
EVA-DSSM-2 Same as EVA-DSSM, but the left branch focuses on exploit text and the right branch on vulnerability text
-
Experiment 3: EVA-DSSM Sensitivity Analysis**
Letter bigrams Letter bigram representation (e.g., buffer → #b, bu, ff, fe, er, r#) Huang et al. 2013 Letter trigrams Letter trigram representation (e.g., buffer → #bu, uff, ffe, fer er#)
Letter 4-grams Letter 4-gram representation (e.g., buffer → #buf, uffe, ffer, fer#)
Word n-grams Word n-gram representation (e.g., buffer overflow → buffer, overflow)
Bi-LSTM layer Swapping out a Bi-LSTM with an LSTM layer Wan et al. 2016; Wang and Jiang 2017
Attention mechanism
Removing either the context attention layer or the self-attention mechanism
Du et al. 2019
Quantity of dense layers
Varying the quantity of dense layers (1, 2, or 3) after the context embedding in the EVA-DSSM
-
*Note: aNMM = Attention Neural Matching Model; ARC-I = Architecture-I; ARC-II = Architecture-II; BM25 = Best Matching 25; CNN = Convolutional Neural Network; DRMM = Deep Relevance Matching Model; KNRM = Kernel-based Neural Ranking Model; LSA = Latent Semantic Analysis; LSTM = Long-Short Term Memory; MLP = Multi-Layer Perceptron; TF-IDF = Term Frequency Inverse Document Frequency. **Note: Given that experiment 3 is an internal evaluation (i.e., varying model components), no statistical significance was conducted. This is consistent with deep learning studies presented in recent IS literature (Zhu et al. 2020; Zhu et al. 2021) and best practices (Samtani et al. 2020b)
In Experiment 1, we examined EVA-DSSM’s performance against conventional non-DL
approaches based on direct matching (simple matching), distributional semantics (LSA), probabilistic
matching (BM25), and term frequency (TF-IDF) approaches. Experiment 2 examined EVA-DSSM’s
performance against state-of-the-art DL-based short text matching algorithms proposed in neural IR
academic literature. Each algorithm is based on DNN (aNMM, DSSM, DRMM, DUET), CNN (ARC-I,
ARC-II, KNRM, Conv-KNRM), and/or LSTM (Match-LSTM, MV-LSTM) operations. We also evaluated
a variation of the EVA-DSSM (EVA-DSSM-2) where the context attention operates on the exploit, and
self-attention operates to create a focused vulnerability embedding.
25
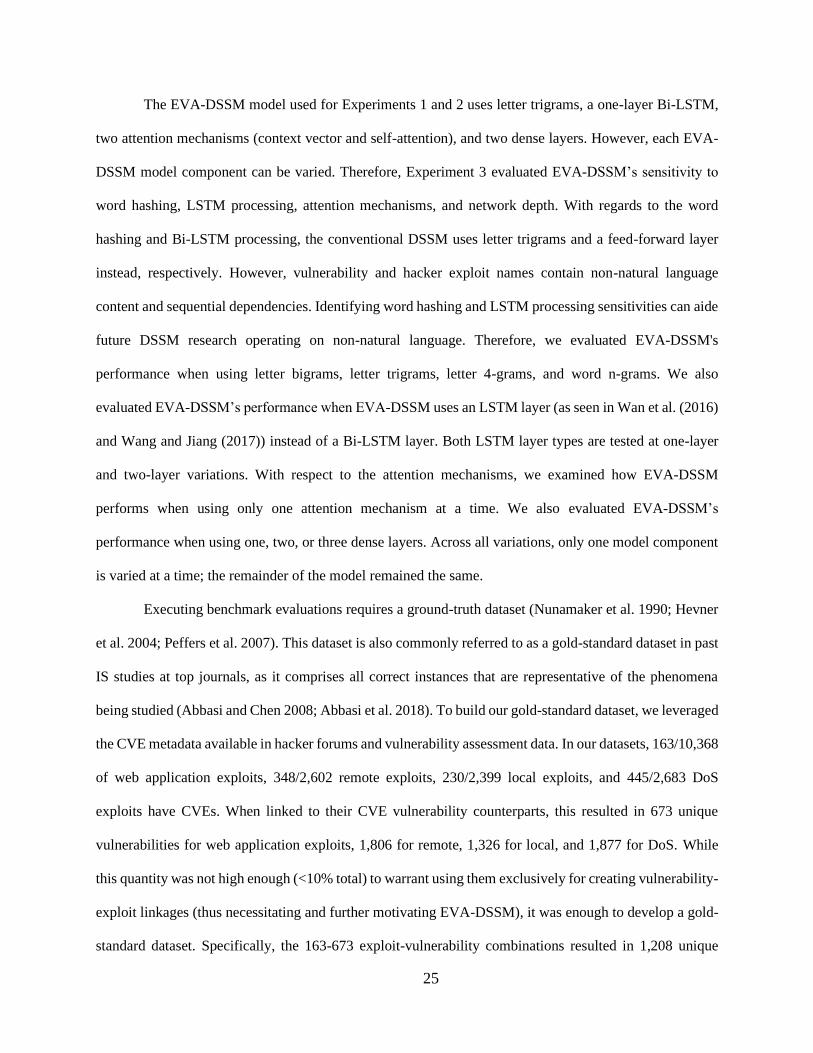
The EVA-DSSM model used for Experiments 1 and 2 uses letter trigrams, a one-layer Bi-LSTM,
two attention mechanisms (context vector and self-attention), and two dense layers. However, each EVA-
DSSM model component can be varied. Therefore, Experiment 3 evaluated EVA-DSSM’s sensitivity to
word hashing, LSTM processing, attention mechanisms, and network depth. With regards to the word
hashing and Bi-LSTM processing, the conventional DSSM uses letter trigrams and a feed-forward layer
instead, respectively. However, vulnerability and hacker exploit names contain non-natural language
content and sequential dependencies. Identifying word hashing and LSTM processing sensitivities can aide
future DSSM research operating on non-natural language. Therefore, we evaluated EVA-DSSM's
performance when using letter bigrams, letter trigrams, letter 4-grams, and word n-grams. We also
evaluated EVA-DSSM’s performance when EVA-DSSM uses an LSTM layer (as seen in Wan et al. (2016)
and Wang and Jiang (2017)) instead of a Bi-LSTM layer. Both LSTM layer types are tested at one-layer
and two-layer variations. With respect to the attention mechanisms, we examined how EVA-DSSM
performs when using only one attention mechanism at a time. We also evaluated EVA-DSSM’s
performance when using one, two, or three dense layers. Across all variations, only one model component
is varied at a time; the remainder of the model remained the same.
Executing benchmark evaluations requires a ground-truth dataset (Nunamaker et al. 1990; Hevner
et al. 2004; Peffers et al. 2007). This dataset is also commonly referred to as a gold-standard dataset in past
IS studies at top journals, as it comprises all correct instances that are representative of the phenomena
being studied (Abbasi and Chen 2008; Abbasi et al. 2018). To build our gold-standard dataset, we leveraged
the CVE metadata available in hacker forums and vulnerability assessment data. In our datasets, 163/10,368
of web application exploits, 348/2,602 remote exploits, 230/2,399 local exploits, and 445/2,683 DoS
exploits have CVEs. When linked to their CVE vulnerability counterparts, this resulted in 673 unique
vulnerabilities for web application exploits, 1,806 for remote, 1,326 for local, and 1,877 for DoS. While
this quantity was not high enough (<10% total) to warrant using them exclusively for creating vulnerability-
exploit linkages (thus necessitating and further motivating EVA-DSSM), it was enough to develop a gold-
standard dataset. Specifically, the 163-673 exploit-vulnerability combinations resulted in 1,208 unique
26
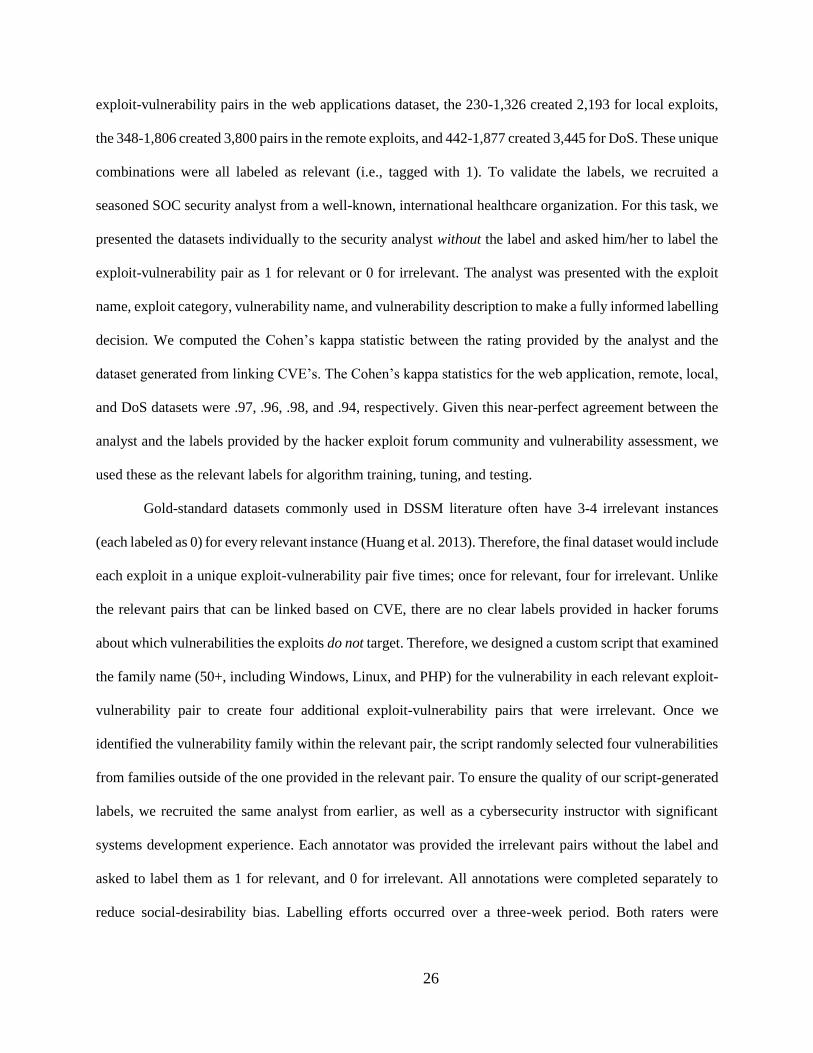
exploit-vulnerability pairs in the web applications dataset, the 230-1,326 created 2,193 for local exploits,
the 348-1,806 created 3,800 pairs in the remote exploits, and 442-1,877 created 3,445 for DoS. These unique
combinations were all labeled as relevant (i.e., tagged with 1). To validate the labels, we recruited a
seasoned SOC security analyst from a well-known, international healthcare organization. For this task, we
presented the datasets individually to the security analyst without the label and asked him/her to label the
exploit-vulnerability pair as 1 for relevant or 0 for irrelevant. The analyst was presented with the exploit
name, exploit category, vulnerability name, and vulnerability description to make a fully informed labelling
decision. We computed the Cohen’s kappa statistic between the rating provided by the analyst and the
dataset generated from linking CVE’s. The Cohen’s kappa statistics for the web application, remote, local,
and DoS datasets were .97, .96, .98, and .94, respectively. Given this near-perfect agreement between the
analyst and the labels provided by the hacker exploit forum community and vulnerability assessment, we
used these as the relevant labels for algorithm training, tuning, and testing.
Gold-standard datasets commonly used in DSSM literature often have 3-4 irrelevant instances
(each labeled as 0) for every relevant instance (Huang et al. 2013). Therefore, the final dataset would include
each exploit in a unique exploit-vulnerability pair five times; once for relevant, four for irrelevant. Unlike
the relevant pairs that can be linked based on CVE, there are no clear labels provided in hacker forums
about which vulnerabilities the exploits do not target. Therefore, we designed a custom script that examined
the family name (50+, including Windows, Linux, and PHP) for the vulnerability in each relevant exploit-
vulnerability pair to create four additional exploit-vulnerability pairs that were irrelevant. Once we
identified the vulnerability family within the relevant pair, the script randomly selected four vulnerabilities
from families outside of the one provided in the relevant pair. To ensure the quality of our script-generated
labels, we recruited the same analyst from earlier, as well as a cybersecurity instructor with significant
systems development experience. Each annotator was provided the irrelevant pairs without the label and
asked to label them as 1 for relevant, and 0 for irrelevant. All annotations were completed separately to
reduce social-desirability bias. Labelling efforts occurred over a three-week period. Both raters were
27
presented with the exploit name, exploit category, vulnerability name, and vulnerability description without
the label. Raters were instructed not to complete more than 2,000 ratings within a two-hour period.
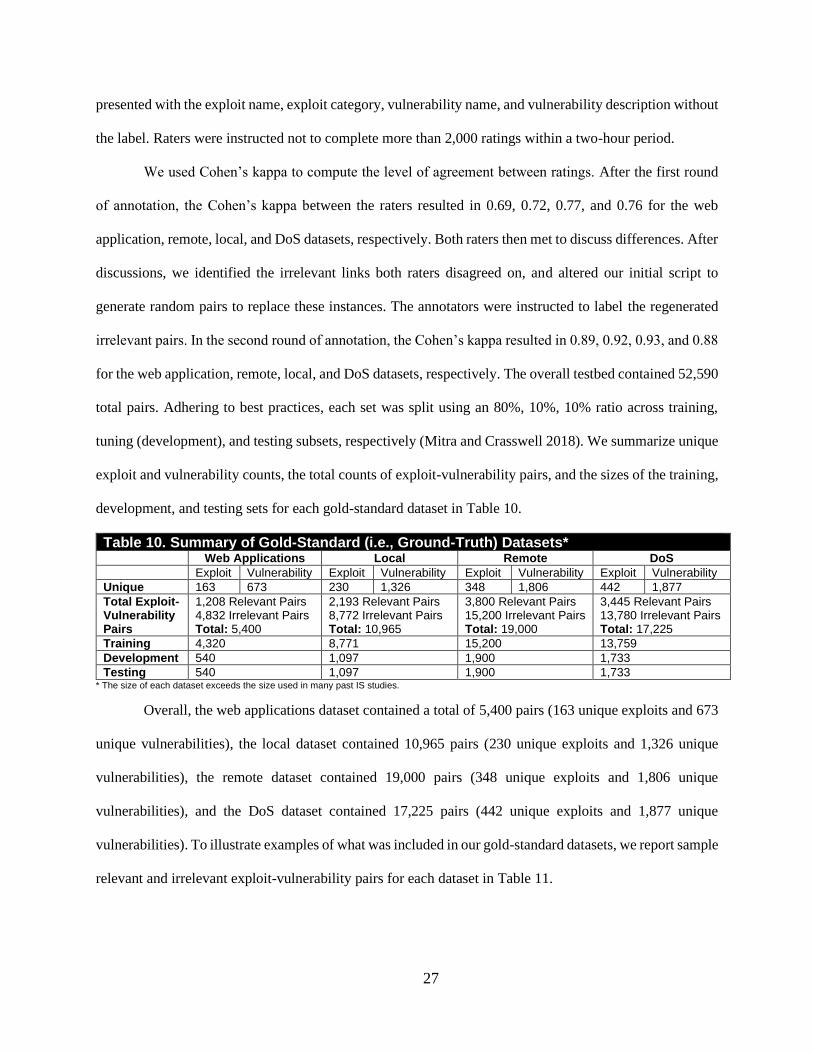
We used Cohen’s kappa to compute the level of agreement between ratings. After the first round
of annotation, the Cohen’s kappa between the raters resulted in 0.69, 0.72, 0.77, and 0.76 for the web
application, remote, local, and DoS datasets, respectively. Both raters then met to discuss differences. After
discussions, we identified the irrelevant links both raters disagreed on, and altered our initial script to
generate random pairs to replace these instances. The annotators were instructed to label the regenerated
irrelevant pairs. In the second round of annotation, the Cohen’s kappa resulted in 0.89, 0.92, 0.93, and 0.88
for the web application, remote, local, and DoS datasets, respectively. The overall testbed contained 52,590
total pairs. Adhering to best practices, each set was split using an 80%, 10%, 10% ratio across training,
tuning (development), and testing subsets, respectively (Mitra and Crasswell 2018). We summarize unique
exploit and vulnerability counts, the total counts of exploit-vulnerability pairs, and the sizes of the training,
development, and testing sets for each gold-standard dataset in Table 10.
Table 10. Summary of Gold-Standard (i.e., Ground-Truth) Datasets* Web Applications Local Remote DoS
Exploit Vulnerability Exploit Vulnerability Exploit Vulnerability Exploit Vulnerability
Unique 163 673 230 1,326 348 1,806 442 1,877
Total Exploit-Vulnerability Pairs
1,208 Relevant Pairs 4,832 Irrelevant Pairs Total: 5,400
2,193 Relevant Pairs 8,772 Irrelevant Pairs Total: 10,965
3,800 Relevant Pairs 15,200 Irrelevant Pairs Total: 19,000
3,445 Relevant Pairs 13,780 Irrelevant Pairs Total: 17,225
Training 4,320 8,771 15,200 13,759
Development 540 1,097 1,900 1,733
Testing 540 1,097 1,900 1,733 * The size of each dataset exceeds the size used in many past IS studies.
Overall, the web applications dataset contained a total of 5,400 pairs (163 unique exploits and 673
unique vulnerabilities), the local dataset contained 10,965 pairs (230 unique exploits and 1,326 unique
vulnerabilities), the remote dataset contained 19,000 pairs (348 unique exploits and 1,806 unique
vulnerabilities), and the DoS dataset contained 17,225 pairs (442 unique exploits and 1,877 unique
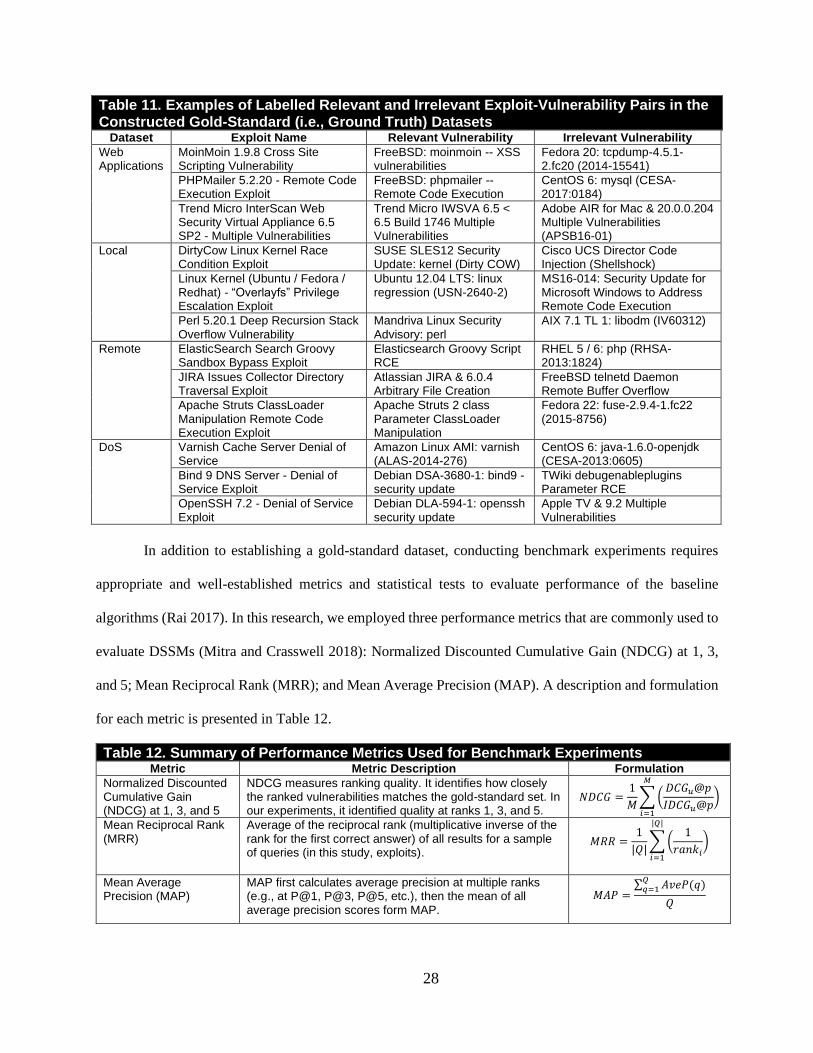
vulnerabilities). To illustrate examples of what was included in our gold-standard datasets, we report sample
relevant and irrelevant exploit-vulnerability pairs for each dataset in Table 11.
28
Table 11. Examples of Labelled Relevant and Irrelevant Exploit-Vulnerability Pairs in the Constructed Gold-Standard (i.e., Ground Truth) Datasets
Dataset Exploit Name Relevant Vulnerability Irrelevant Vulnerability
Web Applications
MoinMoin 1.9.8 Cross Site Scripting Vulnerability
FreeBSD: moinmoin -- XSS vulnerabilities
Fedora 20: tcpdump-4.5.1-2.fc20 (2014-15541)
PHPMailer 5.2.20 - Remote Code Execution Exploit
FreeBSD: phpmailer -- Remote Code Execution
CentOS 6: mysql (CESA-2017:0184)
Trend Micro InterScan Web Security Virtual Appliance 6.5 SP2 - Multiple Vulnerabilities
Trend Micro IWSVA 6.5 < 6.5 Build 1746 Multiple Vulnerabilities
Adobe AIR for Mac & 20.0.0.204 Multiple Vulnerabilities (APSB16-01)
Local DirtyCow Linux Kernel Race Condition Exploit
SUSE SLES12 Security Update: kernel (Dirty COW)
Cisco UCS Director Code Injection (Shellshock)
Linux Kernel (Ubuntu / Fedora / Redhat) - “Overlayfs” Privilege Escalation Exploit
Ubuntu 12.04 LTS: linux regression (USN-2640-2)
MS16-014: Security Update for Microsoft Windows to Address Remote Code Execution
Perl 5.20.1 Deep Recursion Stack Overflow Vulnerability
Mandriva Linux Security Advisory: perl
AIX 7.1 TL 1: libodm (IV60312)
Remote ElasticSearch Search Groovy Sandbox Bypass Exploit
Elasticsearch Groovy Script RCE
RHEL 5 / 6: php (RHSA-2013:1824)
JIRA Issues Collector Directory Traversal Exploit
Atlassian JIRA & 6.0.4 Arbitrary File Creation
FreeBSD telnetd Daemon Remote Buffer Overflow
Apache Struts ClassLoader Manipulation Remote Code Execution Exploit
Apache Struts 2 class Parameter ClassLoader Manipulation
Fedora 22: fuse-2.9.4-1.fc22 (2015-8756)
DoS Varnish Cache Server Denial of Service
Amazon Linux AMI: varnish (ALAS-2014-276)
CentOS 6: java-1.6.0-openjdk (CESA-2013:0605)
Bind 9 DNS Server - Denial of Service Exploit
Debian DSA-3680-1: bind9 - security update
TWiki debugenableplugins Parameter RCE
OpenSSH 7.2 - Denial of Service Exploit
Debian DLA-594-1: openssh security update
Apple TV & 9.2 Multiple Vulnerabilities
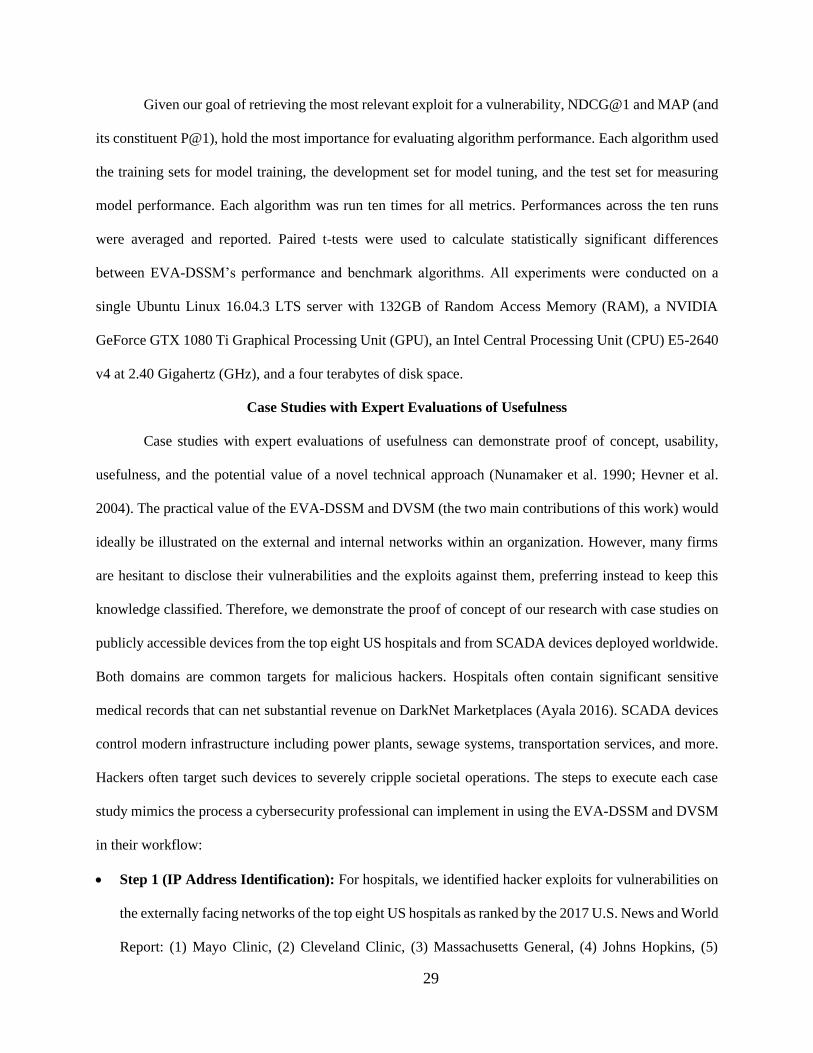
In addition to establishing a gold-standard dataset, conducting benchmark experiments requires
appropriate and well-established metrics and statistical tests to evaluate performance of the baseline
algorithms (Rai 2017). In this research, we employed three performance metrics that are commonly used to
evaluate DSSMs (Mitra and Crasswell 2018): Normalized Discounted Cumulative Gain (NDCG) at 1, 3,
and 5; Mean Reciprocal Rank (MRR); and Mean Average Precision (MAP). A description and formulation
for each metric is presented in Table 12.
Table 12. Summary of Performance Metrics Used for Benchmark Experiments Metric Metric Description Formulation
Normalized Discounted Cumulative Gain (NDCG) at 1, 3, and 5
NDCG measures ranking quality. It identifies how closely the ranked vulnerabilities matches the gold-standard set. In our experiments, it identified quality at ranks 1, 3, and 5.
𝑁𝐷𝐶𝐺 =1
𝑀∑ (
𝐷𝐶𝐺𝑢@𝑝
𝐼𝐷𝐶𝐺𝑢@𝑝)
𝑀
𝑖=1
Mean Reciprocal Rank (MRR)
Average of the reciprocal rank (multiplicative inverse of the rank for the first correct answer) of all results for a sample of queries (in this study, exploits).
𝑀𝑅𝑅 =1
|𝑄|∑ (
1
𝑟𝑎𝑛𝑘𝑖)
|𝑄|
𝑖=1
Mean Average Precision (MAP)
MAP first calculates average precision at multiple ranks (e.g., at P@1, P@3, P@5, etc.), then the mean of all average precision scores form MAP.
𝑀𝐴𝑃 =∑ 𝐴𝑣𝑒𝑃(𝑞)
𝑄𝑞=1
𝑄
29
Given our goal of retrieving the most relevant exploit for a vulnerability, NDCG@1 and MAP (and
its constituent P@1), hold the most importance for evaluating algorithm performance. Each algorithm used
the training sets for model training, the development set for model tuning, and the test set for measuring
model performance. Each algorithm was run ten times for all metrics. Performances across the ten runs
were averaged and reported. Paired t-tests were used to calculate statistically significant differences
between EVA-DSSM’s performance and benchmark algorithms. All experiments were conducted on a
single Ubuntu Linux 16.04.3 LTS server with 132GB of Random Access Memory (RAM), a NVIDIA
GeForce GTX 1080 Ti Graphical Processing Unit (GPU), an Intel Central Processing Unit (CPU) E5-2640
v4 at 2.40 Gigahertz (GHz), and a four terabytes of disk space.
Case Studies with Expert Evaluations of Usefulness
Case studies with expert evaluations of usefulness can demonstrate proof of concept, usability,
usefulness, and the potential value of a novel technical approach (Nunamaker et al. 1990; Hevner et al.
2004). The practical value of the EVA-DSSM and DVSM (the two main contributions of this work) would
ideally be illustrated on the external and internal networks within an organization. However, many firms
are hesitant to disclose their vulnerabilities and the exploits against them, preferring instead to keep this
knowledge classified. Therefore, we demonstrate the proof of concept of our research with case studies on
publicly accessible devices from the top eight US hospitals and from SCADA devices deployed worldwide.
Both domains are common targets for malicious hackers. Hospitals often contain significant sensitive
medical records that can net substantial revenue on DarkNet Marketplaces (Ayala 2016). SCADA devices
control modern infrastructure including power plants, sewage systems, transportation services, and more.
Hackers often target such devices to severely cripple societal operations. The steps to execute each case
study mimics the process a cybersecurity professional can implement in using the EVA-DSSM and DVSM
in their workflow:
• Step 1 (IP Address Identification): For hospitals, we identified hacker exploits for vulnerabilities on
the externally facing networks of the top eight US hospitals as ranked by the 2017 U.S. News and World
Report: (1) Mayo Clinic, (2) Cleveland Clinic, (3) Massachusetts General, (4) Johns Hopkins, (5)
30
University of California, Los Angeles (UCLA) Medical Center, (6) New York Presbyterian, (7)
University of California, San Francisco (UCSF) Medical Center, and (8) Northwestern Memorial.
Shodan, a search engine that discovers publicly accessible Internet-of-Things (IoT) devices, then finds
all devices available on each hospital’s IP range. For the SCADA case study, we retrieved 20,641
SCADA devices and their IPs from Shodan using SCADA-specific vendor keywords (e.g., Rockwell,
Siemens, and Schneider). Retrieving SCADA devices in this fashion is consistent with past
vulnerability assessment literature (Samtani et al. 2016; El et al. 2017; Samtani et al. 2018).
• Step 2 (Vulnerability Assessment): Consistent with best practices, we used Nessus, a state-of-the-art
vulnerability assessment tool, to discover the vulnerabilities of each device without port scanning and
payload dropping. Scanning for vulnerabilities in this fashion has been noted in past literature to avoid
adverse events (e.g., downtime) (Harrell et al. 2018; Williams et al. 2017; McMahon et al. 2017;
McMahon et al. 2018; Lazarine et al. 2020; Ullman et al. 2020).
• Step 3 (Exploit-Vulnerability Linking via EVA-DSSM): After identifying vulnerabilities, EVA-
DSSM determined the most relevant hacker exploit for each vulnerability. To emulate a cybersecurity
analyst’s workflow (Farris et al. 2018), we only considered the top linked exploit for DVSM.
• Step 4 (Risk Management via DVSM): After creating exploit-vulnerability links, we used the
metadata from the exploit (post date) and vulnerability (CVSS score) for each exploit-vulnerability pair
for each device. The DVSM score for each device is computed using these data. The final outputted
DVSM values are ranked in descending order to help facilitate vulnerable device prioritization.
The exploit-vulnerability linkages identified by EVA-DSSM and the DVSM scores can offer
cybersecurity experts an excellent starting point for their mitigation and remediation activities. However, it
is impossible to validate whether the EVA-DSSM exploit can take advantage of the detected vulnerability
without executing the exploit. Such an act has significant legal and ethical ramifications. Moreover, even
if vulnerabilities were susceptible to detected exploits, the usefulness and value of these linkages may vary
within and between organizations due to technical capabilities, security priorities, and organizational
policies. Therefore, we aimed to conduct a complementary user evaluation that aimed to ascertain how
31
useful cybersecurity professionals find the results of our proposed EVA-DSSM and DVSM compared to
results outputted from baseline approaches (e.g., DSSM and CVSS). To execute this evaluation, we sent
over 60 email invitations through our university’s cybersecurity centers to identify cybersecurity experts
that were willing to evaluate the usefulness of our proposed approaches. In total, 45 cybersecurity experts
responded to the invitation. Each expert possessed at least five years of experience in roles pertaining to
Security Operations Centers (SOCs), Incident Response (IR), vulnerability management, Dark Web
analytics, IT audit, and/or operational cybersecurity. Each position would likely use EVA-DSSM and
DVSM in their professional practice. No incentive or compensation was provided for the participant, since
the time commitment was expected to be less than 15-20 minutes.
We instructed each cybersecurity expert to evaluate the perceived usefulness of the exploit-
vulnerability pairs generated from the EVA-DSSM against those generated from benchmark approaches
(e.g., DSSM). For each generated exploit-vulnerability pair, we also asked each expert to evaluate the
usefulness of the DVSM against CVSS. Following common practice in IS literature (Abbasi et al. 2018;
Chau et al. 2020), we adapted items pertaining to perceived usefulness from Davis (1989), Davis et al.
(1989), and Venkatesh et al. (2003). For the exploit-vulnerability pair, the experts were asked if “the exploit-
vulnerability link is useful for identifying what exploit could target this vulnerability.” The experts were
also asked if “the risk score is useful to prioritize exploit-vulnerability pairs more effectively” for the DVSM
and CVSS scores. Adapting items in this fashion helps ensure the face validity of the items as well as
correctly measure the phenomena of interest (i.e., construct validity) (Abbasi et al. 2018; Chau et al. 2020).
For both items, we asked the experts to provide their responses on a scale of 1-7 (with 1 being strongly
disagree and 7 being strongly agree). Exploit-vulnerability pairs with their associated severity scores were
randomly interspersed and blinded (i.e., no details were provided about which algorithm or severity metric
produced the results) for the hospital and SCADA case studies. The experts were not allowed to consult
with each other to avoid biases. We calculated the mean for each item and used a paired t-test to identify if
a statistically significant difference between our proposed approach and the benchmark (i.e., EVA-DSSM
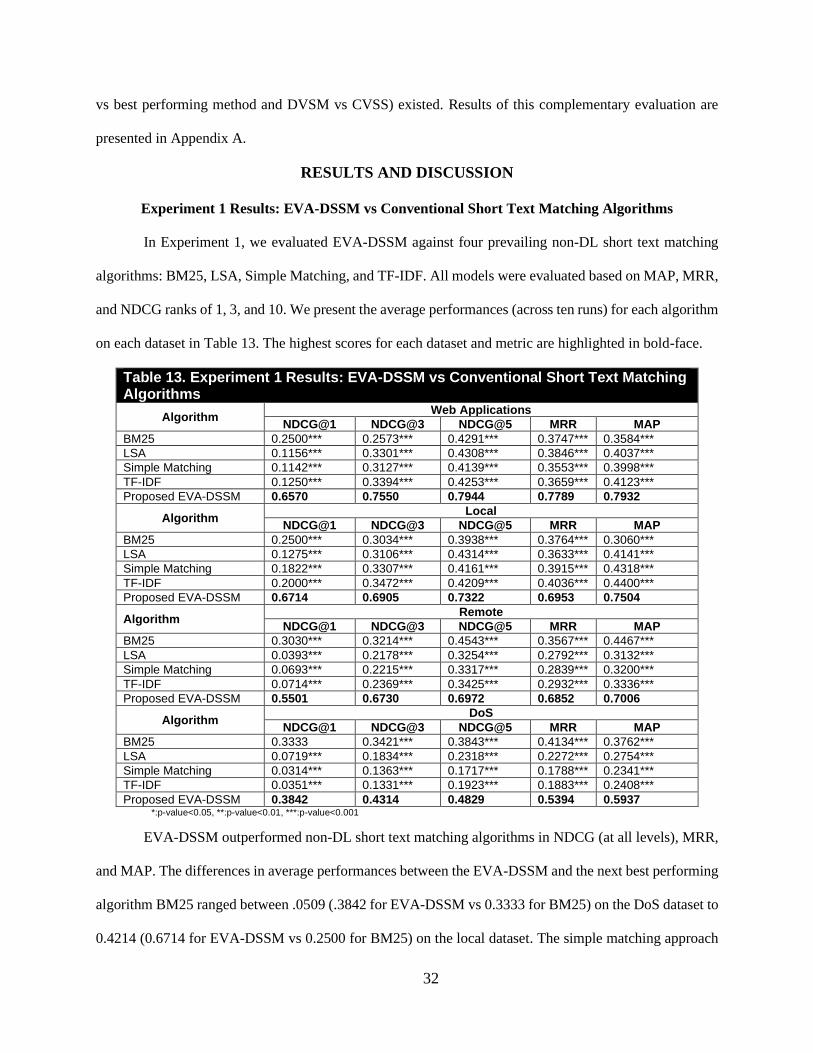
32
vs best performing method and DVSM vs CVSS) existed. Results of this complementary evaluation are
presented in Appendix A.
RESULTS AND DISCUSSION
Experiment 1 Results: EVA-DSSM vs Conventional Short Text Matching Algorithms
In Experiment 1, we evaluated EVA-DSSM against four prevailing non-DL short text matching
algorithms: BM25, LSA, Simple Matching, and TF-IDF. All models were evaluated based on MAP, MRR,
and NDCG ranks of 1, 3, and 10. We present the average performances (across ten runs) for each algorithm
on each dataset in Table 13. The highest scores for each dataset and metric are highlighted in bold-face.
Table 13. Experiment 1 Results: EVA-DSSM vs Conventional Short Text Matching Algorithms
Algorithm Web Applications
NDCG@1 NDCG@3 NDCG@5 MRR MAP
BM25 0.2500*** 0.2573*** 0.4291*** 0.3747*** 0.3584***
LSA 0.1156*** 0.3301*** 0.4308*** 0.3846*** 0.4037***
Simple Matching 0.1142*** 0.3127*** 0.4139*** 0.3553*** 0.3998***
TF-IDF 0.1250*** 0.3394*** 0.4253*** 0.3659*** 0.4123***
Proposed EVA-DSSM 0.6570 0.7550 0.7944 0.7789 0.7932
Algorithm Local
NDCG@1 NDCG@3 NDCG@5 MRR MAP
BM25 0.2500*** 0.3034*** 0.3938*** 0.3764*** 0.3060***
LSA 0.1275*** 0.3106*** 0.4314*** 0.3633*** 0.4141***
Simple Matching 0.1822*** 0.3307*** 0.4161*** 0.3915*** 0.4318***
TF-IDF 0.2000*** 0.3472*** 0.4209*** 0.4036*** 0.4400***
Proposed EVA-DSSM 0.6714 0.6905 0.7322 0.6953 0.7504
Algorithm Remote
NDCG@1 NDCG@3 NDCG@5 MRR MAP
BM25 0.3030*** 0.3214*** 0.4543*** 0.3567*** 0.4467***
LSA 0.0393*** 0.2178*** 0.3254*** 0.2792*** 0.3132***
Simple Matching 0.0693*** 0.2215*** 0.3317*** 0.2839*** 0.3200***
TF-IDF 0.0714*** 0.2369*** 0.3425*** 0.2932*** 0.3336***
Proposed EVA-DSSM 0.5501 0.6730 0.6972 0.6852 0.7006
Algorithm DoS
NDCG@1 NDCG@3 NDCG@5 MRR MAP
BM25 0.3333 0.3421*** 0.3843*** 0.4134*** 0.3762***
LSA 0.0719*** 0.1834*** 0.2318*** 0.2272*** 0.2754***
Simple Matching 0.0314*** 0.1363*** 0.1717*** 0.1788*** 0.2341***
TF-IDF 0.0351*** 0.1331*** 0.1923*** 0.1883*** 0.2408***
Proposed EVA-DSSM 0.3842 0.4314 0.4829 0.5394 0.5937 *:p-value<0.05, **:p-value<0.01, ***:p-value<0.001
EVA-DSSM outperformed non-DL short text matching algorithms in NDCG (at all levels), MRR,
and MAP. The differences in average performances between the EVA-DSSM and the next best performing
algorithm BM25 ranged between .0509 (.3842 for EVA-DSSM vs 0.3333 for BM25) on the DoS dataset to
0.4214 (0.6714 for EVA-DSSM vs 0.2500 for BM25) on the local dataset. The simple matching approach
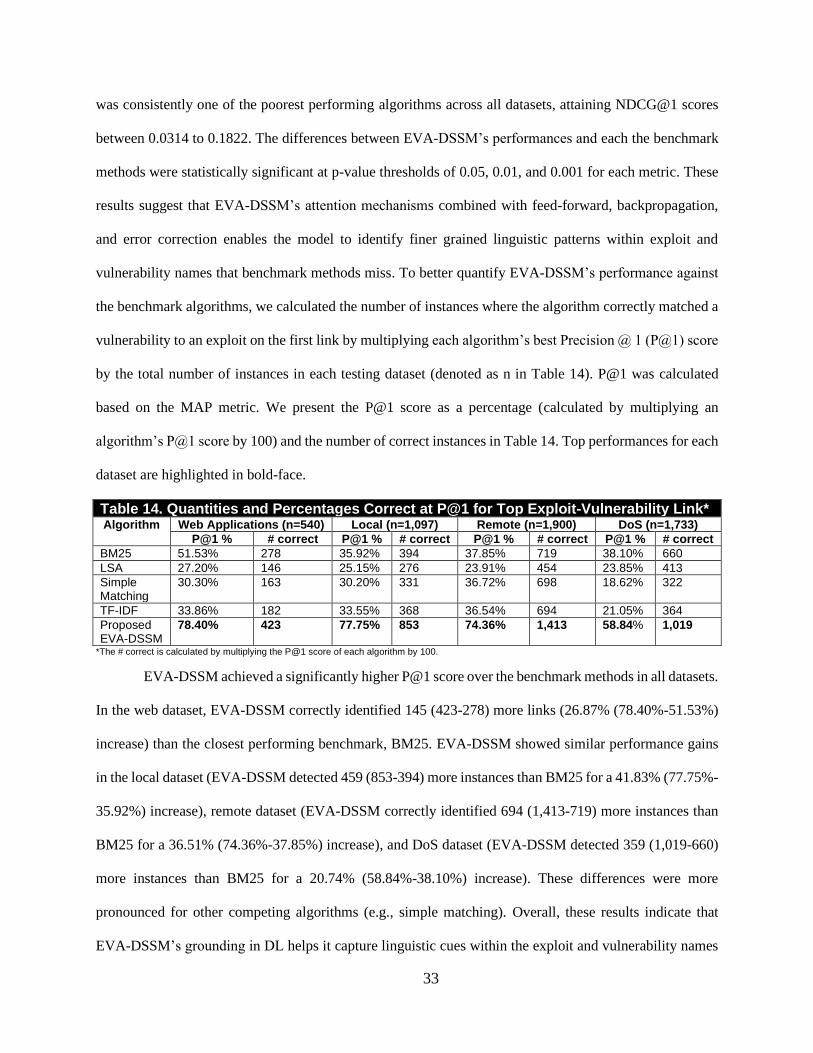
33
was consistently one of the poorest performing algorithms across all datasets, attaining NDCG@1 scores
between 0.0314 to 0.1822. The differences between EVA-DSSM’s performances and each the benchmark
methods were statistically significant at p-value thresholds of 0.05, 0.01, and 0.001 for each metric. These
results suggest that EVA-DSSM’s attention mechanisms combined with feed-forward, backpropagation,
and error correction enables the model to identify finer grained linguistic patterns within exploit and
vulnerability names that benchmark methods miss. To better quantify EVA-DSSM’s performance against
the benchmark algorithms, we calculated the number of instances where the algorithm correctly matched a
vulnerability to an exploit on the first link by multiplying each algorithm’s best Precision @ 1 (P@1) score
by the total number of instances in each testing dataset (denoted as n in Table 14). P@1 was calculated
based on the MAP metric. We present the P@1 score as a percentage (calculated by multiplying an
algorithm’s P@1 score by 100) and the number of correct instances in Table 14. Top performances for each
dataset are highlighted in bold-face.
Table 14. Quantities and Percentages Correct at P@1 for Top Exploit-Vulnerability Link* Algorithm Web Applications (n=540) Local (n=1,097) Remote (n=1,900) DoS (n=1,733)
P@1 % # correct P@1 % # correct P@1 % # correct P@1 % # correct
BM25 51.53% 278 35.92% 394 37.85% 719 38.10% 660
LSA 27.20% 146 25.15% 276 23.91% 454 23.85% 413
Simple Matching
30.30% 163 30.20% 331 36.72% 698 18.62% 322
TF-IDF 33.86% 182 33.55% 368 36.54% 694 21.05% 364
Proposed EVA-DSSM
78.40% 423 77.75% 853 74.36% 1,413 58.84% 1,019
*The # correct is calculated by multiplying the P@1 score of each algorithm by 100.
EVA-DSSM achieved a significantly higher P@1 score over the benchmark methods in all datasets.
In the web dataset, EVA-DSSM correctly identified 145 (423-278) more links (26.87% (78.40%-51.53%)
increase) than the closest performing benchmark, BM25. EVA-DSSM showed similar performance gains
in the local dataset (EVA-DSSM detected 459 (853-394) more instances than BM25 for a 41.83% (77.75%-
35.92%) increase), remote dataset (EVA-DSSM correctly identified 694 (1,413-719) more instances than
BM25 for a 36.51% (74.36%-37.85%) increase), and DoS dataset (EVA-DSSM detected 359 (1,019-660)
more instances than BM25 for a 20.74% (58.84%-38.10%) increase). These differences were more
pronounced for other competing algorithms (e.g., simple matching). Overall, these results indicate that
EVA-DSSM’s grounding in DL helps it capture linguistic cues within the exploit and vulnerability names
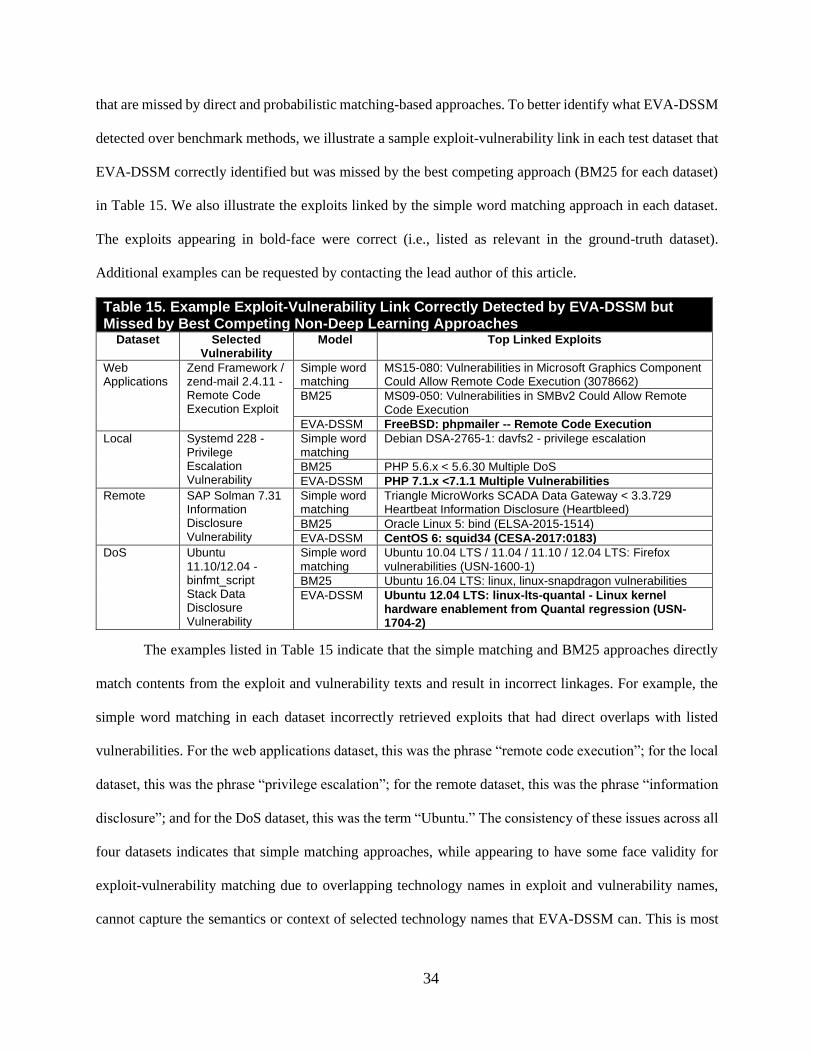
34
that are missed by direct and probabilistic matching-based approaches. To better identify what EVA-DSSM
detected over benchmark methods, we illustrate a sample exploit-vulnerability link in each test dataset that
EVA-DSSM correctly identified but was missed by the best competing approach (BM25 for each dataset)
in Table 15. We also illustrate the exploits linked by the simple word matching approach in each dataset.
The exploits appearing in bold-face were correct (i.e., listed as relevant in the ground-truth dataset).
Additional examples can be requested by contacting the lead author of this article.
Table 15. Example Exploit-Vulnerability Link Correctly Detected by EVA-DSSM but Missed by Best Competing Non-Deep Learning Approaches
Dataset Selected Vulnerability
Model Top Linked Exploits
Web Applications
Zend Framework / zend-mail 2.4.11 - Remote Code Execution Exploit
Simple word matching
MS15-080: Vulnerabilities in Microsoft Graphics Component Could Allow Remote Code Execution (3078662)
BM25 MS09-050: Vulnerabilities in SMBv2 Could Allow Remote Code Execution
EVA-DSSM FreeBSD: phpmailer -- Remote Code Execution
Local Systemd 228 - Privilege Escalation Vulnerability
Simple word matching
Debian DSA-2765-1: davfs2 - privilege escalation
BM25 PHP 5.6.x < 5.6.30 Multiple DoS
EVA-DSSM PHP 7.1.x <7.1.1 Multiple Vulnerabilities
Remote SAP Solman 7.31 Information Disclosure Vulnerability
Simple word matching
Triangle MicroWorks SCADA Data Gateway < 3.3.729 Heartbeat Information Disclosure (Heartbleed)
BM25 Oracle Linux 5: bind (ELSA-2015-1514)
EVA-DSSM CentOS 6: squid34 (CESA-2017:0183)
DoS Ubuntu 11.10/12.04 - binfmt_script Stack Data Disclosure Vulnerability
Simple word matching
Ubuntu 10.04 LTS / 11.04 / 11.10 / 12.04 LTS: Firefox vulnerabilities (USN-1600-1)
BM25 Ubuntu 16.04 LTS: linux, linux-snapdragon vulnerabilities
EVA-DSSM Ubuntu 12.04 LTS: linux-lts-quantal - Linux kernel hardware enablement from Quantal regression (USN-1704-2)
The examples listed in Table 15 indicate that the simple matching and BM25 approaches directly
match contents from the exploit and vulnerability texts and result in incorrect linkages. For example, the
simple word matching in each dataset incorrectly retrieved exploits that had direct overlaps with listed
vulnerabilities. For the web applications dataset, this was the phrase “remote code execution”; for the local
dataset, this was the phrase “privilege escalation”; for the remote dataset, this was the phrase “information
disclosure”; and for the DoS dataset, this was the term “Ubuntu.” The consistency of these issues across all
four datasets indicates that simple matching approaches, while appearing to have some face validity for
exploit-vulnerability matching due to overlapping technology names in exploit and vulnerability names,
cannot capture the semantics or context of selected technology names that EVA-DSSM can. This is most
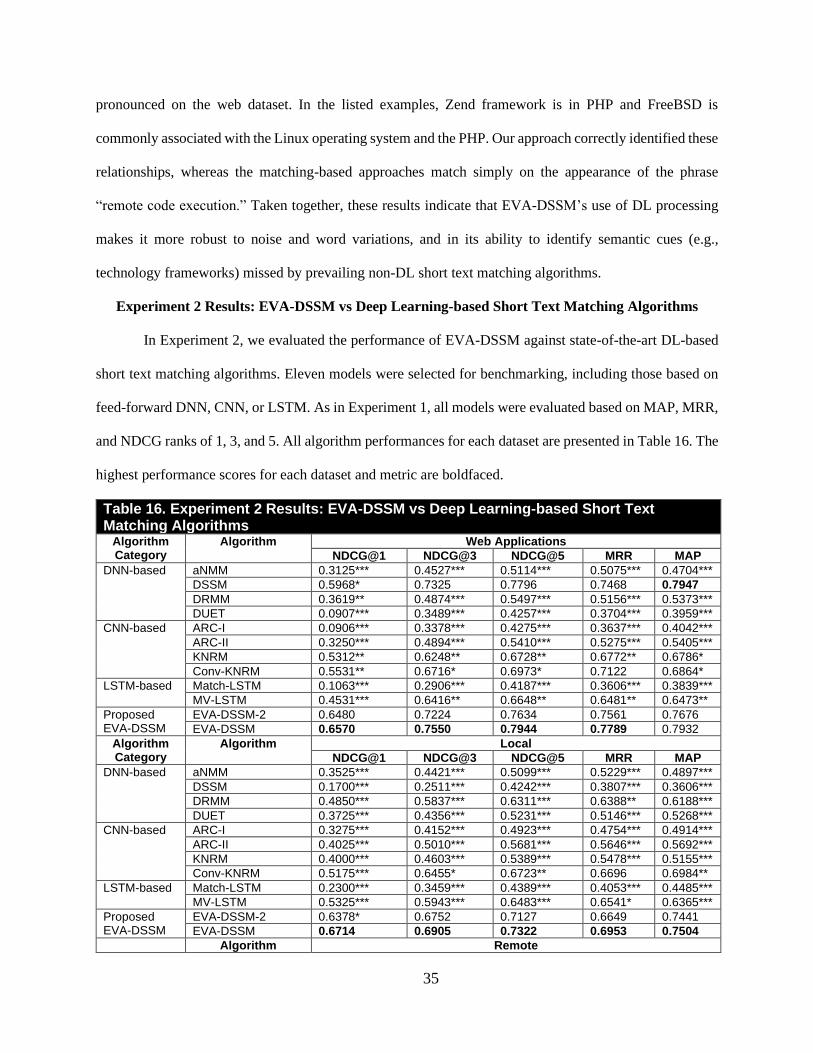
35
pronounced on the web dataset. In the listed examples, Zend framework is in PHP and FreeBSD is
commonly associated with the Linux operating system and the PHP. Our approach correctly identified these
relationships, whereas the matching-based approaches match simply on the appearance of the phrase
“remote code execution.” Taken together, these results indicate that EVA-DSSM’s use of DL processing
makes it more robust to noise and word variations, and in its ability to identify semantic cues (e.g.,
technology frameworks) missed by prevailing non-DL short text matching algorithms.
Experiment 2 Results: EVA-DSSM vs Deep Learning-based Short Text Matching Algorithms
In Experiment 2, we evaluated the performance of EVA-DSSM against state-of-the-art DL-based
short text matching algorithms. Eleven models were selected for benchmarking, including those based on
feed-forward DNN, CNN, or LSTM. As in Experiment 1, all models were evaluated based on MAP, MRR,
and NDCG ranks of 1, 3, and 5. All algorithm performances for each dataset are presented in Table 16. The
highest performance scores for each dataset and metric are boldfaced.
Table 16. Experiment 2 Results: EVA-DSSM vs Deep Learning-based Short Text Matching Algorithms
Algorithm Category
Algorithm Web Applications
NDCG@1 NDCG@3 NDCG@5 MRR MAP
DNN-based aNMM 0.3125*** 0.4527*** 0.5114*** 0.5075*** 0.4704***
DSSM 0.5968* 0.7325 0.7796 0.7468 0.7947
DRMM 0.3619** 0.4874*** 0.5497*** 0.5156*** 0.5373***
DUET 0.0907*** 0.3489*** 0.4257*** 0.3704*** 0.3959***
CNN-based ARC-I 0.0906*** 0.3378*** 0.4275*** 0.3637*** 0.4042***
ARC-II 0.3250*** 0.4894*** 0.5410*** 0.5275*** 0.5405***
KNRM 0.5312** 0.6248** 0.6728** 0.6772** 0.6786*
Conv-KNRM 0.5531** 0.6716* 0.6973* 0.7122 0.6864*
LSTM-based Match-LSTM 0.1063*** 0.2906*** 0.4187*** 0.3606*** 0.3839***
MV-LSTM 0.4531*** 0.6416** 0.6648** 0.6481** 0.6473**
Proposed EVA-DSSM
EVA-DSSM-2 0.6480 0.7224 0.7634 0.7561 0.7676
EVA-DSSM 0.6570 0.7550 0.7944 0.7789 0.7932
Algorithm Category
Algorithm Local
NDCG@1 NDCG@3 NDCG@5 MRR MAP
DNN-based aNMM 0.3525*** 0.4421*** 0.5099*** 0.5229*** 0.4897***
DSSM 0.1700*** 0.2511*** 0.4242*** 0.3807*** 0.3606***
DRMM 0.4850*** 0.5837*** 0.6311*** 0.6388** 0.6188***
DUET 0.3725*** 0.4356*** 0.5231*** 0.5146*** 0.5268***
CNN-based ARC-I 0.3275*** 0.4152*** 0.4923*** 0.4754*** 0.4914***
ARC-II 0.4025*** 0.5010*** 0.5681*** 0.5646*** 0.5692***
KNRM 0.4000*** 0.4603*** 0.5389*** 0.5478*** 0.5155***
Conv-KNRM 0.5175*** 0.6455* 0.6723** 0.6696 0.6984**
LSTM-based Match-LSTM 0.2300*** 0.3459*** 0.4389*** 0.4053*** 0.4485***
MV-LSTM 0.5325*** 0.5943*** 0.6483*** 0.6541* 0.6365***
Proposed EVA-DSSM
EVA-DSSM-2 0.6378* 0.6752 0.7127 0.6649 0.7441
EVA-DSSM 0.6714 0.6905 0.7322 0.6953 0.7504
Algorithm Remote
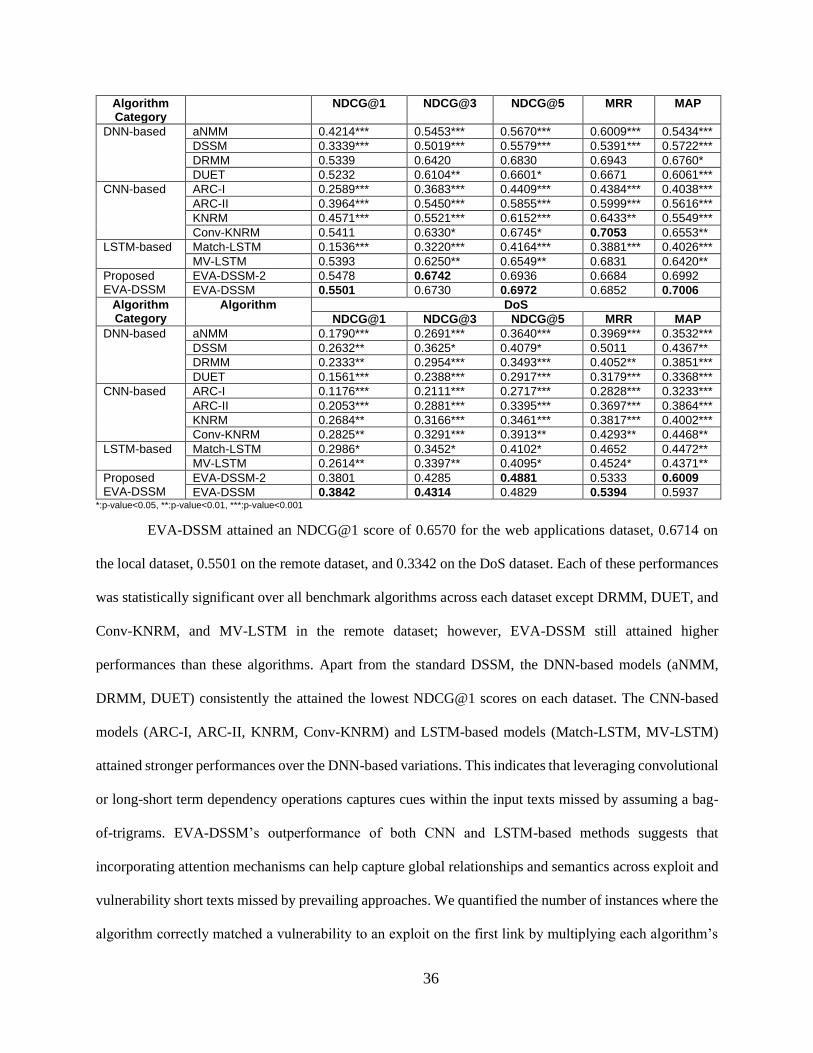
36
Algorithm Category
NDCG@1 NDCG@3 NDCG@5 MRR MAP
DNN-based aNMM 0.4214*** 0.5453*** 0.5670*** 0.6009*** 0.5434***
DSSM 0.3339*** 0.5019*** 0.5579*** 0.5391*** 0.5722***
DRMM 0.5339 0.6420 0.6830 0.6943 0.6760*
DUET 0.5232 0.6104** 0.6601* 0.6671 0.6061***
CNN-based ARC-I 0.2589*** 0.3683*** 0.4409*** 0.4384*** 0.4038***
ARC-II 0.3964*** 0.5450*** 0.5855*** 0.5999*** 0.5616***
KNRM 0.4571*** 0.5521*** 0.6152*** 0.6433** 0.5549***
Conv-KNRM 0.5411 0.6330* 0.6745* 0.7053 0.6553**
LSTM-based Match-LSTM 0.1536*** 0.3220*** 0.4164*** 0.3881*** 0.4026***
MV-LSTM 0.5393 0.6250** 0.6549** 0.6831 0.6420**
Proposed EVA-DSSM
EVA-DSSM-2 0.5478 0.6742 0.6936 0.6684 0.6992
EVA-DSSM 0.5501 0.6730 0.6972 0.6852 0.7006
Algorithm Category
Algorithm DoS
NDCG@1 NDCG@3 NDCG@5 MRR MAP
DNN-based aNMM 0.1790*** 0.2691*** 0.3640*** 0.3969*** 0.3532***
DSSM 0.2632** 0.3625* 0.4079* 0.5011 0.4367**
DRMM 0.2333** 0.2954*** 0.3493*** 0.4052** 0.3851***
DUET 0.1561*** 0.2388*** 0.2917*** 0.3179*** 0.3368***
CNN-based ARC-I 0.1176*** 0.2111*** 0.2717*** 0.2828*** 0.3233***
ARC-II 0.2053*** 0.2881*** 0.3395*** 0.3697*** 0.3864***
KNRM 0.2684** 0.3166*** 0.3461*** 0.3817*** 0.4002***
Conv-KNRM 0.2825** 0.3291*** 0.3913** 0.4293** 0.4468**
LSTM-based Match-LSTM 0.2986* 0.3452* 0.4102* 0.4652 0.4472**
MV-LSTM 0.2614** 0.3397** 0.4095* 0.4524* 0.4371**
Proposed EVA-DSSM
EVA-DSSM-2 0.3801 0.4285 0.4881 0.5333 0.6009
EVA-DSSM 0.3842 0.4314 0.4829 0.5394 0.5937 *:p-value<0.05, **:p-value<0.01, ***:p-value<0.001
EVA-DSSM attained an NDCG@1 score of 0.6570 for the web applications dataset, 0.6714 on
the local dataset, 0.5501 on the remote dataset, and 0.3342 on the DoS dataset. Each of these performances
was statistically significant over all benchmark algorithms across each dataset except DRMM, DUET, and
Conv-KNRM, and MV-LSTM in the remote dataset; however, EVA-DSSM still attained higher
performances than these algorithms. Apart from the standard DSSM, the DNN-based models (aNMM,
DRMM, DUET) consistently the attained the lowest NDCG@1 scores on each dataset. The CNN-based
models (ARC-I, ARC-II, KNRM, Conv-KNRM) and LSTM-based models (Match-LSTM, MV-LSTM)
attained stronger performances over the DNN-based variations. This indicates that leveraging convolutional
or long-short term dependency operations captures cues within the input texts missed by assuming a bag-
of-trigrams. EVA-DSSM’s outperformance of both CNN and LSTM-based methods suggests that
incorporating attention mechanisms can help capture global relationships and semantics across exploit and
vulnerability short texts missed by prevailing approaches. We quantified the number of instances where the
algorithm correctly matched a vulnerability to an exploit on the first link by multiplying each algorithm’s
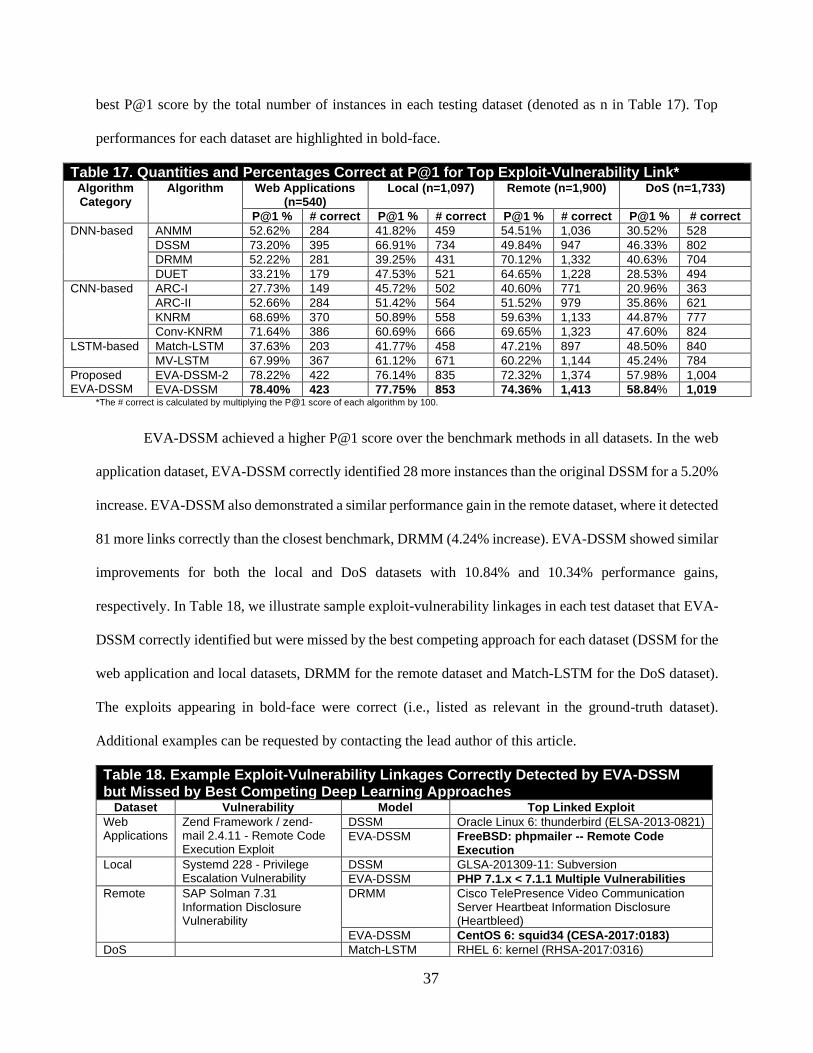
37
best P@1 score by the total number of instances in each testing dataset (denoted as n in Table 17). Top
performances for each dataset are highlighted in bold-face.
Table 17. Quantities and Percentages Correct at P@1 for Top Exploit-Vulnerability Link* Algorithm Category
Algorithm Web Applications (n=540)
Local (n=1,097) Remote (n=1,900) DoS (n=1,733)
P@1 % # correct P@1 % # correct P@1 % # correct P@1 % # correct
DNN-based ANMM 52.62% 284 41.82% 459 54.51% 1,036 30.52% 528
DSSM 73.20% 395 66.91% 734 49.84% 947 46.33% 802
DRMM 52.22% 281 39.25% 431 70.12% 1,332 40.63% 704
DUET 33.21% 179 47.53% 521 64.65% 1,228 28.53% 494
CNN-based ARC-I 27.73% 149 45.72% 502 40.60% 771 20.96% 363
ARC-II 52.66% 284 51.42% 564 51.52% 979 35.86% 621
KNRM 68.69% 370 50.89% 558 59.63% 1,133 44.87% 777
Conv-KNRM 71.64% 386 60.69% 666 69.65% 1,323 47.60% 824
LSTM-based Match-LSTM 37.63% 203 41.77% 458 47.21% 897 48.50% 840
MV-LSTM 67.99% 367 61.12% 671 60.22% 1,144 45.24% 784
Proposed EVA-DSSM
EVA-DSSM-2 78.22% 422 76.14% 835 72.32% 1,374 57.98% 1,004
EVA-DSSM 78.40% 423 77.75% 853 74.36% 1,413 58.84% 1,019 *The # correct is calculated by multiplying the P@1 score of each algorithm by 100.
EVA-DSSM achieved a higher P@1 score over the benchmark methods in all datasets. In the web
application dataset, EVA-DSSM correctly identified 28 more instances than the original DSSM for a 5.20%
increase. EVA-DSSM also demonstrated a similar performance gain in the remote dataset, where it detected
81 more links correctly than the closest benchmark, DRMM (4.24% increase). EVA-DSSM showed similar
improvements for both the local and DoS datasets with 10.84% and 10.34% performance gains,
respectively. In Table 18, we illustrate sample exploit-vulnerability linkages in each test dataset that EVA-
DSSM correctly identified but were missed by the best competing approach for each dataset (DSSM for the
web application and local datasets, DRMM for the remote dataset and Match-LSTM for the DoS dataset).
The exploits appearing in bold-face were correct (i.e., listed as relevant in the ground-truth dataset).
Additional examples can be requested by contacting the lead author of this article.
Table 18. Example Exploit-Vulnerability Linkages Correctly Detected by EVA-DSSM but Missed by Best Competing Deep Learning Approaches
Dataset Vulnerability Model Top Linked Exploit
Web Applications
Zend Framework / zend-mail 2.4.11 - Remote Code Execution Exploit
DSSM Oracle Linux 6: thunderbird (ELSA-2013-0821)
EVA-DSSM FreeBSD: phpmailer -- Remote Code Execution
Local Systemd 228 - Privilege Escalation Vulnerability
DSSM GLSA-201309-11: Subversion
EVA-DSSM PHP 7.1.x < 7.1.1 Multiple Vulnerabilities
Remote SAP Solman 7.31 Information Disclosure Vulnerability
DRMM Cisco TelePresence Video Communication Server Heartbeat Information Disclosure (Heartbleed)
EVA-DSSM CentOS 6: squid34 (CESA-2017:0183)
DoS Match-LSTM RHEL 6: kernel (RHSA-2017:0316)
38
Ubuntu 11.10/12.04 - binfmt_script Stack Data Disclosure Vulnerability
EVA-DSSM Ubuntu 12.04 LTS: linux-lts-quantal - Linux kernel hardware enablement from Quantal regression
The results suggest that the proposed EVA-DSSM captured the semantics of terms more effectively
than benchmark approaches. In the web applications dataset, for instance, EVA-DSSM correctly identified
that “FreeBSD” was associated with the “Zend Framework.” Similarly, EVA-DSSM captured that
“CentOS” term was more closely associated with “SAP Solman” (a technology that can run CentOS) than
“Cisco Telepresence” in the remote dataset. These results indicate that EVA-DSSM’s ability to capture
global relationships across input texts and iterative re-weighting of features via the attention mechanisms
helps capture finer-grained semantic overlaps than conventional approaches. The results also suggest that
EVA-DSSM captured sequences of texts more effectively in the DoS dataset than Match-LSTM (capturing
“Ubuntu” at the start of the exploit and vulnerability names). This indicates that the incorporation of the
BiLSTM layer captures the location of particular terms more effectively than the LSTM-based counterpart.
Experiment 3 Results: EVA-DSSM Sensitivity Analysis
In Experiment 3, we aimed to identify EVA-DSSM’s sensitivity to word hashing, LSTM, the
number of dense layers, and attention mechanism inclusion. As previously mentioned, standard word
hashing segments input text into letter trigrams for natural language applications. However, cybersecurity
text has non-natural terms such as version numbers, system names, and others. Experiment 3 examined the
performance of utilizing letter bigrams, letter trigrams, letter 4-grams, and word n-gram for the EVA-
DSSM. While concerns have been raised that hashing increases collisions (Huang et al. 2013) of identical
letter n-grams, only the short text exploit and vulnerability names are hashed, not the underlying
descriptions or discussions. Thus, the hashing collisions in our data are negligible (0.0058%) for all
experiments. In addition to evaluating the performance of hashing variations, we also evaluated EVA-
DSSM’s sensitivity to variations in the LSTM layers (one- and two-layer LSTM and BiLSTMs), number
of dense layers, and the removal of attention mechanisms. We present the results of Experiment 3 in Table
19; top performances of each variation are highlighted in bold.
39
Table 19. Experiment 3 Results: EVA-DSSM Sensitivity Analysis
EVA-DSSM Variation Web Applications Local
NDCG@1 NDCG@3 NDCG@5 MRR MAP NDCG@1 NDCG@3 NDCG@5 MRR MAP
Input text Letter bigrams 0.4976 0.6892 0.7022 0.6891 0.7355 0.5049 0.5844 0.6282 0.6578 0.6890
Letter trigrams 0.6570 0.7550 0.7944 0.7789 0.7932 0.6714 0.6905 0.7322 0.6953 0.7504
Letter 4-grams 0.6392 0.7684 0.7898 0.7753 0.7815 0.5663 0.6480 0.6742 0.6959 0.7098
Word n-gram 0.4015 0.5310 0.5647 0.5856 0.6106 0.4837 0.5549 0.5997 0.5891 0.6240
LSTM One Layer LSTM 0.6349 0.7258 0.7667 0.7710 0.7543 0.6125 0.6811 0.7172 0.7044 0.7340
One Layer Bi-LSTM 0.6570 0.7550 0.7944 0.7789 0.7932 0.6714 0.6905 0.7322 0.6953 0.7504
Two Layer LSTM 0.6601 0.7667 0.7890 0.7729 0.7967 0.6456 0.6909 0.7230 0.6948 0.7214
Two Layer Bi-LSTM 0.6535 0.7458 0.7803 0.7414 0.7838 0.6810 0.7033 0.7349 0.7057 0.7310
Dense layer
One dense layer 0.6202 0.7135 0.7639 0.7733 0.7573 0.6489 0.7014 0.7280 0.7006 0.7332
Two dense layers 0.6570 0.7550 0.7944 0.7789 0.7932 0.6714 0.6905 0.7322 0.6953 0.7504
Three dense layers 0.6668 0.7424 0.7898 0.7830 0.7841 0.6631 0.6970 0.7185 0.7104 0.7459
Attention Removing self-attention
0.6011 0.6754 0.6938 0.7042 0.7284 0.5716 0.6547 0.6834 0.6885 0.7078
Removing context attention
0.5327 0.6372 0.6566 0.6477 0.6890 0.5580 0.6246 0.6468 0.6599 0.6823
Base EVA-DSSM Performance* 0.6570 0.7550 0.7944 0.7789 0.7932 0.6714 0.6905 0.7322 0.6953 0.7504
EVA-DSSM Variation Remote DoS
NDCG@1 NDCG@3 NDCG@5 MRR MAP NDCG@1 NDCG@3 NDCG@5 MRR MAP
Input text Letter bigrams 0.4850 0.5927 0.6289 0.6314 0.6425 0.2711 0.3765 0.4099 0.4522 0.4492
Letter trigrams 0.5501 0.6730 0.6972 0.6852 0.7006 0.3842 0.4314 0.4829 0.5394 0.5937
Letter 5-grams 0.5688 0.6689 0.6840 0.6841 0.6833 0.3901 0.4149 0.4670 0.5187 0.5573
Word n-gram 0.4201 0.5317 0.5890 0.6013 0.5893 0.3055 0.3834 0.4258 0.4780 0.5058
LSTM One Layer LSTM 0.5077 0.6439 0.6639 0.6750 0.6574 0.3422 0.4078 0.4361 0.5005 0.5379
One Layer Bi-LSTM 0.5501 0.6730 0.6972 0.6852 0.7006 0.3842 0.4314 0.4829 0.5394 0.5937
Two Layer LSTM 0.5392 0.6644 0.6858 0.6820 0.6715 0.3535 0.4144 0.4592 0.5196 0.5768
Two Layer Bi-LSTM 0.5569 0.6698 0.6953 0.6872 0.7019 0.3720 0.4496 0.4797 0.5304 0.5880
Dense layer
One dense layer 0.5305 0.6590 0.6744 0.6616 0.6658 0.3671 0.4058 0.4485 0.4870 0.5564
Two dense layers 0.5501 0.6730 0.6972 0.6852 0.7006 0.3842 0.4314 0.4829 0.5394 0.5937
Three dense layers 0.5489 0.6683 0.6948 0.6839 0.6959 0.3864 0.4406 0.4760 0.5460 0.6017
Attention Removing self-attention
0.5244 0.6277 0.6550 0.6618 0.6647 0.3437 0.4318 0.4552 0.5065 0.5580
Removing context attention
0.4597 0.5721 0.6014 0.6145 0.6338 0.3053 0.3822 0.4174 0.4768 0.5295
Base EVA-DSSM Performance* 0.5501 0.6730 0.6972 0.6852 0.7006 0.3842 0.4314 0.4829 0.5394 0.5937 *Note: The base EVA-DSSM uses letter trigrams, one layer Bi-LSTM, two dense layers, and both self-attention and context attention mechanisms. When conducting the sensitivity analysis, only one model component was varied at a time to identify the contribution of that model component to the overall EVA-DSSM. This is consistent with best practices in deep learning literature in prevailing IS journals (Zhu et al. 2020; Zhu et al. 2021).
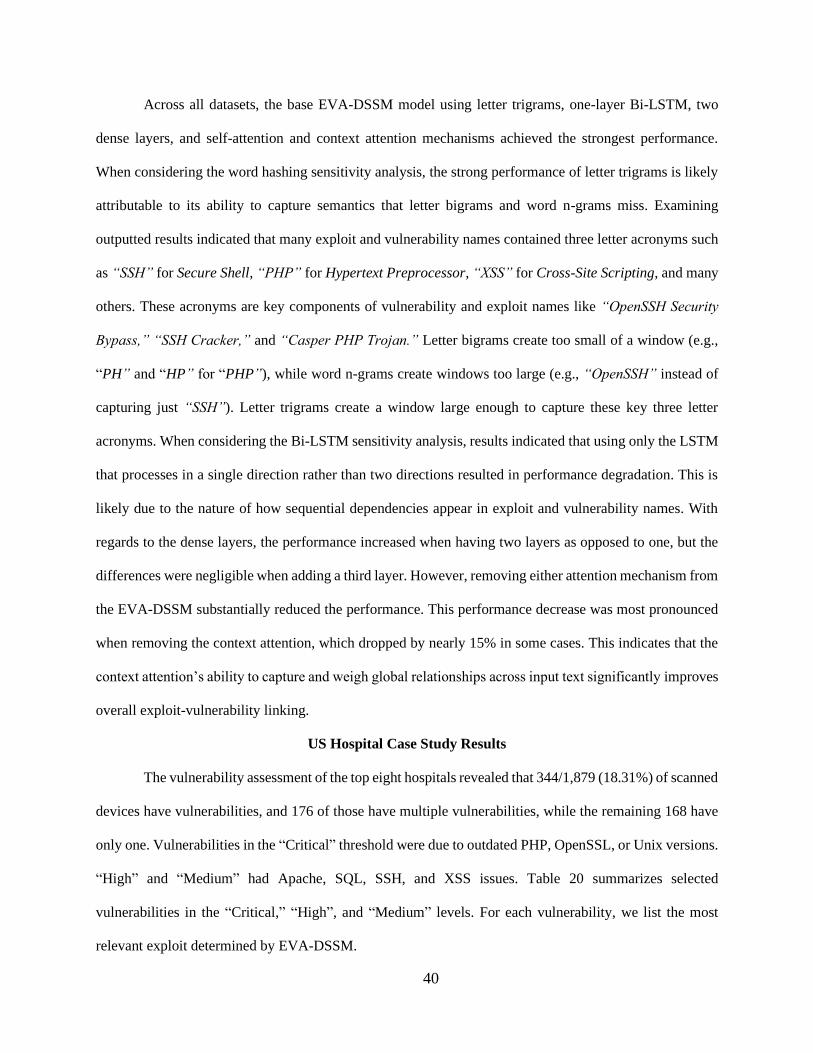
40
Across all datasets, the base EVA-DSSM model using letter trigrams, one-layer Bi-LSTM, two
dense layers, and self-attention and context attention mechanisms achieved the strongest performance.
When considering the word hashing sensitivity analysis, the strong performance of letter trigrams is likely
attributable to its ability to capture semantics that letter bigrams and word n-grams miss. Examining
outputted results indicated that many exploit and vulnerability names contained three letter acronyms such
as “SSH” for Secure Shell, “PHP” for Hypertext Preprocessor, “XSS” for Cross-Site Scripting, and many
others. These acronyms are key components of vulnerability and exploit names like “OpenSSH Security
Bypass,” “SSH Cracker,” and “Casper PHP Trojan.” Letter bigrams create too small of a window (e.g.,
“PH” and “HP” for “PHP”), while word n-grams create windows too large (e.g., “OpenSSH” instead of
capturing just “SSH”). Letter trigrams create a window large enough to capture these key three letter
acronyms. When considering the Bi-LSTM sensitivity analysis, results indicated that using only the LSTM
that processes in a single direction rather than two directions resulted in performance degradation. This is
likely due to the nature of how sequential dependencies appear in exploit and vulnerability names. With
regards to the dense layers, the performance increased when having two layers as opposed to one, but the
differences were negligible when adding a third layer. However, removing either attention mechanism from
the EVA-DSSM substantially reduced the performance. This performance decrease was most pronounced
when removing the context attention, which dropped by nearly 15% in some cases. This indicates that the
context attention’s ability to capture and weigh global relationships across input text significantly improves
overall exploit-vulnerability linking.
US Hospital Case Study Results
The vulnerability assessment of the top eight hospitals revealed that 344/1,879 (18.31%) of scanned
devices have vulnerabilities, and 176 of those have multiple vulnerabilities, while the remaining 168 have
only one. Vulnerabilities in the “Critical” threshold were due to outdated PHP, OpenSSL, or Unix versions.
“High” and “Medium” had Apache, SQL, SSH, and XSS issues. Table 20 summarizes selected
vulnerabilities in the “Critical,” “High”, and “Medium” levels. For each vulnerability, we list the most
relevant exploit determined by EVA-DSSM.
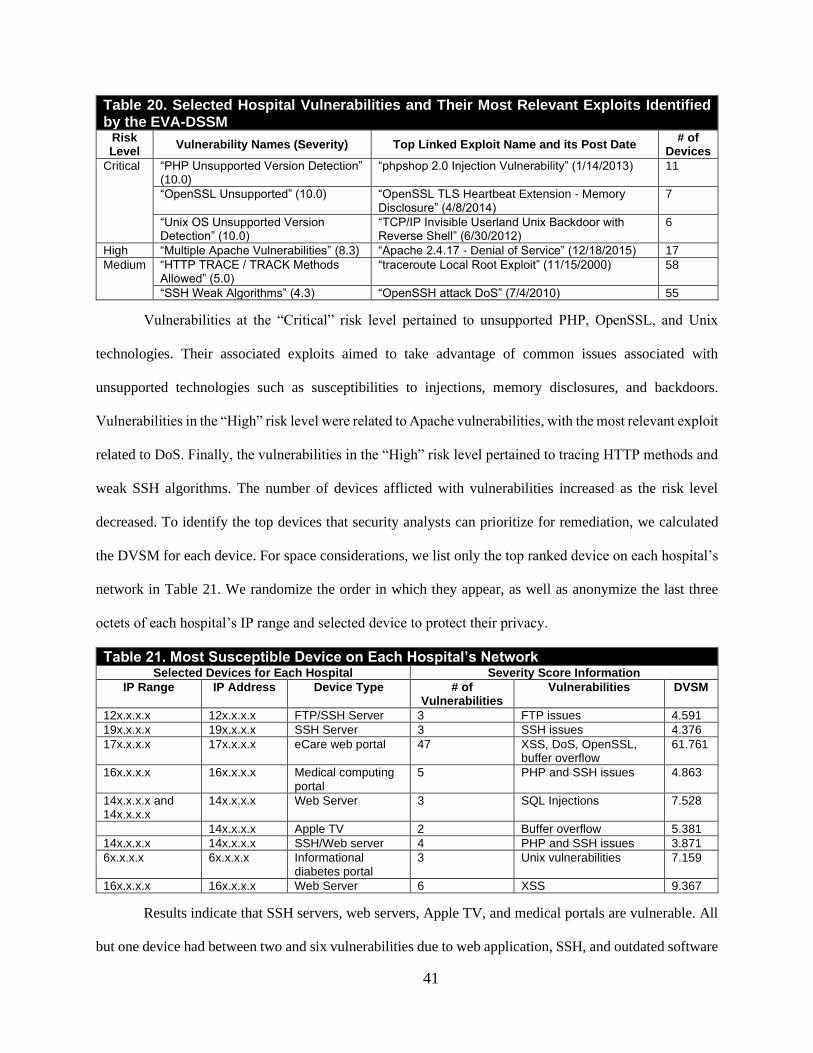
41
Table 20. Selected Hospital Vulnerabilities and Their Most Relevant Exploits Identified by the EVA-DSSM
Risk Level Vulnerability Names (Severity) Top Linked Exploit Name and its Post Date # of
Devices Critical “PHP Unsupported Version Detection”
(10.0) “phpshop 2.0 Injection Vulnerability” (1/14/2013) 11
“OpenSSL Unsupported” (10.0) “OpenSSL TLS Heartbeat Extension - Memory Disclosure” (4/8/2014)
7
“Unix OS Unsupported Version Detection” (10.0)
“TCP/IP Invisible Userland Unix Backdoor with Reverse Shell” (6/30/2012)
6
High “Multiple Apache Vulnerabilities” (8.3) “Apache 2.4.17 - Denial of Service” (12/18/2015) 17 Medium “HTTP TRACE / TRACK Methods
Allowed” (5.0) “traceroute Local Root Exploit” (11/15/2000) 58
“SSH Weak Algorithms” (4.3) “OpenSSH attack DoS” (7/4/2010) 55
Vulnerabilities at the “Critical” risk level pertained to unsupported PHP, OpenSSL, and Unix
technologies. Their associated exploits aimed to take advantage of common issues associated with
unsupported technologies such as susceptibilities to injections, memory disclosures, and backdoors.
Vulnerabilities in the “High” risk level were related to Apache vulnerabilities, with the most relevant exploit
related to DoS. Finally, the vulnerabilities in the “High” risk level pertained to tracing HTTP methods and
weak SSH algorithms. The number of devices afflicted with vulnerabilities increased as the risk level
decreased. To identify the top devices that security analysts can prioritize for remediation, we calculated
the DVSM for each device. For space considerations, we list only the top ranked device on each hospital’s
network in Table 21. We randomize the order in which they appear, as well as anonymize the last three
octets of each hospital’s IP range and selected device to protect their privacy.
Table 21. Most Susceptible Device on Each Hospital’s Network Selected Devices for Each Hospital Severity Score Information
IP Range IP Address Device Type # of Vulnerabilities
Vulnerabilities DVSM
12x.x.x.x 12x.x.x.x FTP/SSH Server 3 FTP issues 4.591
19x.x.x.x 19x.x.x.x SSH Server 3 SSH issues 4.376
17x.x.x.x 17x.x.x.x eCare web portal 47 XSS, DoS, OpenSSL, buffer overflow
61.761
16x.x.x.x 16x.x.x.x Medical computing portal
5 PHP and SSH issues 4.863
14x.x.x.x and 14x.x.x.x
14x.x.x.x Web Server 3 SQL Injections 7.528
14x.x.x.x Apple TV 2 Buffer overflow 5.381
14x.x.x.x 14x.x.x.x SSH/Web server 4 PHP and SSH issues 3.871
6x.x.x.x 6x.x.x.x Informational diabetes portal
3 Unix vulnerabilities 7.159
16x.x.x.x 16x.x.x.x Web Server 6 XSS 9.367
Results indicate that SSH servers, web servers, Apple TV, and medical portals are vulnerable. All
but one device had between two and six vulnerabilities due to web application, SSH, and outdated software
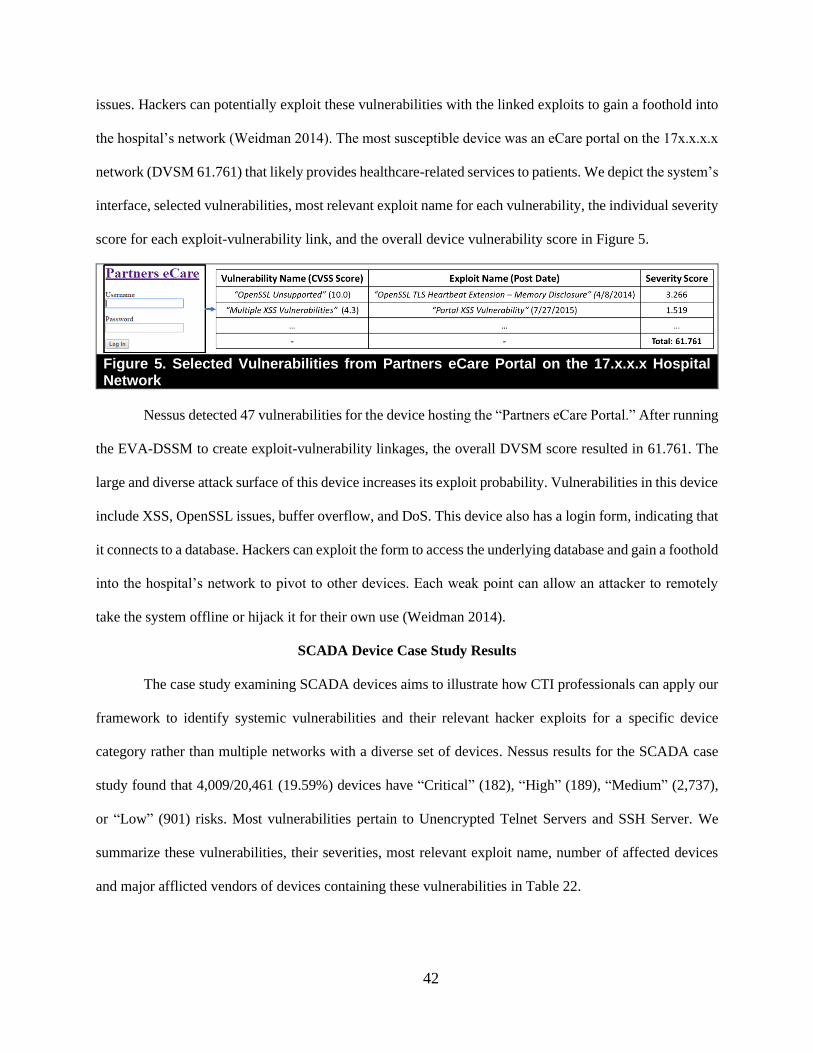
42
issues. Hackers can potentially exploit these vulnerabilities with the linked exploits to gain a foothold into
the hospital’s network (Weidman 2014). The most susceptible device was an eCare portal on the 17x.x.x.x
network (DVSM 61.761) that likely provides healthcare-related services to patients. We depict the system’s
interface, selected vulnerabilities, most relevant exploit name for each vulnerability, the individual severity
score for each exploit-vulnerability link, and the overall device vulnerability score in Figure 5.
Figure 5. Selected Vulnerabilities from Partners eCare Portal on the 17.x.x.x Hospital Network
Nessus detected 47 vulnerabilities for the device hosting the “Partners eCare Portal.” After running
the EVA-DSSM to create exploit-vulnerability linkages, the overall DVSM score resulted in 61.761. The
large and diverse attack surface of this device increases its exploit probability. Vulnerabilities in this device
include XSS, OpenSSL issues, buffer overflow, and DoS. This device also has a login form, indicating that
it connects to a database. Hackers can exploit the form to access the underlying database and gain a foothold
into the hospital’s network to pivot to other devices. Each weak point can allow an attacker to remotely
take the system offline or hijack it for their own use (Weidman 2014).
SCADA Device Case Study Results
The case study examining SCADA devices aims to illustrate how CTI professionals can apply our
framework to identify systemic vulnerabilities and their relevant hacker exploits for a specific device
category rather than multiple networks with a diverse set of devices. Nessus results for the SCADA case
study found that 4,009/20,461 (19.59%) devices have “Critical” (182), “High” (189), “Medium” (2,737),
or “Low” (901) risks. Most vulnerabilities pertain to Unencrypted Telnet Servers and SSH Server. We
summarize these vulnerabilities, their severities, most relevant exploit name, number of affected devices
and major afflicted vendors of devices containing these vulnerabilities in Table 22.
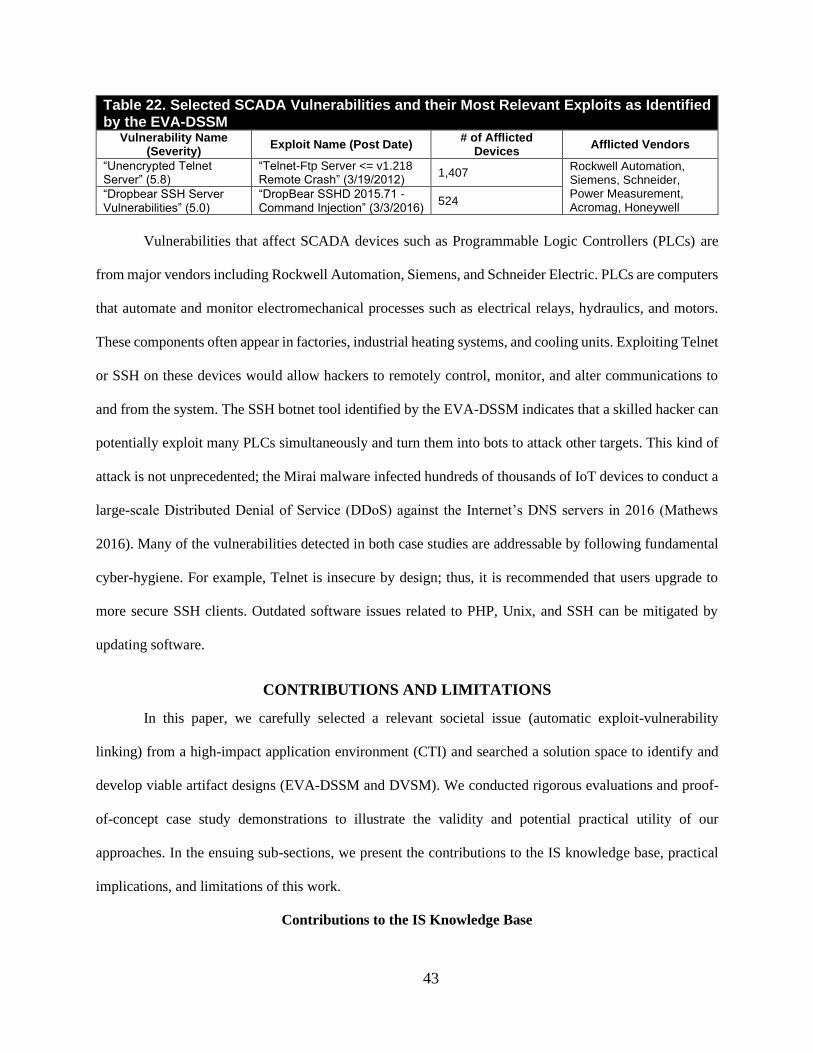
43
Table 22. Selected SCADA Vulnerabilities and their Most Relevant Exploits as Identified by the EVA-DSSM
Vulnerability Name (Severity) Exploit Name (Post Date) # of Afflicted
Devices Afflicted Vendors
“Unencrypted Telnet Server” (5.8)
“Telnet-Ftp Server <= v1.218 Remote Crash” (3/19/2012) 1,407 Rockwell Automation,
Siemens, Schneider, Power Measurement, Acromag, Honeywell
“Dropbear SSH Server Vulnerabilities” (5.0)
“DropBear SSHD 2015.71 - Command Injection” (3/3/2016) 524
Vulnerabilities that affect SCADA devices such as Programmable Logic Controllers (PLCs) are
from major vendors including Rockwell Automation, Siemens, and Schneider Electric. PLCs are computers
that automate and monitor electromechanical processes such as electrical relays, hydraulics, and motors.
These components often appear in factories, industrial heating systems, and cooling units. Exploiting Telnet
or SSH on these devices would allow hackers to remotely control, monitor, and alter communications to
and from the system. The SSH botnet tool identified by the EVA-DSSM indicates that a skilled hacker can
potentially exploit many PLCs simultaneously and turn them into bots to attack other targets. This kind of
attack is not unprecedented; the Mirai malware infected hundreds of thousands of IoT devices to conduct a
large-scale Distributed Denial of Service (DDoS) against the Internet’s DNS servers in 2016 (Mathews
2016). Many of the vulnerabilities detected in both case studies are addressable by following fundamental
cyber-hygiene. For example, Telnet is insecure by design; thus, it is recommended that users upgrade to
more secure SSH clients. Outdated software issues related to PHP, Unix, and SSH can be mitigated by
updating software.
CONTRIBUTIONS AND LIMITATIONS
In this paper, we carefully selected a relevant societal issue (automatic exploit-vulnerability
linking) from a high-impact application environment (CTI) and searched a solution space to identify and
develop viable artifact designs (EVA-DSSM and DVSM). We conducted rigorous evaluations and proof-
of-concept case study demonstrations to illustrate the validity and potential practical utility of our
approaches. In the ensuing sub-sections, we present the contributions to the IS knowledge base, practical
implications, and limitations of this work.
Contributions to the IS Knowledge Base
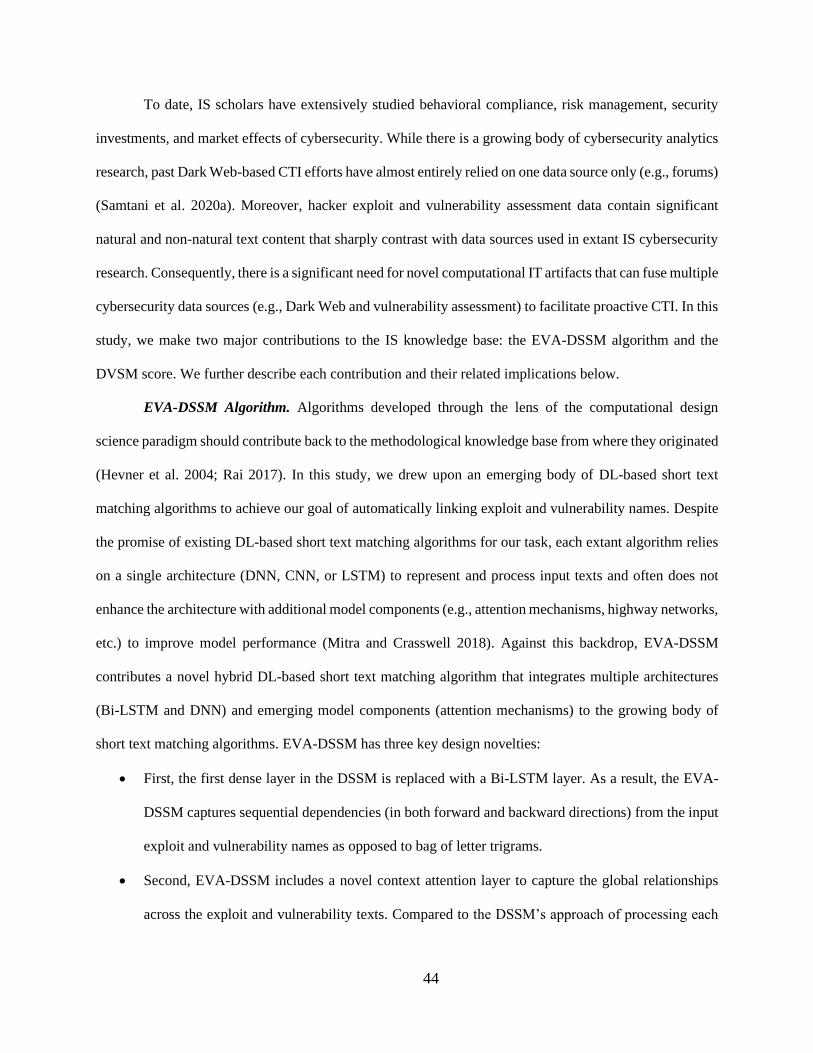
44
To date, IS scholars have extensively studied behavioral compliance, risk management, security
investments, and market effects of cybersecurity. While there is a growing body of cybersecurity analytics
research, past Dark Web-based CTI efforts have almost entirely relied on one data source only (e.g., forums)
(Samtani et al. 2020a). Moreover, hacker exploit and vulnerability assessment data contain significant
natural and non-natural text content that sharply contrast with data sources used in extant IS cybersecurity
research. Consequently, there is a significant need for novel computational IT artifacts that can fuse multiple
cybersecurity data sources (e.g., Dark Web and vulnerability assessment) to facilitate proactive CTI. In this
study, we make two major contributions to the IS knowledge base: the EVA-DSSM algorithm and the
DVSM score. We further describe each contribution and their related implications below.
EVA-DSSM Algorithm. Algorithms developed through the lens of the computational design
science paradigm should contribute back to the methodological knowledge base from where they originated
(Hevner et al. 2004; Rai 2017). In this study, we drew upon an emerging body of DL-based short text
matching algorithms to achieve our goal of automatically linking exploit and vulnerability names. Despite
the promise of existing DL-based short text matching algorithms for our task, each extant algorithm relies
on a single architecture (DNN, CNN, or LSTM) to represent and process input texts and often does not
enhance the architecture with additional model components (e.g., attention mechanisms, highway networks,
etc.) to improve model performance (Mitra and Crasswell 2018). Against this backdrop, EVA-DSSM
contributes a novel hybrid DL-based short text matching algorithm that integrates multiple architectures
(Bi-LSTM and DNN) and emerging model components (attention mechanisms) to the growing body of
short text matching algorithms. EVA-DSSM has three key design novelties:
• First, the first dense layer in the DSSM is replaced with a Bi-LSTM layer. As a result, the EVA-
DSSM captures sequential dependencies (in both forward and backward directions) from the input
exploit and vulnerability names as opposed to bag of letter trigrams.
• Second, EVA-DSSM includes a novel context attention layer to capture the global relationships
across the exploit and vulnerability texts. Compared to the DSSM’s approach of processing each
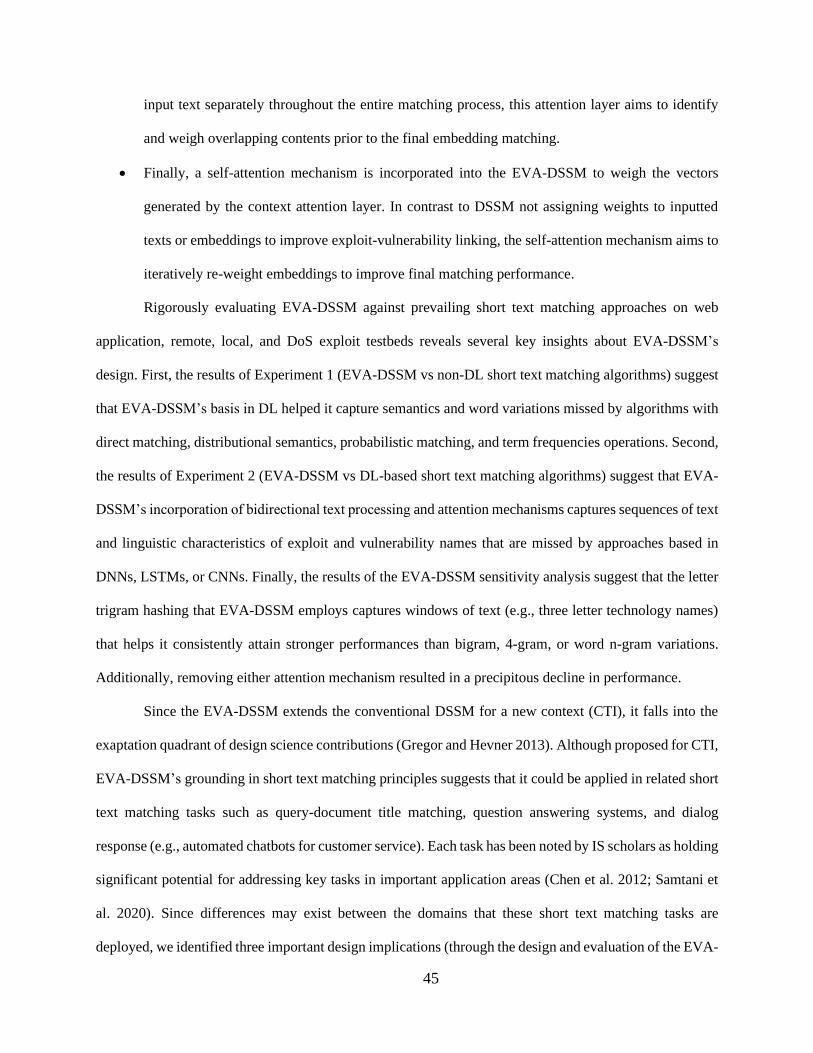
45
input text separately throughout the entire matching process, this attention layer aims to identify
and weigh overlapping contents prior to the final embedding matching.
• Finally, a self-attention mechanism is incorporated into the EVA-DSSM to weigh the vectors
generated by the context attention layer. In contrast to DSSM not assigning weights to inputted
texts or embeddings to improve exploit-vulnerability linking, the self-attention mechanism aims to
iteratively re-weight embeddings to improve final matching performance.
Rigorously evaluating EVA-DSSM against prevailing short text matching approaches on web
application, remote, local, and DoS exploit testbeds reveals several key insights about EVA-DSSM’s
design. First, the results of Experiment 1 (EVA-DSSM vs non-DL short text matching algorithms) suggest
that EVA-DSSM’s basis in DL helped it capture semantics and word variations missed by algorithms with
direct matching, distributional semantics, probabilistic matching, and term frequencies operations. Second,
the results of Experiment 2 (EVA-DSSM vs DL-based short text matching algorithms) suggest that EVA-
DSSM’s incorporation of bidirectional text processing and attention mechanisms captures sequences of text
and linguistic characteristics of exploit and vulnerability names that are missed by approaches based in
DNNs, LSTMs, or CNNs. Finally, the results of the EVA-DSSM sensitivity analysis suggest that the letter
trigram hashing that EVA-DSSM employs captures windows of text (e.g., three letter technology names)
that helps it consistently attain stronger performances than bigram, 4-gram, or word n-gram variations.
Additionally, removing either attention mechanism resulted in a precipitous decline in performance.
Since the EVA-DSSM extends the conventional DSSM for a new context (CTI), it falls into the
exaptation quadrant of design science contributions (Gregor and Hevner 2013). Although proposed for CTI,
EVA-DSSM’s grounding in short text matching principles suggests that it could be applied in related short
text matching tasks such as query-document title matching, question answering systems, and dialog
response (e.g., automated chatbots for customer service). Each task has been noted by IS scholars as holding
significant potential for addressing key tasks in important application areas (Chen et al. 2012; Samtani et
al. 2020). Since differences may exist between the domains that these short text matching tasks are
deployed, we identified three important design implications (through the design and evaluation of the EVA-

46
DSSM) that IS scholars can consider when exapting EVA-DSSM or designing their short text matching
algorithm:
1. Identifying Appropriate Short Text Representations: The results of Experiment 3 indicate that the
manner in which input texts are represented (e.g., letter trigrams vs word n-grams) affects overall
matching performance. Therefore, future studies can consider capturing the semantics and structure of
the input text based on the key characteristics and requirements of the domain they are studying; this
could improve the performance of their DL-based algorithms for short text matching. Although letter
trigrams were used in this study, other text representations that can be considered include associating
named entities with each word, text graphs, and pre-matched grids.
2. Integrating Multiple DL Architectures: It has been well-established in short text matching literature
that DL-based algorithms outperform non-DL variants (Mitra and Crasswell 2018). The results of our
study indicate that integrating multiple DL architectures (Bi-LSTM to capture sequential dependencies
and DNN to generate embeddings for final exploit-vulnerability comparison) can lead to substantial
improvements in performance over algorithms relying on a single DL architecture alone. Therefore, IS
scholars can consider integrating multiple DL architectures (each assigned to conduct a particular
processing task) for their short text matching applications.
3. Extending Base DL Architectures: EVA-DSSM’s strong performance is largely attributable to
extending its base Bi-LSTM and DNN architectures to operate with two attention mechanisms. When
designing short text matching algorithms, scholars can consider extending their base model architecture
with attention mechanisms and other emerging extensions to DL architectures (e.g., complex order
embeddings, long short-range attention, and residual networks) to increase the model’s capacity to learn
from the input data and improve overall matching performance.
While these three considerations apply to many DL-based analytics, the results from our experiments
suggest that they are especially important for attaining strong performance for our application.
DVSM Score. A key benefit of conducting multi-modal analysis for cybersecurity is leveraging the
metadata from heterogenous data sources to construct specialized metrics to enhance cybersecurity decision
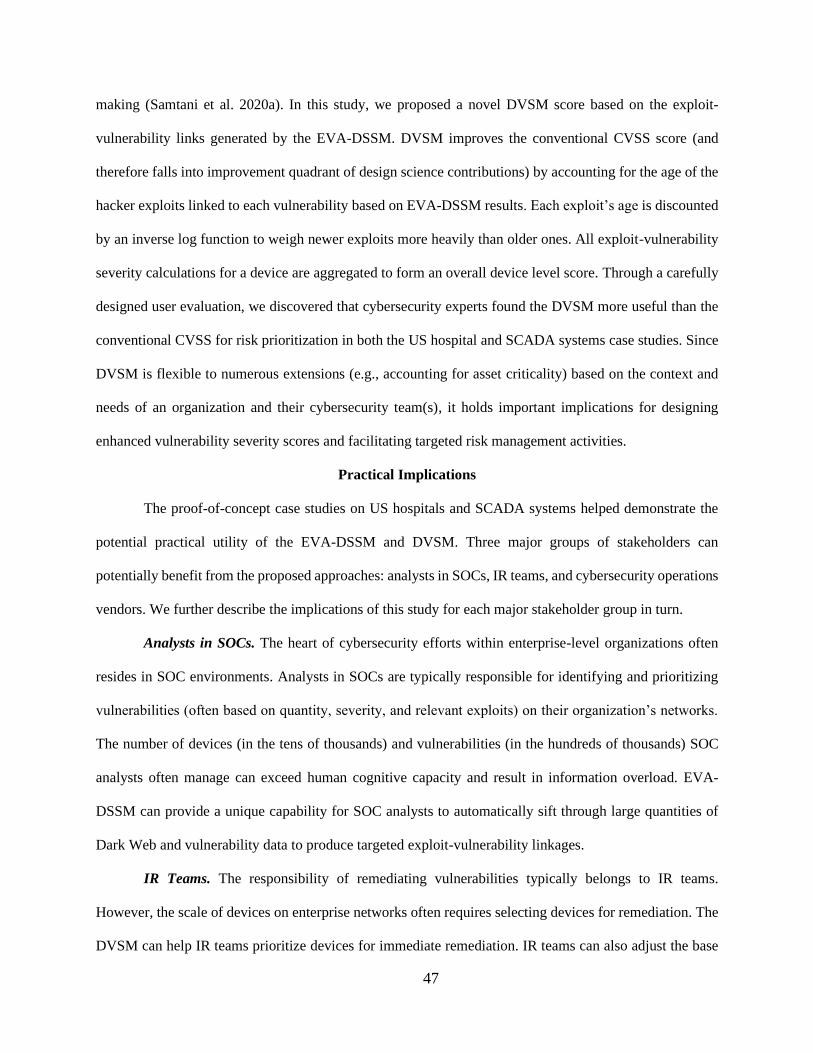
47
making (Samtani et al. 2020a). In this study, we proposed a novel DVSM score based on the exploit-
vulnerability links generated by the EVA-DSSM. DVSM improves the conventional CVSS score (and
therefore falls into improvement quadrant of design science contributions) by accounting for the age of the
hacker exploits linked to each vulnerability based on EVA-DSSM results. Each exploit’s age is discounted
by an inverse log function to weigh newer exploits more heavily than older ones. All exploit-vulnerability
severity calculations for a device are aggregated to form an overall device level score. Through a carefully
designed user evaluation, we discovered that cybersecurity experts found the DVSM more useful than the
conventional CVSS for risk prioritization in both the US hospital and SCADA systems case studies. Since
DVSM is flexible to numerous extensions (e.g., accounting for asset criticality) based on the context and
needs of an organization and their cybersecurity team(s), it holds important implications for designing
enhanced vulnerability severity scores and facilitating targeted risk management activities.
Practical Implications
The proof-of-concept case studies on US hospitals and SCADA systems helped demonstrate the
potential practical utility of the EVA-DSSM and DVSM. Three major groups of stakeholders can
potentially benefit from the proposed approaches: analysts in SOCs, IR teams, and cybersecurity operations
vendors. We further describe the implications of this study for each major stakeholder group in turn.
Analysts in SOCs. The heart of cybersecurity efforts within enterprise-level organizations often
resides in SOC environments. Analysts in SOCs are typically responsible for identifying and prioritizing
vulnerabilities (often based on quantity, severity, and relevant exploits) on their organization’s networks.
The number of devices (in the tens of thousands) and vulnerabilities (in the hundreds of thousands) SOC
analysts often manage can exceed human cognitive capacity and result in information overload. EVA-
DSSM can provide a unique capability for SOC analysts to automatically sift through large quantities of
Dark Web and vulnerability data to produce targeted exploit-vulnerability linkages.
IR Teams. The responsibility of remediating vulnerabilities typically belongs to IR teams.
However, the scale of devices on enterprise networks often requires selecting devices for remediation. The
DVSM can help IR teams prioritize devices for immediate remediation. IR teams can also adjust the base
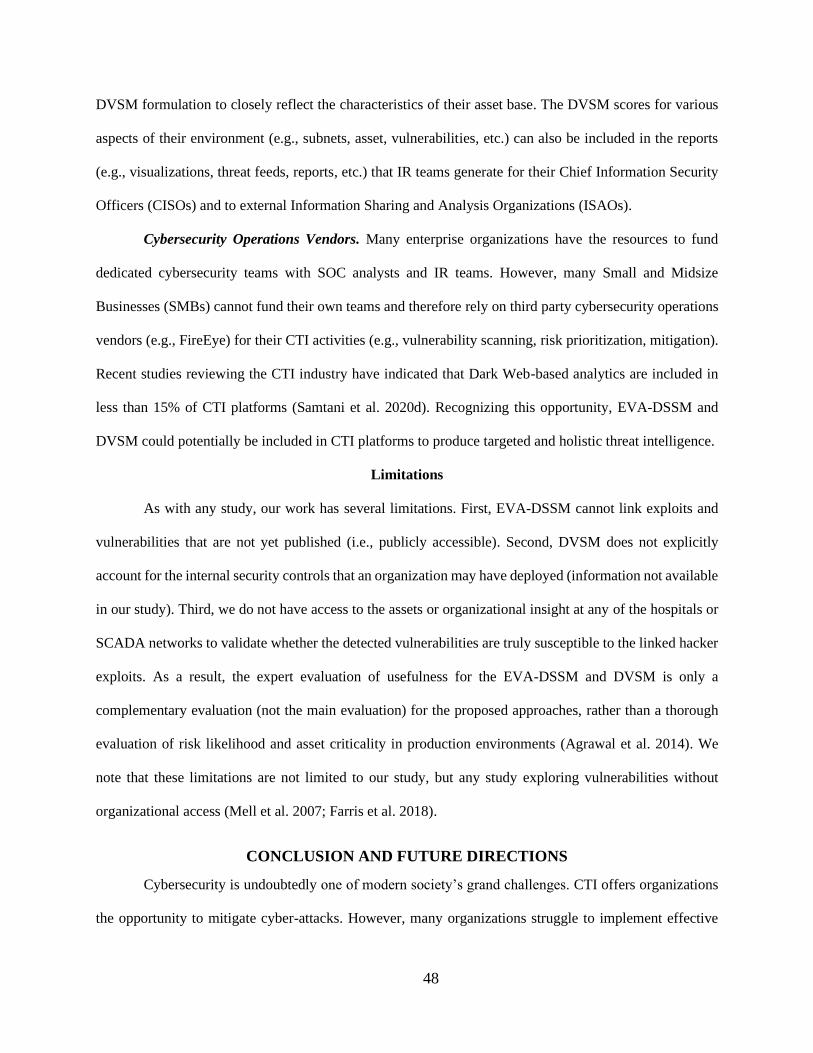
48
DVSM formulation to closely reflect the characteristics of their asset base. The DVSM scores for various
aspects of their environment (e.g., subnets, asset, vulnerabilities, etc.) can also be included in the reports
(e.g., visualizations, threat feeds, reports, etc.) that IR teams generate for their Chief Information Security
Officers (CISOs) and to external Information Sharing and Analysis Organizations (ISAOs).
Cybersecurity Operations Vendors. Many enterprise organizations have the resources to fund
dedicated cybersecurity teams with SOC analysts and IR teams. However, many Small and Midsize
Businesses (SMBs) cannot fund their own teams and therefore rely on third party cybersecurity operations
vendors (e.g., FireEye) for their CTI activities (e.g., vulnerability scanning, risk prioritization, mitigation).
Recent studies reviewing the CTI industry have indicated that Dark Web-based analytics are included in
less than 15% of CTI platforms (Samtani et al. 2020d). Recognizing this opportunity, EVA-DSSM and
DVSM could potentially be included in CTI platforms to produce targeted and holistic threat intelligence.
Limitations
As with any study, our work has several limitations. First, EVA-DSSM cannot link exploits and
vulnerabilities that are not yet published (i.e., publicly accessible). Second, DVSM does not explicitly
account for the internal security controls that an organization may have deployed (information not available
in our study). Third, we do not have access to the assets or organizational insight at any of the hospitals or
SCADA networks to validate whether the detected vulnerabilities are truly susceptible to the linked hacker
exploits. As a result, the expert evaluation of usefulness for the EVA-DSSM and DVSM is only a
complementary evaluation (not the main evaluation) for the proposed approaches, rather than a thorough
evaluation of risk likelihood and asset criticality in production environments (Agrawal et al. 2014). We
note that these limitations are not limited to our study, but any study exploring vulnerabilities without
organizational access (Mell et al. 2007; Farris et al. 2018).
CONCLUSION AND FUTURE DIRECTIONS
Cybersecurity is undoubtedly one of modern society’s grand challenges. CTI offers organizations
the opportunity to mitigate cyber-attacks. However, many organizations struggle to implement effective
49
CTI capabilities due to their inability to automatically pinpoint relevant exploits for their vulnerabilities.
Hacker forums from the Dark Web provide a novel data source that, when coupled with known
vulnerabilities, can help develop proactive and holistic CTI. Although IS scholars are equipped to produce
significant CTI research contributions in this regard, extant IS cybersecurity literature focuses primarily on
behavioral compliance, risk management, investments in securing digital assets, and market effects of
securing digital assets. Moreover, extant cybersecurity analytics literature has primarily focused on
analyzing single data sources rather than multiple data sources simultaneously. Significant opportunity
remains for IS scholars to develop novel computational IT artifacts that automatically link Dark Web data
and vulnerability assessment data for enhance CTI capabilities.
In this study, we aimed to develop a novel approach to link hacker exploits from the Dark Web to
vulnerabilities detected by vulnerability assessment tools (e.g., Nessus). To achieve this goal, we developed
a novel EVA-DSSM algorithm that draws upon principles in deep learning, bidirectional text processing,
and attention mechanisms. Through a series of technical benchmark experiments, we demonstrated how
EVA-DSSM outperforms state-of-the-art non-DL and DL-based short text matching baseline methods
across four major categories of exploits. In addition to contributing the EVA-DSSM, we also developed a
novel DVSM score that incorporates vulnerability severity, quantity, and hacker exploit age to help support
enhanced device prioritization. We demonstrated EVA-DSSM’s and DVSM’s potential practical utility
with proof-of-concept case studies of openly accessible devices at the top eight US hospitals and SCADA
systems deployed worldwide. A complementary user evaluation indicated that 45 cybersecurity
professionals (currently serving in SOC, IR, vulnerability management, and/or operational cybersecurity
roles) found the EVA-DSSM and DVSM results more useful than those generated by baseline approaches
for both case studies.
There are several promising directions for future research. First, researchers can apply EVA-DSSM
and DVSM on foreign hacker forums (e.g., Russian, Middle Eastern) to identify the systems various geo-
political regions target. Second, behavioral IS studies can use cyber-crime theories to help understand why
hackers target specific vulnerabilities. Third, future work can build a user interface upon the EVA-DSSM
50
and DVSM and deploy it into a production environment. Such a deployment can facilitate semi-structured
interviews with CISOs, longitudinal field studies, and case studies to help researchers understand how the
approaches are adopted into practice. Finally, future computational IT artifacts can examine how to create
exploit-vulnerability linkages for vulnerabilities present in emerging technologies such as GitHub,
containers, dynamic virtual networks, and others. Each extension can provide much-needed cybersecurity
capabilities to help secure cyberspace.
REFERENCES
Abbasi, A., and Chen, H. 2008. “CyberGate: A Design Framework and System for Text Analysis of
Computer-Mediated Communication,” MIS Quarterly (32:4), JSTOR, pp. 811–837.
Abbasi, A., Zhou, Y., Deng, S., and Zhang, P. 2018. “Text Analytics to Support Sense-Making in Social
Media: A Language-Action Perspective,” MIS Quarterly (42:2), JSTOR, pp. 427-464.
Agrawal, M., Campoe, A., and Pierce, E. 2014. Information Security and IT Risk Management, (1st ed.),
Wiley.
Ahmad, F., Abbasi, A., Kitchens, B., Adjeroh, D. A., and Zeng, D. “Deep Learning for Adverse Event
Detection from Web Search,” IEEE Transactions on Knowledge and Data Engineering,
Forthcoming.
Allodi, L., and Massacci, F. 2014. “Comparing Vulnerability Severity and Exploits Using Case-Control
Studies,” ACM Transactions on Information and System Security (17:1), pp. 1–20.
Ampel, B. M., Samtani, S., Zhu, H., Ullman, S., and Chen, H. 2020. “Labeling Hacker Exploits for
Proactive Cyber Threat Intelligence: A Deep Transfer Learning Approach,” in 2020 IEEE
Conference on Intelligence and Security Informatics (ISI), IEEE, November, pp. 1-6.
Ayala, L. 2016. Cybersecurity for Hospitals and Healthcare Facilities, Berkeley, CA: Apress.
Benjamin, V., Zhang, B., Nunamaker, J., and Chen, H. 2016. “Examining Hacker Participation Length in
Cybercriminal Internet-Relay-Chat Communities,” Journal of Management Information Systems,
(33:2) pp. 482-510.
Benjamin, V., Valacich, J. S., and Chen, H. 2019. "DICE-E: A Framework for Conducting Darknet
Identification, Collection, Evaluation with Ethics," MIS Quarterly (43:1), pp. 1-22.
Bromiley, M. 2016. “Threat Intelligence: What It Is, and How to Use It Effectively,” SANS Institute.
(https://www.sans.org/reading-room/whitepapers/analyst/threat-intelligence-is-effectively-37282,
accessed June 5, 2017).
Chau, M., Li, T., Wong, P., Xu, J., Yip, P., and Chen, H. 2020. “Finding People with Emotional Distress
in Online Social Media: A Design Combining Machine Learning and Rule-Based Classification,”
MIS Quarterly (44:2), pp. 933-956.
Chen, H., Chiang, R., and Storey, V. 2012. “Business Intelligence and Analytics: From Big Data to Big
Impact,” MIS Quarterly (36:4), pp. 1165-1188.
Chen, Y. and Zahedi, F. 2016. “Individuals’ Internet Security Perceptions and Behaviors: Polycontextual
Contrasts Between the United States and China,” MIS Quarterly (40:1), pp. 205-222.
Cheng, H.-T., Koc, L., Harmsen, J., Shaked, T., Chandra, T., Aradhye, H., Anderson, G., Corrado, G.,
Chai, W., Ispir, M., Anil, R., Haque, Z., Hong, L., Jain, V., Liu, X., and Hemal, S. 2017. “Deep
Learning for Recommender Systems,” in RecSys 2017 - Proceedings of the 11th ACM Conference
on Recommender Systems, pp. 396–397.
Dai, Z. Y., Xiong, C. Y., Callan, J., and Liu, Z. Y. 2018. "Convolutional Neural Networks for Soft-
Matching N-Grams in Ad-Hoc Search," WSDM'18: Proceedings of the Eleventh ACM International
Conference on Web Search and Data Mining, pp. 126-134.
51
Davis, F. D. 1989. “Perceived Usefulness, Perceived Ease of Use, and User Acceptance of Information
Technology,” MIS Quarterly (13:3), pp. 319-340.
Davis, F. D., Bagozzi, R. P., and Warshaw, P. R. 1989. “User Acceptance of Computer Technology: A
Comparison of Two Theoretical Models,” Management Science (35:8), pp. 982-1003.
Deerwester, S., Dumais, S. T., Furnas, G. W., Landauer, T. K., and Harshman, R. 1990. "Indexing by
Latent Semantic Analysis," Journal of the American Society for Information Science (41:6), pp. 391-
407.
Deliu, I., Leichter, C., and Franke, K. 2018. "Collecting Cyber Threat Intelligence from Hacker Forums
Via a Two-Stage, Hybrid Process Using Support Vector Machines and Latent Dirichlet Allocation,"
2018 IEEE International Conference on Big Data (Big Data)), pp. 5008-5013.
Deliu, I., Leichter, C., and Franke, K. 2017. "Extracting Cyber Threat Intelligence from Hacker Forums:
Support Vector Machines Versus Convolutional Neural Networks," 2017 IEEE International
Conference on Big Data (Big Data)), pp. 3648-3656.
Du, M., Liu, N., and Hu, X. 2020. "Techniques for Interpretable Machine Learning," Communications of
the ACM (63:1), pp. 68–77.
Du, P. Y., Zhang, N., Ebrahimi, M., Samtani, S., Lazarine, B., Arnold, N., Dunn, R., Suntwal, S.,
Angeles, G., Schweitzer, R., and Chen, H. 2018. "Identifying, Collecting, and Presenting Hacker
Community Data: Forums, IRC, Carding Shops, and DNMs," in 2018 IEEE International
Conference on Intelligence and Security Informatics (ISI), pp. 70-75.
Ebrahimi, M., Nunamaker, J.F., and Chen, H. 2020. "Semi-Supervised Threat Identification in Dark Net
Markets: A Transductive and Deep Learning Approach," Journal of Management Information
Systems (37:3), pp. 694-722.
El, M., McMahon, E., Samtani, S., Patton, M., and Chen, H. 2017. “Benchmarking Vulnerability
Scanners: An Experiment on SCADA Devices and Scientific Instruments,” in 2017 IEEE
International Conference on Intelligence and Security Informatics (ISI), IEEE, July, pp. 83–88.
Ernst & Young Global Limited. 2014. “Cyber Threat Intelligence - How to Get ahead of Cybercrime.”
(http://www.ey.com/Publication/vwLUAssets/EY-cyber-threat-intelligence-how-to-get-ahead-of-
cybercrime/$FILE/EY-cyber-threat-intelligence-how-to-get-ahead-of-cybercrime.pdf, accessed June
5, 2017).
Farris, K. A., Shah, A., Cybenko, G., Ganesan, R., and Jajodia, S. 2018. “VULCON: A System for
Vulnerability Prioritization, Mitigation, and Management,” ACM Transactions on Privacy and
Security (21:4), pp. 1–28.
Friedman, J. 2015. Definitive Guide to Cyber Threat Intelligence, CyberEdge Group, LLC.
(https://cryptome.org/2015/09/cti-guide.pdf).
Goodfellow, I., Bengio, Y., Courville, A., and Bengio, Y. 2016. Deep Learning, (Vol. 1), MIT press
Cambridge.
Gregor, S., and Hevner, A. R. 2013. “Positioning and Presenting Design Science Research for Maximum
Impact,” MIS Quarterly (37:2), pp. 337-355.
Graham, L. 2017. “Cybercrime costs the global economy $450 billion”
(https://www.cnbc.com/2017/02/07/cybercrime-costs-the-global-economy-450-billion-ceo.html)
Grisham, J., Samtani, S., Patton, M., and Chen, H. 2017. “Identifying Mobile Malware and Key Threat
Actors in Online Hacker Forums for Proactive Cyber Threat Intelligence,” in 2017 IEEE
International Conference on Intelligence and Security Informatics (ISI), IEEE, July, pp. 13–18.
(https://doi.org/10.1109/ISI.2017.8004867).
Guo, J., Fan, Y., Ai, Q., and Croft, W. B. 2016. “A Deep Relevance Matching Model for Ad-Hoc
Retrieval,” in Proceedings of the 25th ACM International on Conference on Information and
Knowledge Management - CIKM ’16, New York, New York, USA: ACM Press, pp. 55–64.
Gupta, A. and Zhdanov, D. 2012. “Growth and Sustainability of Managed Security Services Networks:
An Economic Perspective,” MIS Quarterly (36:4), pp. 1109-1130.
52
Harrell, C. R., Patton, M., Chen, H., and Samtani, S. 2018. "Vulnerability Assessment, Remediation, and
Automated Reporting: Case Studies of Higher Education Institutions," in 2018 IEEE International
Conference on Intelligence and Security Informatics (ISI)), pp. 148-153.
Hevner, A. R., March, S. T., Park, J., and Ram, S. 2004. “Design Science in Information Systems
Research,” MIS Quarterly (28:1), pp. 75–105.
Hu, B. T., Lu, Z. D., Li, H., and Chen, Q. C. 2014. "Convolutional Neural Network Architectures for
Matching Natural Language Sentences," in Advances in Neural Information Processing Systems 27
(NIPS 2014) (27:2). pp. 2042-2050.
Huang, P.-S., He, X., Gao, J., Deng, L., Acero, A., and Heck, L. 2013. “Learning Deep Structured
Semantic Models for Web Search Using Clickthrough Data,” in Proceedings of the 22nd ACM
International Conference on Conference on Information & Knowledge Management - CIKM ’13,
New York, New York, USA: ACM Press, pp. 2333–2338.
Hui, K.L., Vance, A., Zhdanov, D. “Securing Digital Assets,” in MIS Quarterly Research Curations,
Ashley Bush, ed., http://misq.org/research-curations, May 27, 2016.
Jaech, A., Kamisetty, H., Ringger, E., and Clarke, C. 2017. Match-Tensor: A Deep Relevance Model for
Search. (http://arxiv.org/abs/1701.07795).
Kennedy, D., O’Gorman, J., Kearns, D., and Aharoni, M. 2011. Metasploit: The Penetration Tester’s
Guide, (1st editio.), No Starch Press.
Kim, S. and Kim, B. 2014. “Differential Effects of Prior Experience on the Malware Resolution Process,”
MIS Quarterly (38:3), pp. 655-678.
Kitten, T. 2014. “Target Malware: Exploring the Origins.”
(http://www.bankinfosecurity.com/interviews/intelcrawler-i-2161, accessed June 5, 2017).
Kwon, J. and Johnson, M. 2014. “Proactive Versus Reactive Security Investments in the Healthcare
Sector,” MIS Quarterly (38:2), pp. 451-471.
Lazarine, B., Samtani, S., Patton, M., Zhu, H., Ullman, S., Ampel, B., and Chen, H. 2020. “Identifying
Vulnerable GitHub Repositories in Scientific Cyberinfrastructure: An Unsupervised Graph
Embedding Approach,” in 2020 IEEE Conference on Intelligence and Security Informatics (ISI),
IEEE, November, pp. 1-6.
LeCun, Y., Bengio, Y., and Hinton, G. 2015. “Deep Learning,” Nature (521:7553), pp. 436–444.
Letarte, G., Paradis, F., Giguère, P., and Laviolette, F. 2018. “Importance of Self-Attention for Sentiment
Analysis,” in Proceedings of the 2018 EMNLP Workshop BlackboxNLP: Analyzing and Interpreting
Neural Networks for NLP, pp. 267–275.
Li, C., Peters, G., Richardson, V., and Watson, M. 2012. “The Consequences of Information Technology
Control Weaknesses on Management Information Systems: The Case of Sarbanes-Oxley Internal
Control Reports,” MIS Quarterly (36:1), pp. 179-203.
Li, W., Chen, H., and Nunamaker, J. F. 2016. “Identifying and Profiling Key Sellers in Cyber Carding
Community: AZSecure Text Mining System,” Journal of Management Information Systems (33:4),
pp. 1059–1086.
Luong, T., Pham, H., and Manning, C. D. (2015). “Effective Approaches to Attention-based Neural
Machine Translation,” in Proceedings of the 2015 Conference on Empirical Methods in Natural
Language Processing, pp. 1412–1421.
Mahmood, M. A., Siponen, M., Straub, D., Rao, H. R., and Raghu, T. S. 2010. “Moving toward Black
Hat Research in Information Systems Security: An Editorial Introduction to the Special Issue,” MIS
Quarterly (34:3), pp. 431–433.
Mathews, L. 2016. “World’s Biggest Mirai Botnet Is Being Rented Out For DDoS
Attacks,” Forbes. Retrieved June 5, 2017 from
https://www.forbes.com/sites/leemathews/2016/11/29/worlds-biggest-mirai-botnet-is-being-
rented-out-for-ddos-attacks/#f54f54f58ad6
Mell, P. M., Scarfone, K. A., and Romanosky, S. 2007. “A Complete Guide to the Common Vulnerability
Scoring System Version 2.0,” Forum of Incident Response and Security Teams (FIRST), pp. 1–23.
(https://tsapps.nist.gov/publication/get_pdf.cfm?pub_id=51198).
53
McMahon, E., Patton, M., Samtani, S., and Chen, H. 2018. "Benchmarking Vulnerability Assessment
Tools for Enhanced Cyber-Physical System (CPS) Resiliency," in 2018 IEEE International
Conference on Intelligence and Security Informatics (ISI), pp. 100-105.
McMahon, E., Williams, R., El, M., Samtani, S., Patton, M., and Chen, H. 2017. “Assessing Medical
Device Vulnerabilities on the Internet of Things,” in 2017 IEEE International Conference on
Intelligence and Security Informatics (ISI), IEEE, July, pp. 176–178.
Mitra, B., Diaz, F., and Craswell, N. 2016. “Learning to Match Using Local and Distributed
Representations of Text for Web Search,” 26th International World Wide Web Conference, pp.
1291–1299.
Mitra, B., and Craswell, N. 2018. “An Introduction to Neural Information Retrieval.”
(https://www.microsoft.com/en-us/research/uploads/prod/2017/06/fntir2018-neuralir-mitra.pdf).
Mitra, B., Diaz, F., and Craswell, N. 2017. "Learning to Match Using Local and Distributed
Representations of Text for Web Search," in Proceedings of the 26th International Conference on
World Wide Web (WWW'17), pp. 1291-1299.
Nunamaker Jr, J. F., Chen, M., and Purdin, T. D. M. 1990. “Systems Development in Information
Systems Research,” Journal of Management Information Systems (7:3), Taylor & Francis, pp. 89–
106.
Nunes, E., Shakarian, P., and Simari, G. I. 2018. “At-Risk System Identification via Analysis of
Discussions on the Darkweb,” in 2018 APWG Symposium on Electronic Crime Research (ECrime),
IEEE, May, pp. 1–12.
Nunes, E., Diab, A., Gunn, A., Marin, E., Mishra, V., Paliath, V., Robertson, J., Shakarian, J., Thart, A.,
and Shakarian, P. 2016. “Darknet and Deepnet Mining for Proactive Cybersecurity Threat
Intelligence,” in 2016 IEEE Conference on Intelligence and Security Informatics (ISI), IEEE,
September, pp. 7–12.
Pang, L., Lan, Y., Guo, J., Xu, J., and Cheng, X. 2016. “A Study of MatchPyramid Models on Ad-hoc
Retrieval,” Neu-IR’ 16 SIGIR Workshop on Neural Information Retrieval.
Pang, L., Lan, Y., Guo, J., Xu, J., Wan, S., and Cheng, X. 2016. “Text Matching as Image Recognition,”
30th AAAI Conference on Artificial Intelligence (AAAI 2016), pp. 2793–2799.
Peffers, K., Tuunanen, T., Rothenberger, M. A., and Chatterjee, S. 2007. “A Design Science Research
Methodology for Information Systems Research,” Journal of Management Information Systems
(24:3), Taylor & Francis, pp. 45–77.
Rai, A. 2017. “Editor’s Comments: Diversity of Design Science Research,” MIS Quarterly, (41:1), pp.
iii– xviii.
Randbotham, S., Mitra, S., and Ramsey, J. “Are Markets for Vulnerabilities Effective?” MIS Quarterly,
(36:1), pp. 43-64.
Robertson, J., Diab, A., Marin, E., Nunes, E., Paliath, V., Shakarian, J., and Shakarian, P. 2017. Darkweb
Cyber Threat Intelligence Mining, Cambridge: Cambridge University Press.
Robertson, S. E., Walker, S., Jones, S., Hancock-Beaulieu, M. M., and Gatford, M. 1995. "Okapi at Trec-
3," pp. 109-126.
Sabour, S., Frosst, N., and Hinton, G. E. 2017. “Dynamic Routing between Capsules,” Advances in
Neural Information Processing Systems (NeurIPS), December, pp. 3857–3867.
Samtani, S., Chinn, R., Chen, H., and Nunamaker, J. F. 2017. “Exploring Emerging Hacker Assets and
Key Hackers for Proactive Cyber Threat Intelligence,” Journal of Management Information Systems
(34:4), pp. 1023–1053.
Samtani, S., Chinn, K., Larson, C., and Chen, H. 2016. “AZSecure Hacker Assets Portal: Cyber Threat
Intelligence and Malware Analysis,” in 2016 IEEE Conference on Intelligence and Security
Informatics (ISI), IEEE, September, pp. 19–24.
Samtani, S., Chinn, R., and Chen, H. 2015. “Exploring Hacker Assets in Underground Forums,” in 2015
IEEE International Conference on Intelligence and Security Informatics (ISI), IEEE, May, pp. 31–
36.
54
Samtani, S., Yu, S., Zhu, H., Patton, M., and Chen, H. 2016. “Identifying SCADA Vulnerabilities Using
Passive and Active Vulnerability Assessment Techniques,” in 2016 IEEE Conference on
Intelligence and Security Informatics (ISI), IEEE, September, pp. 25–30.
Samtani, S., and Chen, H. 2016. “Using Social Network Analysis to Identify Key Hackers for Keylogging
Tools in Hacker Forums,” in 2016 IEEE Conference on Intelligence and Security Informatics (ISI),
IEEE, September, pp. 319–321.
Samtani, S., Yu, S., Zhu, H., Patton, M., Matherly, J., and Chen, H. 2018. “Identifying SCADA Systems
and Their Vulnerabilities on the Internet of Things: A Text-Mining Approach,” IEEE Intelligent
Systems (33:2), pp. 63–73.
Samtani, S., Kantarcioglu, M., and Chen, H. 2020a. “Trailblazing the Artificial Intelligence for
Cybersecurity Discipline: A Multi-Disciplinary Research Roadmap,” ACM Transactions on
Management Information Systems (11:4), pp 1- 18.
Samtani, S., Zhu, H., Padmanabhan, B., Chai, Y., and Chen, H. 2020b. Deep Learning for Information
Systems Research. (http://arxiv.org/abs/2010.05774).
Samtani, S., Zhu, H., and Chen, H. 2020c. “Proactively Identifying Emerging Hacker Threats from the
Dark Web: A Diachronic Graph Embedding Framework (D-GEF)” ACM Transactions on Privacy
and Security (23:21), pp 1-33.
Samtani, S., Abate, M., Benjamin, V., and Li, W. 2020d. “Cybersecurity as an Industry: A Cyber Threat
Intelligence Perspective” The Palgrave Handbook of International Cybercrime and Cyberdeviance,
Springer International Publishing, pp. 135–154.
Sapienza, A., Bessi, A., Damodaran, S., Shakarian, P., Lerman, K., and Ferrara, E. 2017. “Early Warnings
of Cyber Threats in Online Discussions,” in 2017 IEEE International Conference on Data Mining
Workshops (ICDMW), IEEE, November 29, pp. 667–674.
Sarikaya, R. 2017. "The Technology Behind Personal Digital Assistants an Overview of the System
Architecture and Key Components," IEEE Signal Processing Magazine (34:1), pp. 67-81.
Schäfer, M., Fuchs, M., Strohmeier, M., Engel, M., Liechti, M., and Lenders, V. 2019 "BlackWidow:
Monitoring the Dark Web for Cyber Security Information," in 2019 11th International Conference
on Cyber Conflict (CyCon), Tallinn, Estonia, pp. 1-21.
Schlemper, J., Oktay, O., Schaap, M., Heinrich, M., Kainz, B., Glocker, B., and Rueckert, D. (2019).
Attention gated networks: Learning to leverage salient regions in medical images. Medical Image
Analysis, 53, pp. 197–207.
Sectools.org. 2018. “SecTools.Org: Top 125 Network Security Tools.” (https://sectools.org/, accessed
October 22, 2018).
Shackleford, D. 2016. “2016 Security Analytics Survey,” SANS Institute. (https://www.sans.org/reading-
room/whitepapers/analyst/2016-security-analytics-survey-37467, accessed June 5, 2017).
Shen, Y., He, X., Gao, J., Deng, L., and Mesnil, G. 2014a. “Learning Semantic Representations Using
Convolutional Neural Networks for Web Search,” in Proceedings of the 23rd International
Conference on World Wide Web - WWW ’14 Companion, New York, New York, USA: ACM Press,
pp. 373–374.
Shen, Y., He, X., Gao, J., Deng, L., and Mesnil, G. 2014b. “A latent semantic model with convolutional-
pooling structure for information retrieval,” in Proceedings of the 23rd ACM International
Conference on Conference on Information and Knowledge Management, Shanghai, China: ACM,
pp. 101-110.
Song, Y., Elkahky, A. M., and He, X. 2016. “Multi-Rate Deep Learning for Temporal Recommendation,”
in Proceedings of the 39th International ACM SIGIR Conference on Research and Development in
Information Retrieval - SIGIR ’16, New York, New York, USA: ACM Press, pp. 909–912.
Spears, J. and Barki, H. 2010. “User Participation in Information Systems Security Risk Management,”
MIS Quarterly (34:3), pp. 503-522.
Ullman, S., Samtani, S., Lazarine, B., Zhu, H., Ampel, B., Patton, M., and Chen, H. 2020. “Smart
Vulnerability Assessment for Scientific Cyberinfrastructure: An Unsupervised Graph Embedding
55
Approach,” in 2020 IEEE Conference on Intelligence and Security Informatics (ISI), IEEE,
November, pp. 1-6.
U.S. News & World Report. 2016. “U.S. News & World Report Announces the 2016–17 Best Hospitals.”
(https://www.usnews.com/info/blogs/press-room/articles/2016-08-02/us-news-announces-the-
201617-best-hospitals, accessed June 5, 2017).
Wan, S., Lan, Y., Guo, J., Xu, J., Pang, L., and Cheng, X. 2016. “A Deep Architecture for Semantic
Matching with Multiple Positional Sentence Representations,” 30th AAAI Conference on Artificial
Intelligence (AAAI 2016), pp. 2835–2841.
Wang, J., Gupta, M., and Rao, H. 2015. “Insider Threats in a Financial Institution: Analysis of Attack-
Proneness of Information Systems Applications,” MIS Quarterly (39:1), pp 91-112.
Wang, J., Xiao, N., and Rao H. 2010. “Drivers of Information Security Search Behavior: An Investigation
of Network Attacks and Vulnerability Disclosures.” ACM Transactions on Management Information
Systems (1:1), pp. 1-23.
Wang, S., and Jiang, J. 2017. “Machine Comprehension Using Match-LSTM and Answer Pointer,” 5th
International Conference on Learning Representations (ICLR 2017), pp. 1–11.
Weidman, G. 2014. Penetration Testing: A Hands-On Introduction to Hacking, (1st ed.), No Starch Press.
(https://www.nostarch.com/pentesting).
Williams, R., McMahon, E., Samtani, S., Patton, M., and Chen, H. 2017. “Identifying Vulnerabilities of
Consumer Internet of Things (IoT) Devices: A Scalable Approach,” in 2017 IEEE International
Conference on Intelligence and Security Informatics (ISI), IEEE, July, pp. 179–181.
Williams, R., Samtani, S., Patton, M., and Chen, H. C. 2018. "Incremental Hacker Forum Exploit
Collection and Classification for Proactive Cyber Threat Intelligence: An Exploratory Study," in
2018 IEEE International Conference on Intelligence and Security Informatics (ISI)), pp. 94-99.
Vance, A., Lowry, P., and Eggett, D. 2015. “Increasing Accountability Through User-Interface Design
Artifacts: A New Approach to Addressing the Problem of Access Policy Violations,” MIS Quarterly
(39:2), pp. 345-366.
Vashishth, S., Upadhyay, S., Tomar, G. S., and Faruqui, M. 2019. “Attention Interpretability Across NLP
Tasks,” in International Conference on Learning Representations (ICLR). pp. 1-10.
(http://arxiv.org/abs/1909.11218).
Venkatesh, V., Morris, M. G., Davis, G. B., and Davis, F. D. 2003. “User Acceptance of Information
Technology: Toward a Unified View,” MIS Quarterly (27:3), pp. 425-478.
Xiong, C. Y., Dai, Z. Y., Callan, J., Liu, Z. Y., and Power, R. 2017. "End-to-End Neural Ad-Hoc Ranking
with Kernel Pooling," SIGIR'17: Proceedings of the 40th International ACM SIGIR Conference on
Research and Development in Information Retrieval), pp. 55-64.
Yang, L., Ai, Q. Y., Guo, J. F., and Croft, W. B. 2016. "aNMM: Ranking Short Answer Texts with
Attention-Based Neural Matching Model," CIKM'16: Proceedings of the 2016 ACM Conference on
Information and Knowledge Management), pp. 287-296.
Zeng, D., Chen, H., Lusch, R., and Li, S.-H. 2010. “Social Media Analytics and Intelligence,” IEEE
Intelligent Systems (25:6), pp. 13–16. (https://doi.org/10.1109/MIS.2010.151).
Zhang, S. A., Yao, L. N., Sun, A. X., and Tay, Y. 2019. "Deep Learning Based Recommender System: A
Survey and New Perspectives," ACM Computing Surveys (52:1), pp. 1-35.
Zhou, G. Y., Zhou, Y., He, T. T., and Wu, W. S. 2016. "Learning Semantic Representation with Neural
Networks for Community Question Answering Retrieval," Knowledge-Based Systems (93:1), pp.
75-83.
Zhu, H., Samtani, S., Brown, R., and Chen, H. 2021. “A Deep Learning Approach for Recognizing
Activity of Daily Living (ADL) for Senior Care: Exploiting Interaction Dependency and Temporal
Patterns,” MIS Quarterly (45:2), pp. 859-896.
Zhu, H., Samtani, S., Chen, H., and Nunamaker, J. F. 2020. “Human Identification for Activities of Daily
Living: A Deep Transfer Learning Approach,” Journal of Management Information Systems (37:2),
pp. 457–483.
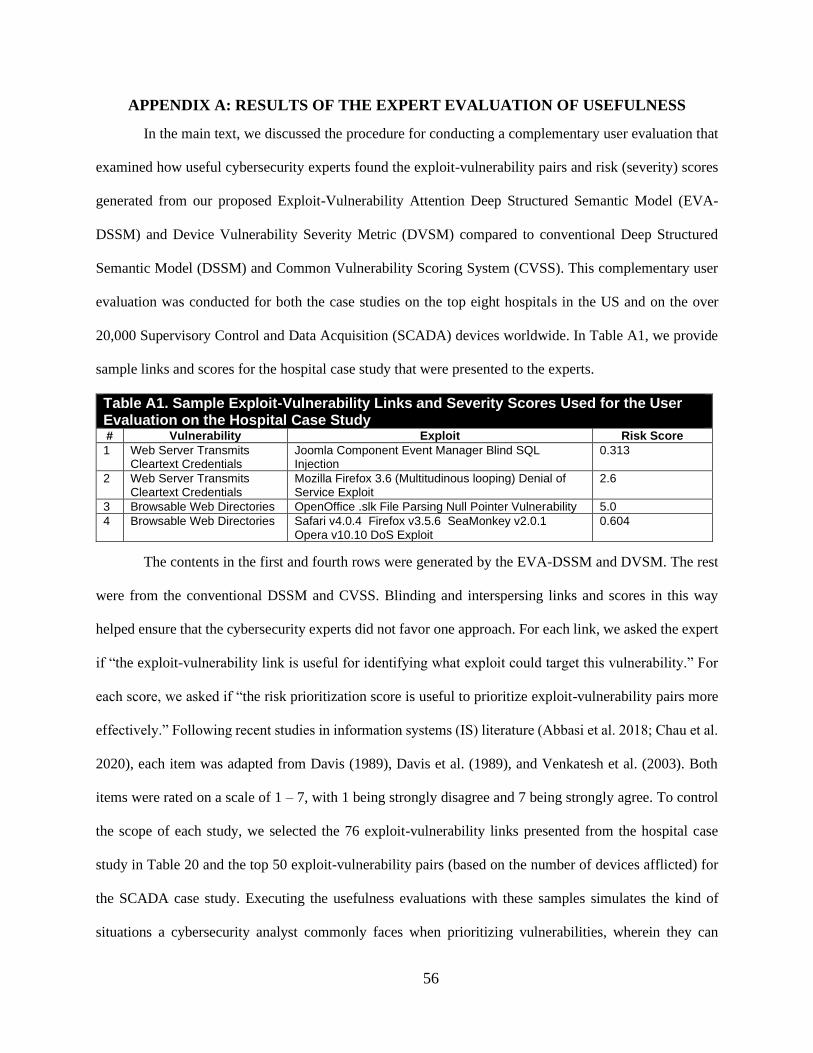
56
APPENDIX A: RESULTS OF THE EXPERT EVALUATION OF USEFULNESS
In the main text, we discussed the procedure for conducting a complementary user evaluation that
examined how useful cybersecurity experts found the exploit-vulnerability pairs and risk (severity) scores
generated from our proposed Exploit-Vulnerability Attention Deep Structured Semantic Model (EVA-
DSSM) and Device Vulnerability Severity Metric (DVSM) compared to conventional Deep Structured
Semantic Model (DSSM) and Common Vulnerability Scoring System (CVSS). This complementary user
evaluation was conducted for both the case studies on the top eight hospitals in the US and on the over
20,000 Supervisory Control and Data Acquisition (SCADA) devices worldwide. In Table A1, we provide
sample links and scores for the hospital case study that were presented to the experts.
Table A1. Sample Exploit-Vulnerability Links and Severity Scores Used for the User Evaluation on the Hospital Case Study # Vulnerability Exploit Risk Score
1 Web Server Transmits Cleartext Credentials
Joomla Component Event Manager Blind SQL Injection
0.313
2 Web Server Transmits Cleartext Credentials
Mozilla Firefox 3.6 (Multitudinous looping) Denial of Service Exploit
2.6
3 Browsable Web Directories OpenOffice .slk File Parsing Null Pointer Vulnerability 5.0
4 Browsable Web Directories Safari v4.0.4 Firefox v3.5.6 SeaMonkey v2.0.1 Opera v10.10 DoS Exploit
0.604
The contents in the first and fourth rows were generated by the EVA-DSSM and DVSM. The rest
were from the conventional DSSM and CVSS. Blinding and interspersing links and scores in this way
helped ensure that the cybersecurity experts did not favor one approach. For each link, we asked the expert
if “the exploit-vulnerability link is useful for identifying what exploit could target this vulnerability.” For
each score, we asked if “the risk prioritization score is useful to prioritize exploit-vulnerability pairs more
effectively.” Following recent studies in information systems (IS) literature (Abbasi et al. 2018; Chau et al.
2020), each item was adapted from Davis (1989), Davis et al. (1989), and Venkatesh et al. (2003). Both
items were rated on a scale of 1 – 7, with 1 being strongly disagree and 7 being strongly agree. To control
the scope of each study, we selected the 76 exploit-vulnerability links presented from the hospital case
study in Table 20 and the top 50 exploit-vulnerability pairs (based on the number of devices afflicted) for
the SCADA case study. Executing the usefulness evaluations with these samples simulates the kind of
situations a cybersecurity analyst commonly faces when prioritizing vulnerabilities, wherein they can
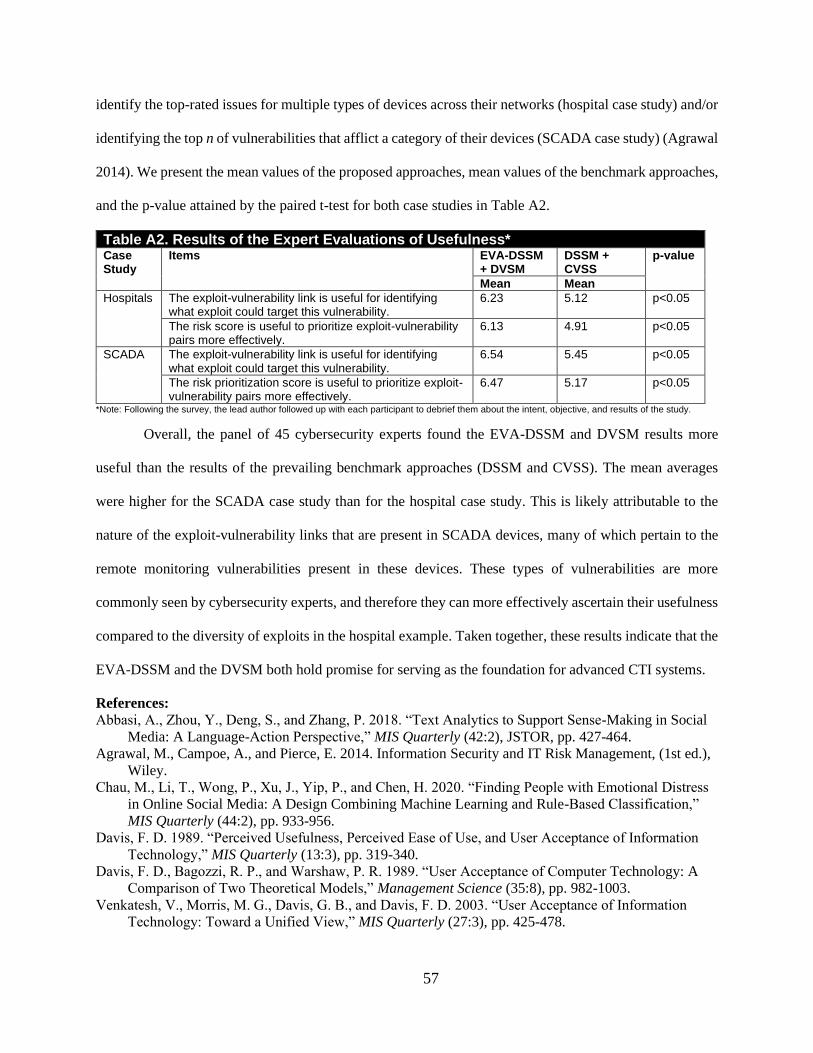
57
identify the top-rated issues for multiple types of devices across their networks (hospital case study) and/or
identifying the top n of vulnerabilities that afflict a category of their devices (SCADA case study) (Agrawal
2014). We present the mean values of the proposed approaches, mean values of the benchmark approaches,
and the p-value attained by the paired t-test for both case studies in Table A2.
Table A2. Results of the Expert Evaluations of Usefulness*
Case Study
Items EVA-DSSM + DVSM
DSSM + CVSS
p-value
Mean Mean
Hospitals The exploit-vulnerability link is useful for identifying what exploit could target this vulnerability.
6.23 5.12 p<0.05
The risk score is useful to prioritize exploit-vulnerability pairs more effectively.
6.13 4.91 p<0.05
SCADA The exploit-vulnerability link is useful for identifying what exploit could target this vulnerability.
6.54 5.45 p<0.05
The risk prioritization score is useful to prioritize exploit-vulnerability pairs more effectively.
6.47 5.17 p<0.05
*Note: Following the survey, the lead author followed up with each participant to debrief them about the intent, objective, and results of the study.
Overall, the panel of 45 cybersecurity experts found the EVA-DSSM and DVSM results more
useful than the results of the prevailing benchmark approaches (DSSM and CVSS). The mean averages
were higher for the SCADA case study than for the hospital case study. This is likely attributable to the
nature of the exploit-vulnerability links that are present in SCADA devices, many of which pertain to the
remote monitoring vulnerabilities present in these devices. These types of vulnerabilities are more
commonly seen by cybersecurity experts, and therefore they can more effectively ascertain their usefulness
compared to the diversity of exploits in the hospital example. Taken together, these results indicate that the
EVA-DSSM and the DVSM both hold promise for serving as the foundation for advanced CTI systems.
References:
Abbasi, A., Zhou, Y., Deng, S., and Zhang, P. 2018. “Text Analytics to Support Sense-Making in Social
Media: A Language-Action Perspective,” MIS Quarterly (42:2), JSTOR, pp. 427-464.
Agrawal, M., Campoe, A., and Pierce, E. 2014. Information Security and IT Risk Management, (1st ed.),
Wiley.
Chau, M., Li, T., Wong, P., Xu, J., Yip, P., and Chen, H. 2020. “Finding People with Emotional Distress
in Online Social Media: A Design Combining Machine Learning and Rule-Based Classification,”
MIS Quarterly (44:2), pp. 933-956.
Davis, F. D. 1989. “Perceived Usefulness, Perceived Ease of Use, and User Acceptance of Information
Technology,” MIS Quarterly (13:3), pp. 319-340.
Davis, F. D., Bagozzi, R. P., and Warshaw, P. R. 1989. “User Acceptance of Computer Technology: A
Comparison of Two Theoretical Models,” Management Science (35:8), pp. 982-1003.
Venkatesh, V., Morris, M. G., Davis, G. B., and Davis, F. D. 2003. “User Acceptance of Information
Technology: Toward a Unified View,” MIS Quarterly (27:3), pp. 425-478.