Embed Size (px)
Citation preview

Kay Diederichs
University of Konstanz
Linking crystallographic model and data quality: theory and
applications

Crystallography is highly successful
Can we do better?

Errors in experimental data
Error = random + systematic
Random = counting + detector
Systematic = Radiation damage
+ absorption + non-linearities
+ vibrations + instabilities + …
“If you don’t have good data, then you have no data at all.” -Sung-Hou Kim
“If you don’t have good data, then you must learn statistics.” - James Holton
Multiplicity of n reduces the random error by √n
Multiplicity may reduce the systematic error by √n, but not necessarily!

Crystallographic statistics - which indicators are being used?
• Data R-values: Rpim < Rmerge=Rsym < Rmeas
• Model R-values: Rwork/Rfree
• I/σ (for unmerged or merged data !)
Rmerge=∑hkl
∑i=1
n
∣I i (hkl )− I (hkl )∣
∑hkl
∑i=1
n
I i (hkl )
Rwork / free=∑hkl
∣F obs (hkl )−F calc (hkl )∣
∑hkl
Fobs (hkl )
Rmeas=∑hkl √
nn−1
∑i=1
n
∣I i (hkl )− I (hkl )∣
∑hkl
∑i=1
n
I i (hkl )
R pim=∑hkl
√1 /n−1∑i=1
n
∣I i (hkl )− I (hkl )∣
∑hkl
∑i=1
n
I i (hkl )

Precision can be calculated for …either the unmerged (individual) observations:
Rmerge
, Rmeas
, I/σobs
… or for the merged data:
Rpim
, CC1/2
, I/σmerged
It is essential to understand the difference, but it is not in the papers or textbooks!
Precision of unmerged and merged data

Crystallographic statistics - which indicators are being used?
• Data R-values: Rpim < Rmerge=Rsym < Rmeas
• Model R-values: Rwork/Rfree
• I/σ (for unmerged or merged data !)
Rmerge=∑hkl
∑i=1
n
∣I i (hkl )− I (hkl )∣
∑hkl
∑i=1
n
I i (hkl )
Rwork / free=∑hkl
∣F obs (hkl )−F calc (hkl )∣
∑hkl
Fobs (hkl )
Rmeas=∑hkl √
nn−1
∑i=1
n
∣I i (hkl )− I (hkl )∣
∑hkl
∑i=1
n
I i (hkl )
R pim=∑hkl
√1 /n−1∑i=1
n
∣I i (hkl )− I (hkl )∣
∑hkl
∑i=1
n
I i (hkl )merged data
unmerged data
merged data
unmerged data

Decisions and compromises
Which high-resolution cutoff for refinement?Higher resolution means better accuracy and mapsBut: high resolution yields high Rwork/Rfree!Basic questions: what to optimize? Is the data/model R-value a good predictor/indicator of model quality? How good need the data be; to what extent do the data influence the refinement result? What to refine, and when to stop? Overfitting?
Which datasets/frames to include into scaling? Reject negative observations or unique reflections?
The reason why it is difficult to answer “R-value questions” is that no proper mathematical theory exists that uses absolute differences; concerning the use of R-values, Crystallography is disconnected from mainstream Statistics
Conflicting views
„An appropriate choice of resolution cutoff is difficult and sometimes seems to be performed mainly to satisfy referees ... Ideally, we would determine the point at which adding the next shell of data is not adding any statistically significant information ... Rmerge is not a very useful criterion.“P. Evans (2011) An introduction to data reduction: space-group determination, scaling and intensity statistics. Acta Cryst. D67, 282 "At the highest resolution shell, the Rmerge can be allowed to reach 30–40% for low-symmetry crystals and up to 60% for high-symmetry crystals, since in the latter case the redundancy is usually higher."A. Wlodawer, W. Minor, Z. Dauter and M. Jaskolski (2008) Protein crystallography for non-crystallographers, or how to get the best (but not more) from published macromolecular structures. FEBS J. 275, 1
“... the accepted resolution limit is where the I/sigI falls below about 2.0. Rmerge
may then reach 20-40%, depending on the symmetry and redundancy.“Z. Dauter (1999) Data-collection strategies. Acta Cryst D55, 1703

2010 PDB depositions
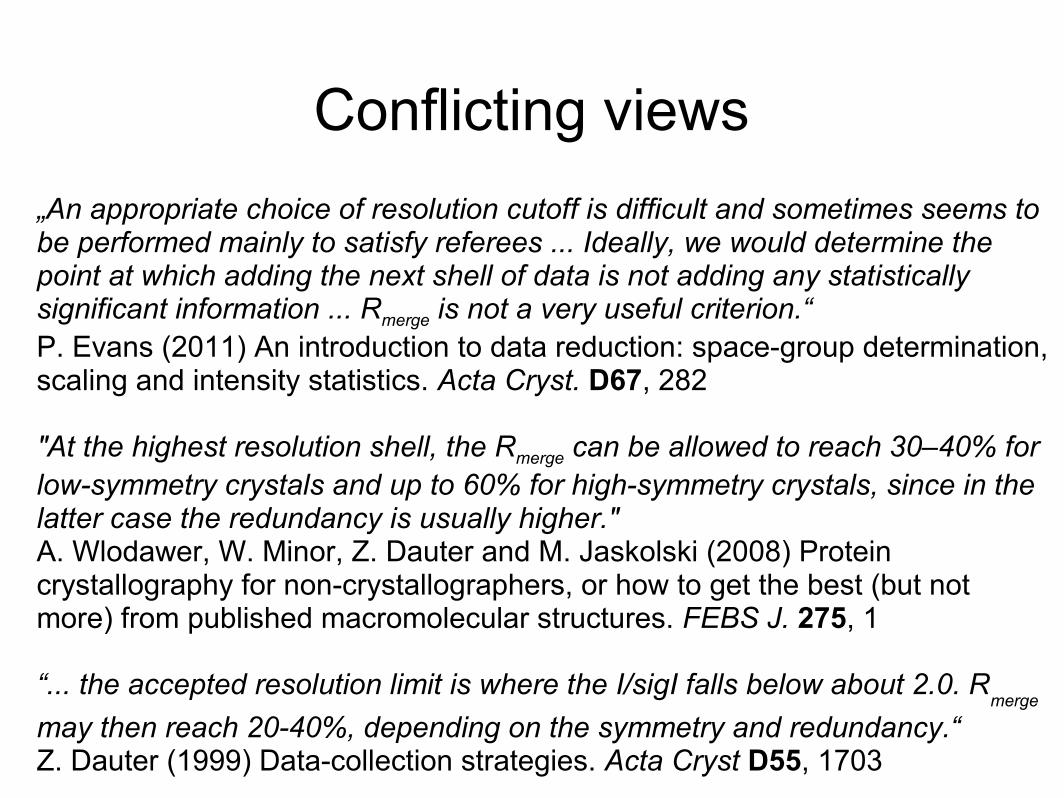
The asymptotic behaviour of model and data R-values is different at high resolution
Data R-values (Rpim , Rmerge , Rmeas): with resolution, go to infinity since the numerator is constant (determined by background), and the denominator approaches zero
Model R-values (Rwork/free): the ratio of numerator and denominator approaches a constant for a random or wrong model (Wilson 1950), or for random data (Evans & Murshudov 2013)
This means that at high resolution, a quantitative relation cannot exist between model and data R-values !
Rmerge=∑hkl
∑i=1
n
∣I i (hkl )− I (hkl )∣
∑hkl
∑i=1
n
I i (hkl )
Rwork / free=∑hkl
∣F obs (hkl )−F calc (hkl )∣
∑hkl
Fobs (hkl )

Crystallographic reasoning
1. Better data allow to obtain a better model
2. A better model has a lower Rfree, and a lower Rfree-Rwork gap
3. Comparison of model R-values is only meaningful when using the same data
4. Taken together, this leads to the „paired refinement technique“: compare models in terms of their R-values against the same data.

Example: Cysteine DiOxygenase (CDO; PDB 3ELN) re-refined against 15-fold weaker data
Rmerge ■
Rpim ●
Rfree
Rwork
I/sigma

Is there information beyond the conservative hi-res cutoff?
“Paired refinement technique“:
• refine at (e.g.) 2.0Å and at 1.9Å using the same starting model and refinement parameters• since it is meaningless to compare R-values at different resolutions, calculate the overall R-values of the 1.9Å model at 2.0Å (main.number_of_macro_cycles=1 strategy=None fix_rotamers=False ordered_solvent=False)
• ΔR=R1.9(2.0)-R2.0(2.0)

Do the maps really get better?
• cooperation with JCSG: Henry van den Bedem, Ashley M. Deacon, Abhinav Kumar
• identified 5 structures where re-processing of existing raw data permits to extend the resolution by another 0.2-0.3Å, with full completeness
• reprocessing with XDS/MOSFLM; refinement with refmac/phenix.refine
• calculate real-space CC of map and model, using EDSTATS (CCP4) or phenix.resolve

Example 1/5

Summary I
• Rmerge should no longer be considered as useful for deciding on a high-resolution cutoff
• The paired refinement technique can prove that data should be used to higher resolution than a (Rmerge-based) conservative cutoff suggests

measuring data quality with a correlation coefficient
• Correlation coefficient has clear meaning and well-known statistical properties
• Significance of its value can be assessed by Student's t-test (e.g. CC>0.3 is significant at p=0.01 for n>100; CC>0.08 is significant at p=0.01 for n>1000)
• Apply this idea to crystallographic intensity data: use “random half-datasets” → CC1/2 (called CC_Imean by SCALA/aimless, now CC
1/2 )
• From CC1/2 , we can analytically estimate CC of the full dataset against the true (usually unmeasurable) intensities using
(Karplus and Diederichs (2012) Science 336, 1030)
CC*=√ 2CC1/21+CC 1/2

Data CCs
CC1/2 ◊
CC* Δ
I/sigma

Model CCs
• We can define CCwork, CCfree as CCs calculated on Fcalc2 of the
working and free set, against the experimental data• CCwork and CCfree can be directly compared with CC*
― CC*
Dashes: CCwork , CCfree against weak exp‘tl data
Dots: CC‘work , CC‘free against strong 3ELN data

Quantitative relation between data and model CCs
• Refinement should make CCwork converge towards CC* (from lower values)
• Inadequate model, or wrong space group, or systematic errors in data processing: CCwork remains < CC*
• If CCwork > CC*: the model is closer to the data, than the truth is to the data : “overfitting”

Summary II • CC1/2 assesses the statistical significance of data
• tells us the agreement between
experimental data and true data (!)
• CC* is the upper limit for the CCwork /CCfree model quality
indicators
• CC1/2, CC*, CCwork/CCfree table can be obtained from 1.8.2
Phenix distribution; the routine is called phenix.cc_star
CC*=√ 2CC1/21+CC 1/2

Four new concepts for improving crystallographic procedures
Image courtesy of
P.A. Karplus

References
Andy Karplus, Oregon State
University (Corvallis, OR)
P.A. Karplus and K. Diederichs (2012) Linking Crystallographic Data with Model Quality. Science 336, 1030-1033. see also: P.R. Evans (2012) Resolving
Some Old Problems in Protein Crystallography. Science 336, 986-987.
K. Diederichs and P.A. Karplus (2013) Better models by discarding data? Acta Cryst. D69, 1215-1222.
P. R. Evans and G. N. Murshudov (2013) How good are my data and what is the resolution? Acta Cryst. D69, 1204-1214.
Acknowledgement