Embed Size (px)
Citation preview

LinkedIn Economic Graph ProjectUnderstanding Trade Through International Connections
In Partnership with the Ontario Ministry of International TradeFEBRUARY 2018

The Economic Graph as a Tool to Advance Ontario’s Global Trade Strategy
Trade is measured in many ways, from import and export volumes, to goods and services but rarely has workforce connectivity been factored into the equation.
Today’s global market place is a highly complex and connected ecosystem. Rapid change is a hallmark of globalization, however, one constant remains – strong professional relationships, networks and partnerships are vital for businesses to compete and succeed in an increasingly interconnected global economy.
Modern economies are highly innovative and adaptable, leveraging all available assets to grow trade and create economic opportunity for future generations. One of Ontario’s greatest advantages that separate the province from the competition is ourpeople – our diverse and innovative talent.
To support the Ministry of International Trade’s Global Trade Strategy, the province has partnered with LinkedIn to leverage Ontario’s global talent connections, capitalize on global trade networks and harness micro and macro level data to analyze labour force trends in specific sectors.
For the first time ever, the LinkedIn Economic Graph has been adapted with a trade focus to determine how globally connected Ontario’s workforce is and what markets and sectors demonstrate the highest potential for export growth through these connections. Home to a globally connected workforce and businesses with an international reach, Ontario is in a position to intensify and increase its export capacity through targeted and tailored programs and services.
02
Key Findings
SCOPE:
• Ontario is the 2nd most internationally connected jurisdiction in North America.
SPAN:
• Ontario’s professional network is highly diverse with the province’s workforce connected to countries all around the world representing considerable market opportunities.
SECTOR:
• Ontario’s connectivity is as diverse as its sectors with global connections accounting for a substantial portion of all connections across various different industries.
SCALE:
• Small- and medium-sized businesses demonstrate a high level of connectivity similar to larger firms.
STRATEGY:
• The Ministry of International Trade will seek ways to utilize the results of the Economic Graph to drive export development and trade diversification into un-tapped markets.
03

OVERVIEW OF ONTARIO LINKEDIN MEMBERSHIP
G L O B A L : 500M+C A N A D A : 14M+O N T A R I O : 4 .8M
ONTARIO
04
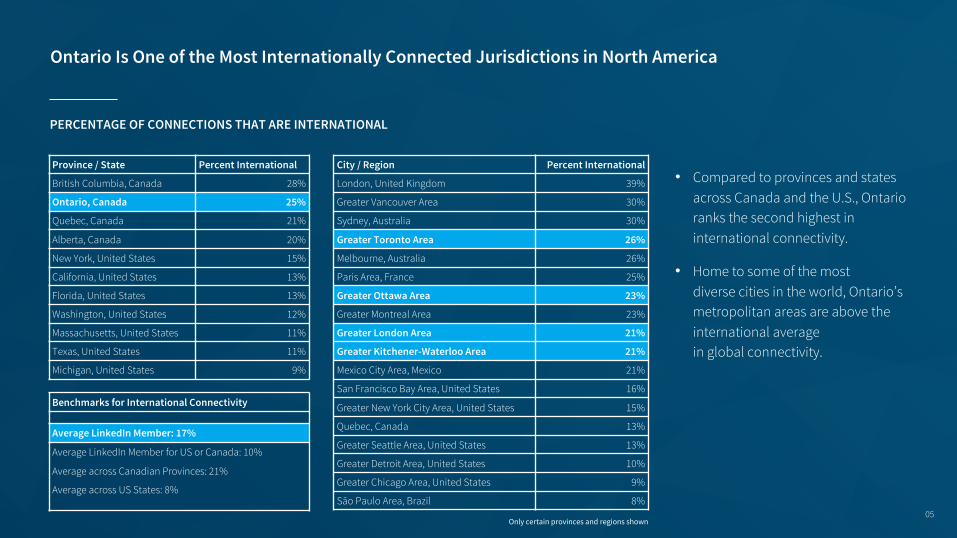
Ontario Is One of the Most Internationally Connected Jurisdictions in North America
• Compared to provinces and states across Canada and the U.S., Ontario ranks the second highest in international connectivity.
• Home to some of the most diverse cities in the world, Ontario’s metropolitan areas are above the international average in global connectivity.
PERCENTAGE OF CONNECTIONS THAT ARE INTERNATIONAL
Province / State Percent International
British Columbia, Canada 28%
Ontario, Canada 25%
Quebec, Canada 21%
Alberta, Canada 20%
New York, United States 15%
California, United States 13%
Florida, United States 13%
Washington, United States 12%
Massachusetts, United States 11%
Texas, United States 11%
Michigan, United States 9%
City / Region Percent International
London, United Kingdom 39%
Greater Vancouver Area 30%
Sydney, Australia 30%
Greater Toronto Area 26%
Melbourne, Australia 26%
Paris Area, France 25%
Greater Ottawa Area 23%
Greater Montreal Area 23%
Greater London Area 21%
Greater Kitchener-Waterloo Area 21%
Mexico City Area, Mexico 21%
San Francisco Bay Area, United States 16%
Greater New York City Area, United States 15%
Quebec, Canada 13%
Greater Seattle Area, United States 13%
Greater Detroit Area, United States 10%
Greater Chicago Area, United States 9%
São Paulo Area, Brazil 8%
Benchmarks for International Connectivity
Average LinkedIn Member: 17%
Average LinkedIn Member for US or Canada: 10%
Average across Canadian Provinces: 21%
Average across US States: 8%
05Only certain provinces and regions shown
UNITED STATES
MEXICO
UNITED KINGDOM
IRELAND
SPAIN
NIGERIA
AUSTRALIA
JAPAN
PHILIPPINES
SINGAPORE
SOUTH AFRICA
ITALY CHINA
BANGLADESHHONG KONG
PAKISTAN
IRAN
GERMANYSWITZERLAND
NETHERLANDS
FRANCE
INDIA
ISRAEL
EGYPTQATAR
SAUDI ARABIAUNITED ARAB EMIRATES
COLOMBIA
BRAZIL
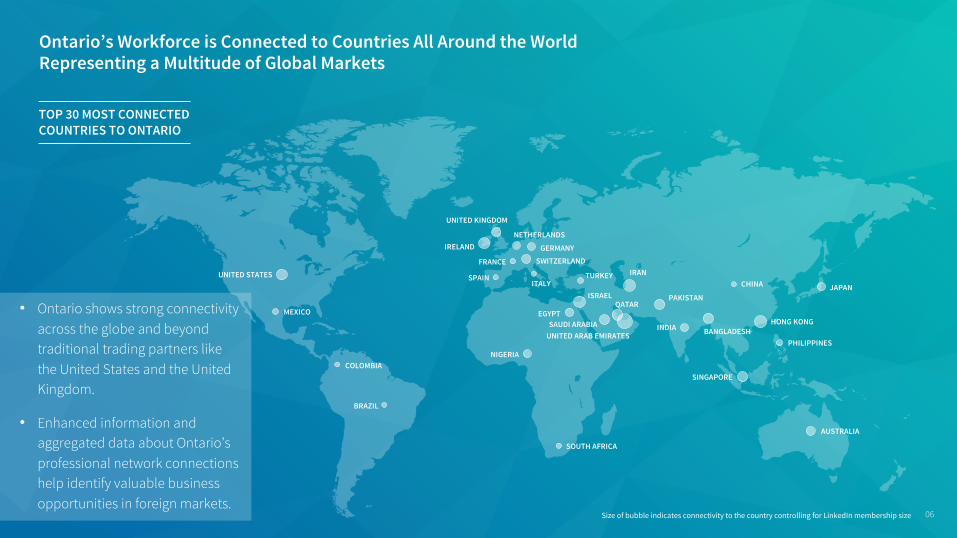
• Ontario shows strong connectivity across the globe and beyond traditional trading partners like the United States and the United Kingdom.
• Enhanced information and aggregated data about Ontario’s professional network connections help identify valuable business opportunities in foreign markets.
Size of bubble indicates connectivity to the country controlling for LinkedIn membership size
TOP 30 MOST CONNECTED COUNTRIES TO ONTARIO
Ontario’s Workforce is Connected to Countries All Around the World Representing a Multitude of Global Markets
06
TURKEY
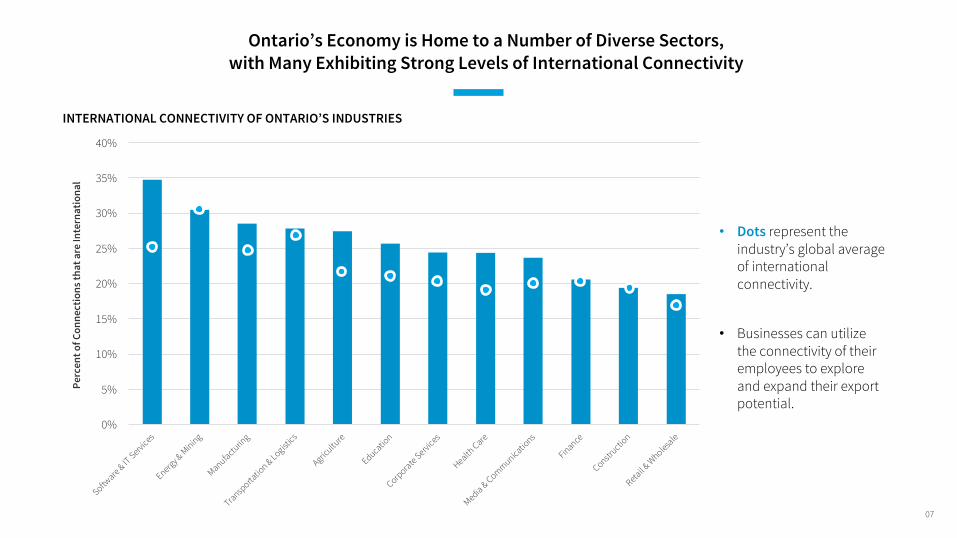
Ontario’s Economy is Home to a Number of Diverse Sectors, with Many Exhibiting Strong Levels of International Connectivity
• Businesses can utilize the connectivity of their employees to explore and expand their export potential.
• Dots represent the industry’s global average of international connectivity.
0%
5%
10%
15%
20%
25%
30%
35%
40%
Software & IT
Services
Energy & Mining
Manufacturing
Transportatio
n & Logistics
Agricultu
re
Education
Corporate Services
Health Care
Media & Communications
Finance
Constructio
n
Retail & W
holesale
INTERNATIONAL CONNECTIVITY OF ONTARIO’S INDUSTRIES
07
Perc
ent o
f Con
nect
ions
that
are
Inte
rnat
iona
l
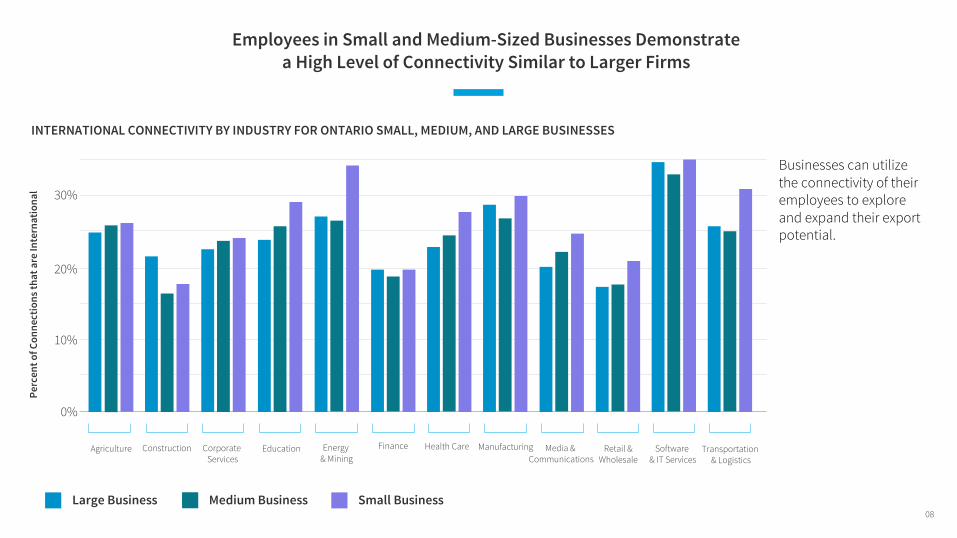
Employees in Small and Medium-Sized Businesses Demonstrate a High Level of Connectivity Similar to Larger Firms
Small BusinessMedium Business
30%
20%
10%
0%
Software & IT Services
Energy & Mining
Manufacturing Transportation & Logistics
Agriculture EducationCorporate Services
Health Care Media & Communications
FinanceConstruction Retail &Wholesale
INTERNATIONAL CONNECTIVITY BY INDUSTRY FOR ONTARIO SMALL, MEDIUM, AND LARGE BUSINESSES
Businesses can utilize the connectivity of their employees to explore and expand their export potential.
Large Business08
Perc
ent o
f Con
nect
ions
that
are
Inte
rnat
iona
l

Professions in Ontario Boast Above-Average Levels of International Connections that can be Leveraged to Build New Trade Relationships
INTERNATIONAL CONNECTIVITY OF ONTARIO JOB FUNCTIONS, INDEXED AGAINST ALL LINKEDIN
PERCENT OF ONTARIO LINKEDIN MEMBERSHIP
INTE
RNAT
IONA
L CO
NNEC
TIVI
TY IN
DEX
1.0
1.1
1.2
1.3
0.0% 2.5% 5.0% 7.5%
PURCHASING
MARKETING
CONSULTING
FINANCE
ACCOUNTING
ENGINEERING
INFORMATION TECHNOLOGY
EDUCATION
COMMUNITY AND SOCIAL SERVICES
HEALTHCARE SERVICES
BUSINESS DEVELOPMENT
ENTREPRENEURSHIP
SALES
OPERATIONS
RESEARCH
MEDIA AND COMMUNICATION
SUPPORTPROGRAM AND PROJECT MANAGEMENT
HUMAN RESOURCES
• International connectivity goes beyond roles that have a business development function.
• Professions ranking above average in international connectivity are diverse demonstrating that people in various roles within an organization can foster export development.
Dotted line represents the function’s global average of international connectivity.
09
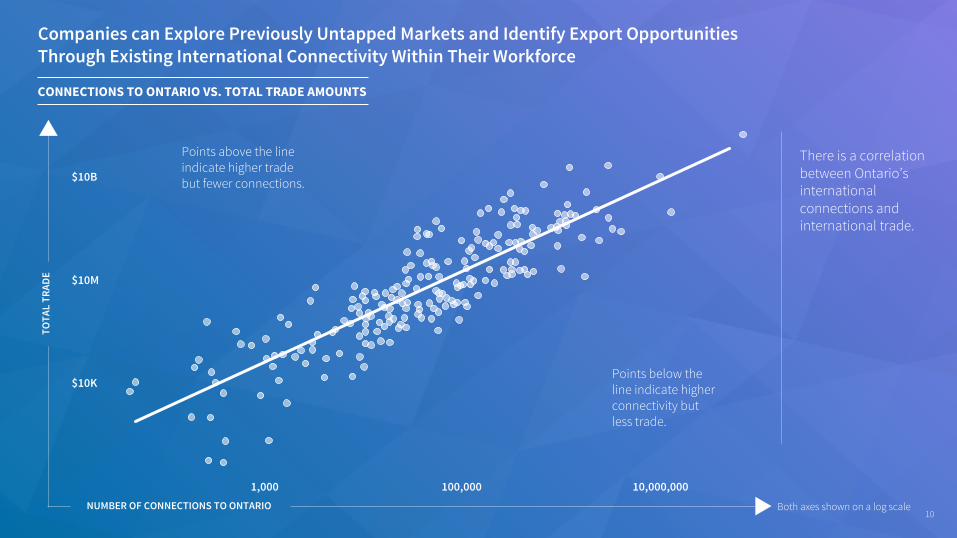
Companies can Explore Previously Untapped Markets and Identify Export Opportunities Through Existing International Connectivity Within Their Workforce
NUMBER OF CONNECTIONS TO ONTARIO
TOTA
L TR
ADE
1,000 100,000 10,000,000
$10B
$10M
$10K
CONNECTIONS TO ONTARIO VS. TOTAL TRADE AMOUNTS
Points above the line indicate higher trade but fewer connections.
Both axes shown on a log scale
Points below the line indicate higher connectivity but less trade.
There is a correlation between Ontario’s international connections and international trade.
10
India
UAEAustralia
Brazil
PakistanSaudi Arabia
IranNigeria
Ireland
TOTA
L TR
ADE
100,000 10,000,000
$10B
$10M
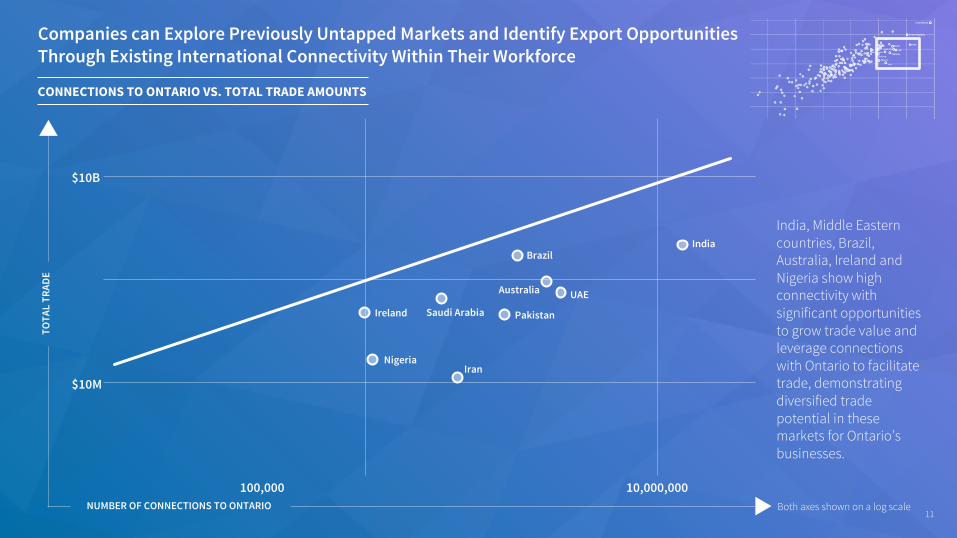
Companies can Explore Previously Untapped Markets and Identify Export Opportunities Through Existing International Connectivity Within Their Workforce
11Both axes shown on a log scaleNUMBER OF CONNECTIONS TO ONTARIO
CONNECTIONS TO ONTARIO VS. TOTAL TRADE AMOUNTS
India, Middle Eastern countries, Brazil, Australia, Ireland and Nigeria show high connectivity with significant opportunities to grow trade value and leverage connections with Ontario to facilitate trade, demonstrating diversified trade potential in these markets for Ontario’s businesses.
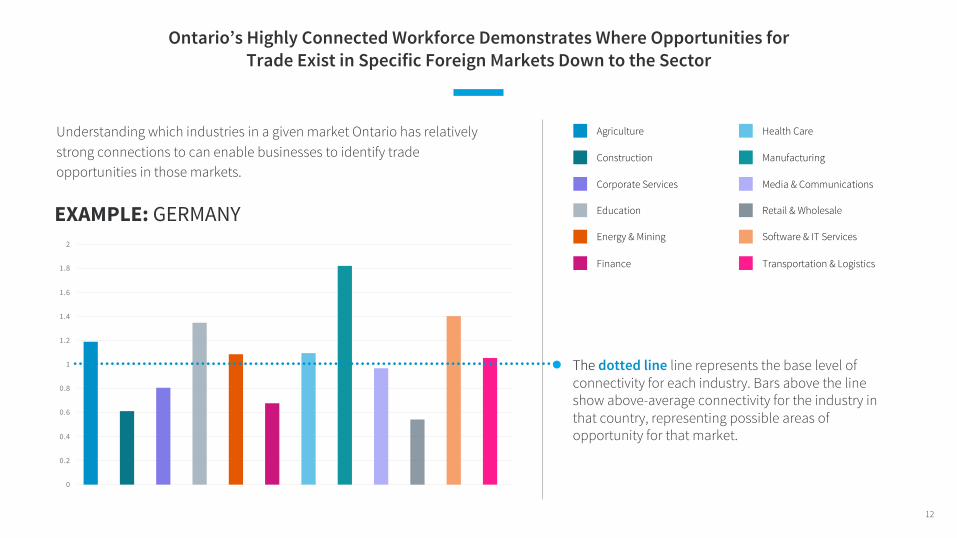
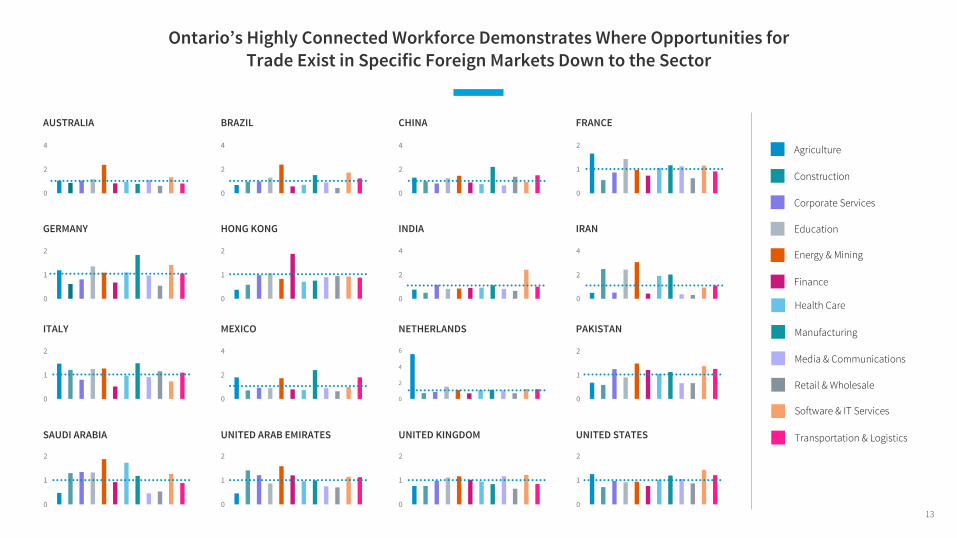
Ontario’s Highly Connected Workforce Demonstrates Where Opportunities for Trade Exist in Specific Foreign Markets Down to the Sector
EXAMPLE: GERMANY
Agriculture
Construction
Corporate Services
Education
Energy & Mining
Finance
Health Care
Manufacturing
Media & Communications
Retail & Wholesale
Software & IT Services
Transportation & Logistics
Understanding which industries in a given market Ontario has relatively strong connections to can enable businesses to identify trade opportunities in those markets.
0
0.2
0.4
0.6
0.8
1
1.2
1.4
1.6
1.8
2
The dotted line line represents the base level of connectivity for each industry. Bars above the line show above-average connectivity for the industry in that country, representing possible areas of opportunity for that market.
12
0
1
2
AUSTRALIA
GERMANY
ITALY
SAUDI ARABIA
BRAZIL
HONG KONG
MEXICO
UNITED ARAB EMIRATES
CHINA
INDIA
NETHERLANDS
UNITED KINGDOM
FRANCE
IRAN
PAKISTAN
UNITED STATES
Ontario’s Highly Connected Workforce Demonstrates Where Opportunities for Trade Exist in Specific Foreign Markets Down to the Sector
Agriculture
Construction
Corporate Services
Education
Energy & Mining
Finance
Health Care
Manufacturing
Media & Communications
Retail & Wholesale
Software & IT Services
Transportation & Logistics
0
2
4
0
1
2
0
1
2
0
1
2
0
2
4
0
2
4
0
1
2
0
2
4
0
2
4
0
2
4
6
0
1
2
0
2
4
0
1
2
0
1
2
0
1
2
13
0
0.5
1
1.5
2
2.5
3
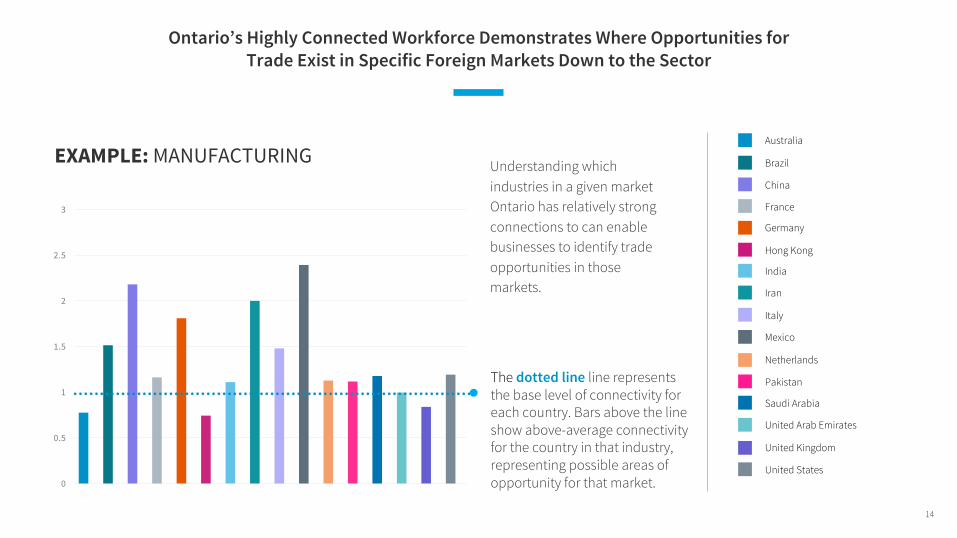
EXAMPLE:MANUFACTURINGAustralia
Brazil
China
France
Germany
Hong Kong
India
Iran
Italy
Mexico
Netherlands
Pakistan
Saudi Arabia
United Arab Emirates
United Kingdom
United States
Ontario’s Highly Connected Workforce Demonstrates Where Opportunities for Trade Exist in Specific Foreign Markets Down to the Sector
The dotted line line represents the base level of connectivity for each country. Bars above the line show above-average connectivity for the country in that industry, representing possible areas of opportunity for that market.
14
Understanding which industries in a given market Ontario has relatively strong connections to can enable businesses to identify trade opportunities in those markets.
0
0.5
1
1.5
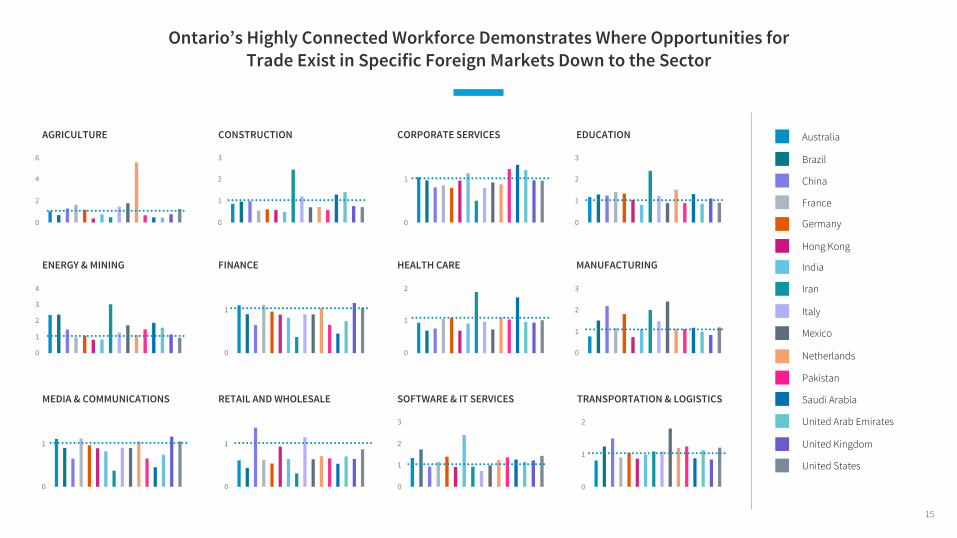
Ontario’s Highly Connected Workforce Demonstrates Where Opportunities for Trade Exist in Specific Foreign Markets Down to the Sector
AGRICULTURE
ENERGY & MINING
MEDIA & COMMUNICATIONS
CONSTRUCTION
FINANCE
RETAIL AND WHOLESALE
CORPORATE SERVICES
HEALTH CARE
SOFTWARE & IT SERVICES
EDUCATION
MANUFACTURING
TRANSPORTATION & LOGISTICS
0
1
2
3
4
0
2
4
6
0
0.5
1
1.5
0
0.5
1
1.5
0
1
2
3
0
1
2
3
0
0.5
1
1.5
2
0
0.5
1
1.5
0
0.5
1
1.5
2
0
1
2
3
0
1
2
3
Australia
Brazil
China
France
Germany
Hong Kong
India
Iran
Italy
Mexico
Netherlands
Pakistan
Saudi Arabia
United Arab Emirates
United Kingdom
United States
15
What We’ve Learned
The LinkedIn Economic Graph has been adapted with a specific focus on trade to support one of the key priorities of Ontario’s Global Trade Strategy – driving better intelligence for stronger trade outcomes.
When it comes to trade, one of Ontario’s greatest advantages is its talent. The province’s diverse, talented and innovative workforce is a valuable asset that can be leveraged to enhance and expand Ontario’s export potential.
Home to a diverse array of sectors with international reach, Ontario’s small- and medium-sized businesses can utilize a globally connected workforce to develop and deepen business-to-business relationships abroad to increase trade.
The findings presented in the LinkedIn Economic Graph will help identify previously under-leveraged international trade opportunities for exporters through innovative information gathering. Access to these insights, big data analytics and information will help strengthen supports to increase and intensify Ontario’s export capacity through tailored and targeted programs services.
16

Appendix
17
Data Overview
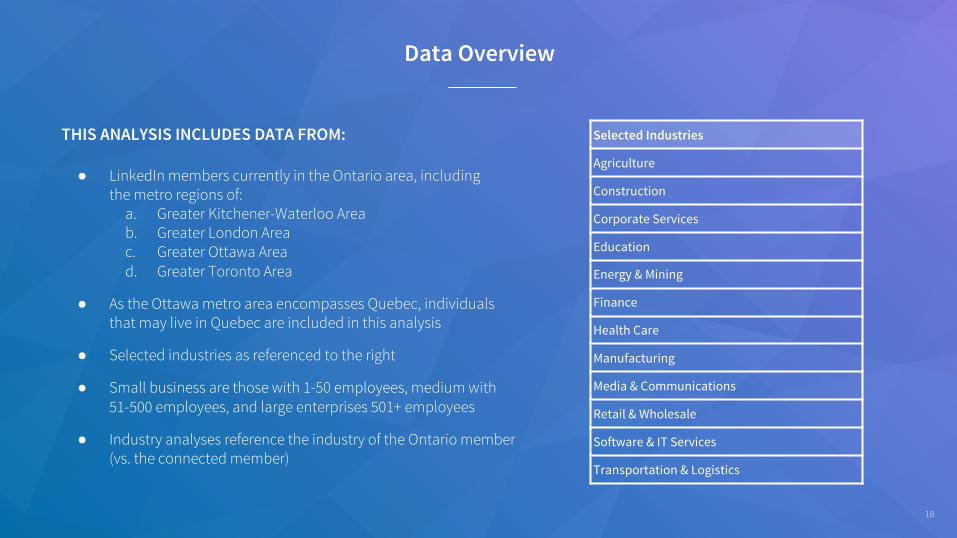
THIS ANALYSIS INCLUDES DATA FROM:
● LinkedIn members currently in the Ontario area, including the metro regions of:
a. Greater Kitchener-Waterloo Areab. Greater London Areac. Greater Ottawa Aread. Greater Toronto Area
● As the Ottawa metro area encompasses Quebec, individuals that may live in Quebec are included in this analysis
● Selected industries as referenced to the right
● Small business are those with 1-50 employees, medium with 51-500 employees, and large enterprises 501+ employees
● Industry analyses reference the industry of the Ontario member (vs. the connected member)
Selected Industries
Agriculture
Construction
Corporate Services
Education
Energy & Mining
Finance
Health Care
Manufacturing
Media & Communications
Retail & Wholesale
Software & IT Services
Transportation & Logistics
18
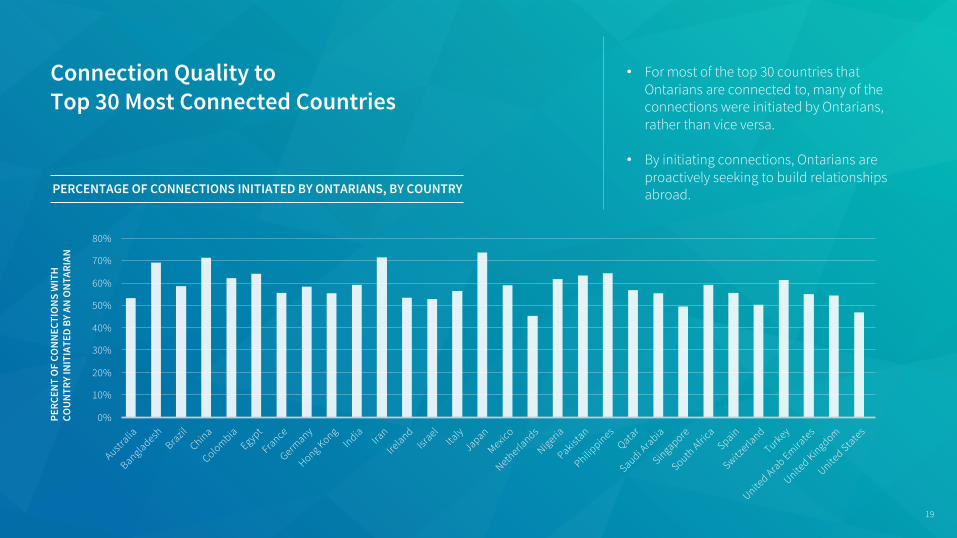
Connection Quality to Top 30 Most Connected Countries
0%
10%
20%
30%
40%
50%
60%
70%
80%
Australia
BangladeshBrazil
China
ColombiaEgypt
France
Germany
Hong KongIndia
Iran
Ireland
IsraelIta
ly
Japan
Mexico
Netherla
nds
Nigeria
Pakistan
Philippines
Qatar
Saudi Arabia
Singapore
South Afri
caSpain
Switzerla
nd
Turkey
United Arab Emira
tes
United Kingdom
United States
PERC
ENT
OF
CONN
ECTI
ONS
WIT
H CO
UNTR
Y IN
ITIA
TED
BY A
N O
NTAR
IAN
• For most of the top 30 countries that Ontarians are connected to, many of the connections were initiated by Ontarians, rather than vice versa.
• By initiating connections, Ontarians are proactively seeking to build relationships abroad.
19
PERCENTAGE OF CONNECTIONS INITIATED BY ONTARIANS, BY COUNTRY