Embed Size (px)
Citation preview
International Journal of Business and Society, Vol. 18 No. 1, 2017, 67-82
LINKAGES AND LEAKAGES OF HIGHER EDUCATION SECTOR IN MALAYSIA
Siew-Hwa Yen
Universiti Sains Malaysia
Wooi-Leng Ong Penang Institute
ABSTRACT
This study examines the direct and indirect linkages and leakages of private and public higher education in Malaysia using input-output analysis. This study found that real estate, printing, wholesale and retail business as well as utilities are the sectors most closely inter-connected with higher education. The results of forward and backward linkages also show weak inter-industry links of the higher education sector with the rest of the economy. The public higher education use a larger amount of imported inputs compared to private higher education implicating a higher leakage from public higher education sector. Higher education in Malaysia can therefore said to take on a social role rather than an economic one. The structural change of education sector indicates an increase in the contribution of primary inputs and a dramatic decline in the consumption of intermediate inputs in education sector over time. Keywords: Input-Output Analysis; Linkages; Leakages; Higher Education.
1. INTRODUCTION In Malaysia, higher education investments (% of GDP) were 5.7% and 2.17% respectively in 2009. The sector grows soon after the nation’s independence in 1957. The education Act of 1961 was largely driven only to achieve greater literacy and bind a multi-cultural society through a common lingua-franca, the Malay language. However in 1996 the Education Act was amended to give sufficient needs to meet the challenges in the 21st century besides making Malaysia a centre of excellence to the world. National aspiration to strengthen the capacity of the human resource is laudable. Nonetheless undertaking a policy evaluation that audits the strength of investment in education will provide an invaluable insight into how much education has done or can potentially do in building capacity and /or to drive economic growth remain necessary. A nation investing in building up its higher education infrastructure will inevitably cause higher education to take on a characteristic typical of any economic sector in that it also buys and sells goods as services and forms backward and forward inter-industry linkages with other sectors of the economy.
Corresponding author: Yen Siew Hwa, School of Distance Education (Economics Section), Universiti Sains
Malaysia, 11800, Minden, Penang, Malaysia. Email Address: [email protected]
68 Linkages and Leakages of Higher Education Sector in Malaysia
Vast studies have been carried to analyse the impact of higher education on the economy using various methods. Using econometrics tools a significant causality from the national higher educational effort to the economic development was uncovered in Sweden, United Kingdom, Japan and France. Such relationship was not appeared in Italy and Australia (Meulemeester and Rochat, 1995). Likewise, these results were coincided with the studies by Petrakis and Stamatakis (2002), where the growth in the OECD economies relied mainly on higher education. Afzal, et al. (2012) also found that higher education had the most significant causal link with economic growth in Pakistan. Based on a Cobb-Douglas production function, the empirical research of Lin (2004) observed that higher education had overall provided a positive and significant effect on the Taiwan’s economic development, with engineering and the natural sciences noted to play majors role in the process. Seigfried, et al. (2007) discovered that the studies of economic impact of colleges and universities could be further enhanced if the local spillover benefits from human capital produced by the higher education were to be examined. The input-output analysis proposed by Wassily Leontief (Leontief, 1936) has been widely applied in higher education sector of many developed economies. For example, Universities UK carried out a series of study on economic impact of universities based on the multipliers effects in United Kingdom since 1997 and these reports were generally recognised and higher education’s contribution to national and regional economic development had attracted the attention of policy-makers (Kelly et al., 2009). Australian Council for Private Education and Training (2009) used this approach to study the economic impact of international students in Australia. Western New York Consortium of Higher Education (2008) and Northern Ireland Assembly’s Committee for Employment and Learning (2010) employed similar approach in examining the regional impact of higher education in Western New York and Northern Ireland, respectively with the latter focused on the multiplier effects. Garrido-Yserte & Gallo-Rivera (2010) analysed the demand-side or backward linkage of University of Alcala (Madrid, Spain). The empirical evidence showed positive economic impact of the university on the income, the product and employment particularly in the surrounding area. Other sectors of economy were also of the interest in the frontier of input-output analysis carried out by previous studies. These include construction sector (Pietroforte, 1995; Bon and Yashiro, 1996; Lean, 2001; Pietroforte and Gregori, 2003; and Ilhan, et al., 2011), industrial sector (Jutta, 2002; Karagiannis and Tzouvelekas, 2010; Saari, 2007) and ICT sector (Xing, et al., 2011; and Ibrahim, 2013). While Larson and Shaw (2001) examined the forward and backward linkages of small and medium enterprises and the agriculture sector, Khayum (1995) analysed the impact of service sector growth on intersectoral linkages in the US economy since the 1940s. Bekhet (2011) employed the Leontief inverse model in generating multipliers of the output, income and employment for an inter-sectoral study to investigate the effectiveness of development policies in the Malaysian economy. So far, no specific study has been conducted using input-output model to examine multiplier effects of higher education sector on the economy of Malaysia. The higher education institutions (HEIs) demand inputs with the objective of generating output in the form of improving the educational

Siew-Hwa Yen and Wooi-Leng Ong 69
and research levels. HEIs demand goods and services (public or private), although most of them from local providers and some may be imported; hires employees which generate an increase in income; also generate additional activities such as conferences and congress which in turn demand hotels, restaurants and so on. Hence, understanding of all these activities could generate a very important impulse for the regional and especially for the local economy. This paper attempted to review how investment monies have gone into education in Malaysia alongside to other sectors. We then examine the link between higher education sector of Malaysia with other sectors in the economy using the input-output approach. We analyze the backward linkages between other industries and higher education sector in Malaysia, both public and private. These are industries that are dependent on the performance of higher education in Malaysia, because they sell to higher education. We examine forward linkages between other industries and higher education sector in Malaysia. These are industries whose performances are important to higher education because higher education sells to them. We also discuss leakage in higher education sector as some inputs could be imported which impact will be leaked to industries abroad. This paper is organised as follows. Section 2 describes data and methodology. Linkages and leakages as well as structural change of higher education sector are discussed in Section 3. Conclusions are presented in Section 4.
2. DATA AND MODEL DEVELOPMENT 2.1. Data The input-output tables 2000 published by the Department Statistics of Malaysia was used to examine the linkages and leakages of higher education in the economy. Despite having over 120 production sectors of the economy in input-output tables 2005, these tables merged both private and public educations into a single sector. Unlike input-output 2000, 94 production sectors of the economy were reported and it contains the details on public and private institutions. These tables are, however, yet to segregate further into schools and tertiary education. To observe the impact of higher education on the economic growth, some modifications were made on the input-output tables 2000 of private and public educations. They were scaled using the expenditure details of a public higher institution (University A) to reflect the production structure of private and public higher educations. Note that expenditure details of private higher institutions were highly confidential and they were hardly accessible for the purpose of this study. The spending pattern of the higher education institutions was, therefore, assumed to be the representative contributions to the economy. It was noted that the number of sectors provided in the expenditure sheet of the university are not coincided with the production structure in the input-output tables 2000. Given that only 16 main activities were found in the university’s expenditure sheet, they were correspondingly designated across 94 production sectors of the economy and the input coefficients of each corresponding sector in the private and public educations were summed accordingly in the input-output tables 2000. The two column vectors of private
70 Linkages and Leakages of Higher Education Sector in Malaysia
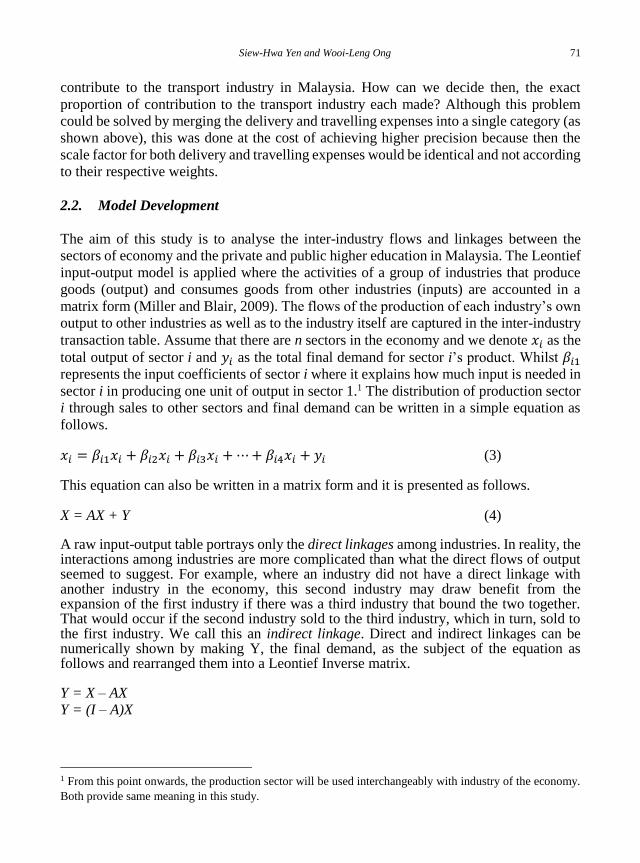
and public educations of the input-output tables 2000 were attuned into private and public higher education using the following calculations. The input coefficients (𝑥𝑖) for each activity i of the University A were calculated using the following formula where 𝑋𝑖 represents the university’s expenditure on activity i.
𝑥𝑖 = 𝑋𝑖
∑ 𝑋𝑖16𝑖=1
(1)
The scaling factor for each activity (𝛼𝑖) was obtained by dividing the university’s input
coefficient (𝑥𝑖𝑗) with the total input coefficient (𝑎𝑖) of each corresponding sector in the
private education.
𝛼𝑖 = 𝑥𝑖
𝑎𝑖 (2)
Hence, the scaled input coefficient of activity i for private higher education (𝛽𝑖) is simply
the product of each input coefficient (𝑎𝑖) and scaled factor (𝛼𝑖). Repeat the same
procedures to obtain the input coefficients of public higher education(𝛽𝑖). An example of
the scaling calculation is provided in Table 1.
Table 1: Scaling of input coefficients of private higher institutions
Sector
listed in
the I/O
2000
tables
Input
coefficient
of Private
education
Total
coefficient
(𝑎𝑖)
Sector
listed in
University
A’s
spending
sheet
University
A’s
spending
amount
(𝑋𝑖)
University
A’s input
coefficient
(𝑥𝑖)
Scale
factor
(𝛼𝑖)
Scale input
coefficient
(𝛽𝑖)
Hotel and
Restaurants
(a)
0.0118777 Travelling
expenses
and delivery
0.009796812
Transport
(b)
0.0104356 17,198,062 0.01840417 0.82480715 0.008607357
(a) + (b) 0.0223133 Total spending
934,465,523
In the example given above, the scaled input coefficients of the two items were found to
be more than those of the actual Input-output 2000 tables by a factor of approximately
0.82. We assumed that private higher education spends less in those items as compared
to private education as a whole. The same process was applied on public higher education
and the two columns were then substituted into the original input-output table for further
adjustments. The substitution occurred separately for both because our aim was to trace
the relationships between private higher education and the other industries (inclusive of
public education in this case) and vice versa.
There was an issue in accurately collapsing the 94 industries listed in the Input-output
table 2000 into the 16 categories (fewer) according to University A’s spending data. For
example, University A’s spending on delivery and travelling individually would
Siew-Hwa Yen and Wooi-Leng Ong 71
contribute to the transport industry in Malaysia. How can we decide then, the exact
proportion of contribution to the transport industry each made? Although this problem
could be solved by merging the delivery and travelling expenses into a single category (as
shown above), this was done at the cost of achieving higher precision because then the
scale factor for both delivery and travelling expenses would be identical and not according
to their respective weights.
2.2. Model Development
The aim of this study is to analyse the inter-industry flows and linkages between the
sectors of economy and the private and public higher education in Malaysia. The Leontief
input-output model is applied where the activities of a group of industries that produce
goods (output) and consumes goods from other industries (inputs) are accounted in a
matrix form (Miller and Blair, 2009). The flows of the production of each industry’s own
output to other industries as well as to the industry itself are captured in the inter-industry
transaction table. Assume that there are n sectors in the economy and we denote 𝑥𝑖 as the
total output of sector i and 𝑦𝑖 as the total final demand for sector i’s product. Whilst 𝛽𝑖1
represents the input coefficients of sector i where it explains how much input is needed in
sector i in producing one unit of output in sector 1.1 The distribution of production sector
i through sales to other sectors and final demand can be written in a simple equation as
follows.
𝑥𝑖 = 𝛽𝑖1𝑥𝑖 + 𝛽𝑖2𝑥𝑖 + 𝛽𝑖3𝑥𝑖 + ⋯ + 𝛽𝑖4𝑥𝑖 + 𝑦𝑖 (3)
This equation can also be written in a matrix form and it is presented as follows.
X = AX + Y (4)
A raw input-output table portrays only the direct linkages among industries. In reality, the interactions among industries are more complicated than what the direct flows of output seemed to suggest. For example, where an industry did not have a direct linkage with another industry in the economy, this second industry may draw benefit from the expansion of the first industry if there was a third industry that bound the two together. That would occur if the second industry sold to the third industry, which in turn, sold to the first industry. We call this an indirect linkage. Direct and indirect linkages can be numerically shown by making Y, the final demand, as the subject of the equation as follows and rearranged them into a Leontief Inverse matrix.
Y = X – AX
Y = (I – A)X
1 From this point onwards, the production sector will be used interchangeably with industry of the economy.
Both provide same meaning in this study.
72 Linkages and Leakages of Higher Education Sector in Malaysia
X = (I – A)-1Y (5)
X = (I + A + A2 + A3 + A4 …… + A∞)Y (6)
X = (I)Y + (A + A2 + A3 + A4 …… + A∞)Y (7)
A is the square matrix of the inter-industry flow expressed in terms of coefficient per dollar of output; X is the gross output by industries; Y is the final demand; and I is an identity matrix. I is associated with the initial output effect on the economy because it reflects the initial Ringgit’s worth of an industry’s output needed to satisfy the final demand as shown in Equation (4). To scrutinize the linkages and leakages of the private and public higher education to the Malaysian economy, three multiplier analyses were employed in this study i.e. the simple output multiplier, the total output multiplier and the import multiplier. Direct linkages (or what we interpret directly from the values of input coefficients, A) show only the first round of spending. Indirect linkages or the subsequent rounds of spending are taken into account by the expanded mathematical expression, (A2 + A3 + A4 …… + A∞), in Equation (6). If we total up all the entries of any column, it is known as the simple output multiplier. Formally, it was the ratio of direct and indirect effects to the initial output effect alone, obtained from a model in which households are exogenous. That figure stated the total value of production of all industries that was necessary to produce a Ringgit’s worth of final demand for that industry’s output. The input-output structure allows us to obtain an overall picture of the inter-industry relationships between private and public higher education. When one sector increases its production, demand for inputs will also increase. This demand relationship creates the backward linkage. An increase in production also create additional product to be used as inputs in production for other sectors. This supply relationship is called the forward linkage. If one sector has high backward linkage, an expansion of its production will benefit the economy by creating more productive activities compared to another sector with lower backward linkage. Similarly, if a sector has high forward linkage, an expansion in its production is more essential to the economy in terms of productive activities that it would support compared to another sector with lower forward linkage. Imported products may also be used in the production process. When production increases, it will generate additional demand for imported input. This type of imports creates a leakage in the economy (Guo and Planting, 2000). 2.3. Multiplier Analysis This study focuses on output and import multipliers where the output multiplier consists of simple output multiplier and total output multiplier. Generally, these output multipliers for a sector j is defined as the total value of production in all sectors of the economy that is necessary to satisfy a dollar’s worth of final demand for sector j’s output. 2.3.1. The simple output multiplier The simple output multiplier refers to the value of total production that is obtained from a model with households exogenous. This is also known as open model where it captures the direct and indirect effects of the model. The initial dollar’s worth of sector j output needed to satisfy the additional final demand is the initial output effect on the economy.
Siew-Hwa Yen and Wooi-Leng Ong 73
Formally, the output multiplier is the ratio of the direct and indirect effect to the initial effect (Miller and Blair, 2009). If we represented the elements of (I – A)-1 as 𝛽𝑖𝑗, where i and j refer to the row and column of an element α in a matrix respectively, then the simple output multiplier of a selected industry j, m(O)j, can be calculated from the formula:
m(O)j = ∑ 𝛽𝑖𝑗𝑛𝑖=1 (8)
2.3.2. The total output multiplier The existence of an exogenous industry and the kinds of transactions that constituted to the activity of this industry were consumption purchases by households, sales to government, gross private domestic investment and net export. The exclusion of households from the productive industries may be considered as a strain on economic theory because an increase in labour inputs due to increased output would lead to an increase in the amounts spent by households as a group of consumers. This leads to an increase of demand on industrial output and the cyclical pattern continues. To reflect the fact that additional outputs were necessary to satisfy the anticipated increase in consumer spending, the household industry can be moved from the final-demand column to the interrelated production table, thus making it one of the endogenous industry. This is generally known as closing the model with respect to households (or closed model). This would require a row and a column for the new household industry – the former showing the how labour services is used as an input by the other industries and the latter showing the consumption pattern of private consumers. The element in the (n+1) row and the (n+1) column would represent the household purchases of labour services. In a model with household endogenous, we would expect value of each element is higher because the added impact of more household consumption due to increased income was explicitly taken into consideration in the model. To calculate the total output multiplier, we would not include the last element, the household industry, in the summation because we were only interested in the total output effect. The general formula for the total output multiplier, for industry j, is given by:
Ōj = ∑ �̅�𝑖𝑗𝑛𝑖=1 (9)
2.3.3. The import multiplier Imports had already been winnowed out from the intermediate input coefficients as a separate component of primary inputs. For instance, the 0.3 worth of output purchased by industry 2 from industry 1 did not include inputs purchased from foreign countries. No country was absolutely self-sufficient because industries in a country usually did rely on foreign import that fed into domestic production. To what extent was the dependency? The proportion of intermediate inputs that were employed for local production where the transaction had been leaked to foreign countries can be analysed using the import multiplier. Import multiplier was then calculated by subtracting domestic output multiplier from total simple output multiplier. This total multiplying effect included information on imports

74 Linkages and Leakages of Higher Education Sector in Malaysia
purchased from each sector. The amount of import purchased from each industry was available in the input-output tables 2000 and it can be gleaned directly. Adding this to the inputs purchased from domestic industries, we would then arrive at the total input requirement needed for production.
3. RESULTS AND ANALYSIS 3.1. Macro-view of Higher Education Sector The following analysis provides a macro-view on private and public higher education by inspecting its backward and forward linkages and compares its values with non-education sectors in the economy. If the government has a fixed amount of money to spend, comparison of output multipliers across different industries would show where this spending would produce the greatest level of output. An industry with a large output multiplier would therefore indicate that it has strong backward linkages compared to industries with smaller multiplier values because it purchases substantially more from the other industries. When an industry that has a high output multiplier decides to scale down its level of production, its interconnected chain of suppliers would surely be affected. For this supremacy the industry wields in the market, it is also known as a power industry. A typical column of an input-output table depicts backward linkages where the purchases made by an industry from the others, while a typical row of an input-output table shows forward linkages where the sales made by an industry to the others. A high row total indicates that an industry has strong forward linkages to the other industries; it sells substantially to satisfy the demand of its products or services. This is not necessarily a negative attribute (its performance may be bolstered during a boom, say) but it does mean that the industry is more susceptible to fluctuations in the economy – whilst a power industry seems to be sitting as a determinant of fluctuation. Due to that, an industry with strong forward linkages is termed as a sensitive industry. All industries were classified based on the values of their forward and backward linkages into four quadrants2 and the cut-off points of each quadrant was determined by the median values of row total and column total of all industry3. Arbitrary lines of median values were drawn on private and public higher education and they are illustrated by a star indicated in Figure 1 and Figure 2. Figure 1 shows that private higher institutions with output multiplier and row total of 1.8010 and 1.0366 respectively were both lower than the median values of 2.6176 and 1.5758 calculated from all the industries. This suggests that private higher institutions have relatively low forward and backward linkages; backward linkages were in fact, too distant from the median line compared to forward linkages. This result is very similar to that of public higher institutions whereby the output multiplier and row total were 1.8030 and 1.0199 and the median values were 2.6176 and 1.2401, accordingly (Figure 2). By this
2 List of industries of backward and forward linkages for private and public higher education models are
available upon request. 3 Values of forward and backward linkages of private and public higher education are available upon request.

Siew-Hwa Yen and Wooi-Leng Ong 75
Figure 1: Forward and backward linkages of private higher education
Figure 2: Forward and backward linkages of public higher education
Rubber planting
Livestock breeding
etc.
Crude petrol,
natural gas & coal
Meat & meat
productionManufacture oils
and fats
Manufacture
industries chemic.
Electricity & gas
Wholes.&retail
trade
Hotels &
restaurants
Business services
1.0000
1.5000
2.0000
2.5000
3.0000
3.5000
4.0000
4.5000
1.0000 3.0000 5.0000 7.0000 9.0000 11.0000 13.0000
Back
ward
Lin
kag
es
Forward Linkages1.5
2.62
Rubber planting
Livestock breeding
etc.
Crude petrol,
natural gas & coal
Meat & meat
productionManufacture of
Oils and Fats
Manufacture
industries chemic.
Petrol & coal
industries
Electricity & gas
Wholes.&retail
trade
Business services
1.0000
1.5000
2.0000
2.5000
3.0000
3.5000
4.0000
4.5000
1.0000 2.0000 3.0000 4.0000 5.0000 6.0000 7.0000
Back
ward
Lin
kag
e
Forward Linkage1.24
2.62
76 Linkages and Leakages of Higher Education Sector in Malaysia
analysis, private and public higher institutions appear to be fairly powerful, but not sensitive, implying that if the value of output is the sole consideration of the Malaysian Government, the two industries studied would not be a preferred choice for investment. In addition, it is also believed that higher institutions are valuable and less vulnerable industry in the economy because they are characteristically stable and less prone to economic fluctuation than other industries, as depicted in the result. These backward and forward linkages are dominated by manufacturing industries, with a few exceptions of transcendental service industries such as Radio and TV broadcasting, Recycling, Electricity and Gas and Hotels & Restaurants. This may be due to the fact that manufacturing industries have proportionally higher intermediate output transaction than that of primary inputs. The same goes for those service industries. Both industries studied in this paper defy this trend because they invest heavily on human resources and not on tangible goods and services. Therefore, their linkages with other industries appear to be weaker. Based on this study, the ratios of intermediate output transaction and primary input are 0.31 to 0.69 and 0.35 to 0.65 for higher private education and higher public education, respectively. Given that the output multipliers of the both industries are low relative to others this should not lead us into dismissing them as not being important to the economy. The sizes of output multiplier may not indicate the actual contribution made by these industries to national growth because by examining only their coefficients (i.e. per unit output) we have not taken into account the industries’ level of output.
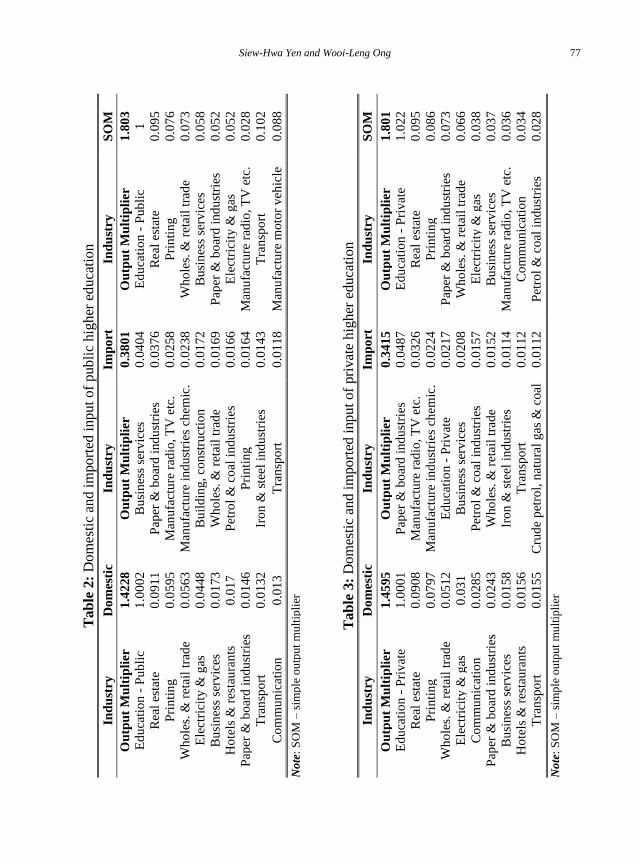
3.2. Linkages and Leakages of Higher Education Sector 3.2.1. The simple output multiplier The simple output multiplier (SOM) measures the additional direct and indirect output required from respective industries in order to satisfy a unit of final demand. The multipliers can be analysed from how much the input were consumed locally and abroad. The decompositions of the simple output multiplier into its domestic and imported components for selected industries on the basis of their strong backward linkages with public and private higher education are shown on Tables 2 and 3 for public and private higher education, respectively. The breakdown between the domestic and imported components of the multipliers results from the input sourcing by industries in Malaysia from either domestic or imported locations. The choice between the two is not necessary due to preference but oftentimes; imported inputs give an indicator of “missing industries”, in other words, input components that can be obtained from local sources. The numbers shown here, however, will indicate how much of the multiplier will benefit local industries in terms of business sales and how much might instead impact on industries abroad. Table 2 and Table 3 show the top ten output-generating industries from initial RM 1 investment made in the respective industries for public higher education and private higher education, respectively. The total simple output multipliers of private and public higher education made up about 1.8010 and 1.8030 of additional output generated that
Siew-Hwa Yen and Wooi-Leng Ong 77
T
ab
le 2
: D
om
esti
c an
d i
mport
ed i
nput
of
publi
c hig
her
educa
tion
SO
M
1.8
03
1
0.0
95
0.0
76
0.0
73
0.0
58
0.0
52
0.0
52
0.0
28
0.1
02
0.0
88
No
te:
SO
M –
sim
ple
ou
tput
mu
ltip
lier
Ta
ble
3:
Do
mes
tic
and i
mport
ed i
nput
of
pri
vat
e hig
her
educa
tion
SO
M
1.8
01
1.0
22
0.0
95
0.0
86
0.0
73
0.0
66
0.0
38
0.0
37
0.0
36
0.0
34
0.0
28
No
te:
SO
M –
sim
ple
ou
tput
mu
ltip
lier
Ind
ust
ry
Ou
tpu
t M
ult
ipli
er
Ed
uca
tio
n -
Pu
bli
c R
eal
esta
te
Pri
nti
ng
Wh
ole
s. &
ret
ail
trad
e B
usi
nes
s se
rvic
es
Pap
er &
bo
ard
ind
ust
ries
E
lect
rici
ty &
gas
Man
ufa
ctu
re r
adio
, T
V e
tc.
Tra
nsp
ort
Man
ufa
ctu
re m
oto
r v
ehic
le
Ind
ust
ry
Ou
tpu
t M
ult
ipli
er
Ed
uca
tio
n -
Pri
vat
e R
eal
esta
te
Pri
nti
ng
P
aper
& b
oar
d i
nd
ust
ries
Wh
ole
s. &
ret
ail
trad
e
Ele
ctri
city
& g
as
Bu
sin
ess
serv
ices
Man
ufa
ctu
re r
adio
, T
V e
tc.
Co
mm
un
icat
ion
Pet
rol
& c
oal
in
du
stri
es
Imp
ort
0.3
801
0.0
404
0.0
376
0.0
258
0.0
238
0.0
172
0.0
169
0.0
166
0.0
164
0.0
143
0.0
118
Imp
ort
0.3
415
0.0
487
0.0
326
0.0
224
0.0
217
0.0
208
0.0
157
0.0
152
0.0
114
0.0
112
0.0
112
Ind
ust
ry
Ou
tpu
t M
ult
ipli
er
Bu
sin
ess
serv
ices
P
aper
& b
oar
d i
nd
ust
ries
Man
ufa
ctu
re r
adio
, T
V e
tc.
Man
ufa
ctu
re i
nd
ust
ries
ch
emic
. B
uil
din
g,
con
stru
ctio
n
Wh
ole
s. &
ret
ail
trad
e P
etro
l &
co
al i
ndu
stri
es
Pri
nti
ng
Iro
n &
ste
el i
nd
ust
ries
Tra
nsp
ort
Ind
ust
ry
Ou
tpu
t M
ult
ipli
er
Pap
er &
bo
ard
ind
ust
ries
M
anu
fact
ure
rad
io, T
V e
tc.
Man
ufa
ctu
re i
nd
ust
ries
ch
emic
. E
du
cati
on
- P
riv
ate
Bu
sin
ess
serv
ices
Pet
rol
& c
oal
in
du
stri
es
Wh
ole
s. &
ret
ail
trad
e
Iro
n &
ste
el i
nd
ust
ries
T
ran
spo
rt
Cru
de
pet
rol,
nat
ura
l g
as &
coal
Do
mes
tic
1.4
228
1.0
002
0.0
911
0.0
595
0.0
563
0.0
448
0.0
173
0.0
17
0.0
146
0.0
132
0.0
13
Do
mes
tic
1.4
595
1.0
001
0.0
908
0.0
797
0.0
512
0.0
31
0.0
285
0.0
243
0.0
158
0.0
156
0.0
155
Ind
ust
ry
Ou
tpu
t M
ult
ipli
er
Ed
uca
tio
n -
Pu
bli
c R
eal
esta
te
Pri
nti
ng
Wh
ole
s. &
ret
ail
trad
e E
lect
rici
ty &
gas
Bu
sin
ess
serv
ices
H
ote
ls &
res
tau
ran
ts
Pap
er &
bo
ard
ind
ust
ries
Tra
nsp
ort
Co
mm
un
icat
ion
Ind
ust
ry
Ou
tpu
t M
ult
ipli
er
Ed
uca
tio
n -
Pri
vat
e R
eal
esta
te
Pri
nti
ng
W
ho
les.
& r
etai
l tr
ade
Ele
ctri
city
& g
as
Co
mm
un
icat
ion
P
aper
& b
oar
d i
nd
ust
ries
Bu
sin
ess
serv
ices
H
ote
ls &
res
tau
ran
ts
Tra
nsp
ort
78 Linkages and Leakages of Higher Education Sector in Malaysia
resulted from one Ringgit’s worth of final demand made by public and private higher education, respectively. The small differences of the total simple output multipliers between public and private higher education would not imply much. While domestic output multipliers show larger impact in private higher education (1.4595) compared to public higher education (1.4228), public higher education (0.3801) recorded to have higher import multiplier than that of private higher education. The education industry forks out supply of 1.0218 and 1.0002 (that is, above the amount of 1) for private and public higher institutions but less than 0.1 for the rest. The fact was that the 1.0000 of both 1.0218 and 1.0002 were allocated to satisfy the new unit of final demand created whilst only the remaining of 0.0218 and 0.0002 accounted for inter- and intra-industry use. Therefore, it seemed to suggest that inter- and intra-industry transactions for private as well as public higher institutions were in reality, only miniscule.
3.2.2. The total output multiplier
The total output multipliers differ from simple output multiplier as this input-output table
of inter-industry linkages includes the household sector as one of the industries. The
household row (with coefficients jn ,1 ) shows sales (employment salaries) to each of the
other industry sectors and the household column (with coefficients 1, ni ) shows
household consumption from each of the other industries.
Table 4: Simple and total output multipliers for public and private higher education
Higher Education
Simple Output Multiplier Total Output Multiplier
Private Higher
Education
Public Higher
Education
Private Higher
Education
Public Higher
Education
Private Higher
Education
1.8010 - 4.5871 -
Public Higher
Education
- 1.8030 - 4.5851
The total multipliers for both public and private higher education are shown in Table 4. Notice that total multipliers 4.5871 for private and 4.5851 for public higher education are substantially much larger than simple multipliers because on top of the direct and indirect impacts resulting from the initial one Ringgit’s worth of investments into either public or private higher education, the induced impacts are also measured by the total multipliers. Induced impacts are the result of increased household consumption across the industry from additional incomes and employment. 3.2.3. The import multiplier Analysis of output multiplier alone does not take into account the use of inputs imported from countries abroad to meet production requirements needed to satisfy a given unit of final demand. Some of the impacts discussed therefore may not be occur within the boundaries of Malaysia. In this study, the domestic output multiplier is found to be 1.4595

Siew-Hwa Yen and Wooi-Leng Ong 79
(Figure 3). This means that for a unit of final demand made upon private higher institutions, out of the 1.8010 value of output produced, only 1.4595 would be localised within the Malaysian economy. The import multiplier amounted to 0.3415. In the public higher institution higher rate of leakage was detected. Out of 1.8030 value of output produced by public higher institutions, only 1.4228 would be retained in the local economy. 0.3801 would flow out of the Malaysian economy.
Figure 3: Input composition of public and private higher education
3.3. Structural Change of Education Sector In Malaysia, a version of input-output table typically takes years to be compiled and published. Figure 4 illustrates key inputs of the education industry over the past two and a half decades where Primary input refers mainly to emolument and is an indication of industry’s purchase of labour; imported commodities shows amount of supply purchased by an industry from industries abroad; total intermediate input illustrates the inter-industry commodity transactions that happen within the frontiers of a local economy.
Figure 4: Input elements of education industry from 1987 to 2005
Apart from the year 1987, import remained fairly constant, hovering at an average of 0.06. New legalisations allowing private higher education during the mid-nineties and the
1.42283
1.45952
0.38013
0.34152
0.00000 0.50000 1.00000 1.50000 2.00000
Public higher education
Private higher education
Domestic Import
0.1065 0.1407 0.13640.28690.0186
0.0473 0.0766
0.0662
0.8749 0.812 0.7870.6469
0.0
0.2
0.4
0.6
0.8
1.0
1987 1991 2000 2005
Pro
po
rtio
n
Year
Total Intermediate Input Imported Commodities Primary Input

80 Linkages and Leakages of Higher Education Sector in Malaysia
subsequent flourishing of private institutions may have been the factor behind such an increase. But relative to the other two, appears to be only miniscule in scale. That may just prove Malaysia’s self-sufficiency in this industry. The total intermediate output and primary input seem to be drifting in reverse. This shows that, within the local economy, the purchase of commodities has increased proportionally more than that of labour. This is evident when imported commodities are counted on top of the purchase of local commodities. The purchase of commodities and labours has, from a ratio of 0.1065 to 0.8749, gradually narrowed to 0.2869 to 0.6469, respectively.
4. CONCLUSION
This study examines the linkages between higher education sector and the rest of the economy in Malaysia. The inter-industry linkages are observed using input-output approach and they are studied in three aspects. First, we look at the backward and forward linkages of private and public higher education in the economy. Second, we apply multiplier analysis to understand the effects of both private and public higher education on the economy. Third, we investigate the imported elements in the production structure of higher education through import multipliers. The backward linkages and forward linkages of both private and public higher education signify fairly powerful, but not sensitive industries. This suggests that higher education sector are important to other industries, but they are not affected by the momentum of the economy. This may also imply that higher education in Malaysia takes on a social role rather than an economic one. Real estate, on the other note, remains as the major backward link input component which means that Malaysia’s property sector has an additional role to play in facilitating the construction of higher education premises. This will involve also town planning layouts and communications infrastructure so that the synergy between higher education and industry, student housing and transport, supporting services can also be integrated into a unified urban whole. The multiplier analysis reveals that both total and simple output multipliers show larger impact in private higher education compared to that of public higher education. The total output multipliers for public and private higher education are almost identical where the induced impacts on the economy that occurs on top of the direct and indirect impacts are substantially larger and therefore output is higher in public higher education. Real estate, printing, utilities and wholesale and retail business are the sectors most closely inter-connected with higher education sector. Public higher education recorded to have higher import multiplier than that of private higher education. This means that public higher education uses more imported inputs such as foreign machineries and human capital to produce local graduates. Additional contribution of this paper is to observe the structural change of education sector over time. While the contribution of primary inputs has been increasing from 1987 to 2005, there is a dramatic decline in the consumption of intermediate inputs in education
Siew-Hwa Yen and Wooi-Leng Ong 81
sector. This implies that the price of labour, as an input for education sector is increasing more rapidly than its price of commodities. This is coincided with the fact that education sector is a knowledge generation and transmission platform with the aim of producing an innovative and creative society where this is regarded as a professional price that is paid to the labour in education sector. This study has several limitations. First, the input-output tables applied were not the latest input-output tables published by the Department of statistics in Malaysia due to the reason of the disaggregation of education sector into private and public education. Second, the input-output data does not distinguish between higher education and schools. The analysis will be more accurate if the data is more refined. Third, the static nature of the input-output framework as well as the fixed coefficient and constant returns to scale production function that is not amenable to dynamics and technological changes would be the drawback of this study.
ACKNOWLEDGEMENT
The authors are deeply grateful for the invaluable guidance, comments and suggestions from Dr. Chan Huan Chiang who was a Senior Research Fellow at the Socio-Economic and Environmental Research Institute (SERI), Penang. Ong Wooi Leng were affiliated to SERI. We would like to acknowledge the Malaysian National Higher Education Research Institution (NAHERI) for the financial support. We thank Prof. Fauziah Md. Taib, the former director of NAHERI and also the leader of the project “Higher Education as a Catalyst to Economic Growth” and other co-researchers of the project Dr. Lim Hock Eam, Prof. Osman Mohamad, Prof. Rosni Bakar and Dr Eliza Nor for their contributions.
REFERENCES Afzal, M., Rehman, H. U., Farooq, M. S., & Sarwar, K. (2011). Education and economic
growth in Pakistan: A cointegration and caulity analysis. International Journal of Educational Research, 50(5-6), 321-335.
Australian Council for Private Education and Training. (2009). The Australian Education Sector and The Economics Contribution of International Students. Australia: Access Economics Pty Limited.
Bekhet, H. A. (2011). Output, Income and Employment Multipliers in Malaysian Economy: Input-Output Approach. International Business Research, 4(1), 208-223.
Bon. R., & Yashiro, T. (1996). Comparative stability analysis of demand-side and supply-side input-output models: the case of Japan, 1960-90. Applied Economics Letters, 3(5), 349-354.
Garrido-Yserte, R., & Gallo-Rivera, M. T. (2010). The impact of the university upon local economy: three methods to estimate demand-side effects. The Annals of Regional Science, 44(39), 39-67.
Guo, J., & Planting, M. A. (2000). Using input-output analysis to measure U.S. economic structural change over a 24 year period. Bureau of Economic Analysis Working Paper No. 2000-01.

82 Linkages and Leakages of Higher Education Sector in Malaysia
Ibrahim, K. R. (2013). The globalisation and stagnation of the ICT sectors in the European countries: An input-output analysis. Telecommunications Policy, 37(4-5), 387–399.
Ilhan, B., & Hakan Y., (2011). A comparative input-output analysis of the construction sector in Turkey and EU countries. Engineering, Construction and Architectural Management, 18(3), 248-265.
Jutta G. (2002). FDI as a multiplier of modern technology in Hungarian industry. Intereconomics, 37(5), 263-269.
Karagiannis G., & Tzouvelekas V. (2010). Sectoral linkages and industrial efficiency: a dilemma or requisition in identifying developement priorities? The Annals of Regional Science, 45(1), 207-233.
Kelly, U., McLellan, D., & McNicoll, L. (2009). The impact of universities on the UK economy: fourth report. London: Universities UK.
Khayum M. F. (1995). The impact of service sector growth on intersectoral linkage. The Service Industries Journal, 15(1), 35-49.
Larson, D., & Shaw W. (2001). Issues of microenterprise and agricultural growth: Do opportunities exist through forward and backward linkages? Journal of Developmental Entrepreneurship, 6(3), 203-220.
Lean, S. C. (2001). Empirical tests to discern linkages between construction and other economic sectors in Singapore. Construction Management and Economics, 19(4), 355-363.
Leontief, W. (1936). Quantitative input-output relations in the economic system of the United States. The Review of Economics and Statistics, 18(3), 105-125.
Lin, T. C. (2004). The role of higher education in economic devellopment: An empirical study of Taiwan case. Journal of Asian Economics, 15(2), 355-371.
Meulemeester, J. D., & Rochat, D. (1995). A causality analysis of the link between higher education and economic development. Economics of Educational Review, 14(4), 351-361.
Miller, R. E., & Blair, P. D. (2009). Input-output analysis: Foundations and extensions (2nd edition). Cambridge: Cambridge University Press.
Northern Ireland Assembly’s Committee for Employment and Learning. (2010). Impact of Higher Education in Northern Ireland. Belfast: Queen’s University.
Petrakis, P. E., & Stamatakis, D. (2002). Growth and educational levels: A comparative analysis. Economics of Education Reveiw, 21, 513-521.
Pietroforte, R. (1995). An input-output analysis of the Italian construction sector, 1959-1958. Construction Management and Economics, 13, 253-262.
Pietroforte, R., & Gregori, T. (2003). An input-output analysis of the construction sector in highly developed economies. Construction Management and Economics, 21(3), 319-327.
Saari M. Y. (2007). The Economic Impact of China's Industrialisation on ASEAN: an Inter-Regional Approach. Malaysian Journal of Economic Studies , 44(2), 51-65.
Siegfried, J. J., Sanderson, A. R., & McHenry, P. (2007). The Economic Impact of Colleges and Universities. Economics of Education Review, 26(5), 546–558.
Western New York Consortium of Higher Education, (2008). The Impact of Higher Education in Western New York. New York: Buffalo Regional Institute.
Xing, W., Ye, X., & Kui, L. (2011). Measuring the convergence of China’s ICT industry: An input-output analysis. Telecommunications Policy, 35(4), 301-313.


![Applied Thermal Engineering...friction losses. They also investigated the internal leakages inside the vane expander [22], which showed that leakages mainly occurred at the blade tips](https://img.pdfslide.us/doc/110x75/61497ce3080bfa626014a48b/applied-thermal-engineering-friction-losses-they-also-investigated-the-internal.jpg)