Embed Size (px)
Citation preview
6S T U D Y O B J E C T I V E S
1. To learn about analytical techniques for locating the relativepositions of genes on chromosomes in diploid eukaryoticorganisms 110
2. To learn about analytical techniques for locating the relativepositions of genes on chromosomes in ascomycete fungi 122
3. To learn about analytical techniques for locating the relativepositions of genes on human chromosomes 132
S T U D Y O U T L I N E
Diploid Mapping 110Two-Point Cross 110Three-Point Cross 114Cytological Demonstration of Crossing Over 120
Haploid Mapping (Tetrad Analysis) 122Phenotypes of Fungi 124Unordered Spores (Yeast) 124Ordered Spores (Neurospora) 125
Somatic (Mitotic) Crossing Over 132Human Chromosomal Maps 132
X Linkage 132Autosomal Linkage 134
Summary 140Solved Problems 140Exercises and Problems 142Critical Thinking Questions 147Box 6.1 The Nobel Prize 112Box 6.2 The First Chromosomal Map 121Box 6.3 Lod Scores 135
109
Scanning electron micrograph (false color) of a fruit
fly, Drosophila melanogaster.
(© Dr. Jeremy Burgess/SPL/Photo Researchers.)
LINKAGE ANDMAPPING IN
EUKARYOTES
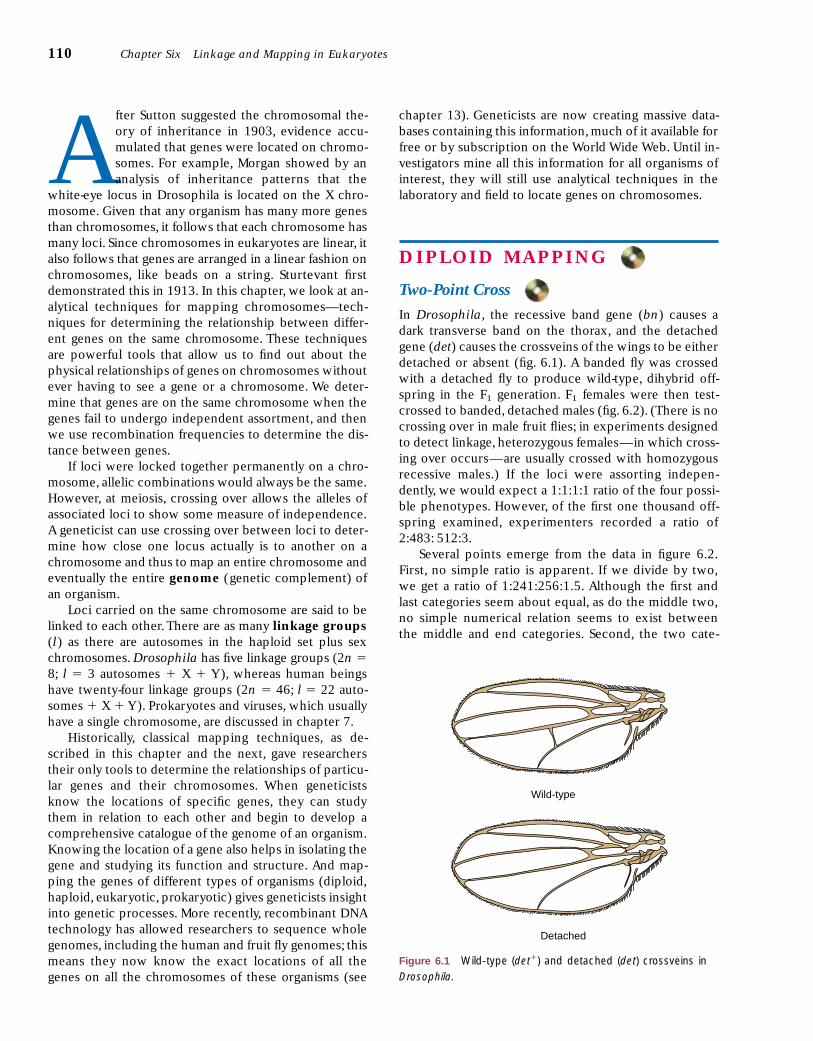
After Sutton suggested the chromosomal the-ory of inheritance in 1903, evidence accu-mulated that genes were located on chromo-somes. For example, Morgan showed by ananalysis of inheritance patterns that the
white-eye locus in Drosophila is located on the X chro-mosome. Given that any organism has many more genesthan chromosomes, it follows that each chromosome hasmany loci. Since chromosomes in eukaryotes are linear, italso follows that genes are arranged in a linear fashion onchromosomes, like beads on a string. Sturtevant firstdemonstrated this in 1913. In this chapter, we look at an-alytical techniques for mapping chromosomes—tech-niques for determining the relationship between differ-ent genes on the same chromosome. These techniquesare powerful tools that allow us to find out about thephysical relationships of genes on chromosomes withoutever having to see a gene or a chromosome. We deter-mine that genes are on the same chromosome when thegenes fail to undergo independent assortment, and thenwe use recombination frequencies to determine the dis-tance between genes.
If loci were locked together permanently on a chro-mosome, allelic combinations would always be the same.However, at meiosis, crossing over allows the alleles ofassociated loci to show some measure of independence.A geneticist can use crossing over between loci to deter-mine how close one locus actually is to another on achromosome and thus to map an entire chromosome andeventually the entire genome (genetic complement) ofan organism.
Loci carried on the same chromosome are said to belinked to each other. There are as many linkage groups(l) as there are autosomes in the haploid set plus sexchromosomes. Drosophila has five linkage groups (2n �8; l � 3 autosomes � X � Y), whereas human beingshave twenty-four linkage groups (2n � 46; l � 22 auto-somes � X � Y). Prokaryotes and viruses, which usuallyhave a single chromosome, are discussed in chapter 7.
Historically, classical mapping techniques, as de-scribed in this chapter and the next, gave researcherstheir only tools to determine the relationships of particu-lar genes and their chromosomes. When geneticistsknow the locations of specific genes, they can studythem in relation to each other and begin to develop acomprehensive catalogue of the genome of an organism.Knowing the location of a gene also helps in isolating thegene and studying its function and structure. And map-ping the genes of different types of organisms (diploid,haploid, eukaryotic, prokaryotic) gives geneticists insightinto genetic processes. More recently, recombinant DNAtechnology has allowed researchers to sequence wholegenomes, including the human and fruit fly genomes; thismeans they now know the exact locations of all thegenes on all the chromosomes of these organisms (see
chapter 13). Geneticists are now creating massive data-bases containing this information, much of it available forfree or by subscription on the World Wide Web. Until in-vestigators mine all this information for all organisms ofinterest, they will still use analytical techniques in thelaboratory and field to locate genes on chromosomes.
D I P L O I D M A P P I N G
Two-Point Cross
In Drosophila, the recessive band gene (bn) causes adark transverse band on the thorax, and the detachedgene (det) causes the crossveins of the wings to be eitherdetached or absent (fig. 6.1). A banded fly was crossedwith a detached fly to produce wild-type, dihybrid off-spring in the F1 generation. F1 females were then test-crossed to banded, detached males (fig. 6.2). (There is nocrossing over in male fruit flies; in experiments designedto detect linkage, heterozygous females—in which cross-ing over occurs—are usually crossed with homozygousrecessive males.) If the loci were assorting indepen-dently, we would expect a 1:1:1:1 ratio of the four possi-ble phenotypes. However, of the first one thousand off-spring examined, experimenters recorded a ratio of2:483: 512:3.
Several points emerge from the data in figure 6.2.First, no simple ratio is apparent. If we divide by two,we get a ratio of 1:241:256:1.5. Although the first andlast categories seem about equal, as do the middle two,no simple numerical relation seems to exist betweenthe middle and end categories. Second, the two cate-
110 Chapter Six Linkage and Mapping in Eukaryotes
Wild-type
Detached
Figure 6.1 Wild-type (det�) and detached (det) crossveins inDrosophila.
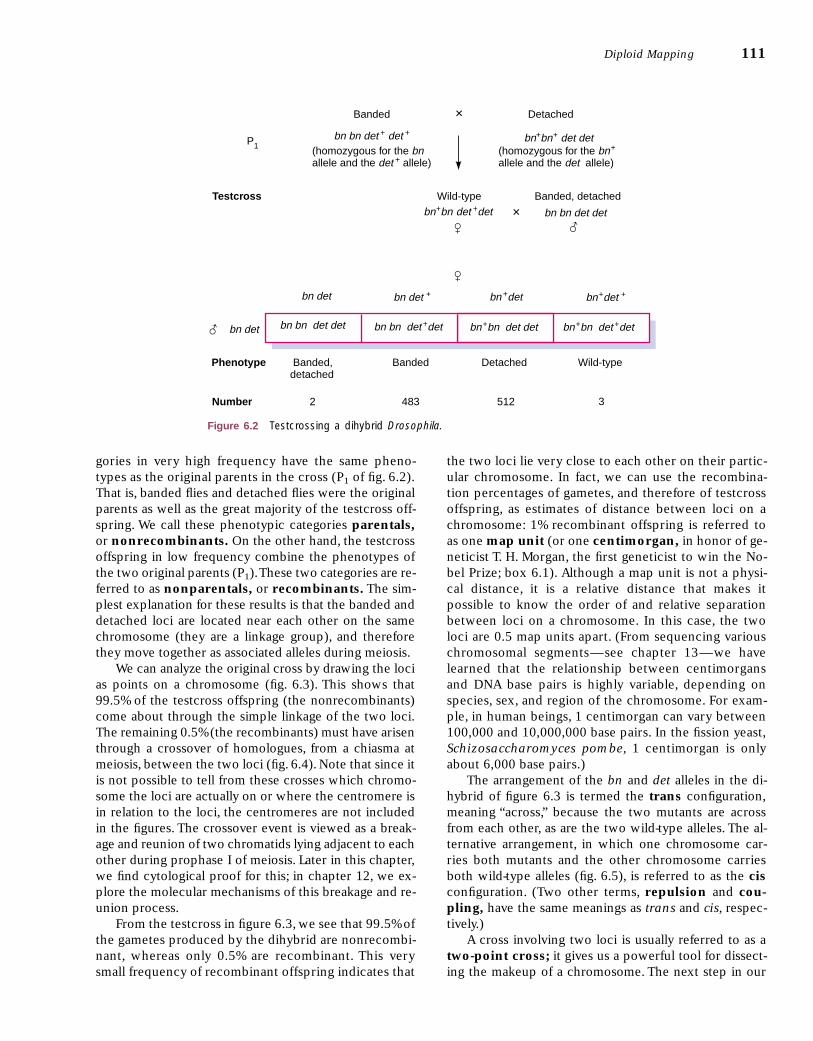
gories in very high frequency have the same pheno-types as the original parents in the cross (P1 of fig. 6.2).That is, banded flies and detached flies were the originalparents as well as the great majority of the testcross off-spring. We call these phenotypic categories parentals,or nonrecombinants. On the other hand, the testcrossoffspring in low frequency combine the phenotypes ofthe two original parents (P1).These two categories are re-ferred to as nonparentals, or recombinants. The sim-plest explanation for these results is that the banded anddetached loci are located near each other on the samechromosome (they are a linkage group), and thereforethey move together as associated alleles during meiosis.
We can analyze the original cross by drawing the locias points on a chromosome (fig. 6.3). This shows that99.5% of the testcross offspring (the nonrecombinants)come about through the simple linkage of the two loci.The remaining 0.5% (the recombinants) must have arisenthrough a crossover of homologues, from a chiasma atmeiosis, between the two loci (fig. 6.4). Note that since itis not possible to tell from these crosses which chromo-some the loci are actually on or where the centromere isin relation to the loci, the centromeres are not includedin the figures. The crossover event is viewed as a break-age and reunion of two chromatids lying adjacent to eachother during prophase I of meiosis. Later in this chapter,we find cytological proof for this; in chapter 12, we ex-plore the molecular mechanisms of this breakage and re-union process.
From the testcross in figure 6.3, we see that 99.5% ofthe gametes produced by the dihybrid are nonrecombi-nant, whereas only 0.5% are recombinant. This verysmall frequency of recombinant offspring indicates that
the two loci lie very close to each other on their partic-ular chromosome. In fact, we can use the recombina-tion percentages of gametes, and therefore of testcrossoffspring, as estimates of distance between loci on achromosome: 1% recombinant offspring is referred toas one map unit (or one centimorgan, in honor of ge-neticist T. H. Morgan, the first geneticist to win the No-bel Prize; box 6.1). Although a map unit is not a physi-cal distance, it is a relative distance that makes itpossible to know the order of and relative separationbetween loci on a chromosome. In this case, the twoloci are 0.5 map units apart. (From sequencing variouschromosomal segments—see chapter 13—we havelearned that the relationship between centimorgansand DNA base pairs is highly variable, depending onspecies, sex, and region of the chromosome. For exam-ple, in human beings, 1 centimorgan can vary between100,000 and 10,000,000 base pairs. In the fission yeast,Schizosaccharomyces pombe, 1 centimorgan is onlyabout 6,000 base pairs.)
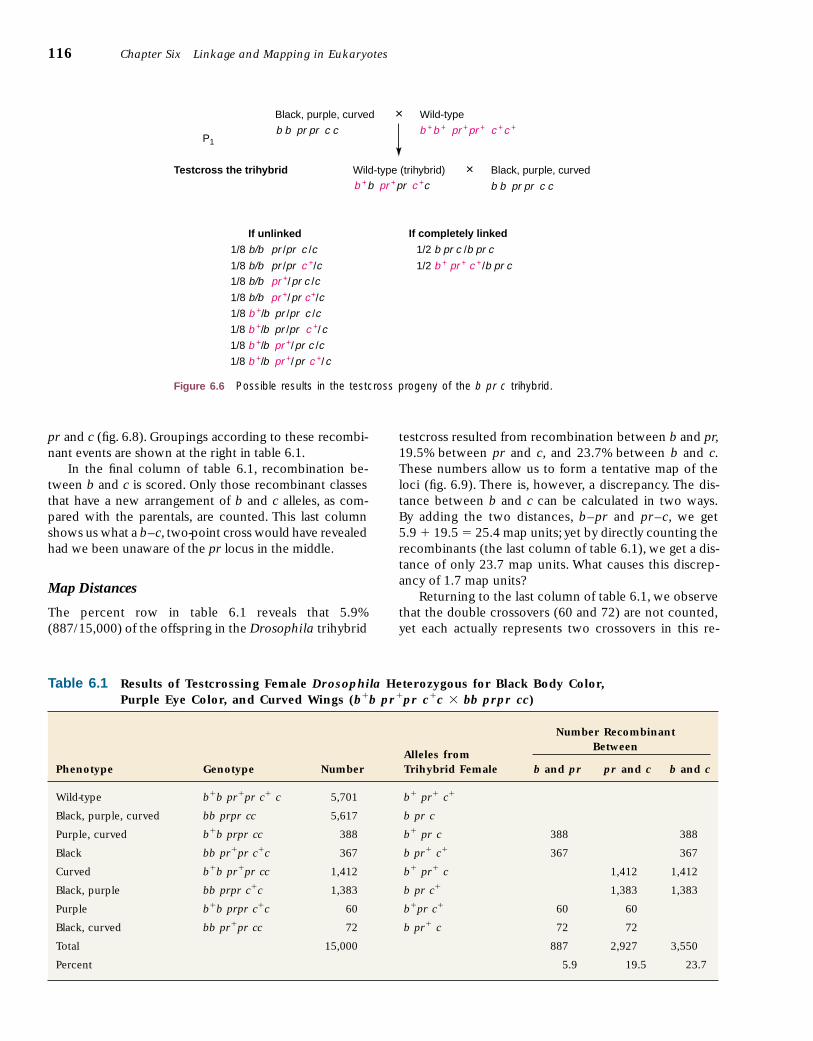
The arrangement of the bn and det alleles in the di-hybrid of figure 6.3 is termed the trans configuration,meaning “across,” because the two mutants are acrossfrom each other, as are the two wild-type alleles. The al-ternative arrangement, in which one chromosome car-ries both mutants and the other chromosome carriesboth wild-type alleles (fig. 6.5), is referred to as the cisconfiguration. (Two other terms, repulsion and cou-pling, have the same meanings as trans and cis, respec-tively.)
A cross involving two loci is usually referred to as atwo-point cross; it gives us a powerful tool for dissect-ing the makeup of a chromosome. The next step in our
Diploid Mapping 111
bn det
bn+bn det +det
(homozygous for the bnallele and the det + allele)
Banded × Detached
bn bn det + det +
(homozygous for the bn +
allele and the det allele)
bn+bn+ det det
Wild-type Banded, detached
× bn bn det det
Testcross
P1
��
bn det bn det + bn +det bn+det +
bn bn det det bn bn det +det bn+bn det det bn+bn det +det
Phenotype Banded, detached
Banded Detached Wild-type
Number 2 483 512 3
�
�
Figure 6.2 Testcrossing a dihybrid Drosophila.
112 Chapter Six Linkage and Mapping in Eukaryotes
B O X 6 . 1
The Nobel Prize
HistoricalPerspectives
On 10 December each year,the king of Sweden awardsthe Nobel Prizes at the
Stockholm Concert Hall. The date isthe anniversary of Alfred Nobel’sdeath. Awards are given annually inphysics, chemistry, medicine andphysiology, literature, economics, andpeace. In 2000, each award wasworth $900,000, although an awardsometimes goes to two or three re-cipients.The prestige is priceless.
Winners of the Nobel Prize arechosen according to the will of AlfredNobel, a wealthy Swedish inventorand industrialist, who held over threehundred patents when he died in1896 at the age of sixty-three. Nobeldeveloped a detonator and processesfor detonation of nitroglycerine, asubstance invented by Italian chemistAscanio Sobrero in 1847. In the formNobel developed, the explosive waspatented as dynamite. Nobel also in-vented several other forms of explo-sives. He was a benefactor of Sobrero,hiring him as a consultant and payinghis wife a pension after Sobrero died.
Nobel believed that dynamitewould be so destructive that it wouldserve as a deterrent to war. Later, real-izing that this would not come topass, he instructed that his fortune beinvested and the interest used to fundthe awards. The first prizes wereawarded in 1901. Each award consistsof a diploma, medal, and check.
American, British, German,French, and Swedish citizens haveearned the most prizes (table 1).Table 2 features some highlights ofNobel laureate achievements in ge-netics.
Table 1 Distribution of Nobel Awards to the Top Five Recipient Nations (Including 2000 Winners)
Medicine and
Physics Chemistry Physiology Peace Literature Economics Total
United States 77 46 88 20 9 30 270Britain 20 24 25 9 8 5 91Germany 18 27 15 4 6 1 71France 12 7 7 8 12 1 47Sweden 4 4 7 5 7 2 29
The Nobel medal. The medal is half a pound of 23-karatgold, measures about 2 1/2 inches across, and has Nobel’sface and the dates of his birth and death on the front. Thediplomas that accompany the awards are individually designed.(Reproduced by permission of the Nobel Foundation.)
Diploid Mapping 113
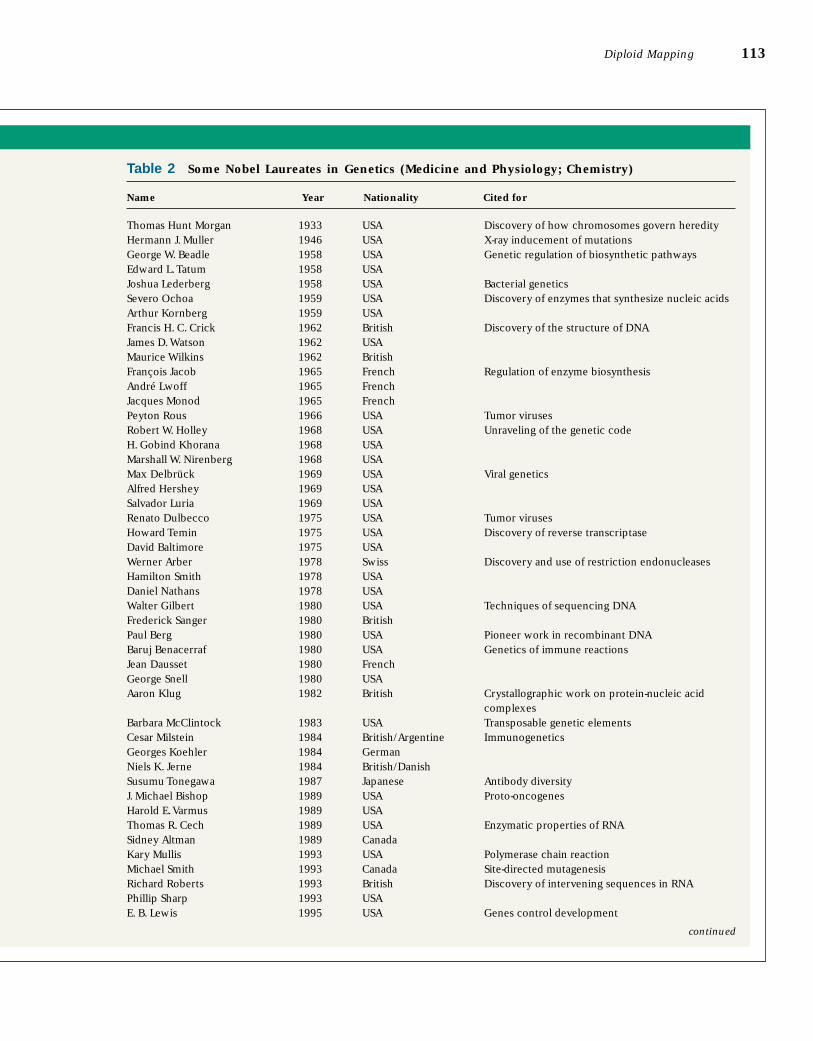
Table 2 Some Nobel Laureates in Genetics (Medicine and Physiology; Chemistry)
Name Year Nationality Cited for
Thomas Hunt Morgan 1933 USA Discovery of how chromosomes govern heredityHermann J. Muller 1946 USA X-ray inducement of mutationsGeorge W. Beadle 1958 USA Genetic regulation of biosynthetic pathwaysEdward L.Tatum 1958 USAJoshua Lederberg 1958 USA Bacterial geneticsSevero Ochoa 1959 USA Discovery of enzymes that synthesize nucleic acidsArthur Kornberg 1959 USAFrancis H. C. Crick 1962 British Discovery of the structure of DNAJames D. Watson 1962 USAMaurice Wilkins 1962 BritishFrançois Jacob 1965 French Regulation of enzyme biosynthesisAndré Lwoff 1965 FrenchJacques Monod 1965 FrenchPeyton Rous 1966 USA Tumor virusesRobert W. Holley 1968 USA Unraveling of the genetic codeH. Gobind Khorana 1968 USAMarshall W. Nirenberg 1968 USAMax Delbrück 1969 USA Viral geneticsAlfred Hershey 1969 USASalvador Luria 1969 USARenato Dulbecco 1975 USA Tumor virusesHoward Temin 1975 USA Discovery of reverse transcriptaseDavid Baltimore 1975 USAWerner Arber 1978 Swiss Discovery and use of restriction endonucleasesHamilton Smith 1978 USADaniel Nathans 1978 USAWalter Gilbert 1980 USA Techniques of sequencing DNAFrederick Sanger 1980 BritishPaul Berg 1980 USA Pioneer work in recombinant DNABaruj Benacerraf 1980 USA Genetics of immune reactionsJean Dausset 1980 FrenchGeorge Snell 1980 USAAaron Klug 1982 British Crystallographic work on protein-nucleic acid
complexesBarbara McClintock 1983 USA Transposable genetic elementsCesar Milstein 1984 British/Argentine ImmunogeneticsGeorges Koehler 1984 GermanNiels K. Jerne 1984 British/DanishSusumu Tonegawa 1987 Japanese Antibody diversityJ. Michael Bishop 1989 USA Proto-oncogenesHarold E.Varmus 1989 USAThomas R. Cech 1989 USA Enzymatic properties of RNASidney Altman 1989 CanadaKary Mullis 1993 USA Polymerase chain reactionMichael Smith 1993 Canada Site-directed mutagenesisRichard Roberts 1993 British Discovery of intervening sequences in RNAPhillip Sharp 1993 USAE. B. Lewis 1995 USA Genes control development
continued
114 Chapter Six Linkage and Mapping in Eukaryotes
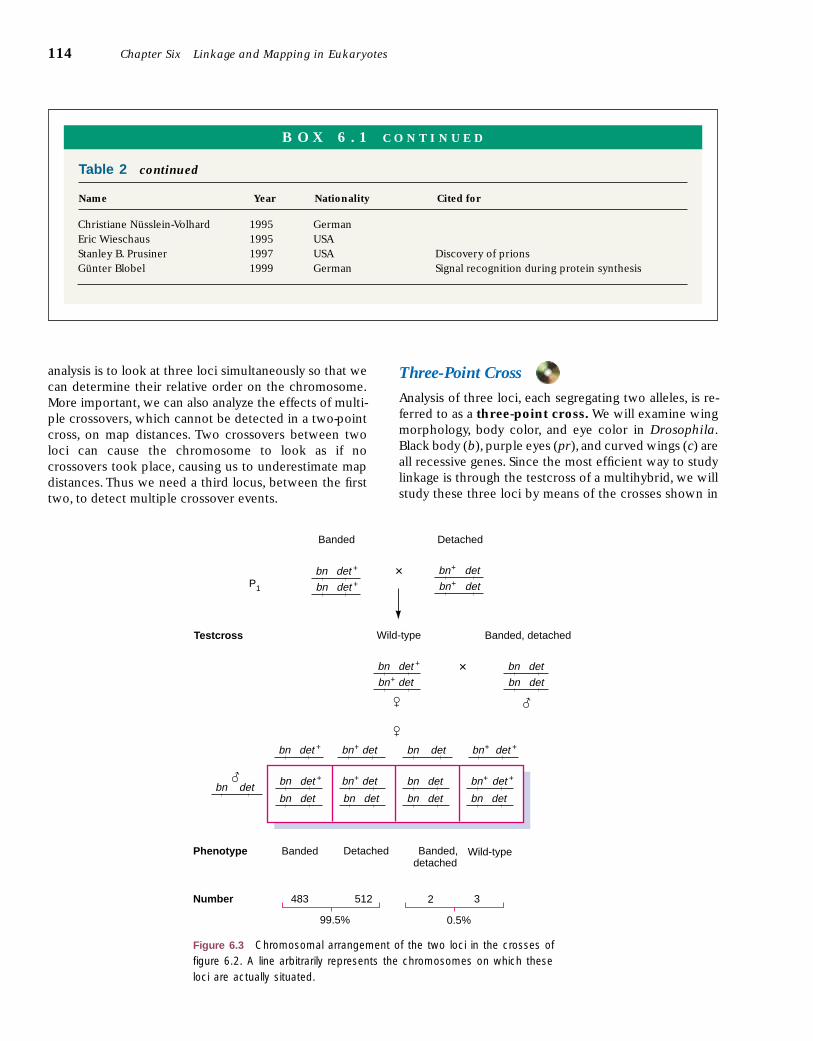
analysis is to look at three loci simultaneously so that wecan determine their relative order on the chromosome.More important, we can also analyze the effects of multi-ple crossovers, which cannot be detected in a two-pointcross, on map distances. Two crossovers between twoloci can cause the chromosome to look as if nocrossovers took place, causing us to underestimate mapdistances. Thus we need a third locus, between the firsttwo, to detect multiple crossover events.
Three-Point Cross
Analysis of three loci, each segregating two alleles, is re-ferred to as a three-point cross. We will examine wingmorphology, body color, and eye color in Drosophila.Black body (b), purple eyes (pr), and curved wings (c) areall recessive genes. Since the most efficient way to studylinkage is through the testcross of a multihybrid, we willstudy these three loci by means of the crosses shown in
Figure 6.3 Chromosomal arrangement of the two loci in the crosses offigure 6.2. A line arbitrarily represents the chromosomes on which theseloci are actually situated.
Banded Detached
Wild-type Banded, detachedTestcross
× bn + det
bn + det
×bn + det
bn det
bn det
P1
��
bn det + bn + det bn + det +bn det
bn det bn det
bn det
bn + det +
bn det
bn det +
bn det +
bn det +
Phenotype Banded Detached Banded, detached
Wild-type
Number 483 512 2 3
0.5%99.5%
bn det +
bn det
�
�bn det bn + det
B O X 6 . 1 C O N T I N U E D
Table 2 continued
Name Year Nationality Cited for
Christiane Nüsslein-Volhard 1995 GermanEric Wieschaus 1995 USAStanley B. Prusiner 1997 USA Discovery of prionsGünter Blobel 1999 German Signal recognition during protein synthesis
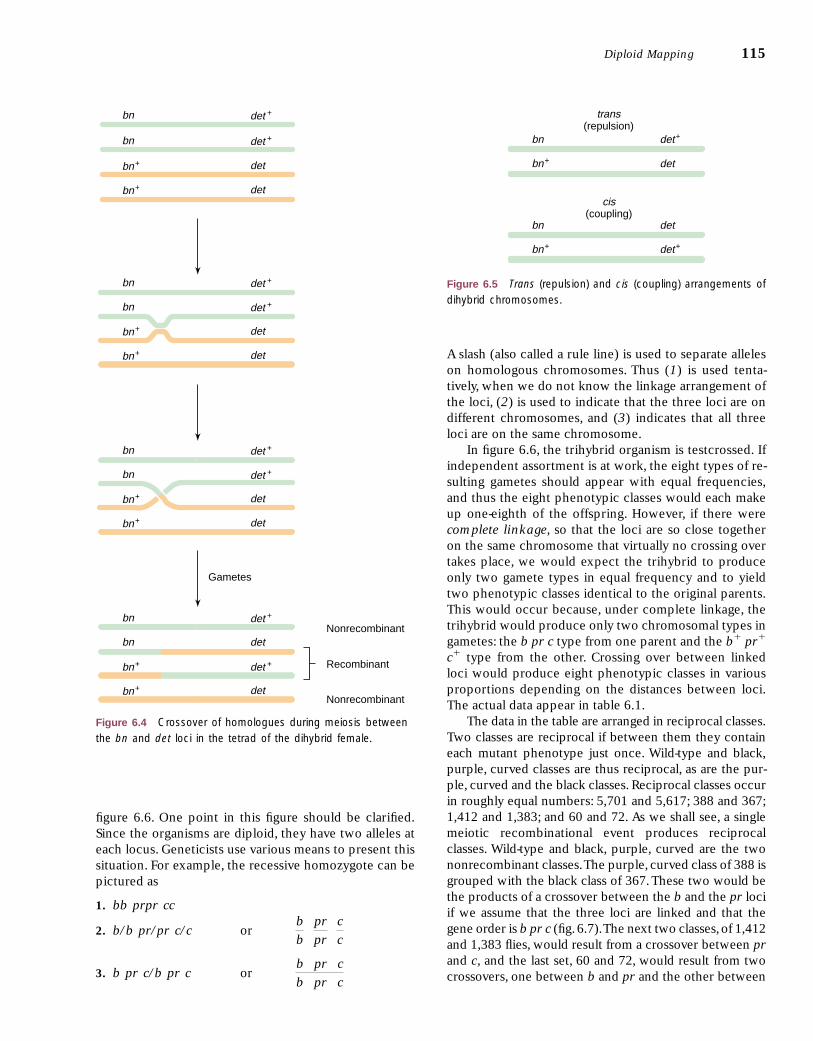
figure 6.6. One point in this figure should be clarified.Since the organisms are diploid, they have two alleles ateach locus. Geneticists use various means to present thissituation. For example, the recessive homozygote can bepictured as
1. bb prpr cc
2. b/b pr/pr c/c or
3. b pr c/b pr c orb pr c
b pr c
c
c
pr
pr
b
b
A slash (also called a rule line) is used to separate alleleson homologous chromosomes. Thus (1) is used tenta-tively, when we do not know the linkage arrangement ofthe loci, (2) is used to indicate that the three loci are ondifferent chromosomes, and (3) indicates that all threeloci are on the same chromosome.
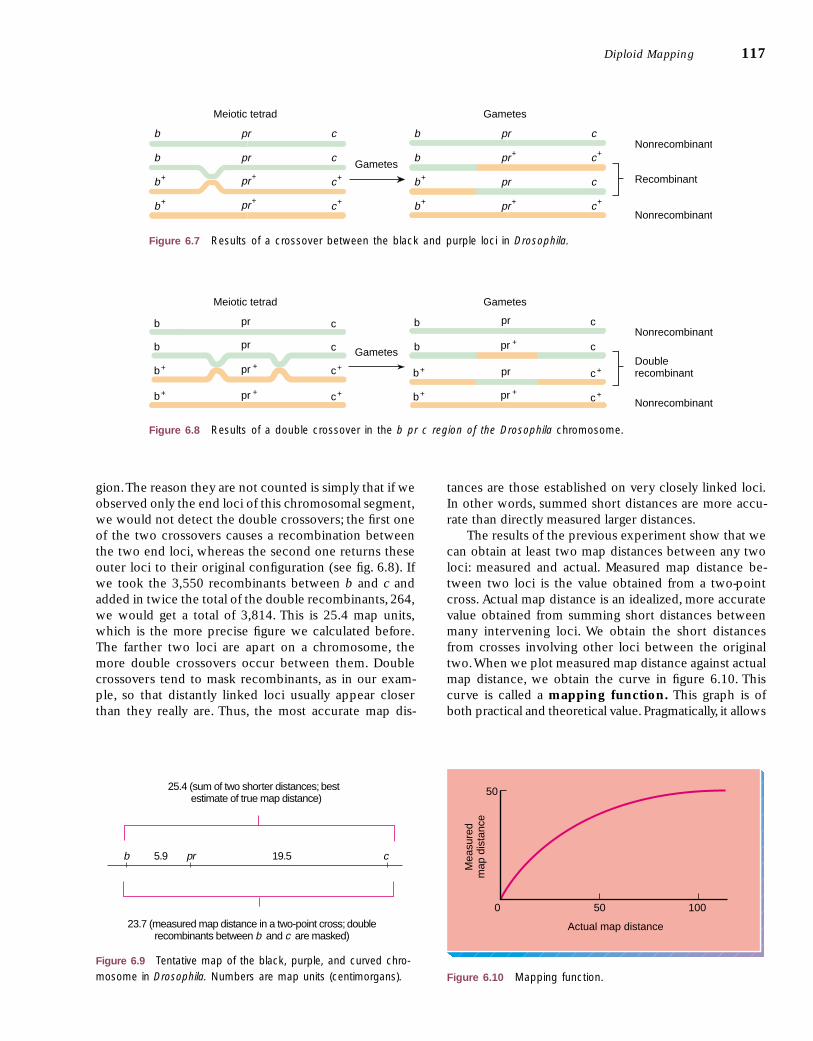
In figure 6.6, the trihybrid organism is testcrossed. Ifindependent assortment is at work, the eight types of re-sulting gametes should appear with equal frequencies,and thus the eight phenotypic classes would each makeup one-eighth of the offspring. However, if there werecomplete linkage, so that the loci are so close togetheron the same chromosome that virtually no crossing overtakes place, we would expect the trihybrid to produceonly two gamete types in equal frequency and to yieldtwo phenotypic classes identical to the original parents.This would occur because, under complete linkage, thetrihybrid would produce only two chromosomal types ingametes: the b pr c type from one parent and the b� pr�
c� type from the other. Crossing over between linkedloci would produce eight phenotypic classes in variousproportions depending on the distances between loci.The actual data appear in table 6.1.
The data in the table are arranged in reciprocal classes.Two classes are reciprocal if between them they containeach mutant phenotype just once. Wild-type and black,purple, curved classes are thus reciprocal, as are the pur-ple, curved and the black classes. Reciprocal classes occurin roughly equal numbers: 5,701 and 5,617; 388 and 367;1,412 and 1,383; and 60 and 72. As we shall see, a singlemeiotic recombinational event produces reciprocalclasses. Wild-type and black, purple, curved are the twononrecombinant classes.The purple, curved class of 388 isgrouped with the black class of 367. These two would bethe products of a crossover between the b and the pr lociif we assume that the three loci are linked and that thegene order is b pr c (fig.6.7).The next two classes,of 1,412and 1,383 flies, would result from a crossover between prand c, and the last set, 60 and 72, would result from twocrossovers, one between b and pr and the other between
Diploid Mapping 115
bn det +
bn det +
bn+ det
bn+ det
bn det +
bn det +
bn+ det
bn+ det
bn det +
bn det
bn+ det +
bn+ det
Nonrecombinant
Recombinant
Nonrecombinant
bn det +
bn det +
bn+ det
bn+ det
Gametes
Figure 6.4 Crossover of homologues during meiosis betweenthe bn and det loci in the tetrad of the dihybrid female.
Figure 6.5 Trans (repulsion) and cis (coupling) arrangements ofdihybrid chromosomes.
bn det+
bn+ det
trans(repulsion)
cis(coupling)
bn det
bn+ det+
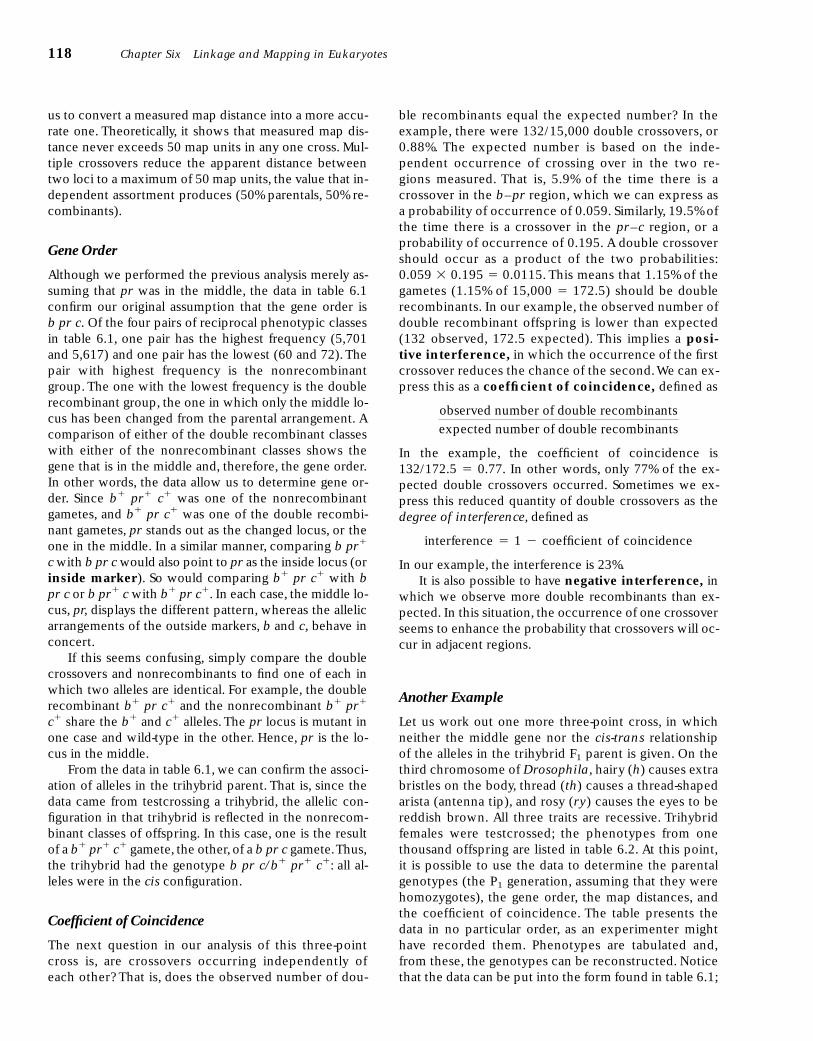
pr and c (fig. 6.8). Groupings according to these recombi-nant events are shown at the right in table 6.1.
In the final column of table 6.1, recombination be-tween b and c is scored. Only those recombinant classesthat have a new arrangement of b and c alleles, as com-pared with the parentals, are counted. This last columnshows us what a b–c, two-point cross would have revealedhad we been unaware of the pr locus in the middle.
Map Distances
The percent row in table 6.1 reveals that 5.9%(887/15,000) of the offspring in the Drosophila trihybrid
testcross resulted from recombination between b and pr,19.5% between pr and c, and 23.7% between b and c.These numbers allow us to form a tentative map of theloci (fig. 6.9). There is, however, a discrepancy. The dis-tance between b and c can be calculated in two ways.By adding the two distances, b–pr and pr–c, we get5.9 � 19.5 � 25.4 map units; yet by directly counting therecombinants (the last column of table 6.1), we get a dis-tance of only 23.7 map units. What causes this discrep-ancy of 1.7 map units?
Returning to the last column of table 6.1, we observethat the double crossovers (60 and 72) are not counted,yet each actually represents two crossovers in this re-
116 Chapter Six Linkage and Mapping in Eukaryotes
Black, purple, curved × Wild-type
Testcross the trihybrid Wild-type (trihybrid) × Black, purple, curved
b b pr pr c c b +b + pr +pr + c +c +
b +b pr +pr c +c b b pr pr c c
If unlinked If completely linked
1/8 b/b pr /pr c /c
1/8 b/b pr /pr c +/c1/8 b/b pr +/pr c /c
1/8 b/b pr +/pr c+/c
1/8 b +/b pr /pr c /c
1/8 b +/b pr /pr c +/c
1/8 b +/b pr +/pr c /c
1/8 b +/b pr +/pr c +/c
1/2 b pr c /b pr c
1/2 b + pr + c +/b pr c
P1
Table 6.1 Results of Testcrossing Female Drosophila Heterozygous for Black Body Color, Purple Eye Color, and Curved Wings (b�b pr�pr c�c � bb prpr cc)
Number Recombinant
Alleles fromBetween
Phenotype Genotype Number Trihybrid Female b and pr pr and c b and c
Wild-type b�b pr�pr c� c 5,701 b� pr� c�
Black, purple, curved bb prpr cc 5,617 b pr c
Purple, curved b�b prpr cc 388 b� pr c 388 388
Black bb pr�pr c�c 367 b pr� c� 367 367
Curved b�b pr�pr cc 1,412 b� pr� c 1,412 1,412
Black, purple bb prpr c�c 1,383 b pr c� 1,383 1,383
Purple b�b prpr c�c 60 b�pr c� 60 60
Black, curved bb pr�pr cc 72 b pr� c 72 72
Total 15,000 887 2,927 3,550
Percent 5.9 19.5 23.7
Figure 6.6 Possible results in the testcross progeny of the b pr c trihybrid.
gion.The reason they are not counted is simply that if weobserved only the end loci of this chromosomal segment,we would not detect the double crossovers; the first oneof the two crossovers causes a recombination betweenthe two end loci, whereas the second one returns theseouter loci to their original configuration (see fig. 6.8). Ifwe took the 3,550 recombinants between b and c andadded in twice the total of the double recombinants, 264,we would get a total of 3,814. This is 25.4 map units,which is the more precise figure we calculated before.The farther two loci are apart on a chromosome, themore double crossovers occur between them. Doublecrossovers tend to mask recombinants, as in our exam-ple, so that distantly linked loci usually appear closerthan they really are. Thus, the most accurate map dis-
tances are those established on very closely linked loci.In other words, summed short distances are more accu-rate than directly measured larger distances.
The results of the previous experiment show that wecan obtain at least two map distances between any twoloci: measured and actual. Measured map distance be-tween two loci is the value obtained from a two-pointcross. Actual map distance is an idealized, more accuratevalue obtained from summing short distances betweenmany intervening loci. We obtain the short distancesfrom crosses involving other loci between the originaltwo.When we plot measured map distance against actualmap distance, we obtain the curve in figure 6.10. Thiscurve is called a mapping function. This graph is ofboth practical and theoretical value. Pragmatically, it allows
Diploid Mapping 117
Figure 6.7 Results of a crossover between the black and purple loci in Drosophila.
Figure 6.8 Results of a double crossover in the b pr c region of the Drosophila chromosome.
b
b
b+
b+
pr
pr
pr+
pr+
c
c
c+
c+
b
b
b+
b+
pr
pr+
pr
pr+
c
c+
c
c+
Gametes
Nonrecombinant
Recombinant
Nonrecombinant
Meiotic tetrad Gametes
c+
b
b
b+
pr
pr
pr +
c
c
c+
b
b
pr
pr
Gametes
Nonrecombinant
Doublerecombinant
Nonrecombinant
Meiotic tetrad Gametes
b+ pr + c+
b+
b+ pr +
pr +
c+
c
c
25.4 (sum of two shorter distances; best estimate of true map distance)
23.7 (measured map distance in a two-point cross; doublerecombinants between b and c are masked)
b 5.9 pr 19.5 c
Figure 6.9 Tentative map of the black, purple, and curved chro-mosome in Drosophila. Numbers are map units (centimorgans).
50 100
50
Actual map distance
Mea
sure
dm
ap d
ista
nce
0
Figure 6.10 Mapping function.
us to convert a measured map distance into a more accu-rate one. Theoretically, it shows that measured map dis-tance never exceeds 50 map units in any one cross. Mul-tiple crossovers reduce the apparent distance betweentwo loci to a maximum of 50 map units, the value that in-dependent assortment produces (50% parentals, 50% re-combinants).
Gene Order
Although we performed the previous analysis merely as-suming that pr was in the middle, the data in table 6.1confirm our original assumption that the gene order is b pr c. Of the four pairs of reciprocal phenotypic classesin table 6.1, one pair has the highest frequency (5,701and 5,617) and one pair has the lowest (60 and 72). Thepair with highest frequency is the nonrecombinantgroup. The one with the lowest frequency is the doublerecombinant group, the one in which only the middle lo-cus has been changed from the parental arrangement. Acomparison of either of the double recombinant classeswith either of the nonrecombinant classes shows thegene that is in the middle and, therefore, the gene order.In other words, the data allow us to determine gene or-der. Since b� pr� c� was one of the nonrecombinantgametes, and b� pr c� was one of the double recombi-nant gametes, pr stands out as the changed locus, or theone in the middle. In a similar manner, comparing b pr�
c with b pr c would also point to pr as the inside locus (orinside marker). So would comparing b� pr c� with bpr c or b pr� c with b� pr c�. In each case, the middle lo-cus, pr, displays the different pattern, whereas the allelicarrangements of the outside markers, b and c, behave inconcert.
If this seems confusing, simply compare the doublecrossovers and nonrecombinants to find one of each inwhich two alleles are identical. For example, the doublerecombinant b� pr c� and the nonrecombinant b� pr�
c� share the b� and c� alleles. The pr locus is mutant inone case and wild-type in the other. Hence, pr is the lo-cus in the middle.
From the data in table 6.1, we can confirm the associ-ation of alleles in the trihybrid parent. That is, since thedata came from testcrossing a trihybrid, the allelic con-figuration in that trihybrid is reflected in the nonrecom-binant classes of offspring. In this case, one is the resultof a b� pr� c� gamete, the other, of a b pr c gamete.Thus,the trihybrid had the genotype b pr c/b� pr� c�: all al-leles were in the cis configuration.
Coefficient of Coincidence
The next question in our analysis of this three-pointcross is, are crossovers occurring independently ofeach other? That is, does the observed number of dou-
ble recombinants equal the expected number? In theexample, there were 132/15,000 double crossovers, or0.88%. The expected number is based on the inde-pendent occurrence of crossing over in the two re-gions measured. That is, 5.9% of the time there is acrossover in the b–pr region, which we can express asa probability of occurrence of 0.059. Similarly, 19.5% ofthe time there is a crossover in the pr–c region, or aprobability of occurrence of 0.195. A double crossovershould occur as a product of the two probabilities:0.059 � 0.195 � 0.0115. This means that 1.15% of thegametes (1.15% of 15,000 � 172.5) should be doublerecombinants. In our example, the observed number ofdouble recombinant offspring is lower than expected(132 observed, 172.5 expected). This implies a posi-tive interference, in which the occurrence of the firstcrossover reduces the chance of the second.We can ex-press this as a coefficient of coincidence, defined as
In the example, the coefficient of coincidence is132/172.5 � 0.77. In other words, only 77% of the ex-pected double crossovers occurred. Sometimes we ex-press this reduced quantity of double crossovers as thedegree of interference, defined as
interference � 1 � coefficient of coincidence
In our example, the interference is 23%.It is also possible to have negative interference, in
which we observe more double recombinants than ex-pected. In this situation, the occurrence of one crossoverseems to enhance the probability that crossovers will oc-cur in adjacent regions.
Another Example
Let us work out one more three-point cross, in whichneither the middle gene nor the cis-trans relationshipof the alleles in the trihybrid F1 parent is given. On thethird chromosome of Drosophila, hairy (h) causes extrabristles on the body, thread (th) causes a thread-shapedarista (antenna tip), and rosy (ry) causes the eyes to bereddish brown. All three traits are recessive. Trihybridfemales were testcrossed; the phenotypes from onethousand offspring are listed in table 6.2. At this point,it is possible to use the data to determine the parentalgenotypes (the P1 generation, assuming that they werehomozygotes), the gene order, the map distances, andthe coefficient of coincidence. The table presents thedata in no particular order, as an experimenter mighthave recorded them. Phenotypes are tabulated and,from these, the genotypes can be reconstructed. Noticethat the data can be put into the form found in table 6.1;
observed number of double recombinants
expected number of double recombinants
118 Chapter Six Linkage and Mapping in Eukaryotes
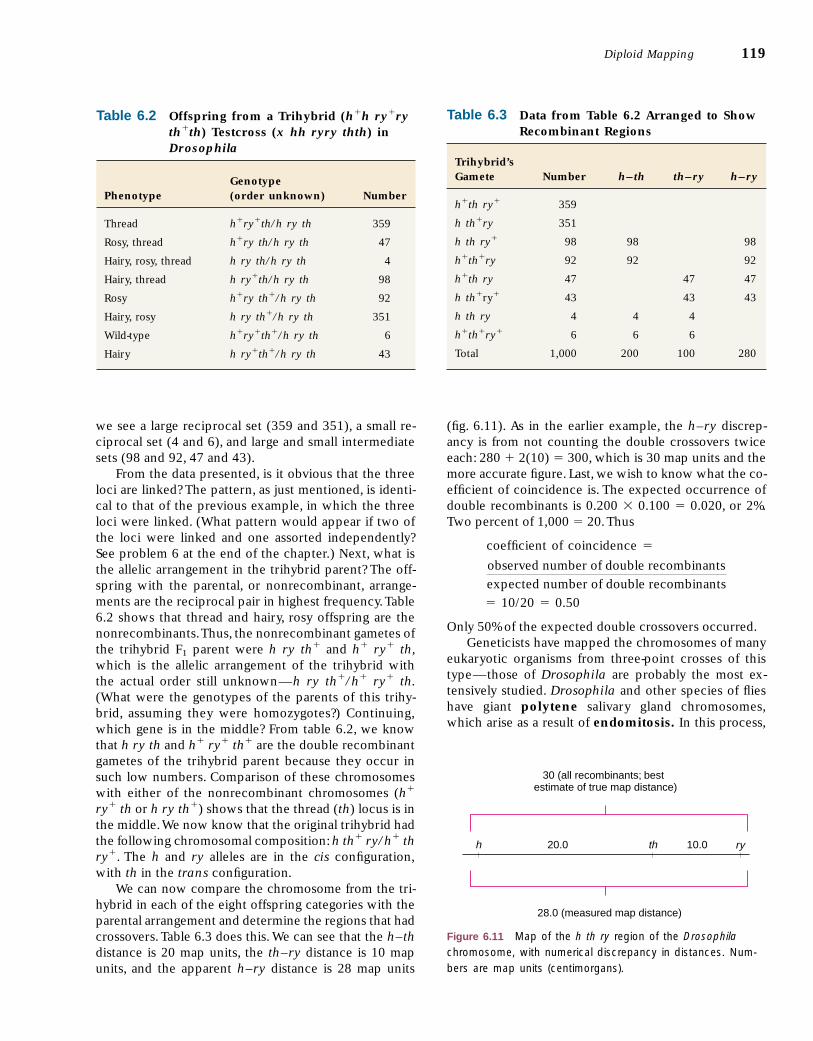
we see a large reciprocal set (359 and 351), a small re-ciprocal set (4 and 6), and large and small intermediatesets (98 and 92, 47 and 43).
From the data presented, is it obvious that the threeloci are linked? The pattern, as just mentioned, is identi-cal to that of the previous example, in which the threeloci were linked. (What pattern would appear if two ofthe loci were linked and one assorted independently?See problem 6 at the end of the chapter.) Next, what isthe allelic arrangement in the trihybrid parent? The off-spring with the parental, or nonrecombinant, arrange-ments are the reciprocal pair in highest frequency.Table6.2 shows that thread and hairy, rosy offspring are thenonrecombinants.Thus, the nonrecombinant gametes ofthe trihybrid F1 parent were h ry th� and h� ry� th,which is the allelic arrangement of the trihybrid withthe actual order still unknown—h ry th�/h� ry� th.(What were the genotypes of the parents of this trihy-brid, assuming they were homozygotes?) Continuing,which gene is in the middle? From table 6.2, we knowthat h ry th and h� ry� th� are the double recombinantgametes of the trihybrid parent because they occur insuch low numbers. Comparison of these chromosomeswith either of the nonrecombinant chromosomes (h�
ry� th or h ry th�) shows that the thread (th) locus is inthe middle.We now know that the original trihybrid hadthe following chromosomal composition: h th� ry/h� thry�. The h and ry alleles are in the cis configuration,with th in the trans configuration.
We can now compare the chromosome from the tri-hybrid in each of the eight offspring categories with theparental arrangement and determine the regions that hadcrossovers. Table 6.3 does this. We can see that the h–thdistance is 20 map units, the th–ry distance is 10 mapunits, and the apparent h–ry distance is 28 map units
(fig. 6.11). As in the earlier example, the h–ry discrep-ancy is from not counting the double crossovers twiceeach: 280 � 2(10) � 300, which is 30 map units and themore accurate figure. Last, we wish to know what the co-efficient of coincidence is. The expected occurrence ofdouble recombinants is 0.200 � 0.100 � 0.020, or 2%.Two percent of 1,000 � 20.Thus
coefficient of coincidence �
� 10/20 � 0.50
Only 50% of the expected double crossovers occurred.Geneticists have mapped the chromosomes of many
eukaryotic organisms from three-point crosses of thistype—those of Drosophila are probably the most ex-tensively studied. Drosophila and other species of flieshave giant polytene salivary gland chromosomes,which arise as a result of endomitosis. In this process,
observed number of double recombinants
expected number of double recombinants
Diploid Mapping 119
Table 6.2 Offspring from a Trihybrid (h�h ry�ryth�th) Testcross (x hh ryry thth) inDrosophila
Genotype Phenotype (order unknown) Number
Thread h�ry�th/h ry th 359
Rosy, thread h�ry th/h ry th 47
Hairy, rosy, thread h ry th/h ry th 4
Hairy, thread h ry�th/h ry th 98
Rosy h�ry th�/h ry th 92
Hairy, rosy h ry th�/h ry th 351
Wild-type h�ry�th�/h ry th 6
Hairy h ry�th�/h ry th 43
Table 6.3 Data from Table 6.2 Arranged to ShowRecombinant Regions
Trihybrid’s Gamete Number h––th th––ry h––ry
h�th ry� 359
h th�ry 351
h th ry� 98 98 98
h�th�ry 92 92 92
h�th ry 47 47 47
h th�ry� 43 43 43
h th ry 4 4 4
h�th�ry� 6 6 6
Total 1,000 200 100 280
30 (all recombinants; bestestimate of true map distance)
28.0 (measured map distance)
h th ry20.0 10.0
Figure 6.11 Map of the h th ry region of the Drosophilachromosome, with numerical discrepancy in distances. Num-bers are map units (centimorgans).
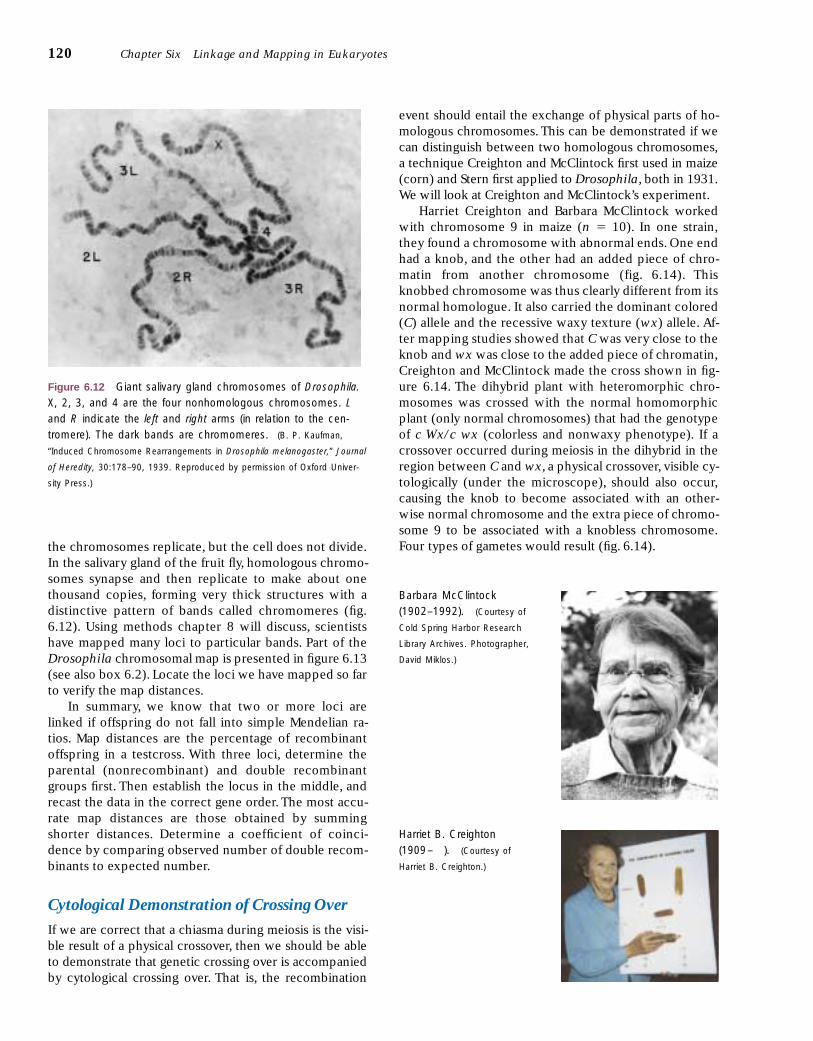
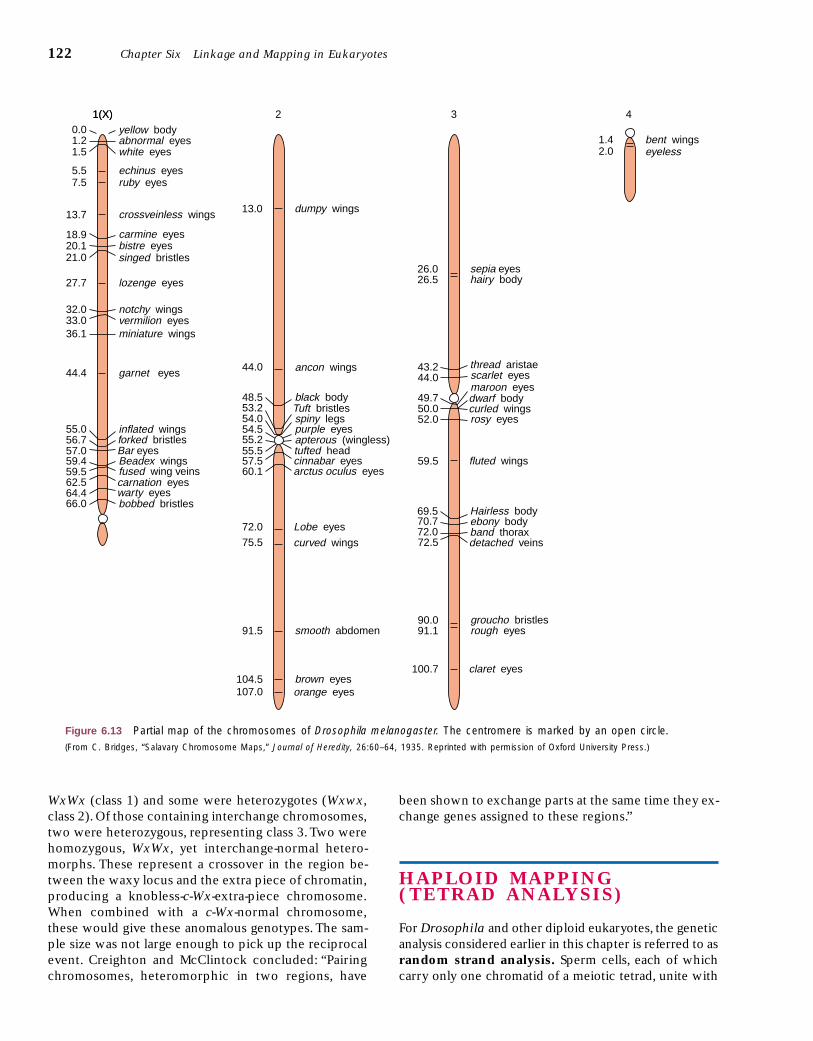
the chromosomes replicate, but the cell does not divide.In the salivary gland of the fruit fly, homologous chromo-somes synapse and then replicate to make about onethousand copies, forming very thick structures with adistinctive pattern of bands called chromomeres (fig.6.12). Using methods chapter 8 will discuss, scientistshave mapped many loci to particular bands. Part of theDrosophila chromosomal map is presented in figure 6.13(see also box 6.2). Locate the loci we have mapped so farto verify the map distances.
In summary, we know that two or more loci arelinked if offspring do not fall into simple Mendelian ra-tios. Map distances are the percentage of recombinantoffspring in a testcross. With three loci, determine theparental (nonrecombinant) and double recombinantgroups first. Then establish the locus in the middle, andrecast the data in the correct gene order. The most accu-rate map distances are those obtained by summingshorter distances. Determine a coefficient of coinci-dence by comparing observed number of double recom-binants to expected number.
Cytological Demonstration of Crossing Over
If we are correct that a chiasma during meiosis is the visi-ble result of a physical crossover, then we should be ableto demonstrate that genetic crossing over is accompaniedby cytological crossing over. That is, the recombination
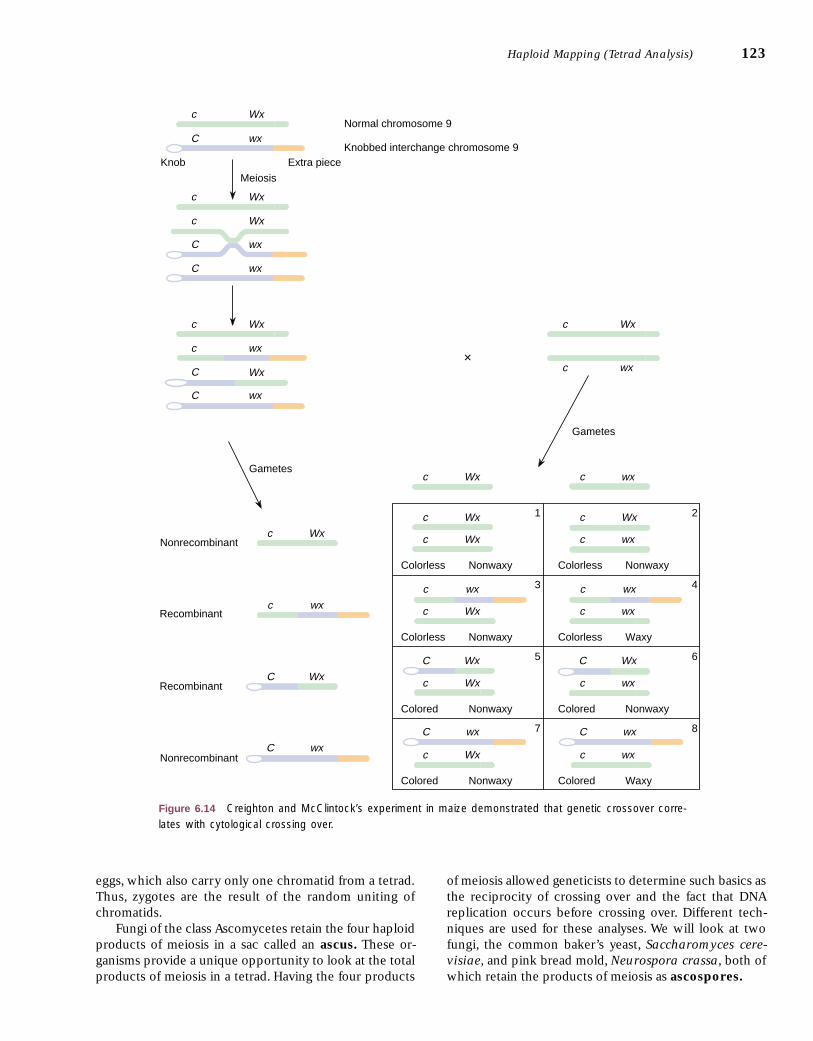
event should entail the exchange of physical parts of ho-mologous chromosomes. This can be demonstrated if wecan distinguish between two homologous chromosomes,a technique Creighton and McClintock first used in maize(corn) and Stern first applied to Drosophila, both in 1931.We will look at Creighton and McClintock’s experiment.
Harriet Creighton and Barbara McClintock workedwith chromosome 9 in maize (n � 10). In one strain,they found a chromosome with abnormal ends. One endhad a knob, and the other had an added piece of chro-matin from another chromosome (fig. 6.14). Thisknobbed chromosome was thus clearly different from itsnormal homologue. It also carried the dominant colored(C) allele and the recessive waxy texture (wx) allele. Af-ter mapping studies showed that C was very close to theknob and wx was close to the added piece of chromatin,Creighton and McClintock made the cross shown in fig-ure 6.14. The dihybrid plant with heteromorphic chro-mosomes was crossed with the normal homomorphicplant (only normal chromosomes) that had the genotypeof c Wx/c wx (colorless and nonwaxy phenotype). If acrossover occurred during meiosis in the dihybrid in theregion between C and wx, a physical crossover, visible cy-tologically (under the microscope), should also occur,causing the knob to become associated with an other-wise normal chromosome and the extra piece of chromo-some 9 to be associated with a knobless chromosome.Four types of gametes would result (fig. 6.14).
120 Chapter Six Linkage and Mapping in Eukaryotes
Figure 6.12 Giant salivary gland chromosomes of Drosophila.X, 2, 3, and 4 are the four nonhomologous chromosomes. Land R indicate the left and right arms (in relation to the cen-tromere). The dark bands are chromomeres. (B. P. Kaufman,
“Induced Chromosome Rearrangements in Drosophila melanogaster,” Journal
of Heredity, 30:178–90, 1939. Reproduced by permission of Oxford Univer-
sity Press.)
Barbara McClintock (1902–1992). (Courtesy of
Cold Spring Harbor Research
Library Archives. Photographer,
David Miklos.)
Harriet B. Creighton (1909– ). (Courtesy of
Harriet B. Creighton.)
Diploid Mapping 121
B O X 6 . 2
The first chromosomal mapever published included justfive loci on the X chromo-
some of Drosophila melanogaster(fig. 1). It was published in 1913 byAlfred H. Sturtevant, who beganworking in Thomas Hunt Morgan’s“fly lab” while an undergraduate stu-dent at Columbia University. The flylab included H. J. Muller, later to win aNobel Prize, and Calvin B. Bridges,whose work on sex determination inDrosophila we discussed in the lastchapter.
Sturtevant worked with six mu-tants: yellow body ( y); white (w),eosin (we), and vermilion eyes (v);and miniature (m) and rudimentarywings (r). (White and eosin are actu-ally allelic; Sturtevant found no cross-ing over between the two “loci.”) Us-ing crosses similar to the ones weoutline in this chapter, he con-structed the map shown in figure 1.The map distances we accept todayare very similar to the ones he ob-tained.
Sturtevant’s work was especiallyimportant at this point because hisdata supported several basic con-cepts, including the linear arrange-ment of genes, which argued for the
placement of genes on chromosomesas the only linear structures in the nu-cleus. Sturtevant also pointed outcrossover interference. His summaryis clear and succinct:
It has been found possible toarrange six sex-linked factors inDrosophila in a linear series, usingthe number of crossovers per onehundred cases as an index of the dis-tance between any two factors.Thisscheme gives consistent results, inthe main.
A source of error in predictingthe strength of association betweenuntried factors is found in doublecrossing over. The occurrence ofthis phenomenon is demonstrated,and it is shown not to occur as oftenas would be expected from a purelymathematical point of view, but theconditions governing its frequencyare as yet not worked out.
These results . . . form a new ar-gument in favor of the chromosomeview of inheritance, since theystrongly indicate that the factors in-vestigated are arranged in a linearseries, at least mathematically.
The First Chromosomal Map
Historical Perspectives
Alfred H. Sturtevant (1891–1970).(Courtesy of the Archives, California Institute
of Technology.)
y w v m r
0.0 1.0
(0.0 1.5)
30.7
(33.0)
33.7
(36.1)
57.6
(54.5)
we
Figure 1 The first chromosomal linkage map. Five loci in Drosophila melanogaster are mapped to the X chro-mosome. The numbers in parentheses are the more accurately mapped distances recognized today. We also showtoday’s allelic designations rather than Sturtevant’s original nomenclature. (Data from Sturtevant. “The linear arrangement
of six sex-linked factors in Drosophila, as shown by their mode of association,” Journal of Experimental Zoology, 14:43–59, 1913.)
Of twenty-eight offspring examined, all were consis-tent with the predictions of the Punnett square in figure6.14. Those of class 8 (lower right box) with the col-ored, waxy phenotype all had a knobbed interchangechromosome as well as a normal homologue. Thosewith the colorless, waxy phenotype (class 4) had a knob-less interchange chromosome. All of the colored, non-
waxy phenotypes (classes 5, 6, and 7) had a knobbed,normal chromosome, which indicated that only classes5 and 6 were in the sample. Of the two that were tested,both were WxWx, indicating that they were of class 5.The remaining classes (1, 2, and 3) were of the color-less, nonwaxy phenotype. All were knobless. Of thosethat contained only normal chromosomes, some were
WxWx (class 1) and some were heterozygotes (Wxwx,class 2). Of those containing interchange chromosomes,two were heterozygous, representing class 3. Two werehomozygous, WxWx, yet interchange-normal hetero-morphs. These represent a crossover in the region be-tween the waxy locus and the extra piece of chromatin,producing a knobless-c-Wx-extra-piece chromosome.When combined with a c-Wx-normal chromosome,these would give these anomalous genotypes. The sam-ple size was not large enough to pick up the reciprocalevent. Creighton and McClintock concluded: “Pairingchromosomes, heteromorphic in two regions, have
122 Chapter Six Linkage and Mapping in Eukaryotes
0.01.21.5
5.57.5
13.7
18.920.1
27.7
32.033.036.1
44.4
55.056.757.059.459.562.564.466.0
yellow bodyabnormal eyeswhite eyes
echinus eyesruby eyes
crossveinless wings
carmine eyesbistre eyessinged bristles
lozenge eyes
notchy wingsvermilion eyesminiature wings
garnet eyes
inflated wings forked bristlesBar eyesBeadex wingsfused wing veinscarnation eyeswarty eyesbobbed bristles
21.0
1(X)1(X)
2.0
4
1.4 bent wingseyeless
26.0 sepia eyes
44.0 scarlet eyes
49.750.0
dwarf bodycurled wingsrosy eyes
fluted wings
Hairless bodyebony body
detached veins
rough eyes
claret eyes
52.0
59.5
69.570.7
72.5
91.1
100.7
3
26.5 hairy body
43.2 thread aristae
band thorax72.0
groucho bristles90.0
maroon eyes
13.0 dumpy wings
44.0 ancon wings
48.5 black body53.254.0
Tuft bristlesspiny legspurple eyesapterous (wingless)tufted headcinnabar eyesarctus oculus eyes
Lobe eyes
curved wings
smooth abdomen
brown eyesorange eyes
54.555.255.557.560.1
72.0
75.5
91.5
104.5107.0
2
Figure 6.13 Partial map of the chromosomes of Drosophila melanogaster. The centromere is marked by an open circle.(From C. Bridges, “Salavary Chromosome Maps,” Journal of Heredity, 26:60–64, 1935. Reprinted with permission of Oxford University Press.)
been shown to exchange parts at the same time they ex-change genes assigned to these regions.”
H A P L O I D M A P P I N G ( T E T R A D A N A LY S I S )
For Drosophila and other diploid eukaryotes, the geneticanalysis considered earlier in this chapter is referred to asrandom strand analysis. Sperm cells, each of whichcarry only one chromatid of a meiotic tetrad, unite with
eggs, which also carry only one chromatid from a tetrad.Thus, zygotes are the result of the random uniting ofchromatids.
Fungi of the class Ascomycetes retain the four haploidproducts of meiosis in a sac called an ascus. These or-ganisms provide a unique opportunity to look at the totalproducts of meiosis in a tetrad. Having the four products
of meiosis allowed geneticists to determine such basics asthe reciprocity of crossing over and the fact that DNAreplication occurs before crossing over. Different tech-niques are used for these analyses. We will look at twofungi, the common baker’s yeast, Saccharomyces cere-visiae, and pink bread mold, Neurospora crassa, both ofwhich retain the products of meiosis as ascospores.
Haploid Mapping (Tetrad Analysis) 123
Wx
c Wx
C wx
c Wx
c Wx
c Wx
c
C wx
C wx
C
wx
C wx
Knob Extra piece
Meiosis
Gametes
Gametes
Colorless Nonwaxy
1
Colorless Nonwaxy
3
Colored Nonwaxy
5
Colored Nonwaxy
7
Colorless Nonwaxy
2
Colorless Waxy
4
Colored Nonwaxy
6
Colored Waxy
8
c wx
c wx
c wx
c wx
c wx
Nonrecombinant
Recombinant
Recombinant
Nonrecombinant
C Wx
C wx
C Wx
C wx C wx
C Wx
×
c Wx
c wx
c Wx
c Wx
c wx
c Wx
c Wx
c Wx
c wx c wx
c Wx
c Wx
c Wx
Normal chromosome 9
Knobbed interchange chromosome 9
Figure 6.14 Creighton and McClintock’s experiment in maize demonstrated that genetic crossover corre-lates with cytological crossing over.
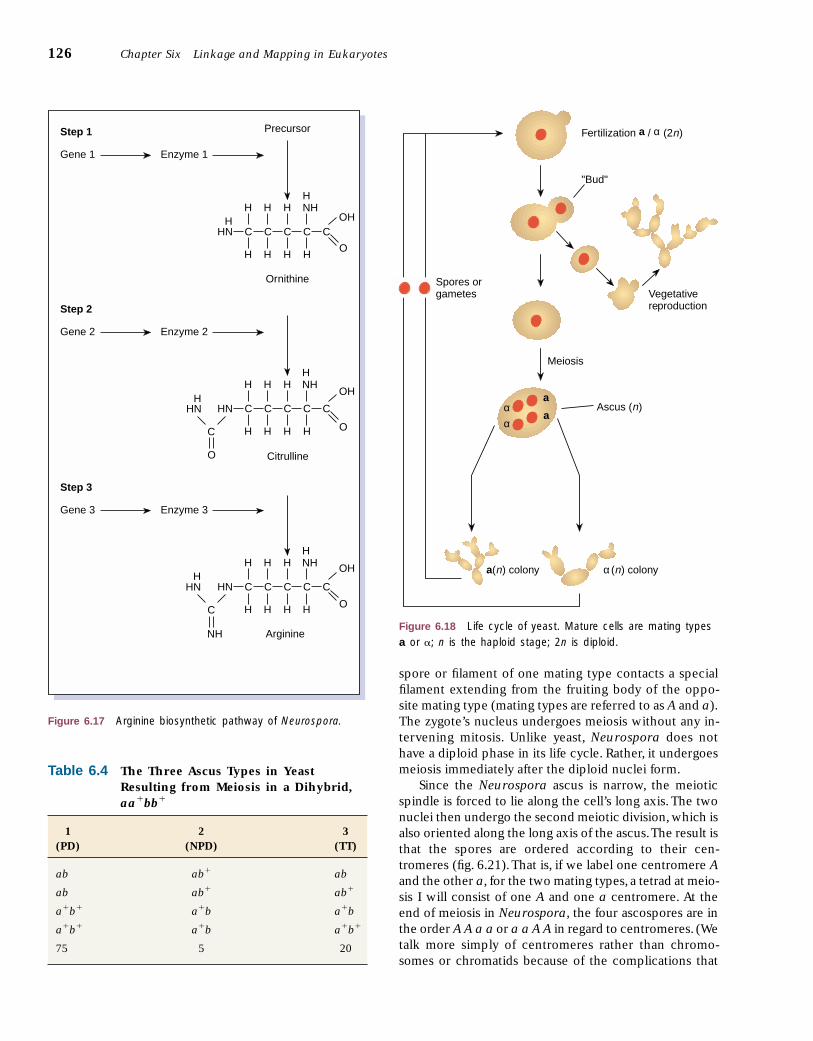
Phenotypes of Fungi
At this point, you might wonder what phenotypesfungi such as yeast and Neurospora express. In general,microorganisms have phenotypes that fall into threebroad categories: colony morphology, drug resistance,and nutritional requirements. Many microorganismscan be cultured in petri plates or test tubes that con-tain a supporting medium such as agar, to which vari-ous substances can be added (fig. 6.15). Wild-type Neu-rospora, the familiar pink bread mold, generally growsin a filamentous form, whereas yeast tends to formcolonies. Various mutations exist that change colonymorphology. In yeast, the ade gene causes the coloniesto be red. In Neurospora, fluffy ( fl ), tuft (tu), dirty(dir), and colonial (col4 ) are all mutants of the basicgrowth form. In addition, wild-type Neurospora is sen-sitive to the sulfa drug sulfonamide, whereas one of itsmutants (Sfo) actually requires sulfonamide in order tosurvive and grow. Yeast shows similar sensitivities toantifungal agents.
Nutritional-requirement phenotypes provide great in-sight not only into genetic analysis but also into the bio-chemical pathways of metabolism, as mentioned inchapter 2. Wild-type Neurospora can grow on a mediumcontaining only sugar, a nitrogen source, some organicacids and salts, and the vitamin biotin. This is referred toas minimal medium. However, several different mutanttypes, or strains, of Neurospora cannot grow on thisminimal medium until some essential nutrient is added.For example, one mutant strain will not grow on minimalmedium, but will grow if one of the amino acids, argi-nine, is added (fig. 6.16). From this we can infer that thewild-type has a normal, functional enzyme in the syn-thetic pathway of arginine. The arginine-requiring mu-tant has an allele that specifies an enzyme that is inca-pable of converting one of the intermediates in thepathway directly into arginine or into one of the precur-sors to arginine.We can see that if the synthetic pathwayis long, many different loci may have alleles that causethe strain to require arginine (fig. 6.17).This, in fact, hap-pens, and the different loci are usually named arg1, arg2 ,and so on.There are numerous biosynthetic pathways inyeast and Neurospora, and mutants exhibit many differ-ent nutritional requirements. Mutants can be induced ex-perimentally by radiation or by chemicals and othertreatments. These, then, are the tools we use to analyzeand map the chromosomes of microorganisms, includingyeast and Neurospora. These techniques are expandedon in the next chapter.
Unordered Spores (Yeast)
Baker’s, or budding, yeast, Saccharomyces cerevisiae, ex-ists in both a haploid and diploid form (fig. 6.18). The
haploid form usually forms under nutritional stress (star-vation). When better conditions return, haploid cells ofthe two sexes, called a and � mating types, fuse to formthe diploid. (Mating types are generally the result of aone-locus, two-allele genetic system that determines thatonly opposite mating types can fuse. We discuss this sys-tem in more detail in chapter 16.) The haploid is again es-tablished by meiosis under starvation conditions. Inyeast, all the products of meiosis are contained in the as-cus. Let us look at a mapping problem, using the a and bloci for convenience.
When an ab spore (or gamete) fuses with an a�b�
spore (or gamete), and the diploid then undergoes meio-sis, the spores can be isolated and grown as haploidcolonies, which are then observed for the phenotypes thetwo loci control. Only three patterns can occur (table 6.4).
124 Chapter Six Linkage and Mapping in Eukaryotes
Individual spores are pressedout of the ascus. The sporesare lined up and the agar issliced into sections.
Knife
Squares are lifted out andplaced in individual tubesto grow.
Spore
Agar square
Agar
Glass needle
Petri plate
Agar
Eight ascosporeswithin the
ascus
Figure 6.15 Spore isolation technique in Neurospora.
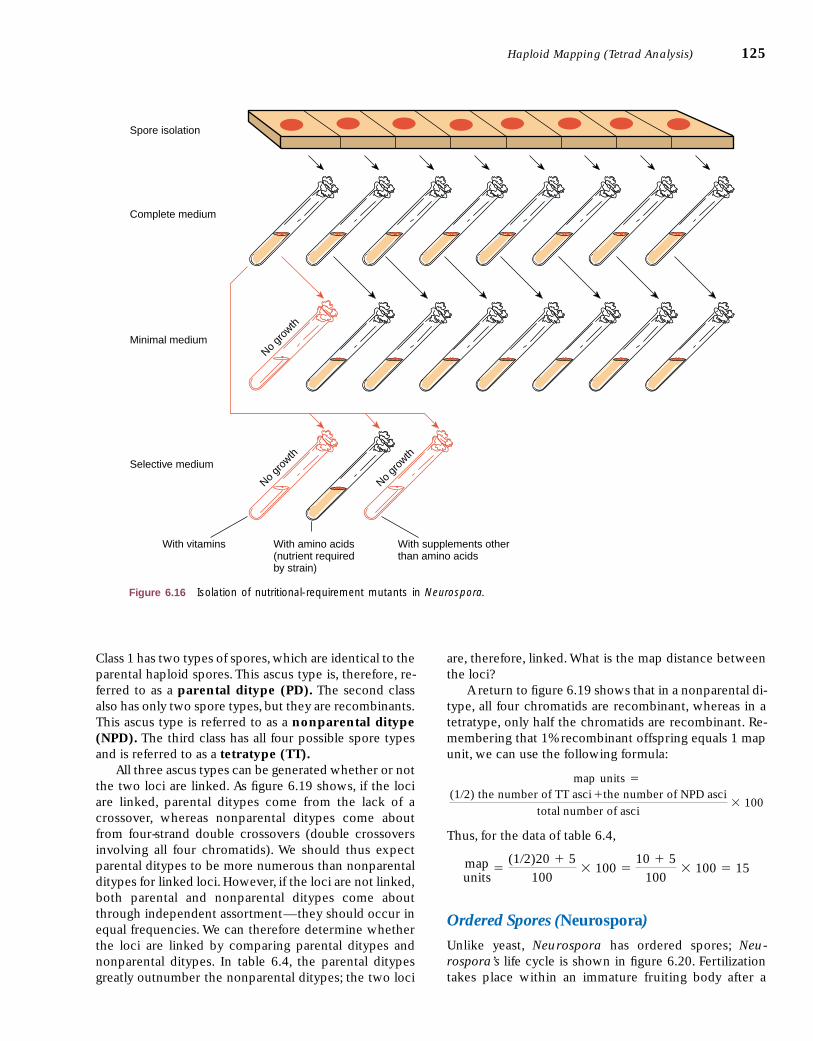
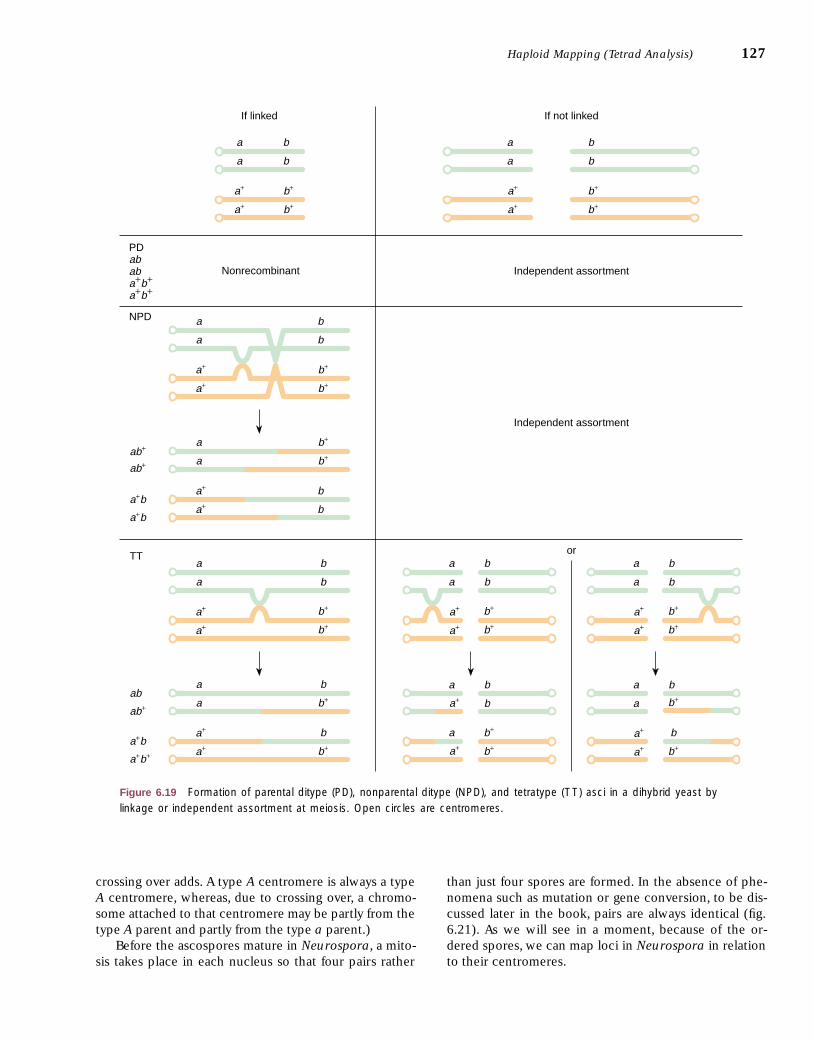
Class 1 has two types of spores, which are identical to theparental haploid spores. This ascus type is, therefore, re-ferred to as a parental ditype (PD). The second classalso has only two spore types, but they are recombinants.This ascus type is referred to as a nonparental ditype(NPD). The third class has all four possible spore typesand is referred to as a tetratype (TT).
All three ascus types can be generated whether or notthe two loci are linked. As figure 6.19 shows, if the lociare linked, parental ditypes come from the lack of acrossover, whereas nonparental ditypes come aboutfrom four-strand double crossovers (double crossoversinvolving all four chromatids). We should thus expectparental ditypes to be more numerous than nonparentalditypes for linked loci. However, if the loci are not linked,both parental and nonparental ditypes come aboutthrough independent assortment—they should occur inequal frequencies. We can therefore determine whetherthe loci are linked by comparing parental ditypes andnonparental ditypes. In table 6.4, the parental ditypesgreatly outnumber the nonparental ditypes; the two loci
are, therefore, linked. What is the map distance betweenthe loci?
A return to figure 6.19 shows that in a nonparental di-type, all four chromatids are recombinant, whereas in atetratype, only half the chromatids are recombinant. Re-membering that 1% recombinant offspring equals 1 mapunit, we can use the following formula:
map units �
Thus, for the data of table 6.4,
Ordered Spores (Neurospora)
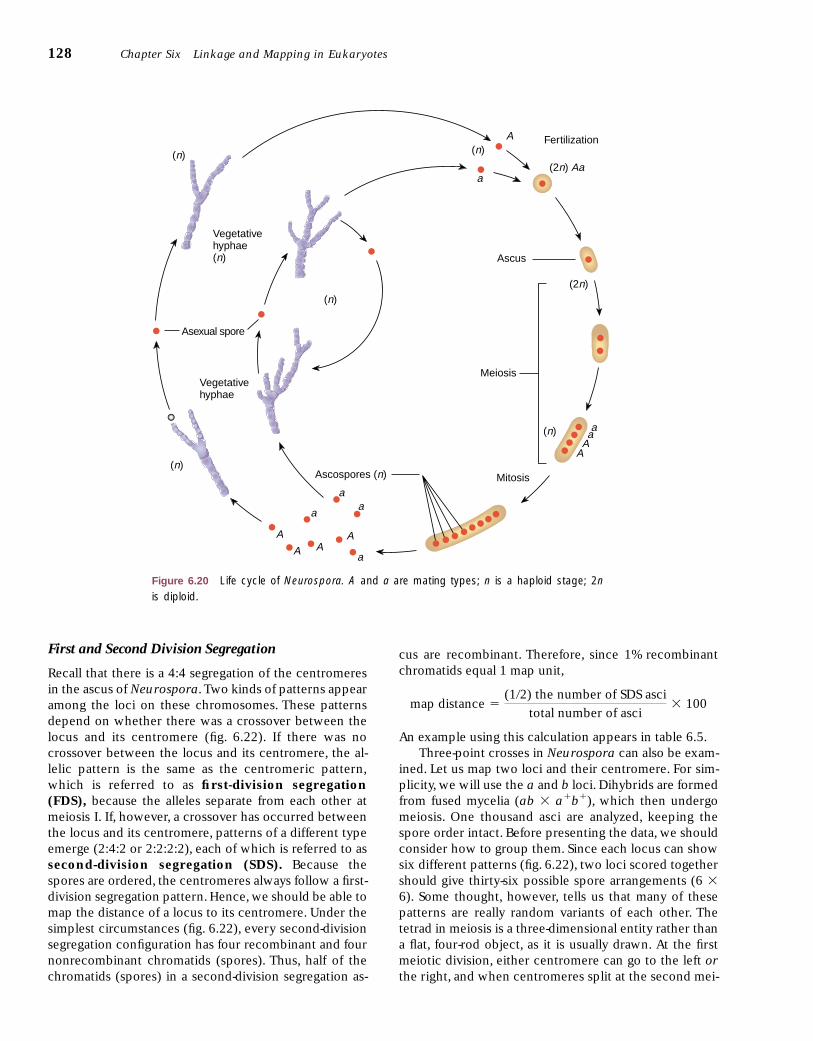
Unlike yeast, Neurospora has ordered spores; Neu-rospora’s life cycle is shown in figure 6.20. Fertilizationtakes place within an immature fruiting body after a
mapunits
�(1�2)20 � 5
100� 100 �
10 � 5
100� 100 � 15
(1�2) the number of TT asci �the number of NPD asci
total number of asci� 100
Haploid Mapping (Tetrad Analysis) 125
Spore isolation
Complete medium
Minimal medium
Selective medium
With vitamins With supplements otherthan amino acids
With amino acids(nutrient requiredby strain)
No gr
owth
No gr
owth
No gr
owth
Figure 6.16 Isolation of nutritional-requirement mutants in Neurospora.
spore or filament of one mating type contacts a specialfilament extending from the fruiting body of the oppo-site mating type (mating types are referred to as A and a).The zygote’s nucleus undergoes meiosis without any in-tervening mitosis. Unlike yeast, Neurospora does nothave a diploid phase in its life cycle. Rather, it undergoesmeiosis immediately after the diploid nuclei form.
Since the Neurospora ascus is narrow, the meioticspindle is forced to lie along the cell’s long axis. The twonuclei then undergo the second meiotic division, which isalso oriented along the long axis of the ascus.The result isthat the spores are ordered according to their cen-tromeres (fig. 6.21).That is, if we label one centromere Aand the other a, for the two mating types, a tetrad at meio-sis I will consist of one A and one a centromere. At theend of meiosis in Neurospora, the four ascospores are inthe order A A a a or a a A A in regard to centromeres. (Wetalk more simply of centromeres rather than chromo-somes or chromatids because of the complications that
126 Chapter Six Linkage and Mapping in Eukaryotes
Table 6.4 The Three Ascus Types in YeastResulting from Meiosis in a Dihybrid,aa�bb�
1 2 3(PD) (NPD) (TT)
ab ab� ab
ab ab� ab�
a�b� a�b a�b
a�b� a�b a�b�
75 5 20
OCitrulline
Enzyme 3Gene 3
Step 3
NH Arginine
H
Ornithine
Enzyme 2Gene 2
Step 2
Precursor
Enzyme 1Gene 1
Step 1
H NH
H NH
H NH
HN C C C C COH
H
H
H
H
HHH H
HN C
HN C C C C C
H
H
H
HHH H
C
HN C C C C C
H
H
H
HHH H
H
HN
O
OH
O
OH
O
Ascus (n)
Meiosis
"Bud"
Vegetativereproduction
Fertilization a / α (2n)
a
αα
α (n) colonya(n) colony
Spores or gametes
a
Figure 6.17 Arginine biosynthetic pathway of Neurospora.
Figure 6.18 Life cycle of yeast. Mature cells are mating typesa or �; n is the haploid stage; 2n is diploid.
crossing over adds. A type A centromere is always a typeA centromere, whereas, due to crossing over, a chromo-some attached to that centromere may be partly from thetype A parent and partly from the type a parent.)
Before the ascospores mature in Neurospora, a mito-sis takes place in each nucleus so that four pairs rather
than just four spores are formed. In the absence of phe-nomena such as mutation or gene conversion, to be dis-cussed later in the book, pairs are always identical (fig.6.21). As we will see in a moment, because of the or-dered spores, we can map loci in Neurospora in relationto their centromeres.
Haploid Mapping (Tetrad Analysis) 127
If linked If not linked
Independent assortment
Independent assortment
or
a+
a b
a
a
a
b
b
b
a
a
b
b
b+
a+
a+
a
a
b+
a+
a+
a+
b+
b+
b
b
b+
a
a
a
a
b
b
a b
b
a
a
b
a
a
b
b
b
a
a
b
b
a+
a+
a+
a+
a+
a
a+
a+
a+
b+
b+
b+
b+
b+
b+
a+
a+
b+
b+
a+
a+
b
b+
b+b+
b
b+
b+
a+ b+
a+ b+
PDababa+b+
a+b+
Nonrecombinant
NPD
ab+
TT
ab+
a+b
ab+
ab
a+b
a+b+
a+b
Figure 6.19 Formation of parental ditype (PD), nonparental ditype (NPD), and tetratype (TT) asci in a dihybrid yeast bylinkage or independent assortment at meiosis. Open circles are centromeres.
128 Chapter Six Linkage and Mapping in Eukaryotes
Vegetativehyphae(n)
(n) (n)
Asexual spore
(n)
Vegetativehyphae
Ascospores (n) Mitosis
Meiosis
Ascus
(2n)
(2n) Aa
Fertilization
a
A
a
A
A AA
aa
a
(n) aa
AA
(n)
Figure 6.20 Life cycle of Neurospora. A and a are mating types; n is a haploid stage; 2nis diploid.
cus are recombinant. Therefore, since 1% recombinantchromatids equal 1 map unit,
An example using this calculation appears in table 6.5.Three-point crosses in Neurospora can also be exam-
ined. Let us map two loci and their centromere. For sim-plicity, we will use the a and b loci. Dihybrids are formedfrom fused mycelia (ab � a�b�), which then undergomeiosis. One thousand asci are analyzed, keeping thespore order intact. Before presenting the data, we shouldconsider how to group them. Since each locus can showsix different patterns (fig. 6.22), two loci scored togethershould give thirty-six possible spore arrangements (6 �6). Some thought, however, tells us that many of thesepatterns are really random variants of each other. Thetetrad in meiosis is a three-dimensional entity rather thana flat, four-rod object, as it is usually drawn. At the firstmeiotic division, either centromere can go to the left orthe right, and when centromeres split at the second mei-
map distance �(1�2) the number of SDS asci
total number of asci� 100
First and Second Division Segregation
Recall that there is a 4:4 segregation of the centromeresin the ascus of Neurospora. Two kinds of patterns appearamong the loci on these chromosomes. These patternsdepend on whether there was a crossover between thelocus and its centromere (fig. 6.22). If there was nocrossover between the locus and its centromere, the al-lelic pattern is the same as the centromeric pattern,which is referred to as first-division segregation(FDS), because the alleles separate from each other atmeiosis I. If, however, a crossover has occurred betweenthe locus and its centromere, patterns of a different typeemerge (2:4:2 or 2:2:2:2), each of which is referred to assecond-division segregation (SDS). Because thespores are ordered, the centromeres always follow a first-division segregation pattern. Hence, we should be able tomap the distance of a locus to its centromere. Under thesimplest circumstances (fig. 6.22), every second-divisionsegregation configuration has four recombinant and fournonrecombinant chromatids (spores). Thus, half of thechromatids (spores) in a second-division segregation as-
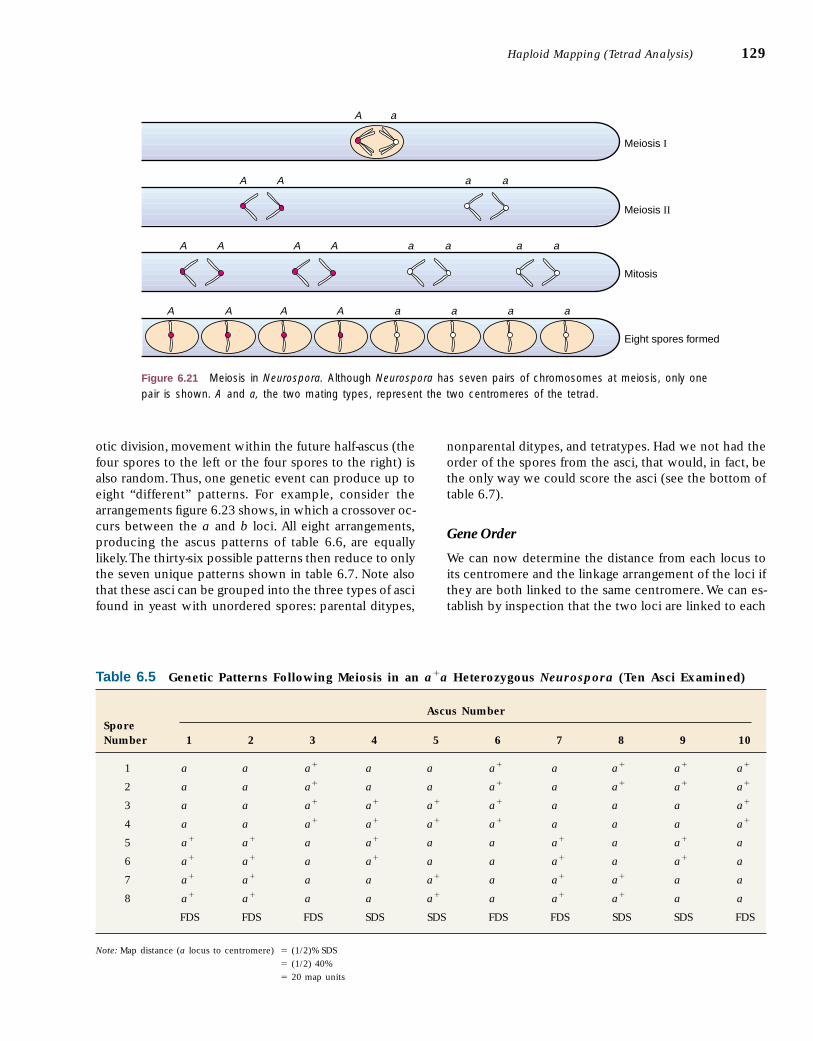
otic division, movement within the future half-ascus (thefour spores to the left or the four spores to the right) isalso random. Thus, one genetic event can produce up toeight “different” patterns. For example, consider thearrangements figure 6.23 shows, in which a crossover oc-curs between the a and b loci. All eight arrangements,producing the ascus patterns of table 6.6, are equallylikely.The thirty-six possible patterns then reduce to onlythe seven unique patterns shown in table 6.7. Note alsothat these asci can be grouped into the three types of ascifound in yeast with unordered spores: parental ditypes,
nonparental ditypes, and tetratypes. Had we not had theorder of the spores from the asci, that would, in fact, bethe only way we could score the asci (see the bottom oftable 6.7).
Gene Order
We can now determine the distance from each locus toits centromere and the linkage arrangement of the loci ifthey are both linked to the same centromere. We can es-tablish by inspection that the two loci are linked to each
Haploid Mapping (Tetrad Analysis) 129
Eight spores formed
Mitosis
Meiosis II
Meiosis I
A a
A A a a
A A A A a a a a
A A A A a a a a
Figure 6.21 Meiosis in Neurospora. Although Neurospora has seven pairs of chromosomes at meiosis, only onepair is shown. A and a, the two mating types, represent the two centromeres of the tetrad.
Table 6.5 Genetic Patterns Following Meiosis in an a�a Heterozygous Neurospora (Ten Asci Examined)
Ascus NumberSporeNumber 1 2 3 4 5 6 7 8 9 10
1 a a a� a a a� a a� a� a�
2 a a a� a a a� a a� a� a�
3 a a a� a� a� a� a a a a�
4 a a a� a� a� a� a a a a�
5 a� a� a a� a a a� a a� a
6 a� a� a a� a a a� a a� a
7 a� a� a a a� a a� a� a a
8 a� a� a a a� a a� a� a a
FDS FDS FDS SDS SDS FDS FDS SDS SDS FDS
Note: Map distance (a locus to centromere) � (1/2)% SDS
� (1/2) 40%
� 20 map units
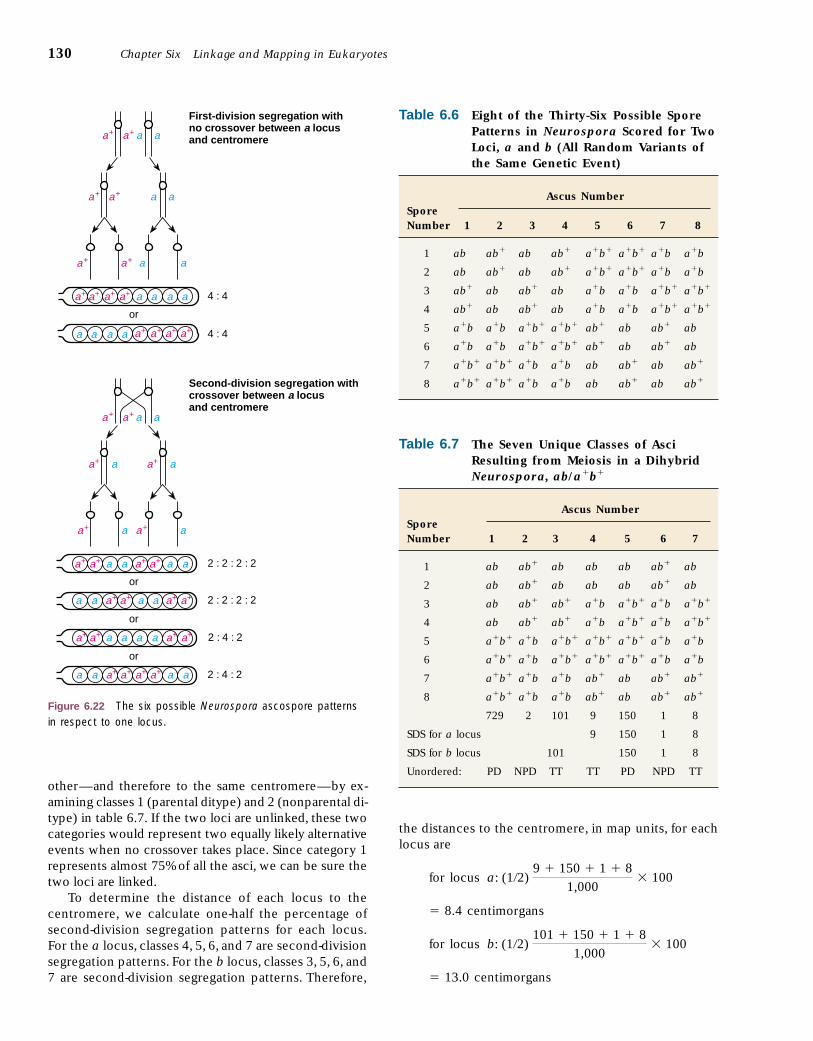
other—and therefore to the same centromere—by ex-amining classes 1 (parental ditype) and 2 (nonparental di-type) in table 6.7. If the two loci are unlinked, these twocategories would represent two equally likely alternativeevents when no crossover takes place. Since category 1represents almost 75% of all the asci, we can be sure thetwo loci are linked.
To determine the distance of each locus to the centromere, we calculate one-half the percentage ofsecond-division segregation patterns for each locus.For the a locus, classes 4, 5, 6, and 7 are second-divisionsegregation patterns. For the b locus, classes 3, 5, 6, and7 are second-division segregation patterns. Therefore,
the distances to the centromere, in map units, for eachlocus are
for locus
� 8.4 centimorgans
for locus
� 13.0 centimorgans
b: (1�2) 101 � 150 � 1 � 8
1,000� 100
a: (1�2) 9 � 150 � 1 � 8
1,000� 100
130 Chapter Six Linkage and Mapping in Eukaryotes
Table 6.6 Eight of the Thirty-Six Possible SporePatterns in Neurospora Scored for TwoLoci, a and b (All Random Variants ofthe Same Genetic Event)
Ascus NumberSporeNumber 1 2 3 4 5 6 7 8
1 ab ab� ab ab� a�b� a�b� a�b a�b
2 ab ab� ab ab� a�b� a�b� a�b a�b
3 ab� ab ab� ab a�b a�b a�b� a�b�
4 ab� ab ab� ab a�b a�b a�b� a�b�
5 a�b a�b a�b� a�b� ab� ab ab� ab
6 a�b a�b a�b� a�b� ab� ab ab� ab
7 a�b� a�b� a�b a�b ab ab� ab ab�
8 a�b� a�b� a�b a�b ab ab� ab ab�
a a
a a a a
a a a+ a+ a a a+ a+
a+ a+ a+ a+
a+ a+
a+ a+
a+ a+ a+ a+ a a a a
or
First-division segregation withno crossover between a locusand centromere
a+ a+ a a a+ a+ a a
or
Second-division segregation withcrossover between a locusand centromere
a a
a a
a a
or
or
a+ a+ a a a a a+ a+
a a a+ a+ a+ a+ a a
a+ a+
a+ a+
a+ a
a+ a
a+ a
a+ a
4 : 4
4 : 4
2 : 2 : 2 : 2
2 : 2 : 2 : 2
2 : 4 : 2
2 : 4 : 2
Figure 6.22 The six possible Neurospora ascospore patternsin respect to one locus.
Table 6.7 The Seven Unique Classes of AsciResulting from Meiosis in a DihybridNeurospora, ab/a�b�
Ascus NumberSporeNumber 1 2 3 4 5 6 7
1 ab ab� ab ab ab ab� ab
2 ab ab� ab ab ab ab� ab
3 ab ab� ab� a�b a�b� a�b a�b�
4 ab ab� ab� a�b a�b� a�b a�b�
5 a�b� a�b a�b� a�b� a�b� a�b a�b
6 a�b� a�b a�b� a�b� a�b� a�b a�b
7 a�b� a�b a�b ab� ab ab� ab�
8 a�b� a�b a�b ab� ab ab� ab�
729 2 101 9 150 1 8
SDS for a locus 9 150 1 8
SDS for b locus 101 150 1 8
Unordered: PD NPD TT TT PD NPD TT
It should now be possible to describe exactly what typeof crossover event produced each of the seven classes intable 6.7.
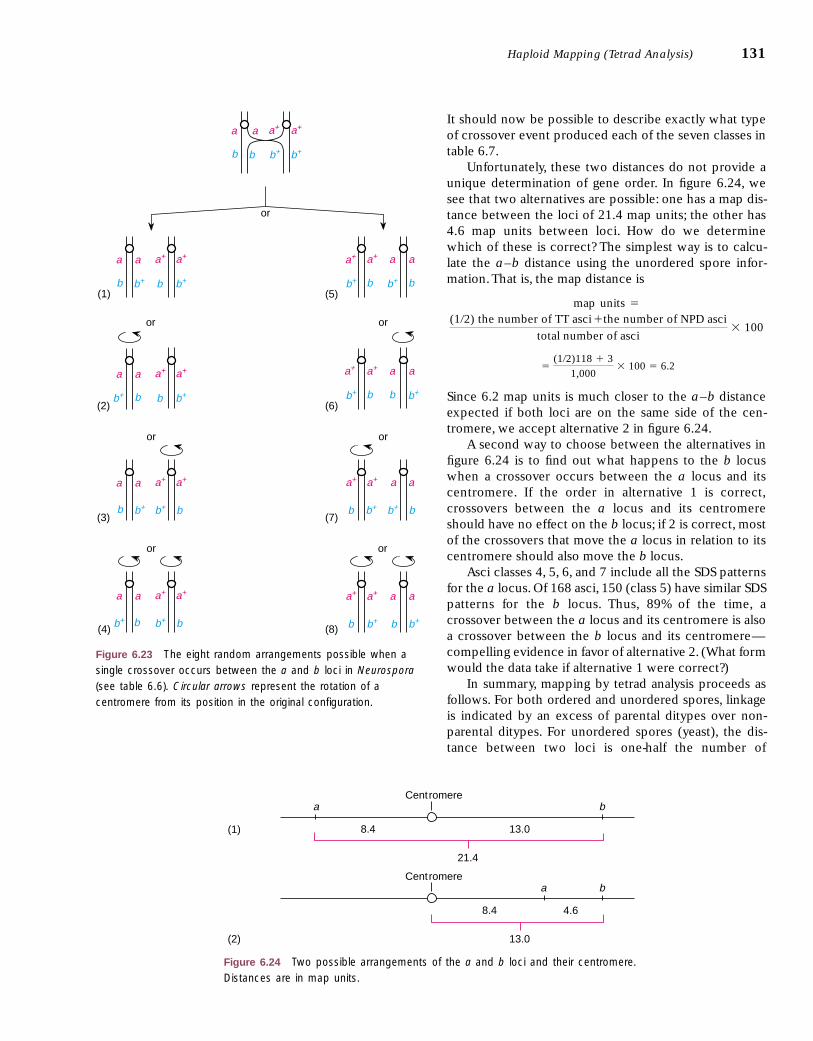
Unfortunately, these two distances do not provide aunique determination of gene order. In figure 6.24, wesee that two alternatives are possible: one has a map dis-tance between the loci of 21.4 map units; the other has4.6 map units between loci. How do we determinewhich of these is correct? The simplest way is to calcu-late the a–b distance using the unordered spore infor-mation.That is, the map distance is
map units �
Since 6.2 map units is much closer to the a–b distanceexpected if both loci are on the same side of the cen-tromere, we accept alternative 2 in figure 6.24.
A second way to choose between the alternatives infigure 6.24 is to find out what happens to the b locuswhen a crossover occurs between the a locus and itscentromere. If the order in alternative 1 is correct,crossovers between the a locus and its centromereshould have no effect on the b locus; if 2 is correct, mostof the crossovers that move the a locus in relation to itscentromere should also move the b locus.
Asci classes 4, 5, 6, and 7 include all the SDS patternsfor the a locus. Of 168 asci, 150 (class 5) have similar SDSpatterns for the b locus. Thus, 89% of the time, acrossover between the a locus and its centromere is alsoa crossover between the b locus and its centromere—
compelling evidence in favor of alternative 2. (What formwould the data take if alternative 1 were correct?)
In summary, mapping by tetrad analysis proceeds asfollows. For both ordered and unordered spores, linkageis indicated by an excess of parental ditypes over non-parental ditypes. For unordered spores (yeast), the dis-tance between two loci is one-half the number of
�(1�2)118 � 3
1,000� 100 � 6.2
(1�2) the number of TT asci �the number of NPD asci
total number of asci� 100
Haploid Mapping (Tetrad Analysis) 131
b+
a
or
(1)
(2)
(3)
(4)
or
or
or
(5)
(6)
(7)
(8)
or
or
or
a+ a+
b b b+ b+
a a+ a+
b+ b b b+
a+ a a
b+ b
a
a a+ a+
b b b+
a
a+
bb+
a a
b+ b
a+
bb+
a+
a a+ a+a
b+ b b b+
a+ a+
b b+
a a
b b+
a a+ a+a
b+ b b b+
a+ a+
b b+
a a
b b+
a
Figure 6.23 The eight random arrangements possible when asingle crossover occurs between the a and b loci in Neurospora(see table 6.6). Circular arrows represent the rotation of acentromere from its position in the original configuration.
Centromereb
8.4
13.0 (2)
a
Centromerea b
8.4 13.0 (1)
21.4
4.6
Figure 6.24 Two possible arrangements of the a and b loci and their centromere.Distances are in map units.
tetratypes plus the number of nonparental ditypes, all di-vided by the total number of asci, expressed as a percent-age. For ordered spores (Neurospora), the distance from alocus to its centromere is one-half the percentage of second-division segregants. Mapping the distance betweentwo loci is similar to the process in unordered spores.
S O M AT I C ( M I T O T I C )C R O S S I N G O V E R
Crossing over is known to occur in somatic cells as wellas during meiosis. It apparently occurs when two homol-ogous chromatids come to lie next to each other andbreakage and reunion follow, most likely as a conse-quence of DNA repair (see chapter 12). Unlike in meio-sis, no synaptonemal complex forms. The occurrence ofmitotic crossing over is relatively rare. In the fungus As-pergillus nidulans, mitotic crossing over occurs aboutonce in every one hundred cell divisions.
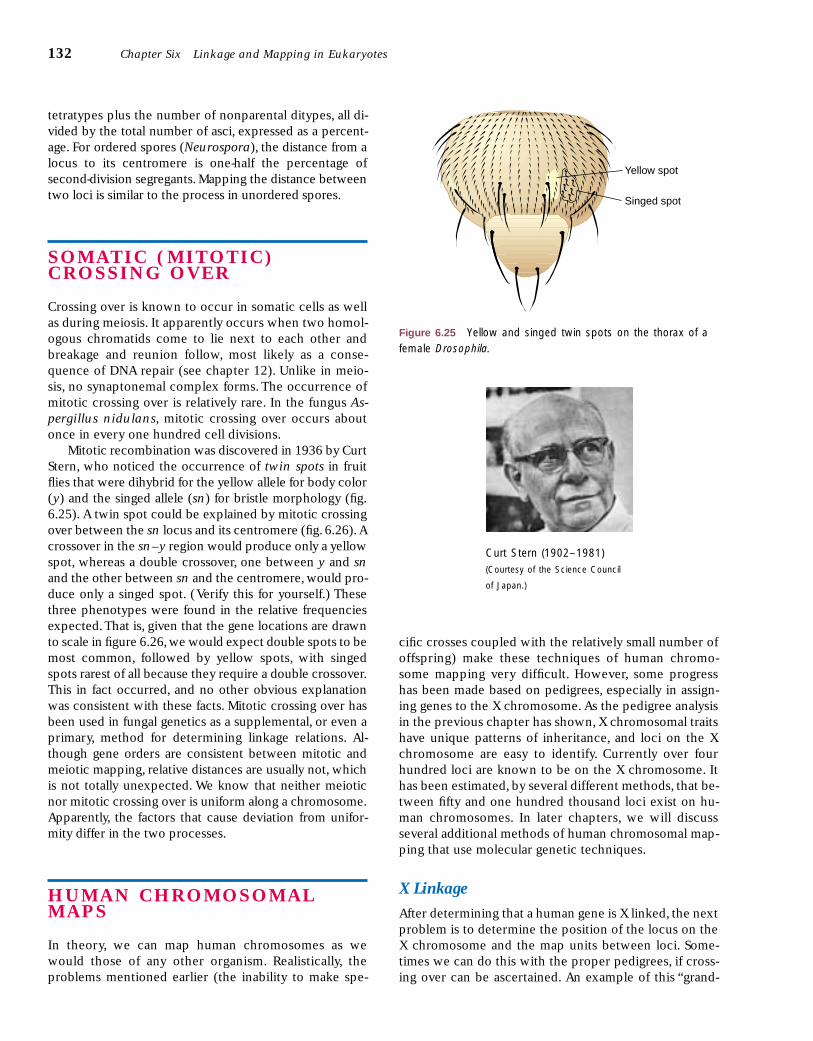
Mitotic recombination was discovered in 1936 by CurtStern, who noticed the occurrence of twin spots in fruitflies that were dihybrid for the yellow allele for body color(y) and the singed allele (sn) for bristle morphology (fig.6.25). A twin spot could be explained by mitotic crossingover between the sn locus and its centromere (fig. 6.26). Acrossover in the sn–y region would produce only a yellowspot, whereas a double crossover, one between y and snand the other between sn and the centromere, would pro-duce only a singed spot. (Verify this for yourself.) Thesethree phenotypes were found in the relative frequenciesexpected.That is, given that the gene locations are drawnto scale in figure 6.26,we would expect double spots to bemost common, followed by yellow spots, with singedspots rarest of all because they require a double crossover.This in fact occurred, and no other obvious explanationwas consistent with these facts. Mitotic crossing over hasbeen used in fungal genetics as a supplemental, or even aprimary, method for determining linkage relations. Al-though gene orders are consistent between mitotic andmeiotic mapping, relative distances are usually not, whichis not totally unexpected. We know that neither meioticnor mitotic crossing over is uniform along a chromosome.Apparently, the factors that cause deviation from unifor-mity differ in the two processes.
H U M A N C H R O M O S O M A LM A P S
In theory, we can map human chromosomes as wewould those of any other organism. Realistically, theproblems mentioned earlier (the inability to make spe-
cific crosses coupled with the relatively small number ofoffspring) make these techniques of human chromo-some mapping very difficult. However, some progresshas been made based on pedigrees, especially in assign-ing genes to the X chromosome. As the pedigree analysisin the previous chapter has shown, X chromosomal traitshave unique patterns of inheritance, and loci on the Xchromosome are easy to identify. Currently over fourhundred loci are known to be on the X chromosome. Ithas been estimated, by several different methods, that be-tween fifty and one hundred thousand loci exist on hu-man chromosomes. In later chapters, we will discussseveral additional methods of human chromosomal map-ping that use molecular genetic techniques.
X Linkage
After determining that a human gene is X linked, the nextproblem is to determine the position of the locus on theX chromosome and the map units between loci. Some-times we can do this with the proper pedigrees, if cross-ing over can be ascertained. An example of this “grand-
132 Chapter Six Linkage and Mapping in Eukaryotes
Yellow spot
Singed spot
Figure 6.25 Yellow and singed twin spots on the thorax of afemale Drosophila.
Curt Stern (1902–1981)(Courtesy of the Science Council
of Japan.)
sn+ y
sn y+
sn+ y
Dihybrid at prophase(mitosis)
Crossover
No crossover
sn y+
sn+
y+
sn+
sn
sn+
sn+
sn
y
y
y+
y+
sn
sn+
sn
y
y
y+
y
sn+ yYellow-spotcell
Singed-spotcell
sn+
y+
sn
sn+
sn
y
y
y+
sn+ y
sn y+
sn+ y
sn y+
Wild- type cells
sn
sn y+
y+
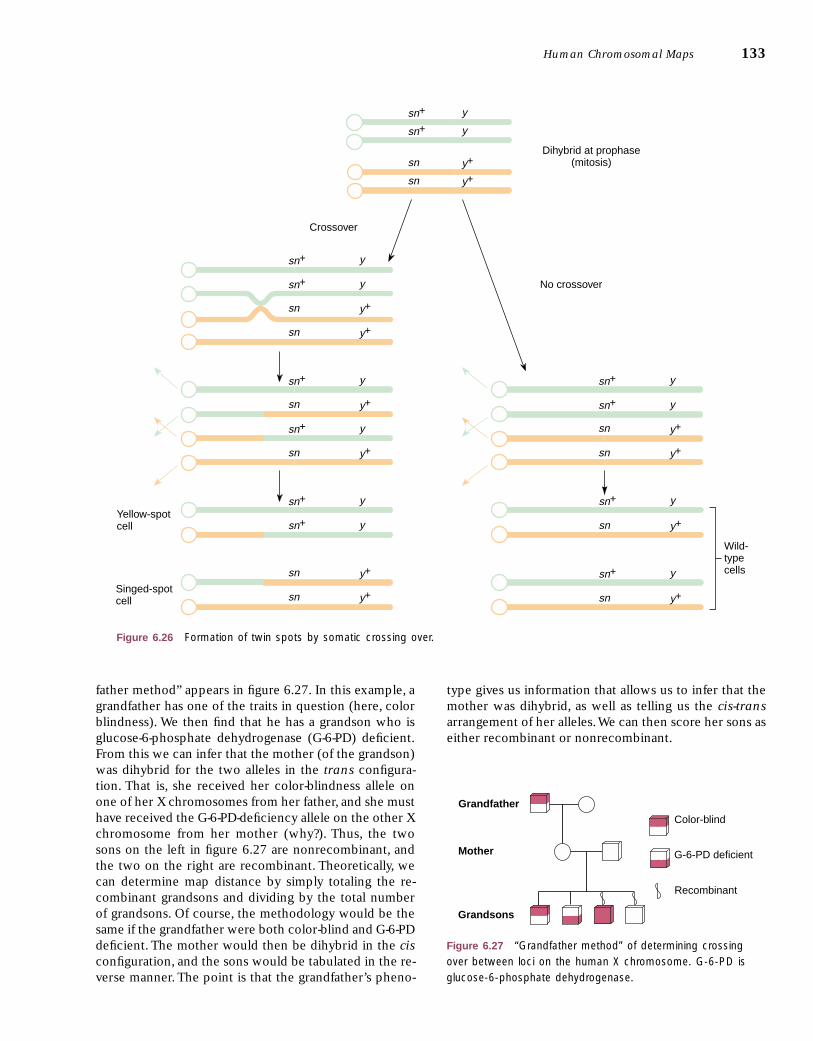
Figure 6.26 Formation of twin spots by somatic crossing over.
father method” appears in figure 6.27. In this example, agrandfather has one of the traits in question (here, colorblindness). We then find that he has a grandson who isglucose-6-phosphate dehydrogenase (G-6-PD) deficient.From this we can infer that the mother (of the grandson)was dihybrid for the two alleles in the trans configura-tion. That is, she received her color-blindness allele onone of her X chromosomes from her father, and she musthave received the G-6-PD-deficiency allele on the other Xchromosome from her mother (why?). Thus, the twosons on the left in figure 6.27 are nonrecombinant, andthe two on the right are recombinant. Theoretically, wecan determine map distance by simply totaling the re-combinant grandsons and dividing by the total numberof grandsons. Of course, the methodology would be thesame if the grandfather were both color-blind and G-6-PDdeficient. The mother would then be dihybrid in the cisconfiguration, and the sons would be tabulated in the re-verse manner. The point is that the grandfather’s pheno-
Human Chromosomal Maps 133
type gives us information that allows us to infer that themother was dihybrid, as well as telling us the cis-transarrangement of her alleles.We can then score her sons aseither recombinant or nonrecombinant.
Grandsons
Mother
GrandfatherColor-blind
G-6-PD deficient
Recombinant
Figure 6.27 “Grandfather method” of determining crossingover between loci on the human X chromosome. G-6-PD isglucose-6-phosphate dehydrogenase.
Autosomal Linkage
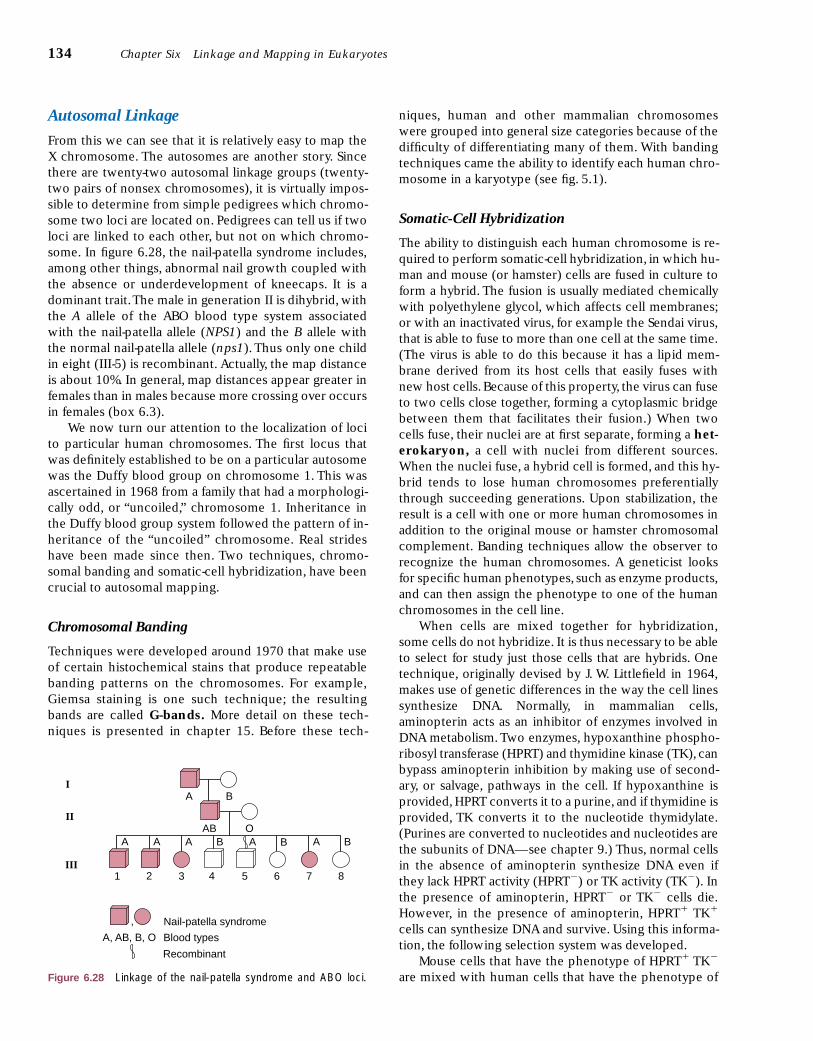
From this we can see that it is relatively easy to map theX chromosome. The autosomes are another story. Sincethere are twenty-two autosomal linkage groups (twenty-two pairs of nonsex chromosomes), it is virtually impos-sible to determine from simple pedigrees which chromo-some two loci are located on. Pedigrees can tell us if twoloci are linked to each other, but not on which chromo-some. In figure 6.28, the nail-patella syndrome includes,among other things, abnormal nail growth coupled withthe absence or underdevelopment of kneecaps. It is adominant trait.The male in generation II is dihybrid, withthe A allele of the ABO blood type system associatedwith the nail-patella allele (NPS1) and the B allele withthe normal nail-patella allele (nps1). Thus only one childin eight (III-5) is recombinant. Actually, the map distanceis about 10%. In general, map distances appear greater infemales than in males because more crossing over occursin females (box 6.3).
We now turn our attention to the localization of locito particular human chromosomes. The first locus thatwas definitely established to be on a particular autosomewas the Duffy blood group on chromosome 1. This wasascertained in 1968 from a family that had a morphologi-cally odd, or “uncoiled,” chromosome 1. Inheritance inthe Duffy blood group system followed the pattern of in-heritance of the “uncoiled” chromosome. Real strideshave been made since then. Two techniques, chromo-somal banding and somatic-cell hybridization, have beencrucial to autosomal mapping.
Chromosomal Banding
Techniques were developed around 1970 that make useof certain histochemical stains that produce repeatablebanding patterns on the chromosomes. For example,Giemsa staining is one such technique; the resultingbands are called G-bands. More detail on these tech-niques is presented in chapter 15. Before these tech-
niques, human and other mammalian chromosomeswere grouped into general size categories because of thedifficulty of differentiating many of them. With bandingtechniques came the ability to identify each human chro-mosome in a karyotype (see fig. 5.1).
Somatic-Cell Hybridization
The ability to distinguish each human chromosome is re-quired to perform somatic-cell hybridization, in which hu-man and mouse (or hamster) cells are fused in culture toform a hybrid. The fusion is usually mediated chemicallywith polyethylene glycol, which affects cell membranes;or with an inactivated virus, for example the Sendai virus,that is able to fuse to more than one cell at the same time.(The virus is able to do this because it has a lipid mem-brane derived from its host cells that easily fuses withnew host cells. Because of this property, the virus can fuseto two cells close together, forming a cytoplasmic bridgebetween them that facilitates their fusion.) When twocells fuse, their nuclei are at first separate, forming a het-erokaryon, a cell with nuclei from different sources.When the nuclei fuse, a hybrid cell is formed, and this hy-brid tends to lose human chromosomes preferentiallythrough succeeding generations. Upon stabilization, theresult is a cell with one or more human chromosomes inaddition to the original mouse or hamster chromosomalcomplement. Banding techniques allow the observer torecognize the human chromosomes. A geneticist looksfor specific human phenotypes, such as enzyme products,and can then assign the phenotype to one of the humanchromosomes in the cell line.
When cells are mixed together for hybridization,some cells do not hybridize. It is thus necessary to be ableto select for study just those cells that are hybrids. Onetechnique, originally devised by J. W. Littlefield in 1964,makes use of genetic differences in the way the cell linessynthesize DNA. Normally, in mammalian cells,aminopterin acts as an inhibitor of enzymes involved inDNA metabolism. Two enzymes, hypoxanthine phospho-ribosyl transferase (HPRT) and thymidine kinase (TK), canbypass aminopterin inhibition by making use of second-ary, or salvage, pathways in the cell. If hypoxanthine isprovided, HPRT converts it to a purine, and if thymidine isprovided, TK converts it to the nucleotide thymidylate.(Purines are converted to nucleotides and nucleotides arethe subunits of DNA—see chapter 9.) Thus, normal cellsin the absence of aminopterin synthesize DNA even ifthey lack HPRT activity (HPRT�) or TK activity (TK�). Inthe presence of aminopterin, HPRT� or TK� cells die.However, in the presence of aminopterin, HPRT� TK�
cells can synthesize DNA and survive. Using this informa-tion, the following selection system was developed.
Mouse cells that have the phenotype of HPRT� TK�
are mixed with human cells that have the phenotype of
134 Chapter Six Linkage and Mapping in Eukaryotes
A B
AB OA AA AA BB B
1 2 3 4 5 6 7 8
I
II
III
A, AB, B, O
Nail-patella syndrome
Blood types
Recombinant
,
Figure 6.28 Linkage of the nail-patella syndrome and ABO loci.
HPRT� TK� in the presence of Sendai virus or polyethyl-ene glycol. Fusion takes place in some of the cells, andthe mixture is grown in a medium containing hypoxan-thine, aminopterin, and thymidine (called HATmedium). In the presence of aminopterin, unfusedmouse cells (TK�) and unfused human cells (HPRT�)die. Hybrid cells, however, survive because they are
HPRT� TK�. Eventually, the hybrid cells end up with ran-dom numbers of human chromosomes. There is one re-striction: All cell lines selected are TK�.This HAT method(using the HAT medium) not only selects for hybridclones, but also localizes the TK gene to human chromo-some 17, the one human chromosome found in everysuccessful cell line.
Human Chromosomal Maps 135
Table 1 Lod Scores for theCross in Figure 6.28
Recombination
Frequency (Θ) Lod Score
0.05 0.9510.10 1.0880.125 1.0990.15 1.0900.20 1.0310.25 0.9320.30 0.8010.35 0.6430.40 0.4570.45 0.2440.50 0.000
Lod Scores
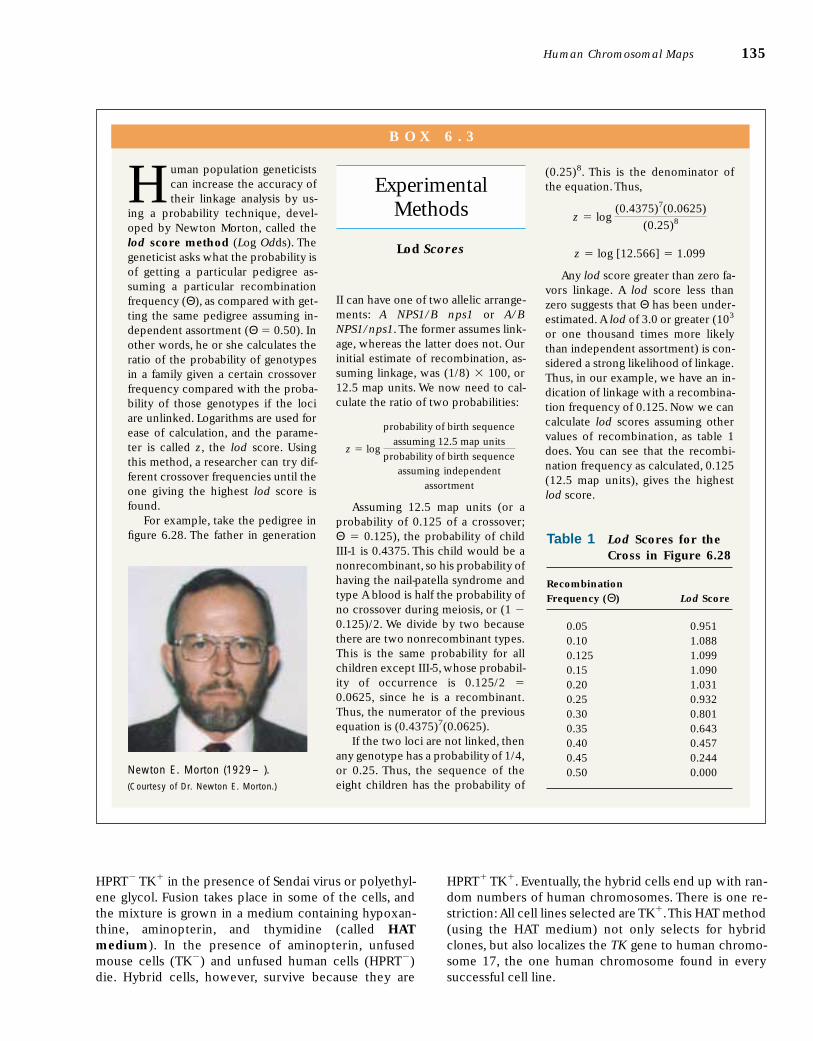
Experimental Methods
Human population geneticistscan increase the accuracy oftheir linkage analysis by us-
ing a probability technique, devel-oped by Newton Morton, called thelod score method (Log Odds). Thegeneticist asks what the probability isof getting a particular pedigree as-suming a particular recombinationfrequency (Θ), as compared with get-ting the same pedigree assuming in-dependent assortment (Θ � 0.50). Inother words, he or she calculates theratio of the probability of genotypesin a family given a certain crossoverfrequency compared with the proba-bility of those genotypes if the lociare unlinked. Logarithms are used forease of calculation, and the parame-ter is called z, the lod score. Usingthis method, a researcher can try dif-ferent crossover frequencies until theone giving the highest lod score isfound.
For example, take the pedigree infigure 6.28. The father in generation
II can have one of two allelic arrange-ments: A NPS1/B nps1 or A/BNPS1/nps1. The former assumes link-age, whereas the latter does not. Ourinitial estimate of recombination, as-suming linkage, was (1/8) � 100, or12.5 map units. We now need to cal-culate the ratio of two probabilities:
assuming independent
assortment
Assuming 12.5 map units (or aprobability of 0.125 of a crossover;Θ � 0.125), the probability of childIII-1 is 0.4375. This child would be anonrecombinant, so his probability ofhaving the nail-patella syndrome andtype A blood is half the probability ofno crossover during meiosis, or (1 �0.125)/2. We divide by two becausethere are two nonrecombinant types.This is the same probability for allchildren except III-5, whose probabil-ity of occurrence is 0.125/2 �0.0625, since he is a recombinant.Thus, the numerator of the previousequation is (0.4375)7(0.0625).
If the two loci are not linked, thenany genotype has a probability of 1/4,or 0.25. Thus, the sequence of theeight children has the probability of
z � log
probability of birth sequence
assuming 12.5 map units
probability of birth sequence
(0.25)8. This is the denominator ofthe equation.Thus,
Any lod score greater than zero fa-vors linkage. A lod score less thanzero suggests that Θ has been under-estimated. A lod of 3.0 or greater (103
or one thousand times more likelythan independent assortment) is con-sidered a strong likelihood of linkage.Thus, in our example, we have an in-dication of linkage with a recombina-tion frequency of 0.125. Now we cancalculate lod scores assuming othervalues of recombination, as table 1does. You can see that the recombi-nation frequency as calculated, 0.125(12.5 map units), gives the highestlod score.
z � log [12.566] � 1.099
z � log (0.4375)7(0.0625)
(0.25)8
B O X 6 . 3
Newton E. Morton (1929– ).(Courtesy of Dr. Newton E. Morton.)
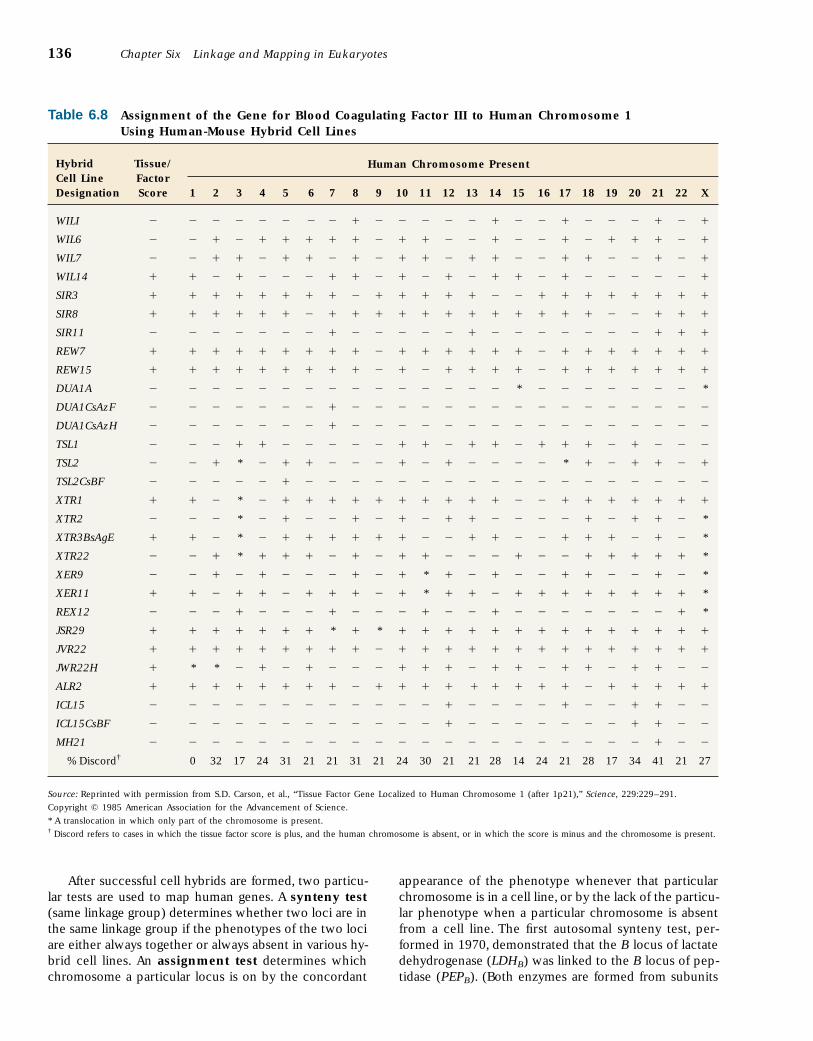
After successful cell hybrids are formed, two particu-lar tests are used to map human genes. A synteny test(same linkage group) determines whether two loci are inthe same linkage group if the phenotypes of the two lociare either always together or always absent in various hy-brid cell lines. An assignment test determines whichchromosome a particular locus is on by the concordant
appearance of the phenotype whenever that particularchromosome is in a cell line, or by the lack of the particu-lar phenotype when a particular chromosome is absentfrom a cell line. The first autosomal synteny test, per-formed in 1970, demonstrated that the B locus of lactatedehydrogenase (LDHB) was linked to the B locus of pep-tidase (PEPB). (Both enzymes are formed from subunits
136 Chapter Six Linkage and Mapping in Eukaryotes
Table 6.8 Assignment of the Gene for Blood Coagulating Factor III to Human Chromosome 1 Using Human-Mouse Hybrid Cell Lines
Hybrid Tissue/Cell Line FactorDesignation Score 1 2 3 4 5 6 7 8 9 10 11 12 13 14 15 16 17 18 19 20 21 22 X
WILI � � � � � � � � � � � � � � � � � � � � � � � �
WIL6 � � � � � � � � � � � � � � � � � � � � � � � �
WIL7 � � � � � � � � � � � � � � � � � � � � � � � �
WIL14 � � � � � � � � � � � � � � � � � � � � � � � �
SIR3 � � � � � � � � � � � � � � � � � � � � � � � �
SIR8 � � � � � � � � � � � � � � � � � � � � � � � �
SIR11 � � � � � � � � � � � � � � � � � � � � � � � �
REW7 � � � � � � � � � � � � � � � � � � � � � � � �
REW15 � � � � � � � � � � � � � � � � � � � � � � � �
DUA1A � � � � � � � � � � � � � � � * � � � � � � � *
DUA1CsAzF � � � � � � � � � � � � � � � � � � � � � � � �
DUA1CsAzH � � � � � � � � � � � � � � � � � � � � � � � �
TSL1 � � � � � � � � � � � � � � � � � � � � � � � �
TSL2 � � � * � � � � � � � � � � � � � * � � � � � �
TSL2CsBF � � � � � � � � � � � � � � � � � � � � � � � �
XTR1 � � � * � � � � � � � � � � � � � � � � � � � �
XTR2 � � � * � � � � � � � � � � � � � � � � � � � *
XTR3BsAgE � � � * � � � � � � � � � � � � � � � � � � � *
XTR22 � � � * � � � � � � � � � � � � � � � � � � � *
XER9 � � � � � � � � � � � * � � � � � � � � � � � *
XER11 � � � � � � � � � � � * � � � � � � � � � � � *
REX12 � � � � � � � � � � � � � � � � � � � � � � � *
JSR29 � � � � � � � * � * � � � � � � � � � � � � � �
JVR22 � � � � � � � � � � � � � � � � � � � � � � � �
JWR22H � * * � � � � � � � � � � � � � � � � � � � � �
ALR2 � � � � � � � � � � � � � � � � � � � � � � � �
ICL15 � � � � � � � � � � � � � � � � � � � � � � � �
ICL15CsBF � � � � � � � � � � � � � � � � � � � � � � � �
MH21 � � � � � � � � � � � � � � � � � � � � � � � �
% Discord† 0 32 17 24 31 21 21 31 21 24 30 21 21 28 14 24 21 28 17 34 41 21 27
Source: Reprinted with permission from S.D. Carson, et al., “Tissue Factor Gene Localized to Human Chromosome 1 (after 1p21),” Science, 229:229–291.
Copyright © 1985 American Association for the Advancement of Science.
* A translocation in which only part of the chromosome is present.† Discord refers to cases in which the tissue factor score is plus, and the human chromosome is absent, or in which the score is minus and the chromosome is present.
Human Chromosome Present
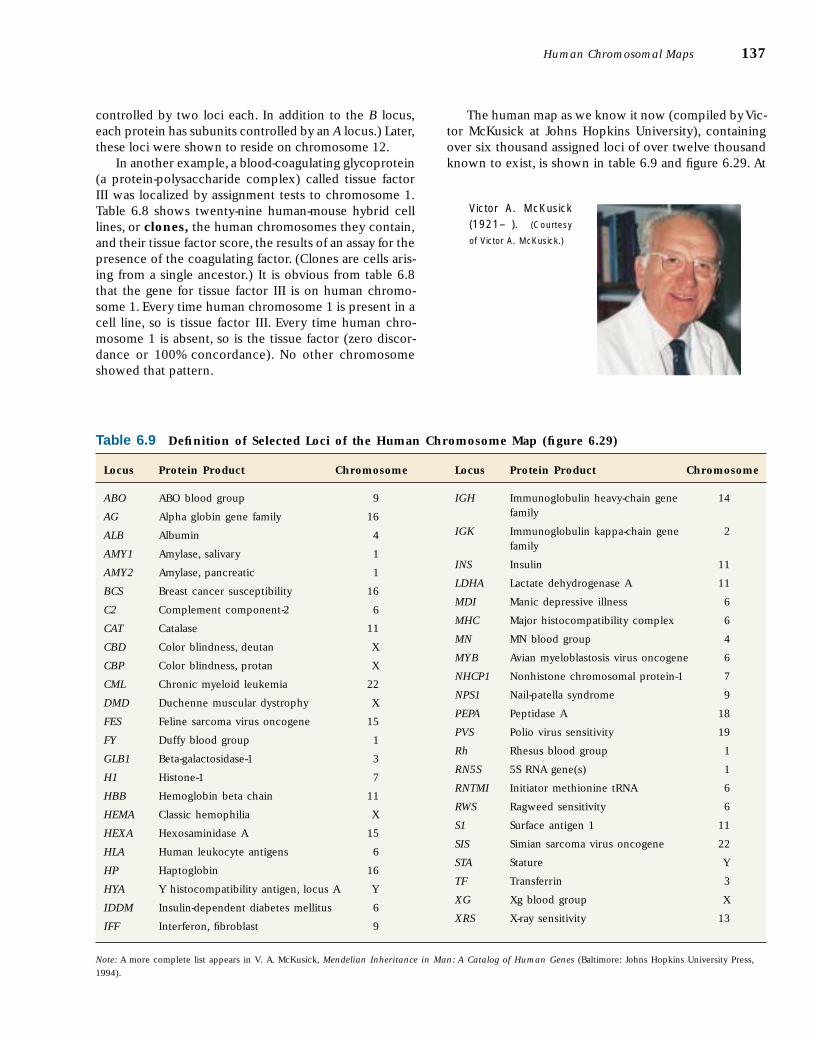
Human Chromosomal Maps 137
controlled by two loci each. In addition to the B locus,each protein has subunits controlled by an A locus.) Later,these loci were shown to reside on chromosome 12.
In another example, a blood-coagulating glycoprotein(a protein-polysaccharide complex) called tissue factorIII was localized by assignment tests to chromosome 1.Table 6.8 shows twenty-nine human-mouse hybrid celllines, or clones, the human chromosomes they contain,and their tissue factor score, the results of an assay for thepresence of the coagulating factor. (Clones are cells aris-ing from a single ancestor.) It is obvious from table 6.8that the gene for tissue factor III is on human chromo-some 1. Every time human chromosome 1 is present in acell line, so is tissue factor III. Every time human chro-mosome 1 is absent, so is the tissue factor (zero discor-dance or 100% concordance). No other chromosomeshowed that pattern.
The human map as we know it now (compiled by Vic-tor McKusick at Johns Hopkins University), containingover six thousand assigned loci of over twelve thousandknown to exist, is shown in table 6.9 and figure 6.29. At
Victor A. McKusick(1921– ). (Courtesy
of Victor A. McKusick.)
Locus Protein Product Chromosome
ABO ABO blood group 9
AG Alpha globin gene family 16
ALB Albumin 4
AMY1 Amylase, salivary 1
AMY2 Amylase, pancreatic 1
BCS Breast cancer susceptibility 16
C2 Complement component-2 6
CAT Catalase 11
CBD Color blindness, deutan X
CBP Color blindness, protan X
CML Chronic myeloid leukemia 22
DMD Duchenne muscular dystrophy X
FES Feline sarcoma virus oncogene 15
FY Duffy blood group 1
GLB1 Beta-galactosidase-1 3
H1 Histone-1 7
HBB Hemoglobin beta chain 11
HEMA Classic hemophilia X
HEXA Hexosaminidase A 15
HLA Human leukocyte antigens 6
HP Haptoglobin 16
HYA Y histocompatibility antigen, locus A Y
IDDM Insulin-dependent diabetes mellitus 6
IFF Interferon, fibroblast 9
Locus Protein Product Chromosome
IGH Immunoglobulin heavy-chain gene 14family
IGK Immunoglobulin kappa-chain gene 2family
INS Insulin 11
LDHA Lactate dehydrogenase A 11
MDI Manic depressive illness 6
MHC Major histocompatibility complex 6
MN MN blood group 4
MYB Avian myeloblastosis virus oncogene 6
NHCP1 Nonhistone chromosomal protein-1 7
NPS1 Nail-patella syndrome 9
PEPA Peptidase A 18
PVS Polio virus sensitivity 19
Rh Rhesus blood group 1
RN5S 5S RNA gene(s) 1
RNTMI Initiator methionine tRNA 6
RWS Ragweed sensitivity 6
S1 Surface antigen 1 11
SIS Simian sarcoma virus oncogene 22
STA Stature Y
TF Transferrin 3
XG Xg blood group X
XRS X-ray sensitivity 13
Note: A more complete list appears in V. A. McKusick, Mendelian Inheritance in Man: A Catalog of Human Genes (Baltimore: Johns Hopkins University Press,
1994).
Table 6.9 Definition of Selected Loci of the Human Chromosome Map (figure 6.29)
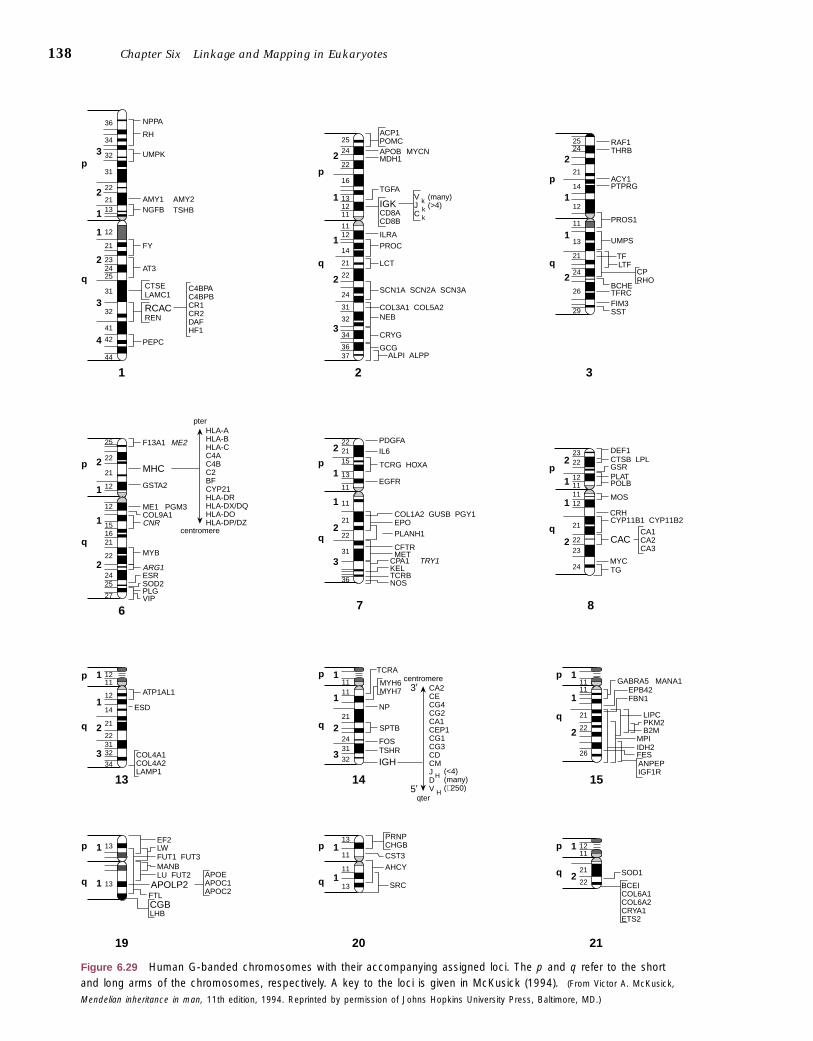
138 Chapter Six Linkage and Mapping in Eukaryotes
NPPA36
34
32
31
22
21
12
13
21
232425
31
32
41
42
44
RH
UMPK3
2
1
1
2
3
4
1
6
2
p
q
22
21
12
12
151621
22
2425
27
25 F13A1
pter
centromere
ME2
CNR
MYB
ARG1ESRSOD2PLGVIP
2
1
1
2
p
q
3
NGFB
FY
AT3
PEPC
CTSE C4BPAC4BPBCR1CR2DAFHF1
HLA-AHLA-BHLA-CC4AC4BC2BFCYP21HLA-DRHLA-DX/DQHLA-DOHLA-DP/DZ
LAMC1
RCACREN
AMY1 AMY2
MHC
7 8
222115
13
11
11
21
22
31
36
TCRG HOXA
EPO
CFTRMET
PLANH1
COL1A2 GUSB PGY1
CPA1 TRY1
NOS
KELTCRB
2
1
1
2
3
p
q
PDGFAIL6
EGFRGSTA2
ME1 PGM3COL9A1
TSHB
25
24
22
16
131211
1112
14
21
22
24
31
32
34
3637
2
1
p
1
2
3
q
ACP1POMCAPOB
TGFA
IGKCD8ACD8B
MDH1
ILRA
MYCN
V kJ kC k
(many)(>4)
PROC
2524
21
14
12
11
13
21
24
26
29
2
1
1
2
p
q
RAF1THRB
ACY1PTPRG
TFRCFIM3
PROS1
UMPS
BCHE
SST
TFLTF
CPRHO
CA1CA2CA3
LCT
SCN1A SCN2A SCN3A
COL3A1 COL5A2NEB
CRYG
GCGALPI ALPP
2322
12111112
21
22
23
24
DEF1
POLBPLAT
MOS
CYP11B1 CYP11B2
CAC
TG
CTSB LPLGSR
2
1
1
2
p
q
CRH
MYC
12
12
11ATP1AL1
SPTB
FOS
NP
TSHR
IGH
19
13
13EF2LW
MANBFUT1 FUT3
LU FUT2
1
1
p
20 21
13
11
13
11
PRNPCHGBCST3
AHCY
SRC
1
1
p
q qAPOLP2FTLCGBLHB
APOEAPOC1APOC2
COL4A1COL4A2LAMP1
MYH6MYH7
13
14
21
2231
34
32
1
1
2
3
p
q
ESD
centromere
qter
CA2CECG4CG2CA1CEP1CG1CG3CDCMJ HDV H
11
21
2431
32
11
TCRA
14
1
1
2
3
p
q
GABRA5 MANA1EPB42
LIPC
B2MMPIIDH2FESANPEPIGF1R
PKM2
FBN1
1111
21
22
26
15
1
1
2
p
q
SOD1
BCEICOL6A1COL6A2CRYA1ETS2
11
21
22
121
2
p
q
3′
5′
(<4)(many)(∼ 250)
Figure 6.29 Human G-banded chromosomes with their accompanying assigned loci. The p and q refer to the shortand long arms of the chromosomes, respectively. A key to the loci is given in McKusick (1994). (From Victor A. McKusick,
Mendelian inheritance in man, 11th edition, 1994. Reprinted by permission of Johns Hopkins University Press, Baltimore, MD.)
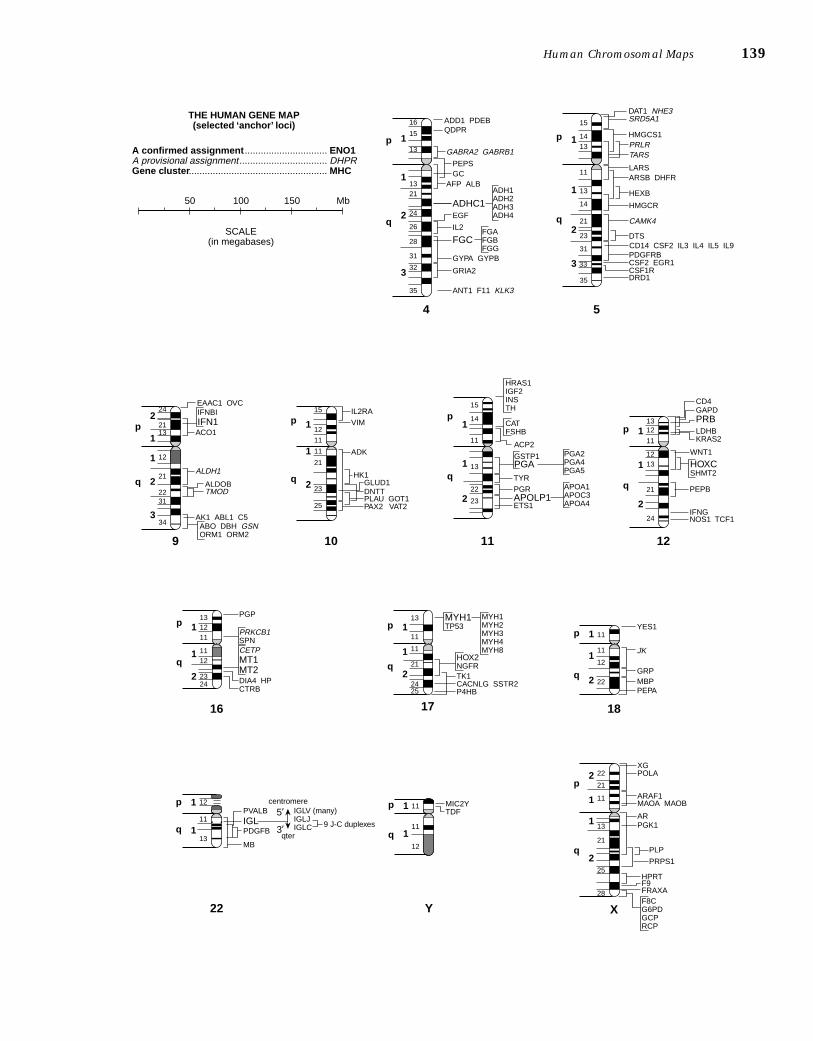
Human Chromosomal Maps 139
15
13
1321
24
26
28
31
32
35
16
GABRA2 GABRB1
PEPS
ADH1ADH2ADH3ADH4EGF
GC
ADHC1
IL2
FGC
GYPA GYPB
GRIA2
ANT1 F11 KLK3
AFP ALB
1
1
2
3
4
p
q
A confirmed assignmentA provisional assignmentGene cluster
50 100
SCALE(in megabases)
150 Mb
THE HUMAN GENE MAP(selected ‘anchor’ loci)
ENO1DHPRMHC
................................................................
....................................................
ADD1 PDEBQDPR
2113
12
21
2231
34
24
ACO1
ALDOBTMOD
ALDH1
AK1 ABL1 C5ABO DBH GSNORM1 ORM2
2
1
1
2
3
9
p
15
12
11
11
21
23
25
IL2RA
ADK
HK1
DNTTPLAU GOT1PAX2 VAT2
GLUD1
VIM1
1
2
10
p
15
14
11
13
22
23
TYR
HRAS1IGF2INSTH
CATFSHB
ACP2
GSTP1PGA
PGR
ETS1APOLP1
PGA2PGA4PGA5
APOA1APOC3APOA4
1
1
2
11
p
q
1312
1213
21
24
11
WNT1
CD4GAPD
LDHBKRAS2
PRB
PEPB
IFNGNOS1 TCF1
HOXCSHMT2
1
1
2
12
q
p
EAAC1 OVCIFNBIIFN1
15
1413
11
13
14
21
23
31
33
35
TARS
LARS
HMGCR
PDGFRBCSF2 EGR1
DRD1CSF1R
DTS
CAMK4
ARSB DHFR
HEXB
PRLR1
1
2
3
5
p
q
DAT1 NHE3SRD5A1
HMGCS1
FGAFGBFGG CD14 CSF2 IL3 IL4 IL5 IL9
131211
1112
2324
PGP
PRKCB1SPN
DIA4 HPCTRB
CETPMT1MT2
1
1
2
16
22
p 13
11
11
21
2425
MYH1TP53
MYH1MYH2MYH3MYH4MYH8
HOX2NGFRTK1CACNLG SSTR2P4HB
1
1
2
17
p11
11
12
22
YES1
JK
GRPMBP
XGPOLA
PEPA
1
1
2
18
p
22
21
11
13
21
25
28
2
1
1
2
X
p
q
qqq
PVALB
PDGFBIGL11
13
121
1
p
q
Y
11 MIC2YTDF
11
12
1
1
q
p
9 J-C duplexes
MB
centromere
qter
IGLV (many)IGLJIGLC
5′
3′
ARAF1MAOA MAOB
ARPGK1
PLP
PRPS1
HPRTF9FRAXAF8CG6PDGCPRCP
present, geneticists studying human chromosomes arehampered not by a lack of techniques but by a lack ofmarker loci. When a new locus is discovered, it is nowrelatively easy to assign it to its proper chromosome.
The problem still exists of determining exactly wherea particular locus belongs on a chromosome.This is facil-itated by developing particular cell lines with brokenchromosomes, so that parts are either missing or have
moved to other chromosomes. These processes revealnew linkage arrangements and make it possible to deter-mine the region in which a locus is situated on a particu-lar chromosome. In chapter 13, we describe additionaltechniques used to locate genes on human chromosomes,including a description of the Human Genome Project,the program that sequenced the entire human genome aswell as the genomes of other model organisms.
140 Chapter Six Linkage and Mapping in Eukaryotes
S U M M A R Y
STUDY OBJECTIVE 1: To learn about analytical tech-niques for locating the relative positions of genes onchromosomes in diploid eukaryotic organisms110–122
The principle of independent assortment is violated whenloci lie near each other on the same chromosome. Recom-bination between these loci results from the crossing overof chromosomes during meiosis. The amount of recombi-nation provides a measure of the distance between theseloci. One map unit (centimorgan) equals 1% recombinantgametes. Map units can be determined by testcrossing a di-hybrid and recording the percentage of recombinantoffspring. If three loci are used (a three-point cross), doublecrossovers will be revealed. A coefficient of coincidence,the ratio of observed to expected double crossovers, can becalculated to determine if one crossover changes the prob-ability that a second one will occur nearby.
A chiasma seen during prophase I of meiosis representsboth a physical and a genetic crossing over. This can bedemonstrated by using homologous chromosomes withmorphological distinctions.
Because of multiple crossovers, the measured percent-age recombination underestimates the true map distance,especially for loci relatively far apart; the best map esti-mates come from summing the distances between closelylinked loci. A mapping function can be used to translate ob-served map distances into more accurate ones.
STUDY OBJECTIVE 2: To learn about analytical tech-niques for locating the relative positions of genes onchromosomes in ascomycete fungi 122–132
Organisms that retain all the products of meiosis lend them-selves to chromosome mapping by haploid mapping(tetrad analysis). With unordered spores, such as in yeast,we use
map units �
Map units between a locus and its centromere in organ-isms with ordered spores, such as Neurospora, can be cal-culated as
Crossing over also occurs during mitosis, but at a much re-duced rate. Somatic (mitotic) crossing over can be used tomap loci.
STUDY OBJECTIVE 3: To learn about analytical tech-niques for locating the relative positions of genes on hu-man chromosomes 132–140
Human chromosomes can be mapped. Recombination dis-tances can be established by pedigrees, and loci can be at-tributed to specific chromosomes by synteny and assign-ment tests in hybrid cell lines.
map units �(1�2) the number of SDS asci
total number of asci� 100
(1�2) the number of TT asci � the number of NPD asci
total number or asci� 100
S O L V E D P R O B L E M S
PROBLEM 1: A homozygous claret (ca, claret eye color),curled (cu, upcurved wings), fluted ( fl, creased wings)fruit fly is crossed with a pure-breeding wild-type fly.TheF1 females are testcrossed with the following results:
fluted 4claret 173
curled 26fluted, claret 24fluted, curled 167claret, curled 6fluted, claret, curled 298wild-type 302
a. Are the loci linked?b. If so, give the gene order, map distances, and co-
efficient of coincidence.
Answer: The pattern of numbers among the eightoffspring classes is the pattern we are used to seeing forlinkage of three loci. We can tell from the two groups inlargest numbers (the nonrecombinants—fluted, claret,curled and wild-type) that the alleles are in the coupling(cis) arrangement. If we compare either of thenonrecombinant classes with either of the doublecrossover classes (fluted and claret, curled), we see thatthe fluted locus is in the center. For example, comparefluted, a double crossover offspring, with the wild-type, anonrecombinant; clearly, fluted has the odd pattern.Thusthe trihybrid female parent had the following arrange-ment of alleles:
ca fl cu
ca+ fl+ cu+
A crossover in the ca–fl region produces claret andfluted, curled offspring, and a crossover in the fl–cu re-gion produces fluted, claret and curled offspring. Count-ing the crossovers in each region, including the doublecrossovers in each, and then converting to percentages,yields a claret-to-fluted distance of 35.0 map units (173 �167 � 6 � 4) and a fluted-to-curled distance of 6.0 mapunits (26 � 24 � 6 � 4).We expect 0.35 � 0.06 � 1,000� 21 double crossovers, but we observed only 6 � 4 �10.Thus, the coefficient of coincidence is 10/21 � 0.48.
PROBLEM 2: The ad5 locus in Neurospora is a gene foran enzyme in the synthesis pathway for the DNA baseadenine. A wild-type strain (ad5�) is crossed with an adenine-requiring strain, ad5�. The diploid undergoesmeiosis, and one hundred asci are scored for their segre-gation patterns with the following results:
ad5� ad5� ad5� ad5� ad5� ad5� ad5� ad5� 40ad5� ad5� ad5� ad5� ad5� ad5� ad5� ad5� 46ad5� ad5� ad5� ad5� ad5� ad5� ad5� ad5� 5ad5� ad5� ad5� ad5� ad5� ad5� ad5� ad5� 3ad5� ad5� ad5� ad5� ad5� ad5� ad5� ad5� 4ad5� ad5� ad5� ad5� ad5� ad5� ad5� ad5� 2
What can you say about the linkage arrangements at thislocus?
Answer: You can see that 14 (5 � 3 � 4 � 2) asci are ofthe second-division segregation type (SDS) and 86 (40 �46) are of the first-division segregation type (FDS). Tomap the distance of the locus to its centromere, we di-vide the percentage of SDS types by 2: 14/100 � 14%; di-vided by 2 is 7%.Thus, the ad5 locus is 7 map units fromits centromere.
PROBLEM 3: In yeast, the his5 locus is a gene for an en-zyme in the synthesis pathway for the amino acid histi-dine, and the lys11 locus is a gene for an enzyme in thesynthesis pathway for the amino acid lysine. A haploidwild-type strain (his5� lys11�) is crossed with the dou-ble mutant (his5� lys11�). The diploid is allowed to un-dergo meiosis, and 100 asci are scored with the followingresults:
his5� lys11� his5� lys11� his5� lys11�
his5� lys11� his5� lys11� his5� lys11�
his5� lys11� his5� lys11� his5� lys11�
his5� lys11� his5� lys11� his5� lys11�
62 30 8
What is the linkage arrangement of these loci?
Answer: Of the 100 asci analyzed, 62 were parentalditypes (PD), 30 were tetratypes (TT), and 8 werenonparental ditypes (NPD). To map the distancebetween the two loci, we take the percentage of NPD(8%) plus half the percentage of TT (1/2 of 30 � 15%) �23% or 23 centimorgans between loci.
PROBLEM 4: A particular human enzyme is present onlyin clone B.The human chromosomes present in clones A,B, and C appear as pluses in the following table. Deter-mine the probable chromosomal location of the gene forthe enzyme.
Human Chromosome
Clone 1 2 3 4 5 6 7 8A � � � � � � � �
B � � � � � � � �
C � � � � � � � �
Answer: If a gene is located on a chromosome, the genemust be present in the clones with the chromosome (�).Chromosomes 1, 2, 5, 6 are present in B. If the gene inquestion were located on chromosome 1, the enzymeshould have been present in all three clones. A similar ar-gument holds for chromosome 2, in which the enzymeshould have been present in clones A and B, and so on forthe rest of the chromosomes.The only chromosome thatis unique to clone B is 6.Therefore, the gene is located onchromosome 6.
Solved Problems 141
142 Chapter Six Linkage and Mapping in Eukaryotes
E X E R C I S E S A N D P R O B L E M S*
DIPLOID MAPPING1. A homozygous groucho fly ( gro, bristles clumped
above the eyes) is crossed with a homozygous roughfly (ro, eye abnormality). The F1 females aretestcrossed, producing these offspring:
groucho 518rough 471groucho, rough 6wild-type 5
1,000
a. What is the linkage arrangement of these loci?b. What offspring would result if the F1 dihybrids
were crossed among themselves instead of beingtestcrossed?
2. A female fruit fly with abnormal eyes (abe) of abrown color (bis, bistre) is crossed with a wild-typemale. Her sons have abnormal, brown eyes; herdaughters are of the wild-type. When these F1 fliesare crossed among themselves, the following off-spring are produced:
Sons Daughters
abnormal, brown 219 197abnormal 43 45brown 37 35wild-type 201 223
What is the linkage arrangement of these loci?
3. In Drosophila, the loci inflated (if, small, inflatedwings) and warty (wa, abnormal eyes) are about 10map units apart on the X chromosome. Construct adata set that would allow you to determine this link-age arrangement. What differences would be in-volved if the loci were located on an autosome?
4. A geneticist crossed female fruit flies that were het-erozygous at three electrophoretic loci, each withfast and slow alleles, with males homozygous for theslow alleles.The three loci were got1 (glutamate ox-aloacetate transaminase-1), amy (alpha-amylase),and sdh (succinate dehydrogenase). The first 1,000offspring isolated had the following genotypes:Class 1 got s got s amy s amy s sdh s sdh s 441Class 2 got f got s amy f amy s sdh f sdh s 421Class 3 got f got s amy s amy s sdh s sdh s 11Class 4 got s got s amy f amy s sdh f sdh s 14Class 5 got f got s amy f amy s sdh s sdh s 58Class 6 got s got s amy s amy s sdh f sdh s 53Class 7 got f got s amy s amy s sdh f sdh s 1Class 8 got s got s amy f amy s sdh s sdh s 1
What are the linkage arrangements of these threeloci, including map units? If the three loci arelinked, what is the coefficient of coincidence?
5. The following three recessive markers are known inlab mice: h, hotfoot; o, obese; and wa, waved. A tri-hybrid of unknown origin is testcrossed, producingthe following offspring:
hotfoot, obese, waved 357hotfoot, obese 74waved 66obese 79wild-type 343hotfoot, waved 61obese, waved 11hotfoot 9
1,000
a. If the genes are linked, determine the relative or-der and the map distances between them.
b. What was the cis-trans allele arrangement in thetrihybrid parent?
c. Is there any crossover interference? If yes, howmuch?
6. The following three recessive genes are found incorn: bt1, brittle endosperm; gl17, glossy leaf; rgdl,ragged seedling. A trihybrid of unknown origin istestcrossed, producing the following offspring:
brittle, glossy, ragged 236brittle, glossy 241ragged 219glossy 23wild-type 224brittle, ragged 17glossy, ragged 21brittle 19
1,000
a. If the genes are linked, determine the relative or-der and map distances.
b. Reconstruct the chromosomes of the trihybrid.c. Is there any crossover interference? If yes, how
much?
7. In Drosophila, ancon (an, legs and wings short),spiny legs (sple, irregular leg hairs), and arctus ocu-lus (at, small narrow eyes) have the following link-age arrangement on chromosome 3:
an sple at
10.0 6.1
*Answers to selected exercises and problems are on page A-6.
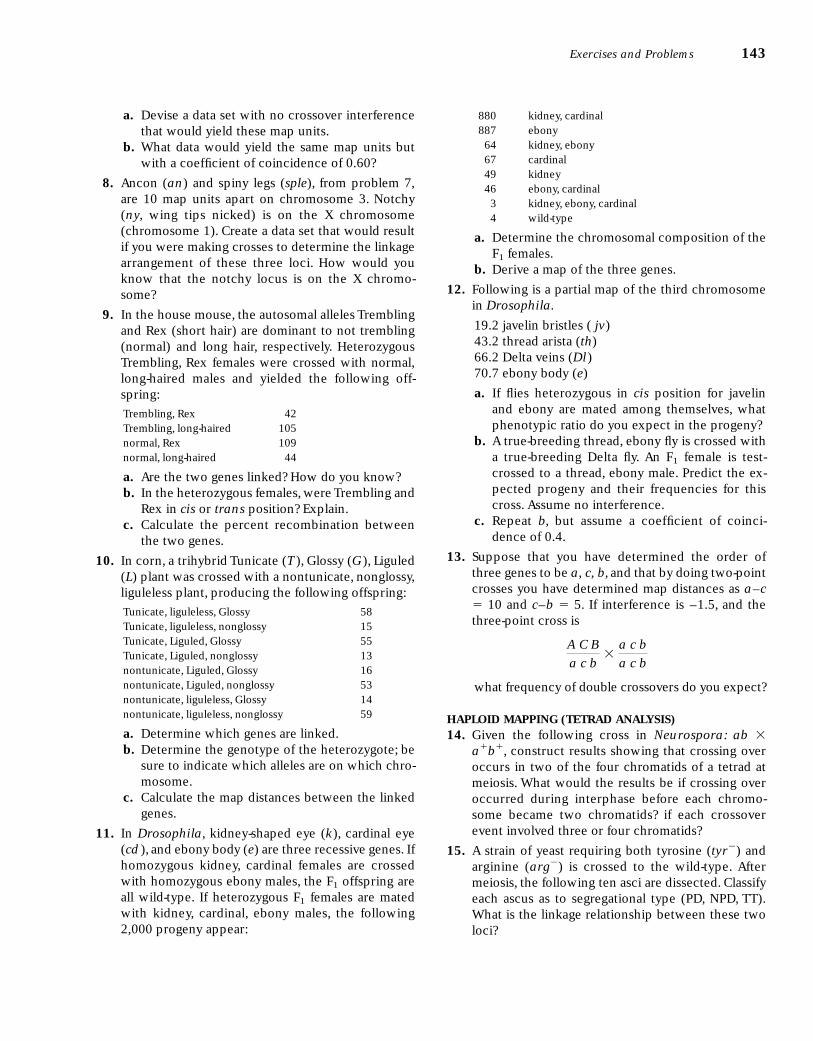
a. Devise a data set with no crossover interferencethat would yield these map units.
b. What data would yield the same map units butwith a coefficient of coincidence of 0.60?
8. Ancon (an) and spiny legs (sple), from problem 7,are 10 map units apart on chromosome 3. Notchy(ny, wing tips nicked) is on the X chromosome(chromosome 1). Create a data set that would resultif you were making crosses to determine the linkagearrangement of these three loci. How would youknow that the notchy locus is on the X chromo-some?
9. In the house mouse, the autosomal alleles Tremblingand Rex (short hair) are dominant to not trembling(normal) and long hair, respectively. HeterozygousTrembling, Rex females were crossed with normal,long-haired males and yielded the following off-spring:
Trembling, Rex 42Trembling, long-haired 105normal, Rex 109normal, long-haired 44
a. Are the two genes linked? How do you know?b. In the heterozygous females, were Trembling and
Rex in cis or trans position? Explain.c. Calculate the percent recombination between
the two genes.
10. In corn, a trihybrid Tunicate (T ), Glossy (G), Liguled(L) plant was crossed with a nontunicate, nonglossy,liguleless plant, producing the following offspring:
Tunicate, liguleless, Glossy 58Tunicate, liguleless, nonglossy 15Tunicate, Liguled, Glossy 55Tunicate, Liguled, nonglossy 13nontunicate, Liguled, Glossy 16nontunicate, Liguled, nonglossy 53nontunicate, liguleless, Glossy 14nontunicate, liguleless, nonglossy 59
a. Determine which genes are linked.b. Determine the genotype of the heterozygote; be
sure to indicate which alleles are on which chro-mosome.
c. Calculate the map distances between the linkedgenes.
11. In Drosophila, kidney-shaped eye (k), cardinal eye(cd ), and ebony body (e) are three recessive genes. Ifhomozygous kidney, cardinal females are crossedwith homozygous ebony males, the F1 offspring areall wild-type. If heterozygous F1 females are matedwith kidney, cardinal, ebony males, the following2,000 progeny appear:
880 kidney, cardinal887 ebony64 kidney, ebony67 cardinal49 kidney46 ebony, cardinal3 kidney, ebony, cardinal4 wild-type
a. Determine the chromosomal composition of theF1 females.
b. Derive a map of the three genes.
12. Following is a partial map of the third chromosomein Drosophila.
19.2 javelin bristles ( jv)43.2 thread arista (th)66.2 Delta veins (Dl)70.7 ebony body (e)
a. If flies heterozygous in cis position for javelinand ebony are mated among themselves, whatphenotypic ratio do you expect in the progeny?
b. A true-breeding thread, ebony fly is crossed witha true-breeding Delta fly. An F1 female is test-crossed to a thread, ebony male. Predict the ex-pected progeny and their frequencies for thiscross. Assume no interference.
c. Repeat b, but assume a coefficient of coinci-dence of 0.4.
13. Suppose that you have determined the order ofthree genes to be a, c, b, and that by doing two-pointcrosses you have determined map distances as a–c� 10 and c–b � 5. If interference is –1.5, and thethree-point cross is
what frequency of double crossovers do you expect?
HAPLOID MAPPING (TETRAD ANALYSIS)14. Given the following cross in Neurospora: ab �
a�b�, construct results showing that crossing overoccurs in two of the four chromatids of a tetrad atmeiosis. What would the results be if crossing overoccurred during interphase before each chromo-some became two chromatids? if each crossoverevent involved three or four chromatids?
15. A strain of yeast requiring both tyrosine (tyr�) andarginine (arg�) is crossed to the wild-type. Aftermeiosis, the following ten asci are dissected. Classifyeach ascus as to segregational type (PD, NPD, TT).What is the linkage relationship between these twoloci?
A C B
a c b�
a c b
a c b
Exercises and Problems 143
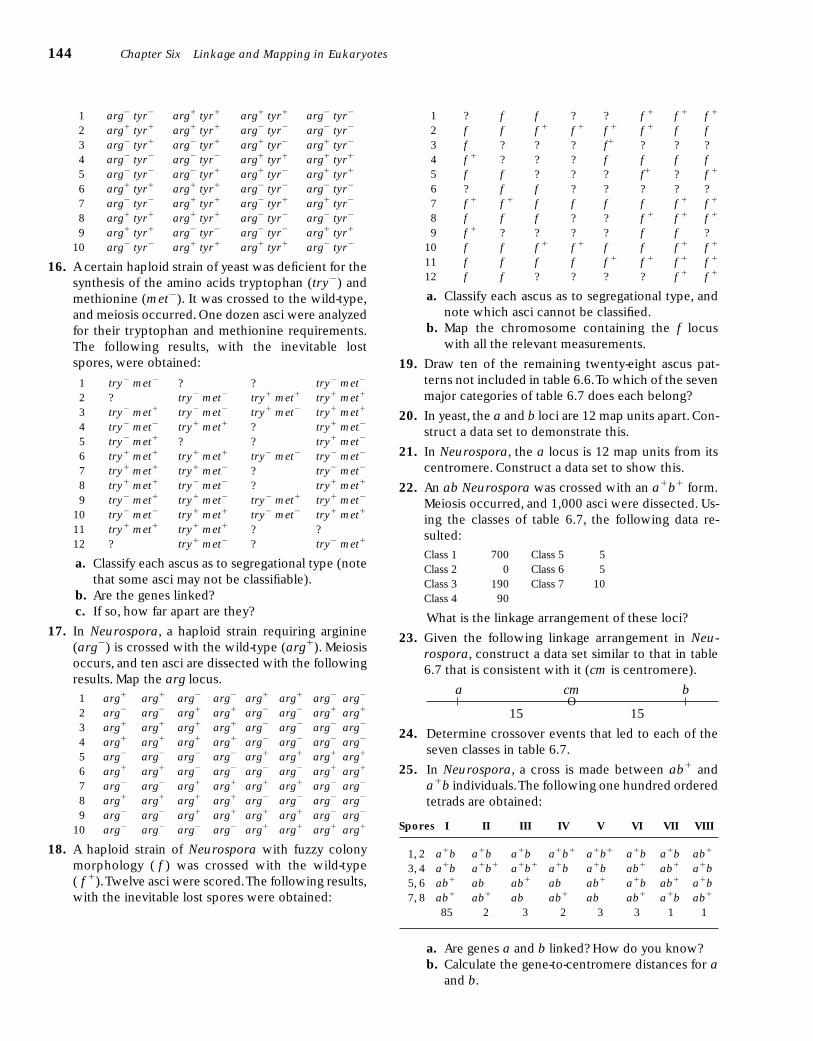
1 ? f f ? ? f � f � f �
2 f f f � f � f � f � f f3 f ? ? ? f� ? ? ?4 f � ? ? ? f f f f5 f f ? ? ? f� ? f �
6 ? f f ? ? ? ? ?7 f � f � f f f f f � f �
8 f f f ? ? f � f � f �
9 f � ? ? ? ? f f ?10 f f f � f � f f f � f �
11 f f f f f � f � f � f �
12 f f ? ? ? ? f � f �
a. Classify each ascus as to segregational type, andnote which asci cannot be classified.
b. Map the chromosome containing the f locuswith all the relevant measurements.
19. Draw ten of the remaining twenty-eight ascus pat-terns not included in table 6.6.To which of the sevenmajor categories of table 6.7 does each belong?
20. In yeast, the a and b loci are 12 map units apart. Con-struct a data set to demonstrate this.
21. In Neurospora, the a locus is 12 map units from itscentromere. Construct a data set to show this.
22. An ab Neurospora was crossed with an a�b� form.Meiosis occurred, and 1,000 asci were dissected. Us-ing the classes of table 6.7, the following data re-sulted:
Class 1 700 Class 5 5Class 2 0 Class 6 5Class 3 190 Class 7 10Class 4 90
What is the linkage arrangement of these loci?
23. Given the following linkage arrangement in Neu-rospora, construct a data set similar to that in table6.7 that is consistent with it (cm is centromere).
a cm b
15 15
24. Determine crossover events that led to each of theseven classes in table 6.7.
25. In Neurospora, a cross is made between ab� anda�b individuals.The following one hundred orderedtetrads are obtained:
Spores I II III IV V VI VII VIII
1, 2 a�b a�b a�b a�b� a�b� a�b a�b ab�
3, 4 a�b a�b� a�b� a�b a�b ab� ab� a�b5, 6 ab� ab ab� ab ab� a�b ab� a�b7, 8 ab� ab� ab ab� ab ab� a�b ab�
85 2 3 2 3 3 1 1
a. Are genes a and b linked? How do you know?b. Calculate the gene-to-centromere distances for a
and b.
1 arg� tyr� arg� tyr� arg� tyr� arg� tyr�
2 arg� tyr� arg� tyr� arg� tyr� arg� tyr�
3 arg� tyr� arg� tyr� arg� tyr� arg� tyr�
4 arg� tyr� arg� tyr� arg� tyr� arg� tyr�
5 arg� tyr� arg� tyr� arg� tyr� arg� tyr�
6 arg� tyr� arg� tyr� arg� tyr� arg� tyr�
7 arg� tyr� arg� tyr� arg� tyr� arg� tyr�
8 arg� tyr� arg� tyr� arg� tyr� arg� tyr�
9 arg� tyr� arg� tyr� arg� tyr� arg� tyr�
10 arg� tyr� arg� tyr� arg� tyr� arg� tyr�
16. A certain haploid strain of yeast was deficient for thesynthesis of the amino acids tryptophan (try�) andmethionine (met�). It was crossed to the wild-type,and meiosis occurred. One dozen asci were analyzedfor their tryptophan and methionine requirements.The following results, with the inevitable lostspores, were obtained:
1 try� met� ? ? try� met�
2 ? try� met� try� met� try� met�
3 try� met� try� met� try� met� try� met�
4 try� met� try� met� ? try� met�
5 try� met� ? ? try� met�
6 try� met� try� met� try� met� try� met�
7 try� met� try� met� ? try� met�
8 try� met� try� met� ? try� met�
9 try� met� try� met� try� met� try� met�
10 try� met� try� met� try� met� try� met�
11 try� met� try� met� ? ?12 ? try� met� ? try� met�
a. Classify each ascus as to segregational type (notethat some asci may not be classifiable).
b. Are the genes linked?c. If so, how far apart are they?
17. In Neurospora, a haploid strain requiring arginine(arg�) is crossed with the wild-type (arg�). Meiosisoccurs, and ten asci are dissected with the followingresults. Map the arg locus.
1 arg� arg� arg� arg� arg� arg� arg� arg�
2 arg� arg� arg� arg� arg� arg� arg� arg�
3 arg� arg� arg� arg� arg� arg� arg� arg�
4 arg� arg� arg� arg� arg� arg� arg� arg�
5 arg� arg� arg� arg� arg� arg� arg� arg�
6 arg� arg� arg� arg� arg� arg� arg� arg�
7 arg� arg� arg� arg� arg� arg� arg� arg�
8 arg� arg� arg� arg� arg� arg� arg� arg�
9 arg� arg� arg� arg� arg� arg� arg� arg�
10 arg� arg� arg� arg� arg� arg� arg� arg�
18. A haploid strain of Neurospora with fuzzy colonymorphology ( f ) was crossed with the wild-type( f �).Twelve asci were scored.The following results,with the inevitable lost spores were obtained:
144 Chapter Six Linkage and Mapping in Eukaryotes
O
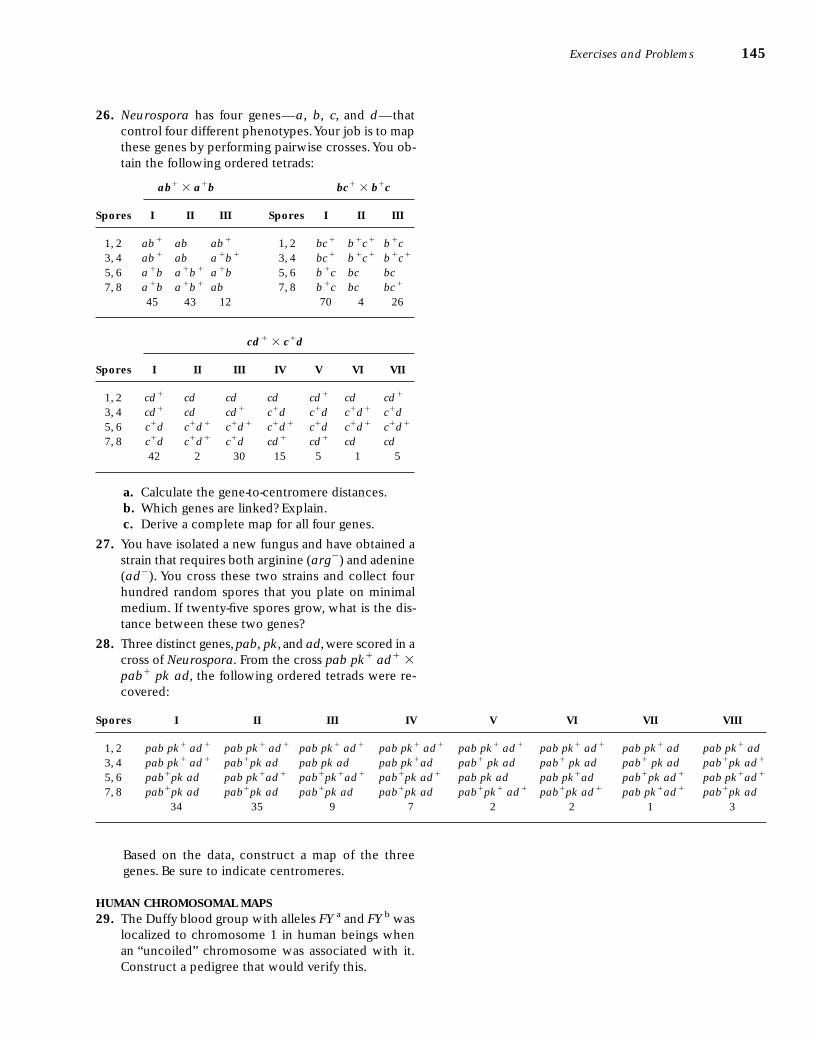
26. Neurospora has four genes—a, b, c, and d—thatcontrol four different phenotypes.Your job is to mapthese genes by performing pairwise crosses.You ob-tain the following ordered tetrads:
ab� � a�b bc� � b�c
Spores I II III Spores I II III
1, 2 ab� ab ab� 1, 2 bc� b�c� b�c3, 4 ab� ab a�b� 3, 4 bc� b�c� b�c�
5, 6 a�b a�b� a�b 5, 6 b�c bc bc7, 8 a�b a�b� ab 7, 8 b�c bc bc�
45 43 12 70 4 26
cd� � c�d
Spores I II III IV V VI VII
1, 2 cd� cd cd cd cd� cd cd�
3, 4 cd� cd cd� c�d c�d c�d� c�d5, 6 c�d c�d� c�d� c�d� c�d c�d� c�d�
7, 8 c�d c�d� c�d cd� cd� cd cd42 2 30 15 5 1 5
a. Calculate the gene-to-centromere distances.b. Which genes are linked? Explain.c. Derive a complete map for all four genes.
27. You have isolated a new fungus and have obtained astrain that requires both arginine (arg�) and adenine(ad�). You cross these two strains and collect fourhundred random spores that you plate on minimalmedium. If twenty-five spores grow, what is the dis-tance between these two genes?
28. Three distinct genes,pab, pk, and ad, were scored in across of Neurospora. From the cross pab pk� ad� �pab� pk ad, the following ordered tetrads were re-covered:
Based on the data, construct a map of the threegenes. Be sure to indicate centromeres.
HUMAN CHROMOSOMAL MAPS29. The Duffy blood group with alleles FY a and FY b was
localized to chromosome 1 in human beings whenan “uncoiled” chromosome was associated with it.Construct a pedigree that would verify this.
Exercises and Problems 145
Spores I II III IV V VI VII VIII
1, 2 pab pk� ad� pab pk� ad� pab pk� ad� pab pk� ad� pab pk� ad� pab pk� ad� pab pk� ad pab pk� ad3, 4 pab pk� ad� pab�pk ad pab pk ad pab pk�ad pab� pk ad pab� pk ad pab� pk ad pab�pk ad�
5, 6 pab�pk ad pab pk�ad� pab�pk�ad� pab�pk ad� pab pk ad pab pk�ad pab�pk ad� pab pk�ad�
7, 8 pab�pk ad pab�pk ad pab�pk ad pab�pk ad pab�pk� ad� pab�pk ad� pab pk�ad� pab�pk ad34 35 9 7 2 2 1 3
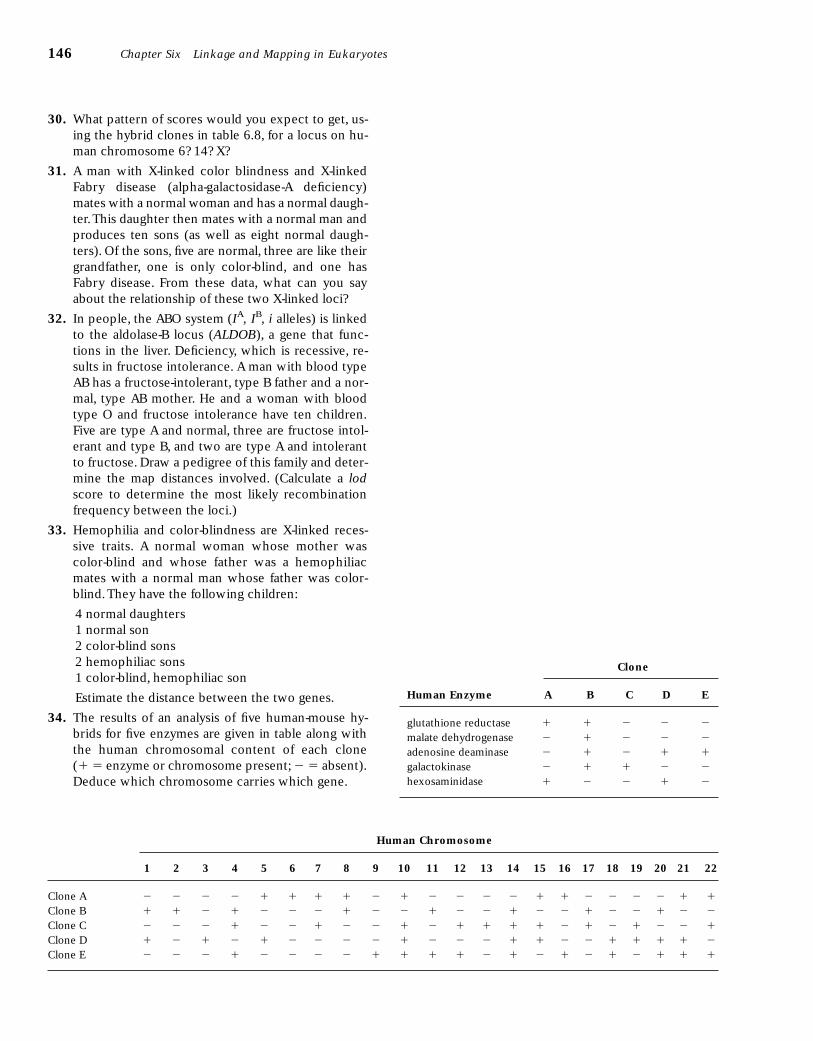
30. What pattern of scores would you expect to get, us-ing the hybrid clones in table 6.8, for a locus on hu-man chromosome 6? 14? X?
31. A man with X-linked color blindness and X-linkedFabry disease (alpha-galactosidase-A deficiency)mates with a normal woman and has a normal daugh-ter.This daughter then mates with a normal man andproduces ten sons (as well as eight normal daugh-ters). Of the sons, five are normal, three are like theirgrandfather, one is only color-blind, and one hasFabry disease. From these data, what can you sayabout the relationship of these two X-linked loci?
32. In people, the ABO system (IA, IB, i alleles) is linkedto the aldolase-B locus (ALDOB), a gene that func-tions in the liver. Deficiency, which is recessive, re-sults in fructose intolerance. A man with blood typeAB has a fructose-intolerant, type B father and a nor-mal, type AB mother. He and a woman with bloodtype O and fructose intolerance have ten children.Five are type A and normal, three are fructose intol-erant and type B, and two are type A and intolerantto fructose. Draw a pedigree of this family and deter-mine the map distances involved. (Calculate a lodscore to determine the most likely recombinationfrequency between the loci.)
33. Hemophilia and color-blindness are X-linked reces-sive traits. A normal woman whose mother wascolor-blind and whose father was a hemophiliacmates with a normal man whose father was color-blind.They have the following children:
4 normal daughters1 normal son2 color-blind sons2 hemophiliac sons1 color-blind, hemophiliac son
Estimate the distance between the two genes.
34. The results of an analysis of five human-mouse hy-brids for five enzymes are given in table along withthe human chromosomal content of each clone(� � enzyme or chromosome present; � � absent).Deduce which chromosome carries which gene.
Clone
Human Enzyme A B C D E
glutathione reductase � � � � �
malate dehydrogenase � � � � �
adenosine deaminase � � � � �
galactokinase � � � � �
hexosaminidase � � � � �
146 Chapter Six Linkage and Mapping in Eukaryotes
Human Chromosome
1 2 3 4 5 6 7 8 9 10 11 12 13 14 15 16 17 18 19 20 21 22
Clone A � � � � � � � � � � � � � � � � � � � � � �
Clone B � � � � � � � � � � � � � � � � � � � � � �
Clone C � � � � � � � � � � � � � � � � � � � � � �
Clone D � � � � � � � � � � � � � � � � � � � � � �
Clone E � � � � � � � � � � � � � � � � � � � � � �
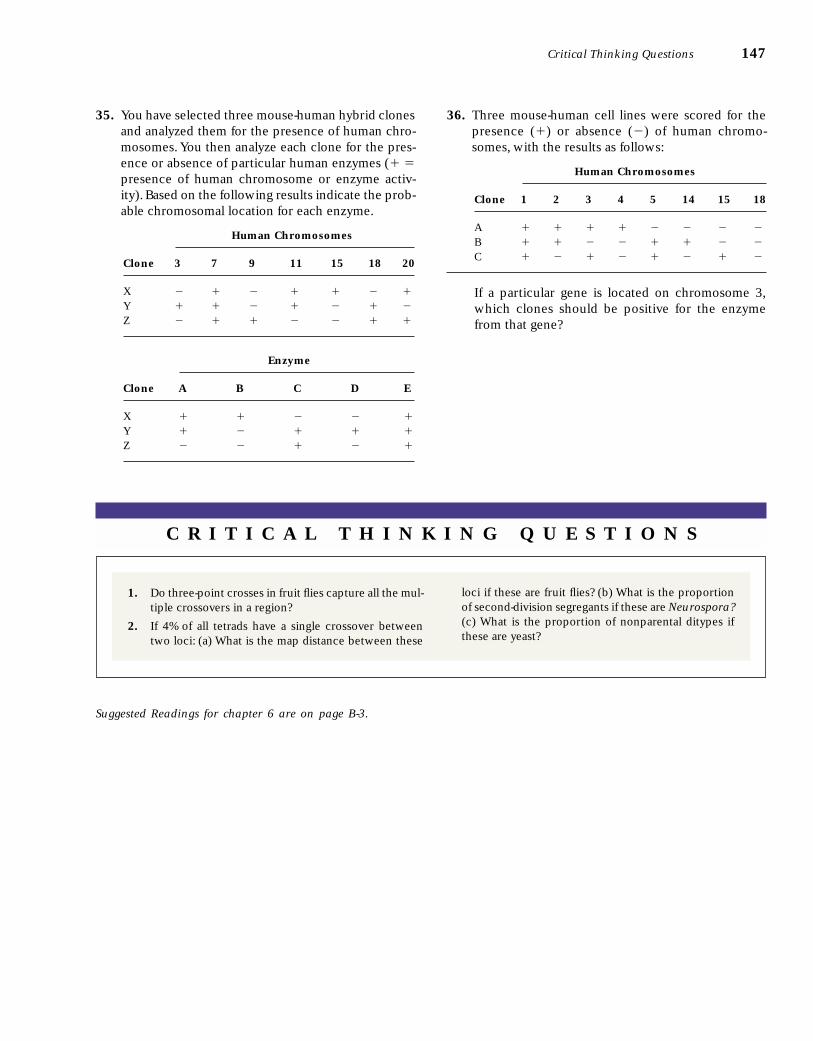
C R I T I C A L T H I N K I N G Q U E S T I O N S
1. Do three-point crosses in fruit flies capture all the mul-tiple crossovers in a region?
2. If 4% of all tetrads have a single crossover betweentwo loci: (a) What is the map distance between these
loci if these are fruit flies? (b) What is the proportionof second-division segregants if these are Neurospora?(c) What is the proportion of nonparental ditypes ifthese are yeast?
Suggested Readings for chapter 6 are on page B-3.
35. You have selected three mouse-human hybrid clonesand analyzed them for the presence of human chro-mosomes. You then analyze each clone for the pres-ence or absence of particular human enzymes (� �presence of human chromosome or enzyme activ-ity). Based on the following results indicate the prob-able chromosomal location for each enzyme.
Human Chromosomes
Clone 3 7 9 11 15 18 20
X � � � � � � �
Y � � � � � � �
Z � � � � � � �
Enzyme
Clone A B C D E
X � � � � �
Y � � � � �
Z � � � � �
36. Three mouse-human cell lines were scored for thepresence (�) or absence (�) of human chromo-somes, with the results as follows:
Human Chromosomes
Clone 1 2 3 4 5 14 15 18
A � � � � � � � �
B � � � � � � � �
C � � � � � � � �
If a particular gene is located on chromosome 3,which clones should be positive for the enzymefrom that gene?
Critical Thinking Questions 147