Embed Size (px)
Citation preview
F O R G I N G T H E L I N K 3-1
Low Impact Development (LID) represents one of the most progressive
trends in the area of stormwater management and water quality. This
approach involves utilizing strategies to control precipitation as close to
its source as possible in order to reduce runoff volumes, promote infiltration, and
protect water quality. While better known for its capacity to reduce pollution and
manage stormwater more sustainably, LID designs are also economically beneficial
and more cost-effective as compared to conventional stormwater controls.
In the vast majority of cases, the U.S. Environmental Protection Agency (EPA) has
found that implementing well-chosen LID practices saves money for developers,
property owners, and communities while also protecting and restoring water quality
(USEPA, 2007). Specifically, utilizing LID designs can result
in project cost savings by decreasing the amount of expen-
sive below ground drainage infrastructure required, as well
as reducing or eliminating the need for other stormwater
management-related facilities including curbs, erosion con-
trol measures, catch basins, and outlet control structures.
LID designs also have space-saving advantages and can
reduce the amount of land disturbance required during
construction, saving money on site preparation expenses.
In northern Frederick County, Maryland, a number of cost
saving benefits were realized by redesigning a conventional
subdivision with LID designs. This included eliminating two
stormwater ponds representing a reduction in infrastructure
costs of roughly $200,000; increasing the number of build-
able lots from 68 to 70, which added roughly $90,000 in value; and allowing the site
design to preserve approximately 50 percent of the site in undisturbed wooded condi-
tion, which reduced clearing and grubbing costs by $160,000 (Clar, 2003). Also, an
infill site in northern Virginia was able to save over 50 percent in cost for infrastruc-
ture by minimizing impervious surfaces, protecting sensitive areas, reducing setback
requirements, and treating stormwater at the source (CWP et al., 2001).
Economics and LID Practices
In the vast majority of
cases, the EPA has found that
implementing well-chosen
LID practices saves money for
developers, property owners, and
communities while also protecting
and restoring water quality.
CHAPTER 3
3-2 F O R G I N G T H E L I N K
T H E E C O N O M I C S O F L O W I M P A C T D E V E L O P M E N T
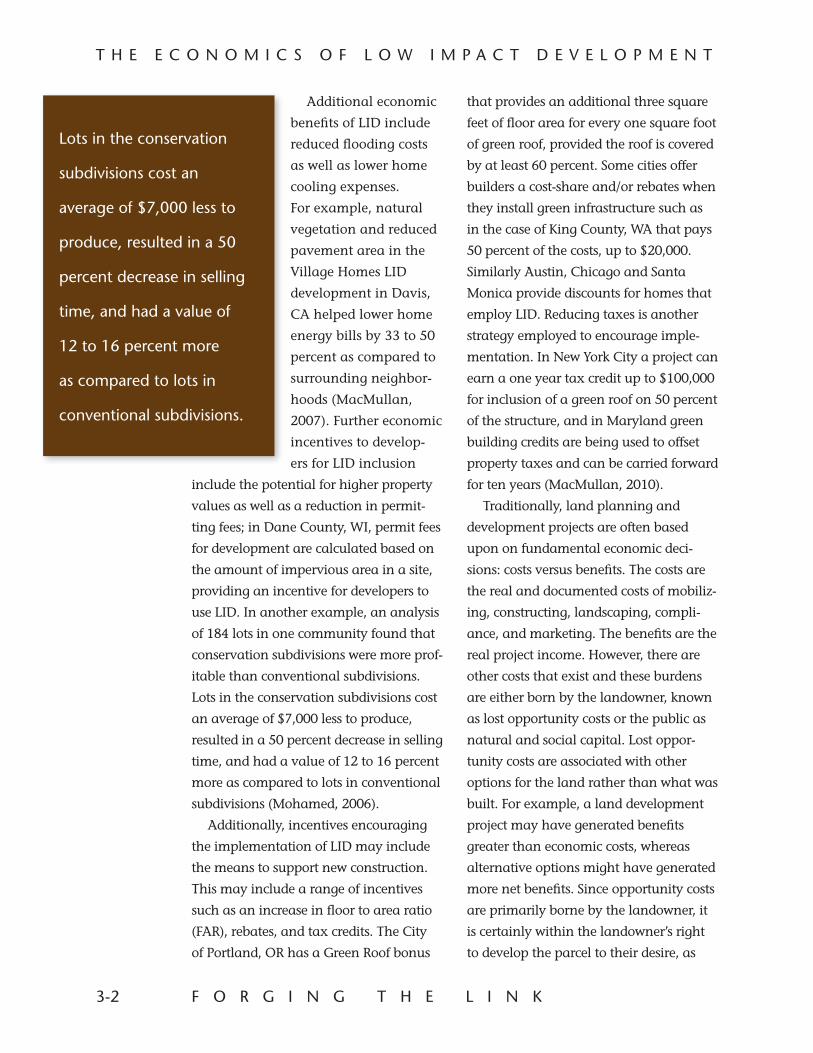
Additional economic
benefits of LID include
reduced flooding costs
as well as lower home
cooling expenses.
For example, natural
vegetation and reduced
pavement area in the
Village Homes LID
development in Davis,
CA helped lower home
energy bills by 33 to 50
percent as compared to
surrounding neighbor-
hoods (MacMullan,
2007). Further economic
incentives to develop-
ers for LID inclusion
include the potential for higher property
values as well as a reduction in permit-
ting fees; in Dane County, WI, permit fees
for development are calculated based on
the amount of impervious area in a site,
providing an incentive for developers to
use LID. In another example, an analysis
of 184 lots in one community found that
conservation subdivisions were more prof-
itable than conventional subdivisions.
Lots in the conservation subdivisions cost
an average of $7,000 less to produce,
resulted in a 50 percent decrease in selling
time, and had a value of 12 to 16 percent
more as compared to lots in conventional
subdivisions (Mohamed, 2006).
Additionally, incentives encouraging
the implementation of LID may include
the means to support new construction.
This may include a range of incentives
such as an increase in floor to area ratio
(FAR), rebates, and tax credits. The City
of Portland, OR has a Green Roof bonus
that provides an additional three square
feet of floor area for every one square foot
of green roof, provided the roof is covered
by at least 60 percent. Some cities offer
builders a cost-share and/or rebates when
they install green infrastructure such as
in the case of King County, WA that pays
50 percent of the costs, up to $20,000.
Similarly Austin, Chicago and Santa
Monica provide discounts for homes that
employ LID. Reducing taxes is another
strategy employed to encourage imple-
mentation. In New York City a project can
earn a one year tax credit up to $100,000
for inclusion of a green roof on 50 percent
of the structure, and in Maryland green
building credits are being used to offset
property taxes and can be carried forward
for ten years (MacMullan, 2010).
Traditionally, land planning and
development projects are often based
upon on fundamental economic deci-
sions: costs versus benefits. The costs are
the real and documented costs of mobiliz-
ing, constructing, landscaping, compli-
ance, and marketing. The benefits are the
real project income. However, there are
other costs that exist and these burdens
are either born by the landowner, known
as lost opportunity costs or the public as
natural and social capital. Lost oppor-
tunity costs are associated with other
options for the land rather than what was
built. For example, a land development
project may have generated benefits
greater than economic costs, whereas
alternative options might have generated
more net benefits. Since opportunity costs
are primarily borne by the landowner, it
is certainly within the landowner’s right
to develop the parcel to their desire, as
Lots in the conservation
subdivisions cost an
average of $7,000 less to
produce, resulted in a 50
percent decrease in selling
time, and had a value of
12 to 16 percent more
as compared to lots in
conventional subdivisions.
F O R G I N G T H E L I N K 3-3
T H E E C O N O M I C S O F L O W I M P A C T D E V E L O P M E N T
long as it complies with State and local
codes and regulations. However, the
expenditure of natural and social capital
is usually borne by the public: in essence
the land developer passes off costs to
the public. Natural capital represents
the ecological value of the goods and
services provided by the environment.
In the case of stormwater, if streams are
degraded because of poor stormwater
management, that is an expenditure of
natural capital. If the degraded stream
is in need of restoration, often this is
done by the expenditure of public funds.
Just as water quality and water quantity
affect the health of an ecosystem, the
built environment affects and reflects
the community. Healthy environments,
foster stronger community connections:
whether through community groups,
recreational activities, or social gather-
ings. Societies that have demonstrated
stronger community connections (social
capital) reduce community costs, such as
crime, emergency response, transporta-
tion, etc (Knack and Keefer, 1997). Better
stormwater management at the site level
ultimately minimizes the expenditures of
natural and social capital which trans-
lates to less long term adverse impacts to
community budgets.
While these additional benefits are
recognized, the focus of this section is to
clearly articulate, through case studies
and detailed examples, the hard cost
benefits of implementing LID.
3-4 F O R G I N G T H E L I N K
T H E E C O N O M I C S O F L O W I M PA C T D E V E L O P M E N T: C A S E S T U D I E S
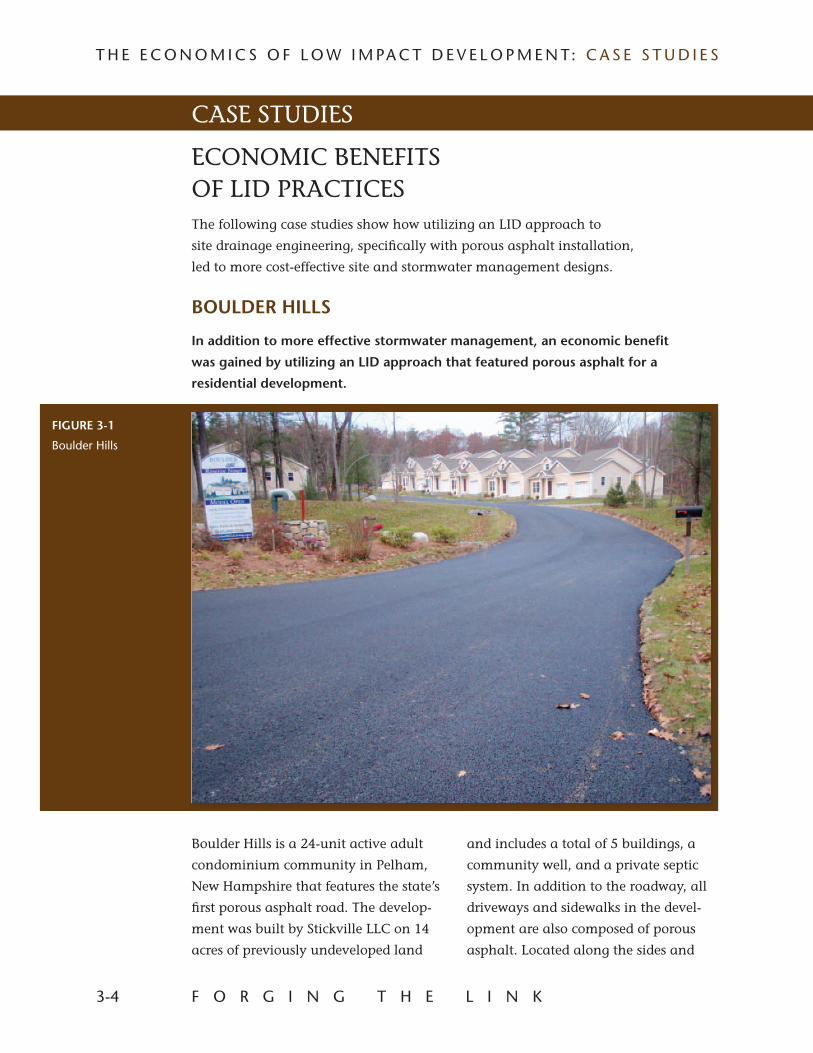
BOULDER HILLS
In addition to more effective stormwater management, an economic benefit
was gained by utilizing an LID approach that featured porous asphalt for a
residential development.
FIGURE 3-1
Boulder Hills
Boulder Hills is a 24-unit active adult
condominium community in Pelham,
New Hampshire that features the state’s
first porous asphalt road. The develop-
ment was built by Stickville LLC on 14
acres of previously undeveloped land
CASE STUDIES
ECONOMIC BENEFITS OF LID PRACTICESThe following case studies show how utilizing an LID approach to
site drainage engineering, specifically with porous asphalt installation,
led to more cost-effective site and stormwater management designs.
and includes a total of 5 buildings, a
community well, and a private septic
system. In addition to the roadway, all
driveways and sidewalks in the devel-
opment are also composed of porous
asphalt. Located along the sides and
F O R G I N G T H E L I N K 3-5
T H E E C O N O M I C S O F L O W I M PA C T D E V E L O P M E N T: C A S E S T U D I E S
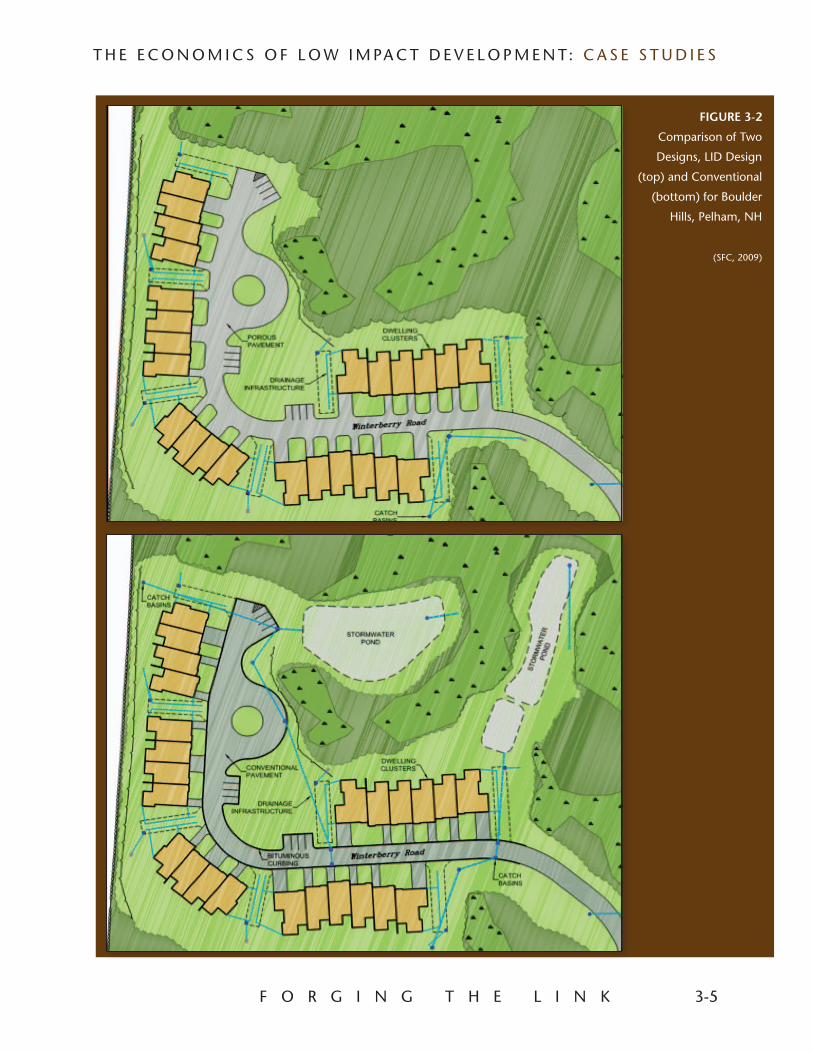
FIGURE 3-2
Comparison of Two
Designs, LID Design
(top) and Conventional
(bottom) for Boulder
Hills, Pelham, NH
(SFC, 2009)
3-6 F O R G I N G T H E L I N K
T H E E C O N O M I C S O F L O W I M PA C T D E V E L O P M E N T: C A S E S T U D I E S
the backs of the buildings are fire lanes
consisting of crushed stone that also
serve as infiltration systems for rooftop
runoff.
SFC Engineering Partnership Inc.
designed the project site and develop-
ment plan including all drainage. The
University of New Hampshire (UNH)
Stormwater Center advised the project
team and worked with Pelham town offi-
cials, providing guidance and oversight
with the installation and the monitoring
of the porous asphalt placements.
Prior to development,
the project site was an
undeveloped woodland
area sitting atop a large
sand deposit. Soils on
the parcel were charac-
terized with a moder-
ate infiltration rate
and consisted of deep,
moderately well to well
drained soils. Wetland
areas were located in the
south and east sections
of the parcel, with a por-
tion of the site existing
in a 100-year flood zone.
The benefits of
implementing an LID
design as compared to
a conventional develop-
ment and stormwater
management plan
included cost savings
and positive exposure
for the developers, improved water
quality and runoff volume reduction, as
well as less overall site disturbance and
the ability to stay out of wetland and
flood zone areas. Over time, the porous
asphalt placements are also antici-
pated to require less salt application for
winter de-icing, resulting in additional
economic and environmental benefits.
By the end of the first winter 2009-
2010, the project owners reported using
substantially less salt for winter ice
management.
DESIGN PROCESS
Initially, SFC Engineering Partnership
began designing a conventional devel-
opment and stormwater management
plan for the project. However, according
to David Jordan, P.E., L.L.S., manager
of SFC’s Civil Engineering Department,
difficulty was encountered because of
the site’s layout and existing conditions.
“The parcel was burdened by lowland
areas while the upland areas were
fragmented and limited,” Jordan said.
“Given these conditions, it was challeng-
ing to make a conventional drainage
design work that would meet town regu-
lations. We found ourselves squeezing
stormwater mitigation measures into the
site design in order to meet criteria. The
parcel also did not have a large enough
area that could serve as the site’s single
collection and treatment basin. Instead,
we were forced to design two separate
stormwater detention basins, which was
more expensive. This approach was also
cost prohibitive because of the necessity
of installing lengthy underground drain-
age lines.”
When LID and specifically, porous
asphalt, emerged as a possible stormwa-
ter management option for the site, the
developer, Stickville LLC, was receptive.
The benefits of
implementing an LID
design as compared to a
conventional development
and stormwater
management plan included
cost savings and positive
exposure for the developers,
improved water quality and
runoff volume reduction,
as well as less overall site
disturbance and the ability
to stay out of wetland and
flood zone areas.
F O R G I N G T H E L I N K 3-7
T H E E C O N O M I C S O F L O W I M PA C T D E V E L O P M E N T: C A S E S T U D I E S
Stickville was aware of the advantages
of LID and porous pavement and was
interested in utilizing these measures as
a possible marketing tool which could
help differentiate them as green-oriented
developers. SFC advised Stickville LLC to
pursue this option. Jordan had attended
a seminar on porous pavement pre-
sented by The UNH Stormwater Center
which covered the multiple benefits of
utilizing this material, including its effec-
tiveness for being able to meet stormwa-
ter quantity and quality requirements.
“Per regulations, the amount of storm-
water runoff from the site after develop-
ment could not be any greater than what
it was as an undeveloped parcel,” Jordan
said. “In addition to controlling runoff,
stormwater mitigation measures also had
to be adequate in terms of treatment.
Porous pavement allows us to do both.
For a difficult site such as Boulder Hills,
that represents a huge advantage.”
According to Jordan, the Town of
Pelham responded very favorably to
the idea of incorporating LID with the
project. “The planning board was on
board from the very beginning,” he
said. “They were very supportive of
utilizing porous asphalt and recognized
the many benefits of this option.”
ECONOMIC COMPARISONS
SFC Engineering Partnership designed
two development options for the proj-
ect. One option was a conventional
development and drainage plan that
included the construction of a tradi-
tional asphalt roadway and driveways.
The other option, an LID approach,
involved replacing the traditional
asphalt in the roadway and driveways
with porous asphalt and using sub-
surface infiltration for rooftop runoff,
essentially eliminating
a traditional pipe and
pond approach.
Although porous
asphalt was more
costly as compared to
traditional asphalt,
the engineers found
that by utilizing this
material, cost savings
in other areas could be
realized. For one, install-
ing porous asphalt
significantly lowered the
amount of drainage piping and infra-
structure required. Using porous asphalt
also reduced the quantity of temporary
and permanent erosion control mea-
sures needed while cutting in half the
amount of rip-rap, and lowering the
number of catch basins from 11 to 3.
Additionally, the LID option completely
eliminated the need to install curb-
ing, outlet control structures, as well as
two large stormwater detention ponds.
Another benefit was a 1.3 acre reduc-
tion in the amount of land that would
need to be disturbed, resulting in less
site preparation costs.
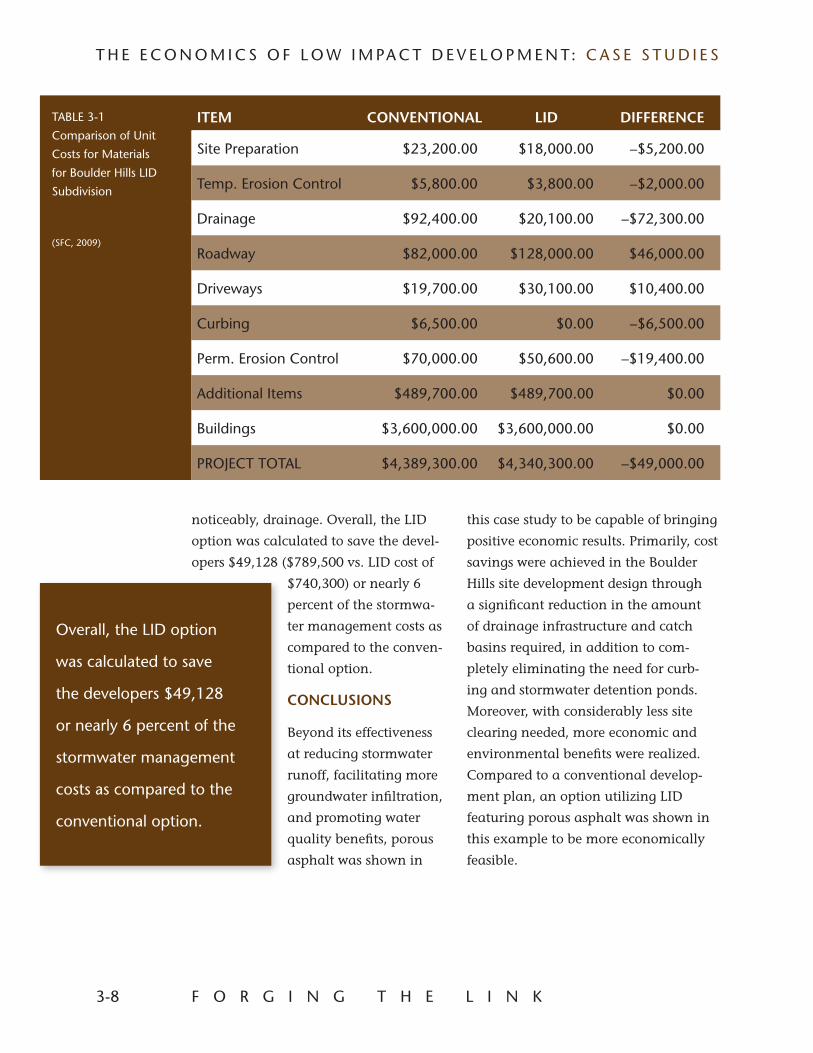
Table 3-1 shows the construction esti-
mate cost comparisons between the con-
ventional and the low impact develop-
ment options. As shown, the LID option
resulted in higher costs for roadway
and driveway construction. However,
considerable savings were realized for
site preparation, temporary and perma-
nent erosion control, curbing, and most
Although porous asphalt was
more costly as compared
to traditional asphalt, the
engineers found that by
utilizing this material, cost
savings in other areas could
be realized.
3-8 F O R G I N G T H E L I N K
T H E E C O N O M I C S O F L O W I M PA C T D E V E L O P M E N T: C A S E S T U D I E S
Overall, the LID option
was calculated to save
the developers $49,128
or nearly 6 percent of the
stormwater management
costs as compared to the
conventional option.
noticeably, drainage. Overall, the LID
option was calculated to save the devel-
opers $49,128 ($789,500 vs. LID cost of
$740,300) or nearly 6
percent of the stormwa-
ter management costs as
compared to the conven-
tional option.
CONCLUSIONS
Beyond its effectiveness
at reducing stormwater
runoff, facilitating more
groundwater infiltration,
and promoting water
quality benefits, porous
asphalt was shown in
this case study to be capable of bringing
positive economic results. Primarily, cost
savings were achieved in the Boulder
Hills site development design through
a significant reduction in the amount
of drainage infrastructure and catch
basins required, in addition to com-
pletely eliminating the need for curb-
ing and stormwater detention ponds.
Moreover, with considerably less site
clearing needed, more economic and
environmental benefits were realized.
Compared to a conventional develop-
ment plan, an option utilizing LID
featuring porous asphalt was shown in
this example to be more economically
feasible.
TABLE 3-1
Comparison of Unit
Costs for Materials
for Boulder Hills LID
Subdivision
(SFC, 2009)
ITEM CONVENTIONAL LID DIFFERENCE
Site Preparation $23,200.00 $18,000.00 –$5,200.00
Temp. Erosion Control $5,800.00 $3,800.00 –$2,000.00
Drainage $92,400.00 $20,100.00 –$72,300.00
Roadway $82,000.00 $128,000.00 $46,000.00
Driveways $19,700.00 $30,100.00 $10,400.00
Curbing $6,500.00 $0.00 –$6,500.00
Perm. Erosion Control $70,000.00 $50,600.00 –$19,400.00
Additional Items $489,700.00 $489,700.00 $0.00
Buildings $3,600,000.00 $3,600,000.00 $0.00
PROJECT TOTAL $4,389,300.00 $4,340,300.00 –$49,000.00
F O R G I N G T H E L I N K 3-9
T H E E C O N O M I C S O F L O W I M PA C T D E V E L O P M E N T: C A S E S T U D I E S
OVERVIEW
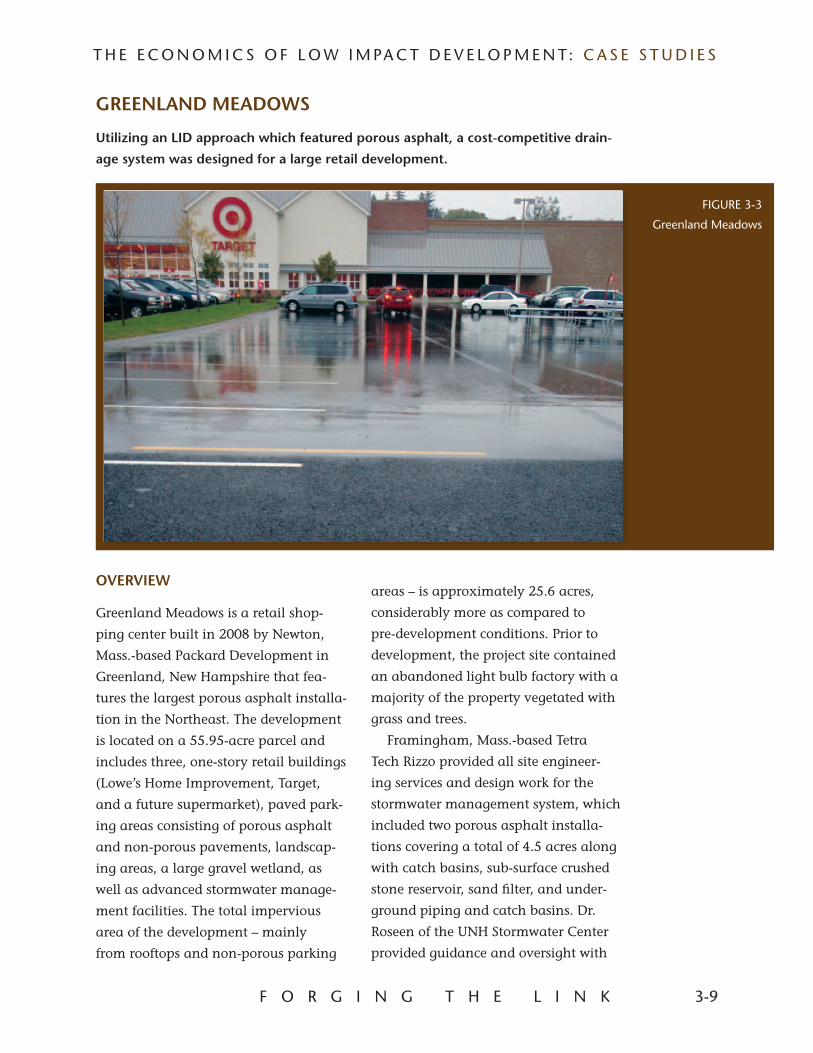
Greenland Meadows is a retail shop-
ping center built in 2008 by Newton,
Mass.-based Packard Development in
Greenland, New Hampshire that fea-
tures the largest porous asphalt installa-
tion in the Northeast. The development
is located on a 55.95-acre parcel and
includes three, one-story retail buildings
(Lowe’s Home Improvement, Target,
and a future supermarket), paved park-
ing areas consisting of porous asphalt
and non-porous pavements, landscap-
ing areas, a large gravel wetland, as
well as advanced stormwater manage-
ment facilities. The total impervious
area of the development – mainly
from rooftops and non-porous parking
areas – is approximately 25.6 acres,
considerably more as compared to
pre-development conditions. Prior to
development, the project site contained
an abandoned light bulb factory with a
majority of the property vegetated with
grass and trees.
Framingham, Mass.-based Tetra
Tech Rizzo provided all site engineer-
ing services and design work for the
stormwater management system, which
included two porous asphalt installa-
tions covering a total of 4.5 acres along
with catch basins, sub-surface crushed
stone reservoir, sand filter, and under-
ground piping and catch basins. Dr.
Roseen of the UNH Stormwater Center
provided guidance and oversight with
FIGURE 3-3
Greenland Meadows
GREENLAND MEADOWS
Utilizing an LID approach which featured porous asphalt, a cost-competitive drain-
age system was designed for a large retail development.
3-10 F O R G I N G T H E L I N K
T H E E C O N O M I C S O F L O W I M PA C T D E V E L O P M E N T: C A S E S T U D I E S
the porous asphalt installations and
supporting designs.
This case study will show how a com-
bination porous asphalt and standard
pavement design with
a sub-surface gravel
reservoir management
system was more eco-
nomically feasible as
compared to a standard
pavement design with
a conventional sub-
surface stormwater
management detention
system. Additionally,
this analysis will cover
some of the site-specific
challenges, as well as
the environmental
issues with this develop-
ment that mandated
the installation of an
advanced LID-based
stormwater manage-
ment design.
ENVIRONMENTAL CONCERNS
During the initial planning stage,
concerns arose about potential adverse
water quality impacts from the proj-
ect. The development would increase
the amount of impervious surface on
the site resulting in a higher amount
of stormwater runoff as compared to
existing conditions. These concerns were
especially heightened given the fact
that the development is located imme-
diately adjacent to Pickering Brook,
an EPA-listed impaired waterway that
connects the Great Bog to the Great
Bay. One group that was particularly
interested in the project’s approach
to managing stormwater was the
Conservation Law Foundation (CLF), an
environmental advocacy organization.
According to Austin Turner, a senior
project civil engineer with Tetra Tech
Rizzo, CLF feared that a conventional
stormwater treatment system would not
be sufficient for protecting water quality.
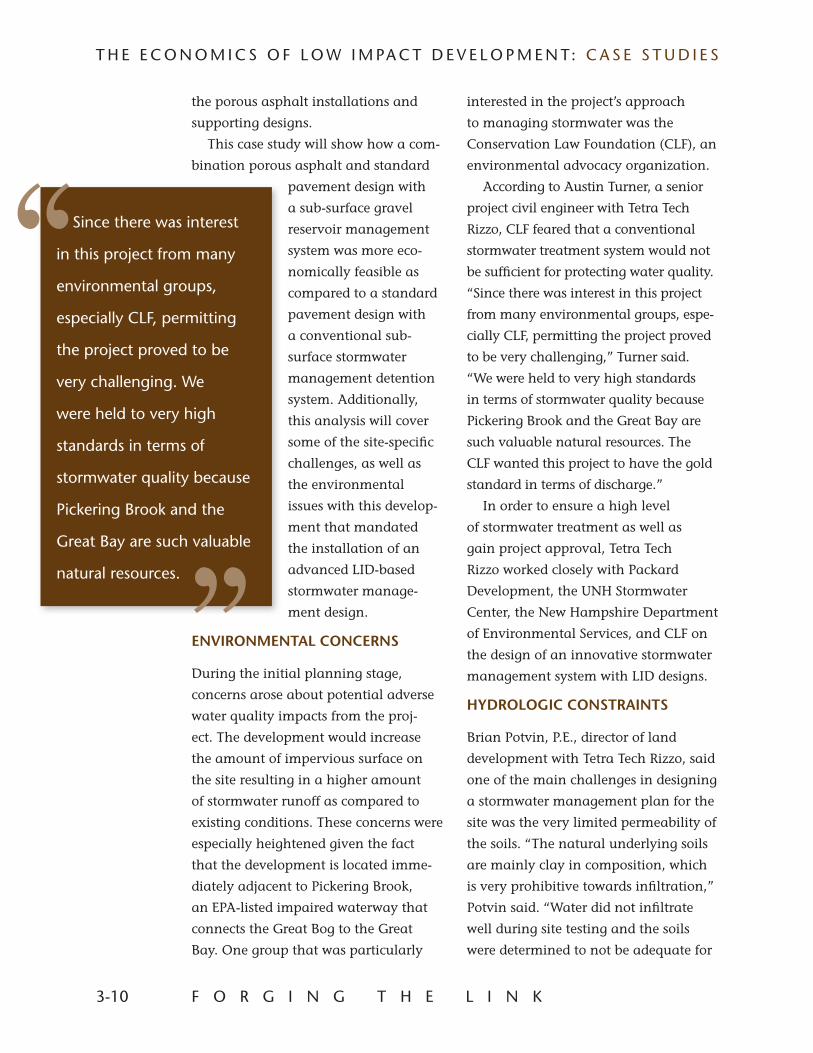
“Since there was interest in this project
from many environmental groups, espe-
cially CLF, permitting the project proved
to be very challenging,” Turner said.
“We were held to very high standards
in terms of stormwater quality because
Pickering Brook and the Great Bay are
such valuable natural resources. The
CLF wanted this project to have the gold
standard in terms of discharge.”
In order to ensure a high level
of stormwater treatment as well as
gain project approval, Tetra Tech
Rizzo worked closely with Packard
Development, the UNH Stormwater
Center, the New Hampshire Department
of Environmental Services, and CLF on
the design of an innovative stormwater
management system with LID designs.
HYDROLOGIC CONSTRAINTS
Brian Potvin, P.E., director of land
development with Tetra Tech Rizzo, said
one of the main challenges in designing
a stormwater management plan for the
site was the very limited permeability of
the soils. “The natural underlying soils
are mainly clay in composition, which
is very prohibitive towards infiltration,”
Potvin said. “Water did not infiltrate
well during site testing and the soils
were determined to not be adequate for
Since there was interest
in this project from many
environmental groups,
especially CLF, permitting
the project proved to be
very challenging. We
were held to very high
standards in terms of
stormwater quality because
Pickering Brook and the
Great Bay are such valuable
natural resources.
F O R G I N G T H E L I N K 3-11
T H E E C O N O M I C S O F L O W I M PA C T D E V E L O P M E N T: C A S E S T U D I E S
receiving runoff.” As such, Tetra Tech
Rizzo focused on a stormwater man-
agement design that revolved around
stormwater quantity attenuation, stor-
age, conveyance, and treatment.
ECONOMIC COMPARISONS
Tetra Tech Rizzo prepared two site work
and stormwater management design
options for the Greenland Meadows
development:
1. ConventionalThis option included standard asphalt
and concrete pavement along with
a traditional sub-surface stormwater
detention system consisting of a gravel
sub-base and stone backfill, stormwater
wetland, and supporting infrastructure.
2. LIDThis option included the use of porous
asphalt and standard paving in
addition to a sub-surface crushed stone
reservoir, sand filter beneath the porous
asphalt, a subsurface gravel wetland,
and supporting infrastructure.
The western portion of the property
would receive a majority of the site’s
stormwater prior to discharge into
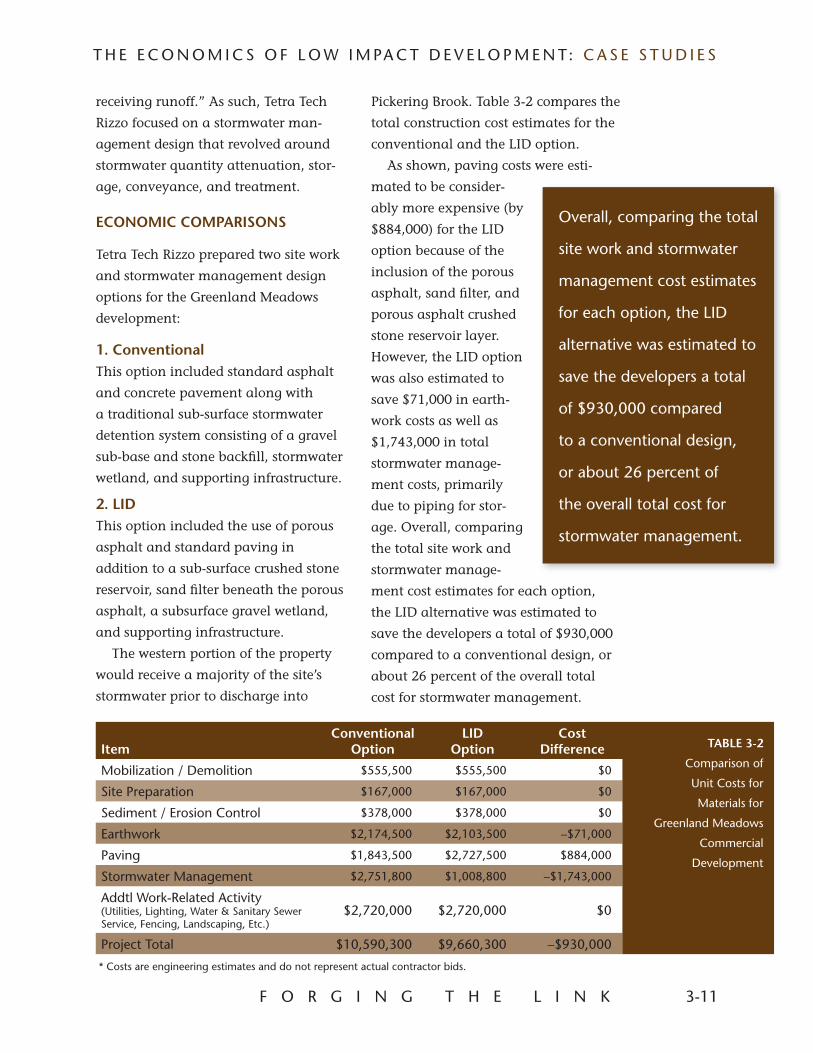
Pickering Brook. Table 3-2 compares the
total construction cost estimates for the
conventional and the LID option.
As shown, paving costs were esti-
mated to be consider-
ably more expensive (by
$884,000) for the LID
option because of the
inclusion of the porous
asphalt, sand filter, and
porous asphalt crushed
stone reservoir layer.
However, the LID option
was also estimated to
save $71,000 in earth-
work costs as well as
$1,743,000 in total
stormwater manage-
ment costs, primarily
due to piping for stor-
age. Overall, comparing
the total site work and
stormwater manage-
ment cost estimates for each option,
the LID alternative was estimated to
save the developers a total of $930,000
compared to a conventional design, or
about 26 percent of the overall total
cost for stormwater management.
ItemConventional
OptionLID
OptionCost
Difference TABLE 3-2
Comparison of
Unit Costs for
Materials for
Greenland Meadows
Commercial
Development
Mobilization / Demolition $555,500 $555,500 $0
Site Preparation $167,000 $167,000 $0
Sediment / Erosion Control $378,000 $378,000 $0
Earthwork $2,174,500 $2,103,500 –$71,000
Paving $1,843,500 $2,727,500 $884,000
Stormwater Management $2,751,800 $1,008,800 –$1,743,000
Addtl Work-Related Activity (Utilities, Lighting, Water & Sanitary Sewer Service, Fencing, Landscaping, Etc.)
$2,720,000 $2,720,000 $0
Project Total $10,590,300 $9,660,300 –$930,000
* Costs are engineering estimates and do not represent actual contractor bids.
Overall, comparing the total
site work and stormwater
management cost estimates
for each option, the LID
alternative was estimated to
save the developers a total
of $930,000 compared
to a conventional design,
or about 26 percent of
the overall total cost for
stormwater management.
3-12 F O R G I N G T H E L I N K
T H E E C O N O M I C S O F L O W I M PA C T D E V E L O P M E N T: C A S E S T U D I E S
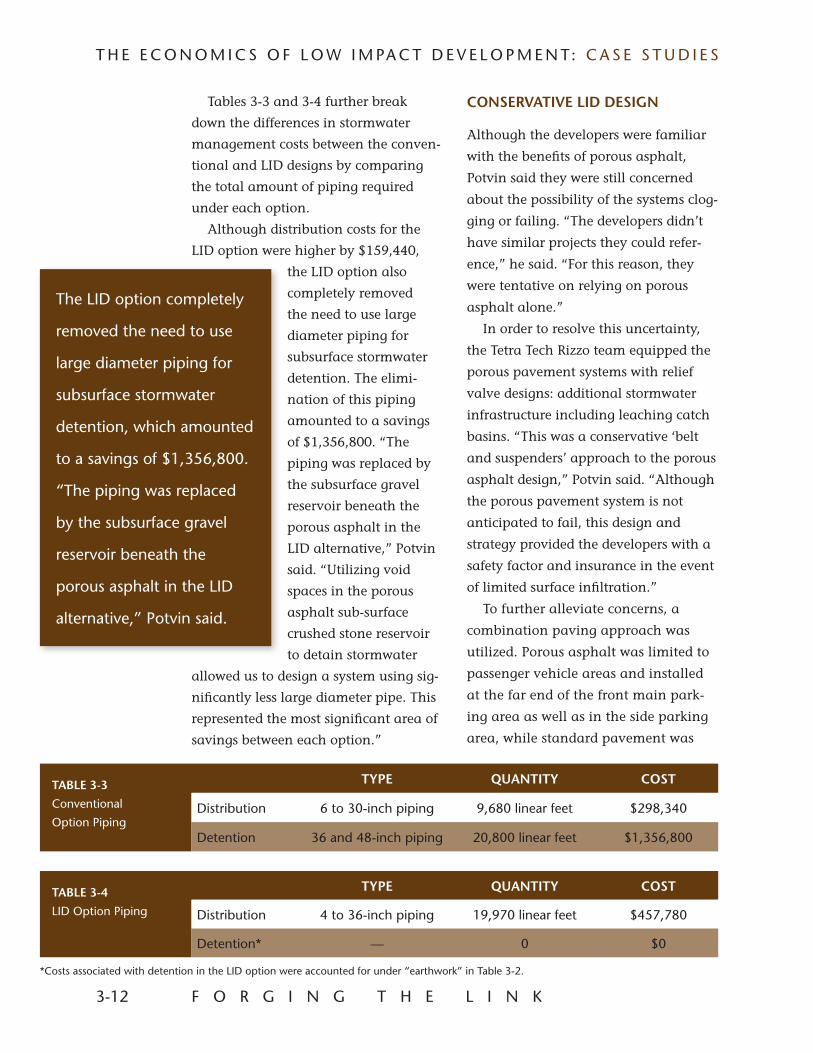
Tables 3-3 and 3-4 further break
down the differences in stormwater
management costs between the conven-
tional and LID designs by comparing
the total amount of piping required
under each option.
Although distribution costs for the
LID option were higher by $159,440,
the LID option also
completely removed
the need to use large
diameter piping for
subsurface stormwater
detention. The elimi-
nation of this piping
amounted to a savings
of $1,356,800. “The
piping was replaced by
the subsurface gravel
reservoir beneath the
porous asphalt in the
LID alternative,” Potvin
said. “Utilizing void
spaces in the porous
asphalt sub-surface
crushed stone reservoir
to detain stormwater
allowed us to design a system using sig-
nificantly less large diameter pipe. This
represented the most significant area of
savings between each option.”
CONSERVATIVE LID DESIGN
Although the developers were familiar
with the benefits of porous asphalt,
Potvin said they were still concerned
about the possibility of the systems clog-
ging or failing. “The developers didn’t
have similar projects they could refer-
ence,” he said. “For this reason, they
were tentative on relying on porous
asphalt alone.”
In order to resolve this uncertainty,
the Tetra Tech Rizzo team equipped the
porous pavement systems with relief
valve designs: additional stormwater
infrastructure including leaching catch
basins. “This was a conservative ‘belt
and suspenders’ approach to the porous
asphalt design,” Potvin said. “Although
the porous pavement system is not
anticipated to fail, this design and
strategy provided the developers with a
safety factor and insurance in the event
of limited surface infiltration.”
To further alleviate concerns, a
combination paving approach was
utilized. Porous asphalt was limited to
passenger vehicle areas and installed
at the far end of the front main park-
ing area as well as in the side parking
area, while standard pavement was
TABLE 3-3
Conventional
Option Piping
TYPE QUANTITY COST
Distribution 6 to 30-inch piping 9,680 linear feet $298,340
Detention 36 and 48-inch piping 20,800 linear feet $1,356,800
TABLE 3-4
LID Option Piping
TYPE QUANTITY COST
Distribution 4 to 36-inch piping 19,970 linear feet $457,780
Detention* — 0 $0
*Costs associated with detention in the LID option were accounted for under “earthwork” in Table 3-2.
The LID option completely
removed the need to use
large diameter piping for
subsurface stormwater
detention, which amounted
to a savings of $1,356,800.
“The piping was replaced
by the subsurface gravel
reservoir beneath the
porous asphalt in the LID
alternative,” Potvin said.
F O R G I N G T H E L I N K 3-13
T H E E C O N O M I C S O F L O W I M PA C T D E V E L O P M E N T: C A S E S T U D I E S
put in near the front and more visible
sections of the retail center and for the
loop roads, delivery areas expected
to receive truck traffic. “This way,
in case there was clogging or a fail-
ure, it would be away from the front
entrances and would not impair access
or traffic into the stores,” Potvin said.
LID SYSTEM FUNCTIONALITY
The two porous asphalt drainage
systems – one in the main parking lot
and one in the side parking area – serve
to attenuate peak flows, while the
aggregate reservoirs, installed directly
below the two porous asphalt place-
ments, serve as storage. The aggregate
reservoirs are underlain by sand filters
which provide an additional means of
stormwater treatment. Runoff from the
sand filters flows through perforated
underdrain pipes that converge to a
large header pipe. Peak flow attenua-
tion is attained by controlling the rate
at which runoff exits the header pipe
with an outlet control structure.
After being collected in catch
basins, a majority of the stormwater
runoff from rooftops and nonporous
pavement areas flow to particle sepa-
rator units, which treat stormwater
prior to discharging into the crushed
stone reservoir layers below the porous
asphalt.
Outlet from the smaller aggregate
reservoir, located underneath the side
parking area, flows to an existing
wetland on the east side of the site,
while outlet from the larger aggregate
reservoir flows to the gravel wetland
on the west side of the site. The gravel
wetland is designed as a series of flow-
through treatment cells providing an
anaerobic system of crushed stone with
wetland soils and plants. This innova-
tive LID design works to remove pollut-
ants as well as mitigate
the thermal impacts of
stormwater.
CONCLUSIONS
Although the use of
porous asphalt in
large-scale commercial
and residential develop-
ment is still a relatively
new application, this
case study showed how
porous asphalt systems,
if designed correctly and
despite significant site
constraints, can bring
significant water quality
and economic ben-
efits. With Greenland
Meadows, an advanced
LID-based stormwater
design was implemented given the
proximity of the development to the
impaired Pickering Brook waterway.
But in addition to helping alleviate
water quality concerns, the LID option
featuring porous asphalt systems
eliminated the need to install large
diameter drainage infrastructure. This
was estimated to result in significant
cost savings in the site and stormwater
management design.
Although the use of porous
asphalt in large-scale
commercial and residential
development is still a
relatively new application,
this case study showed how
porous asphalt systems,
if designed correctly and
despite significant site
constraints, can bring
significant water quality and
economic benefits.
3-14 F O R G I N G T H E L I N K
T H E E C O N O M I C S O F L O W I M PA C T D E V E L O P M E N T: C A S E S T U D I E S
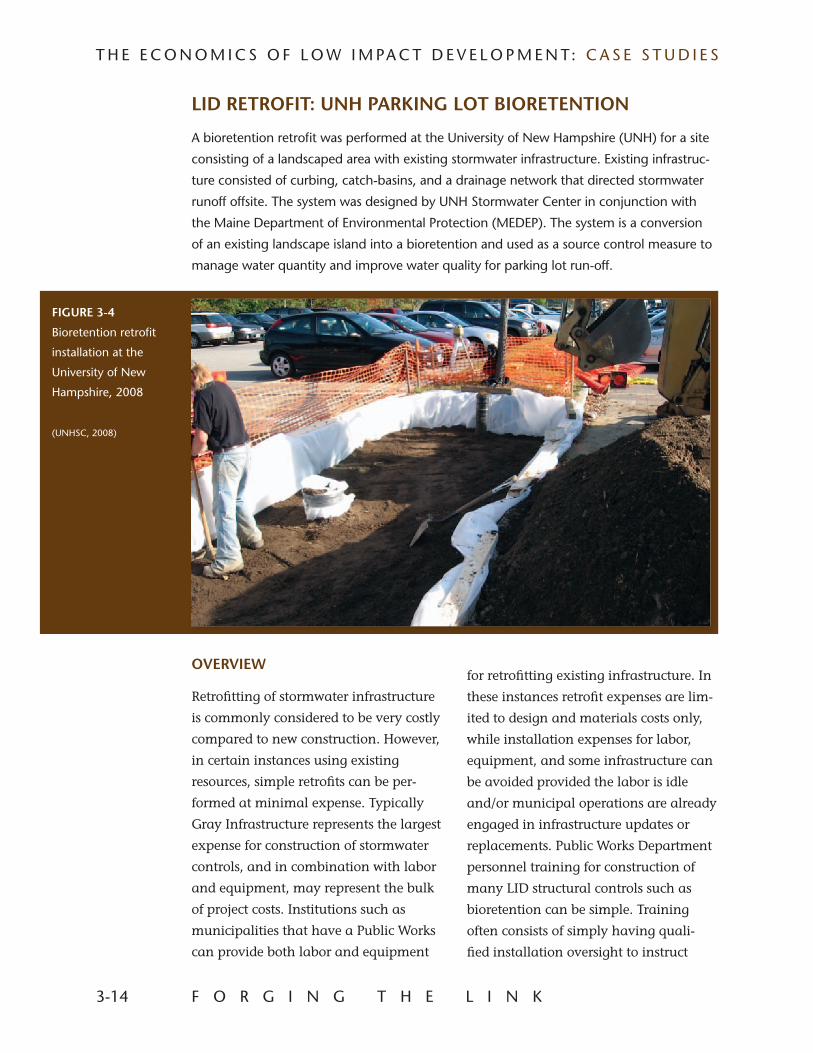
LID RETROFIT: UNH PARKING LOT BIORETENTION
A bioretention retrofit was performed at the University of New Hampshire (UNH) for a site
consisting of a landscaped area with existing stormwater infrastructure. Existing infrastruc-
ture consisted of curbing, catch-basins, and a drainage network that directed stormwater
runoff offsite. The system was designed by UNH Stormwater Center in conjunction with
the Maine Department of Environmental Protection (MEDEP). The system is a conversion
of an existing landscape island into a bioretention and used as a source control measure to
manage water quantity and improve water quality for parking lot run-off.
for retrofitting existing infrastructure. In
these instances retrofit expenses are lim-
ited to design and materials costs only,
while installation expenses for labor,
equipment, and some infrastructure can
be avoided provided the labor is idle
and/or municipal operations are already
engaged in infrastructure updates or
replacements. Public Works Department
personnel training for construction of
many LID structural controls such as
bioretention can be simple. Training
often consists of simply having quali-
fied installation oversight to instruct
OVERVIEW
Retrofitting of stormwater infrastructure
is commonly considered to be very costly
compared to new construction. However,
in certain instances using existing
resources, simple retrofits can be per-
formed at minimal expense. Typically
Gray Infrastructure represents the largest
expense for construction of stormwater
controls, and in combination with labor
and equipment, may represent the bulk
of project costs. Institutions such as
municipalities that have a Public Works
can provide both labor and equipment
FIGURE 3-4
Bioretention retrofit
installation at the
University of New
Hampshire, 2008
(UNHSC, 2008)
F O R G I N G T H E L I N K 3-15
T H E E C O N O M I C S O F L O W I M PA C T D E V E L O P M E N T: C A S E S T U D I E S
and train personnel at system construc-
tion. The following example details the
process and expenses associated with
the installation of a bioretention system
for an existing parking area on the
University of New Hampshire campus.
PROJECT LOCATION
The bioretention system is installed
in an existing commuter parking lot
located on-campus in Durham, New
Hampshire with routine commuter and
bus traffic. The parking lot is a standard
design consisting of parking stalls and
landscaped islands that are raised,
curbed, and vegetated. These islands
are approximately 500 feet long, 9 feet
wide, and are designed to shed rain-
water onto the adjacent impervious
surface while the curbing directs run-off
to storm drains. Existing stormwater
management consists of a conventional
catch basin and pipe network draining
to a swale. Two catch basins are located
near the center of the island, one on
each side, draining approximately one
acre each with a 12 inch concrete pipe
running under the island.
PROJECT DESCRIPTION
The bioretention was designed to treat
runoff from a one-inch rainfall on
0.8 acres of pavement over a 24 hour
period, and includes a filter area that is
30 feet long and 9 feet wide. The cross-
sectional layout of the system from the
bottom up consists of native soil; 10
inches of crushed stone; three inches
of ¾-inch pea gravel; 24 inches of an
engineered bioretention soil mix (BSM);
and a 2-inch layer of hardwood mulch.
The top layer was planted with several
varieties of native perennial wild flowers.
The BSM mix was based upon a design
develop to meet the State of Maine
regulatory requirements
for bioretention areas.
The system was under-
drained and includes an
infiltration reservoir, and
high-flow bypass. All
drainage was connected
to the existing drainage
infrastructure by coring
into the adjacent catch-
basin underneath the
retrofit. The sides of the
system were fitted with
an impermeable liner
to prevent runoff from
migrating under the
existing pavement as well as to prevent
migration of adjacent soils into the
system. Bioretention construction took
three working days and included a con-
struction team consisting of two skilled
contractors in addition to an engineering
staff which provided oversight.
PROJECT COST
Total project cost per acre was $14,000.
With labor and install provided, costs
are limited to materials and plantings
at $5,500 (see Table 3-5). Costs could be
further reduced with onsite preparation
of the BSM saving additional materials
and trucking expenses.
In addition to this example, numer-
ous municipal projects have been
implemented utilizing bioretention, dry
well, tree filter, and porous pavement
retrofit installations. In these instances
Institutions such as
municipalities that have a
Public Works can provide
both labor and equipment
for retrofitting existing
infrastructure. In these
instances retrofit expenses
are limited to design and
materials costs only.
3-16 F O R G I N G T H E L I N K
T H E E C O N O M I C S O F L O W I M PA C T D E V E L O P M E N T: C A S E S T U D I E S
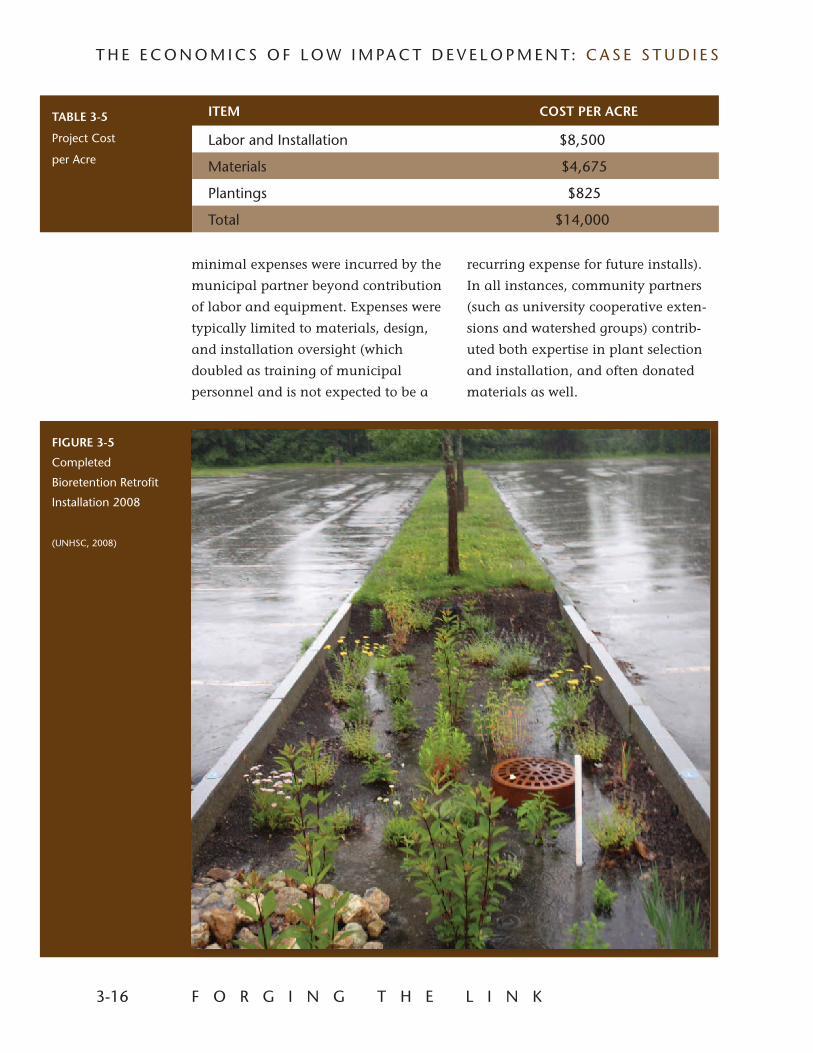
FIGURE 3-5
Completed
Bioretention Retrofit
Installation 2008
(UNHSC, 2008)
minimal expenses were incurred by the
municipal partner beyond contribution
of labor and equipment. Expenses were
typically limited to materials, design,
and installation oversight (which
doubled as training of municipal
personnel and is not expected to be a
TABLE 3-5
Project Cost
per Acre
ITEM COST PER ACRE
Labor and Installation $8,500
Materials $4,675
Plantings $825
Total $14,000
recurring expense for future installs).
In all instances, community partners
(such as university cooperative exten-
sions and watershed groups) contrib-
uted both expertise in plant selection
and installation, and often donated
materials as well.
F O R G I N G T H E L I N K 3-17
T H E E C O N O M I C S O F L O W I M PA C T D E V E L O P M E N T: C A S E S T U D I E S
Combined sewer overflows (CSOs)
represent major water quality threats to
hundreds of cities and communities in
the U.S. that are served by a combined
sewer system (CSS). CSO events cause
the release of untreated stormwater
and wastewater into receiving rivers,
lakes, and estuaries, causing a host of
environmental and economic-related
problems. Costs associated with CSO
management are expensive. The U.S.
Environmental Protection Agency (EPA)
estimates the costs of controlling CSOs
throughout the U.S. are approximately
$56 billion (MacMullan, 2007).
The traditional approach to CSO
management involves the develop-
ment of a separate drainage system to
convey stormwater flows or the use of
gray infrastructure and conventional
stormwater controls for enhancing the
storage and conveyance capacity of
combined systems. These approaches
can include the construction of large
underground storage tunnels that store
sewage overflows during rain events
for later treatment, as well as neces-
sary improvements and upgrades to
municipal treatment facilities in order
to handle increasing volumes. Both
approaches, while effective for CSO
controls, are very expensive.
Integrating Green Infrastructure
strategies and LID designs into a CSO
mitigation plan can help communities
achieve CSO management require-
ments at lower costs. In addition to
many benefits including groundwater
recharge, water quality improvements,
and reduced treatment costs, the use
of LID can help minimize the num-
ber of CSO events and the volume of
contaminated flows by
managing more storm-
water on site and keep-
ing volumes of runoff
out of combined sewers
(MacMullan, 2007).
Utilizing a combina-
tion approach of gray
and Green Infrastructure
strategies can be a
considerably more
cost-effective method for
CSO management as
compared to a traditional gray infra-
structure approach alone. Indeed, LID
methods can cost less to install, can
have lower operations and maintenance
(O&M) costs, and can provide more cost-
effective stormwater management and
water quality services than conventional
stormwater controls (MacMullan, 2007).
Some LID alternatives are also being
initiated by the private sector. While
municipalities may provide oversight
and consultation, as is the case with
the City of Portland, OR, these projects
are not controlled by municipalities in
regards to implementation, operation,
and maintenance. The purpose of this
study is to show the cost-benefits of
integrating Green Infrastructure strate-
gies with traditional gray infrastructure.
Integrating Green
Infrastructure strategies
and LID designs into a CSO
mitigation plan can help
communities achieve CSO
management requirements
at lower costs.
CASE STUDIES
LID PRACTICES FOR CSO MANAGEMENT
3-18 F O R G I N G T H E L I N K
T H E E C O N O M I C S O F L O W I M PA C T D E V E L O P M E N T: C A S E S T U D I E S
Although communities rarely attempt
to quantify and monetize the avoided
treatment costs from the use of LID
designs, the benefits of these practices for
decreasing the need for CSO storage and
conveyance systems should be factored
into any economic analyses (EPA, 2007).
The following case studies are pre-
sented to develop an economic context
for the use of Green Infrastructure
and LID designs as a strategy for CSO
compliance. The case studies will also
identify and contrast historical gray
infrastructure approaches to CSO
management using store, pump, and
treat with approaches using Green
Infrastructure/LID designs that focus on
reduced stormwater runoff volumes.
NARRAGANSETT BAY COMMISSION
A Baseline Gray Infrastructure Approach to CSO Management
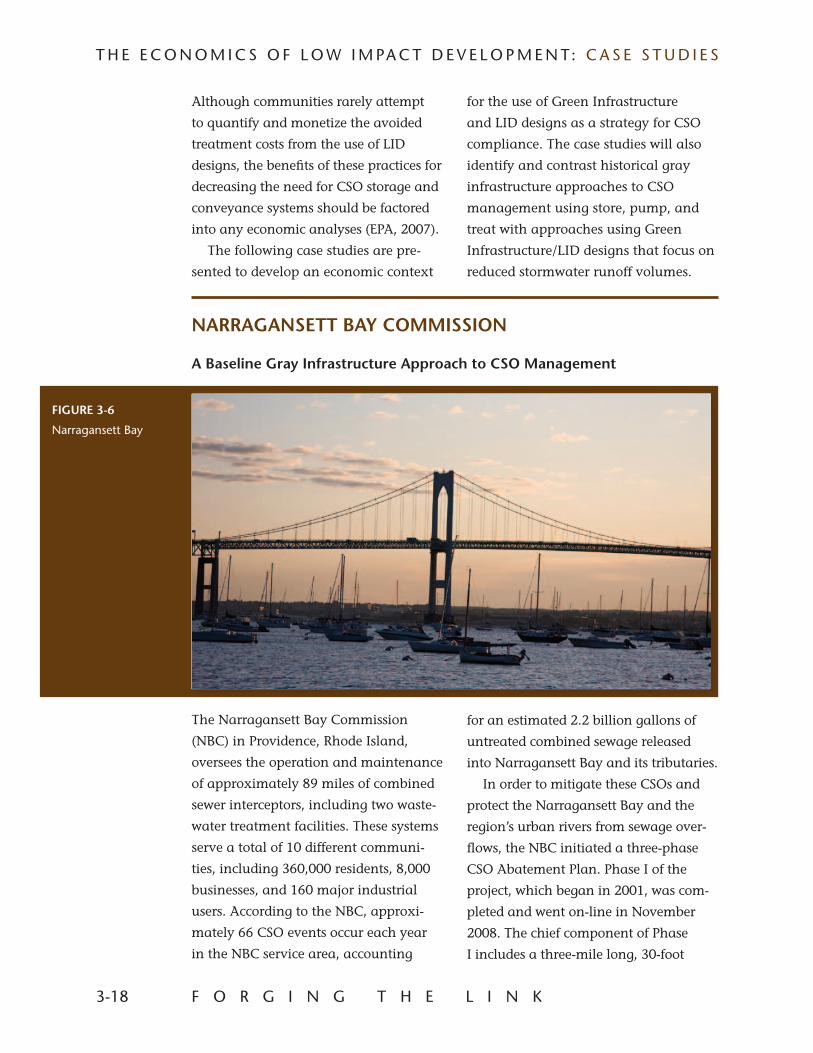
The Narragansett Bay Commission
(NBC) in Providence, Rhode Island,
oversees the operation and maintenance
of approximately 89 miles of combined
sewer interceptors, including two waste-
water treatment facilities. These systems
serve a total of 10 different communi-
ties, including 360,000 residents, 8,000
businesses, and 160 major industrial
users. According to the NBC, approxi-
mately 66 CSO events occur each year
in the NBC service area, accounting
for an estimated 2.2 billion gallons of
untreated combined sewage released
into Narragansett Bay and its tributaries.
In order to mitigate these CSOs and
protect the Narragansett Bay and the
region’s urban rivers from sewage over-
flows, the NBC initiated a three-phase
CSO Abatement Plan. Phase I of the
project, which began in 2001, was com-
pleted and went on-line in November
2008. The chief component of Phase
I includes a three-mile long, 30-foot
FIGURE 3-6
Narragansett Bay
F O R G I N G T H E L I N K 3-19
T H E E C O N O M I C S O F L O W I M PA C T D E V E L O P M E N T: C A S E S T U D I E S
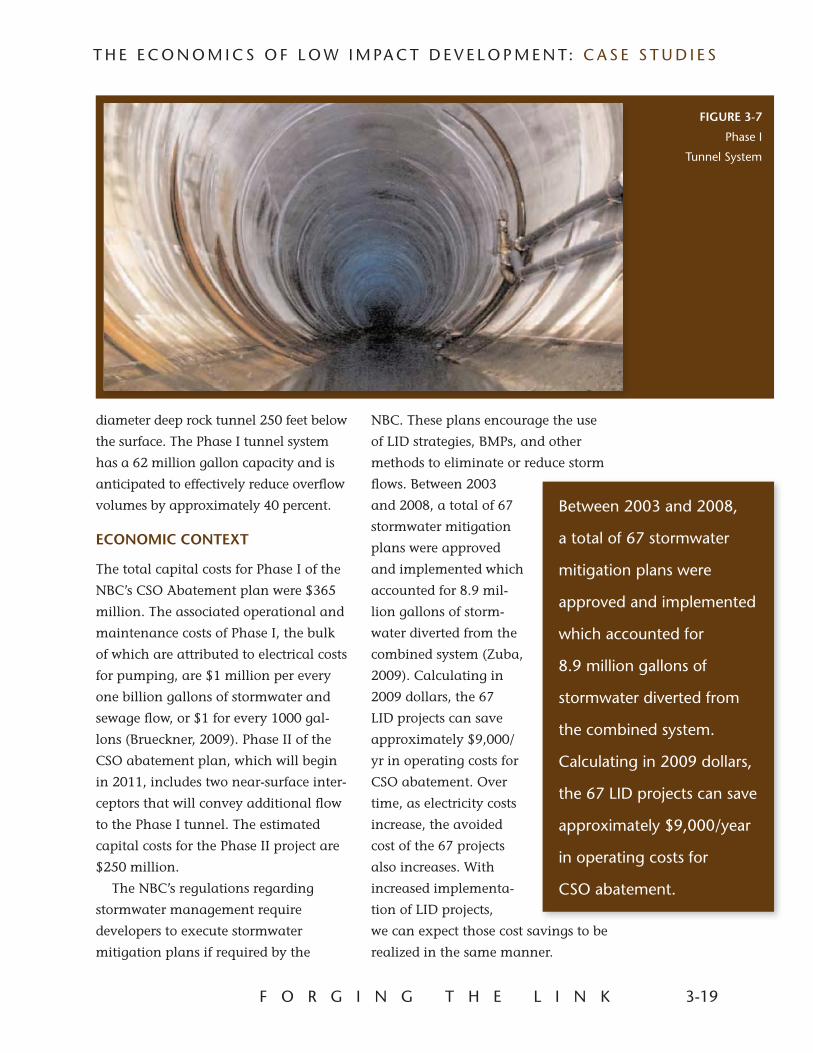
diameter deep rock tunnel 250 feet below
the surface. The Phase I tunnel system
has a 62 million gallon capacity and is
anticipated to effectively reduce overflow
volumes by approximately 40 percent.
ECONOMIC CONTEXT
The total capital costs for Phase I of the
NBC’s CSO Abatement plan were $365
million. The associated operational and
maintenance costs of Phase I, the bulk
of which are attributed to electrical costs
for pumping, are $1 million per every
one billion gallons of stormwater and
sewage flow, or $1 for every 1000 gal-
lons (Brueckner, 2009). Phase II of the
CSO abatement plan, which will begin
in 2011, includes two near-surface inter-
ceptors that will convey additional flow
to the Phase I tunnel. The estimated
capital costs for the Phase II project are
$250 million.
The NBC’s regulations regarding
stormwater management require
developers to execute stormwater
mitigation plans if required by the
NBC. These plans encourage the use
of LID strategies, BMPs, and other
methods to eliminate or reduce storm
flows. Between 2003
and 2008, a total of 67
stormwater mitigation
plans were approved
and implemented which
accounted for 8.9 mil-
lion gallons of storm-
water diverted from the
combined system (Zuba,
2009). Calculating in
2009 dollars, the 67
LID projects can save
approximately $9,000/
yr in operating costs for
CSO abatement. Over
time, as electricity costs
increase, the avoided
cost of the 67 projects
also increases. With
increased implementa-
tion of LID projects,
we can expect those cost savings to be
realized in the same manner.
Between 2003 and 2008,
a total of 67 stormwater
mitigation plans were
approved and implemented
which accounted for
8.9 million gallons of
stormwater diverted from
the combined system.
Calculating in 2009 dollars,
the 67 LID projects can save
approximately $9,000/year
in operating costs for
CSO abatement.
FIGURE 3-7
Phase I
Tunnel System
3-20 F O R G I N G T H E L I N K
T H E E C O N O M I C S O F L O W I M PA C T D E V E L O P M E N T: C A S E S T U D I E S
BACKGROUND
The City of Portland, Oregon is consid-
ered a national leader in the implemen-
tation of innovative stormwater man-
agement strategies and designs. Included
among the city’s Sustainable Stormwater
Management Programs is the Innovative
Wet Weather Program, the Green
Street Program, the Portland Eco-Roof
Program, and individual case studies
and projects that include commercial
and multifamily stormwater retrofits and
porous pavement placements.
With Portland receiving an average
of 37 inches of precipitation annually,
creating roughly 10 billion gallons of
stormwater runoff per year, these pro-
grams are very important for helping
reduce flooding and erosion as well as
minimizing CSO events.
Innovative Wet Weather ProgramThis city-wide program encourages
the implementation of stormwater
projects that improve water quality and
watershed health, reduce CSO events
and stormwater pollution, and control
stormwater runoff peaks and volumes.
The program goals include:
• Capturinganddetainingstormwater
runoff as close to the source as possible;
• Reducingthevolumeofstormwater
entering the combined sewer system;
• Filteringstormwatertoremove
pollutants before the runoff enters
groundwater, streams, or wetlands;
• Usingandpromotingmethodsthat
provide multiple environmental
benefits; and
• Usingtechniquesthatarelesscostly
than traditional piped solutions.
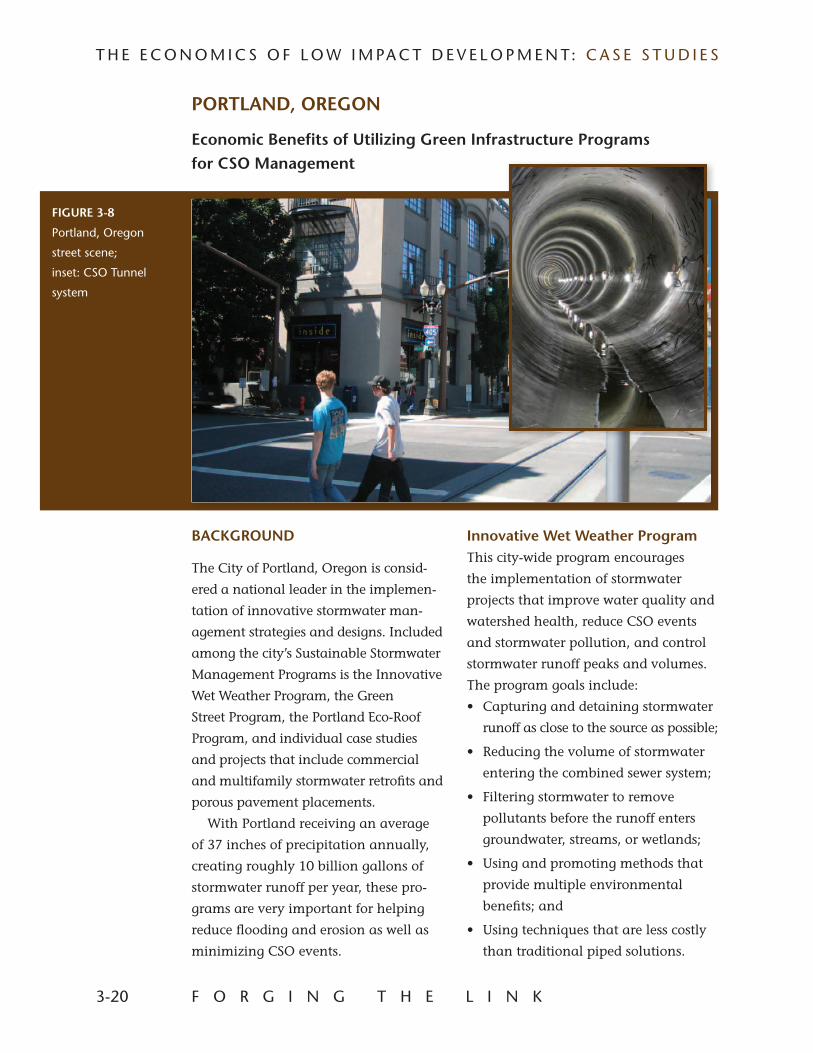
PORTLAND, OREGON
Economic Benefits of Utilizing Green Infrastructure Programs for CSO Management
FIGURE 3-8
Portland, Oregon
street scene;
inset: CSO Tunnel
system
F O R G I N G T H E L I N K 3-21
T H E E C O N O M I C S O F L O W I M PA C T D E V E L O P M E N T: C A S E S T U D I E S
Green Streets ProgramPortland’s Green Street Program
promotes the use of natural above-
ground and vegetated stormwater
controls in public and private
development in order to reduce the
amount of untreated stormwater
entering Portland’s rivers, streams, and
sewers. The program is geared towards
diverting stormwater from the city’s
overworked combined system and
decreasing the amount of impervious
surface so that stormwater can infiltrate
and recharge groundwater systems.
The program takes a sustainable and
blended approach to finding the most
optimal solution for storm and sani-
tary sewer management. This includes
overlaying and integrating green and
sustainable stormwater strategies with
traditional gray infrastructure to main-
tain or improve the city’s sewer capacity
(Dobson, 2008).
Green streets have been demon-
strated to be effective tools for inflow
control of stormwater to Portland’s
CSO system. Two such green street
designs, the Glencoe Rain Garden and
the Siskiyou Curb Extension facilities,
were shown to reduce peak flows that
cause basement sewer backups and aid
compliance with CSO regulations by
reducing runoff volumes sent to the CSO
Tunnel system (Portland, 2007).The City
of Portland also conducted simulated
storm event modeling for basement
sewer back-ups and determined that two
green street project designs would reduce
peak flows from their drainage areas
to the combined sewer by at least 80 to
85 percent. The City of Portland also
ran a simulation of a CSO design storm
and found that the same two green
street project designs retained at least 60
percent of the storm volume, which is
believed to be a conservative estimate.
ECONOMIC BENEFIT
The following sections of this case study
communicate the economic context
for both the application of LID strate-
gies in Portland, as well as the city’s
programs that promote the use of Green
Infrastructure designs for stormwater
management.
Green Streets ProgramFor the City of Portland, utilizing
green streets is the preferred strategy
for helping relieve
sewer overflow condi-
tions because it is the
most cost-effective and
eliminates the need
for expensive below-
ground repairs, which
often involve replacing
infrastructure (Dobson,
2008). As an example, a
basement flooding relief
project that was under
design was projected to
cost 60 percent less than
what would have been
the cost of a traditional pipe upsize and
replacement project. This is because the
solution, a mix of green streets and pri-
vate system disconnects, intercepts and
infiltrates the water before it enters the
public storm system thereby reducing the
need to dig up and upsize the existing
piped infrastructure (Portland, 2007).
For the City of Portland,
utilizing green streets is
the preferred strategy
for helping relieve sewer
overflow conditions
because it is the most cost-
effective and eliminates
the need for expensive
below-ground repairs.
3-22 F O R G I N G T H E L I N K
T H E E C O N O M I C S O F L O W I M PA C T D E V E L O P M E N T: C A S E S T U D I E S
COST COMPARISONS
BETWEEN GRAY AND GREEN
INFRASTRUCTURE STRATEGIES
Tabor to the River: The Brooklyn Creek Basin Program
In June of 2000, prior to implemen-
tation of the Green Street Program,
the City of Portland was faced with
the need to upgrade an undersized
sewer pipe system in the Brooklyn
Creek Basin, which extends from the
Willamette River to Mt. Tabor between
SE Hawthorne and SE Powell boule-
vards, and covers approximately 2.3
square miles. Upgrades were needed
in order to improve the sewer system
reliability, contain street flooding, stop
sewer backups from occurring in base-
ments, and help control CSOs to the
Willamette River.
At that time, the city considered con-
structing a new separated stormwater
collection system to support the exist-
ing undersize pipes in this basin. The
original cost estimate for constructing
this new system using traditional gray
infrastructure was $144 million (2009
dollars). However, following this pro-
posal, a second plan was developed that
included a basin redesign using a com-
bined gray and Green Infrastructure
approach. Including a total of $11
million allocated for green solutions,
the cost estimate for this integrated
approach was $81 million, a savings of
$63 million for the city (Portland, 2009).
The combined gray and green
approach was chosen as the 2006
Recommended Plan for the Brooklyn
Creek Basin, and includes project objec-
tives of reducing CSO events, improving
surface and groundwater hydrology,
protecting and improving sewer infra-
structure, optimizing cost-effectiveness,
boosting water quality, and enhancing
community livability.
The approved basin improvement
plan consists of 35 public and private
sector projects over the next 10-20
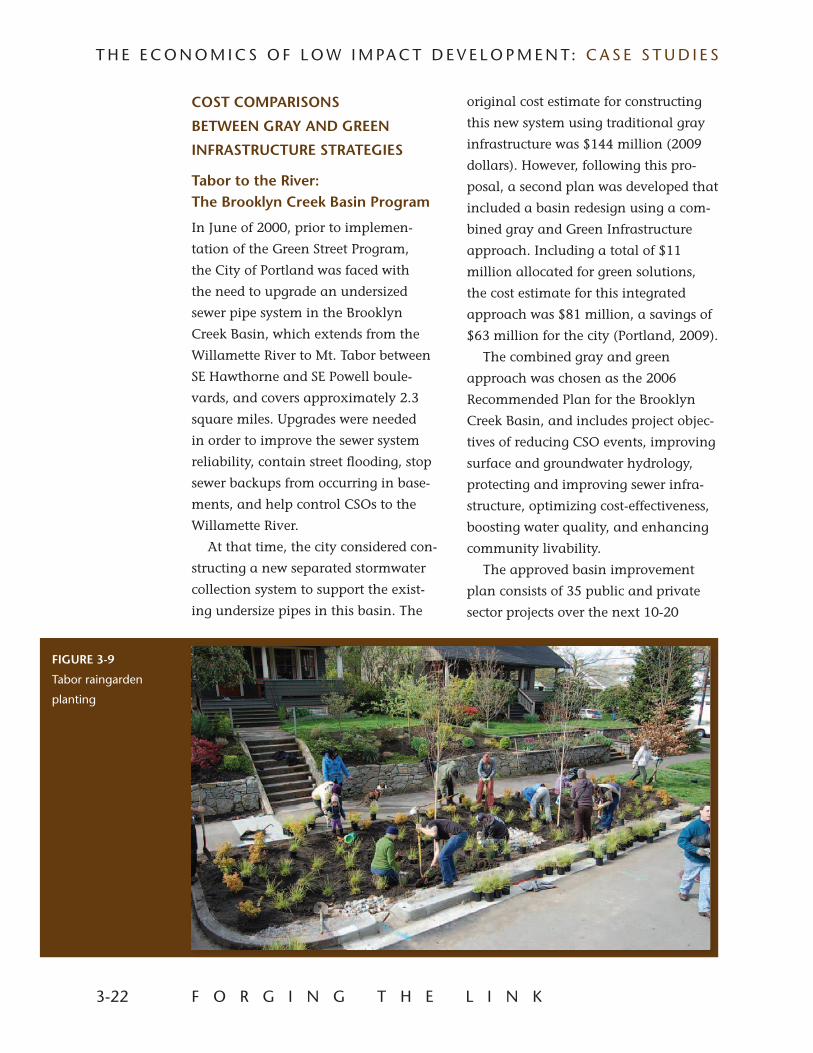
FIGURE 3-9
Tabor raingarden
planting
F O R G I N G T H E L I N K 3-23
T H E E C O N O M I C S O F L O W I M PA C T D E V E L O P M E N T: C A S E S T U D I E S
years. Gray infrastructure upgrades
include repairing or replacing 81,000
feet of combined sewer pipes, while the
Green Infrastructure strategies include
building green roofs, retrofitting park-
ing lots with sustainable stormwater
controls, planting nearly 4,000 street
trees, and adding more than 500 green
streets with vegetated curb extensions
and stormwater planters.
GREEN INFRASTRUCTURE FOR CSO COMPLIANCE: COST COMPARISONS
Portland’s combined sewer system
covers 26,000 acres and contains
4,548,000 linear feet (861 miles) of
gravity drained, combined sewer
pipe. The city’s combined system also
includes 42 separate basins connected
via three major interceptor systems and
served by three major pump stations.
The City of Portland, under federal
and state requirements as well as
stipulations from the Clean Water Act
to comply with regulations regarding
CSO management, initiated the con-
struction of a new pump station and
two CSO tunnels (West Side and East
Side CSO Tunnels) which would serve as
the primary means to protect the city’s
receiving waters from future CSO events.
However, in addition to these initiatives,
more projects and programs were needed
for providing additional CSO mitigation.
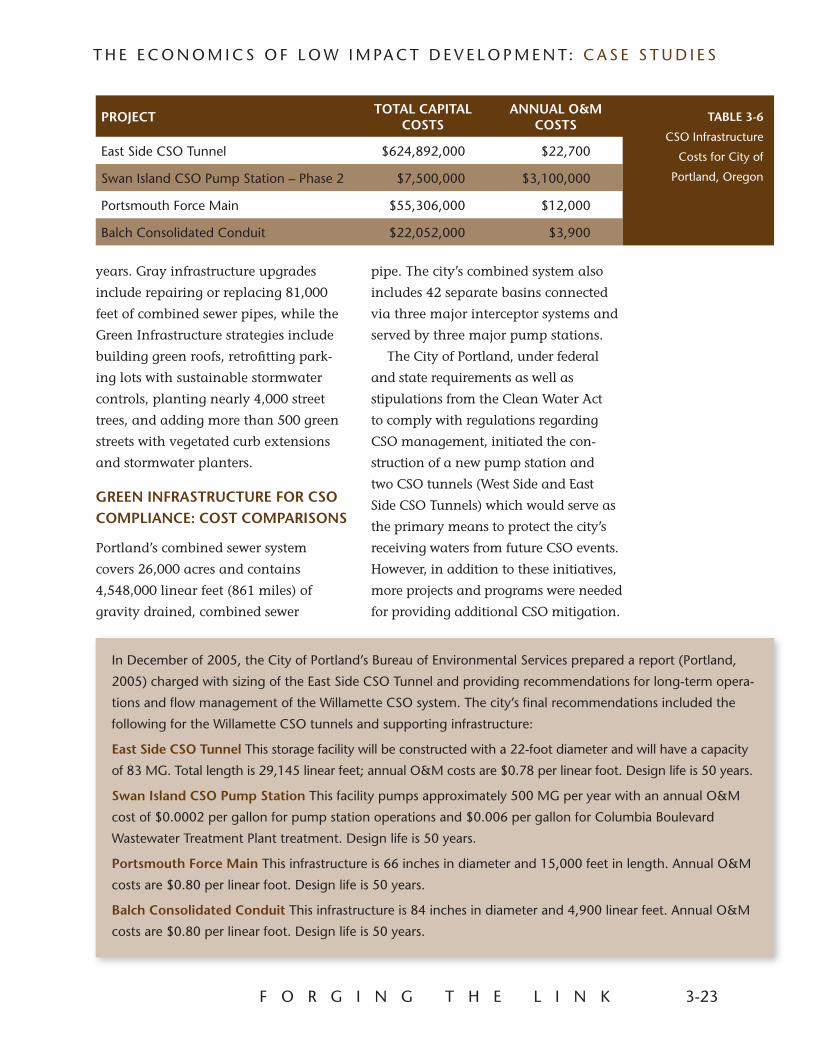
PROJECT TOTAL CAPITAL COSTS
ANNUAL O&M COSTS
TABLE 3-6
CSO Infrastructure
Costs for City of
Portland, Oregon
East Side CSO Tunnel $624,892,000 $22,700
Swan Island CSO Pump Station – Phase 2 $7,500,000 $3,100,000
Portsmouth Force Main $55,306,000 $12,000
Balch Consolidated Conduit $22,052,000 $3,900
In December of 2005, the City of Portland’s Bureau of Environmental Services prepared a report (Portland,
2005) charged with sizing of the East Side CSO Tunnel and providing recommendations for long-term opera-
tions and flow management of the Willamette CSO system. The city’s final recommendations included the
following for the Willamette CSO tunnels and supporting infrastructure:
East Side CSO Tunnel This storage facility will be constructed with a 22-foot diameter and will have a capacity
of 83 MG. Total length is 29,145 linear feet; annual O&M costs are $0.78 per linear foot. Design life is 50 years.
Swan Island CSO Pump Station This facility pumps approximately 500 MG per year with an annual O&M
cost of $0.0002 per gallon for pump station operations and $0.006 per gallon for Columbia Boulevard
Wastewater Treatment Plant treatment. Design life is 50 years.
Portsmouth Force Main This infrastructure is 66 inches in diameter and 15,000 feet in length. Annual O&M
costs are $0.80 per linear foot. Design life is 50 years.
Balch Consolidated Conduit This infrastructure is 84 inches in diameter and 4,900 linear feet. Annual O&M
costs are $0.80 per linear foot. Design life is 50 years.
3-24 F O R G I N G T H E L I N K
T H E E C O N O M I C S O F L O W I M PA C T D E V E L O P M E N T: C A S E S T U D I E S
The City’s goal was to determine which
project/program alternatives would be
the most cost-effective for long-term
CSO management. The basic metric
common to the projects identified for
CSO control was the amount of storm-
water volume that could be removed
from the CSO tunnel system. The city’s
final evaluation was based on the
relationship between project capital
costs and stormwater volume that
could be removed from the system. This
analysis took into account cumulative
capital costs, marginal costs for gal-
lons removed, and cumulative volume
removed from the system.
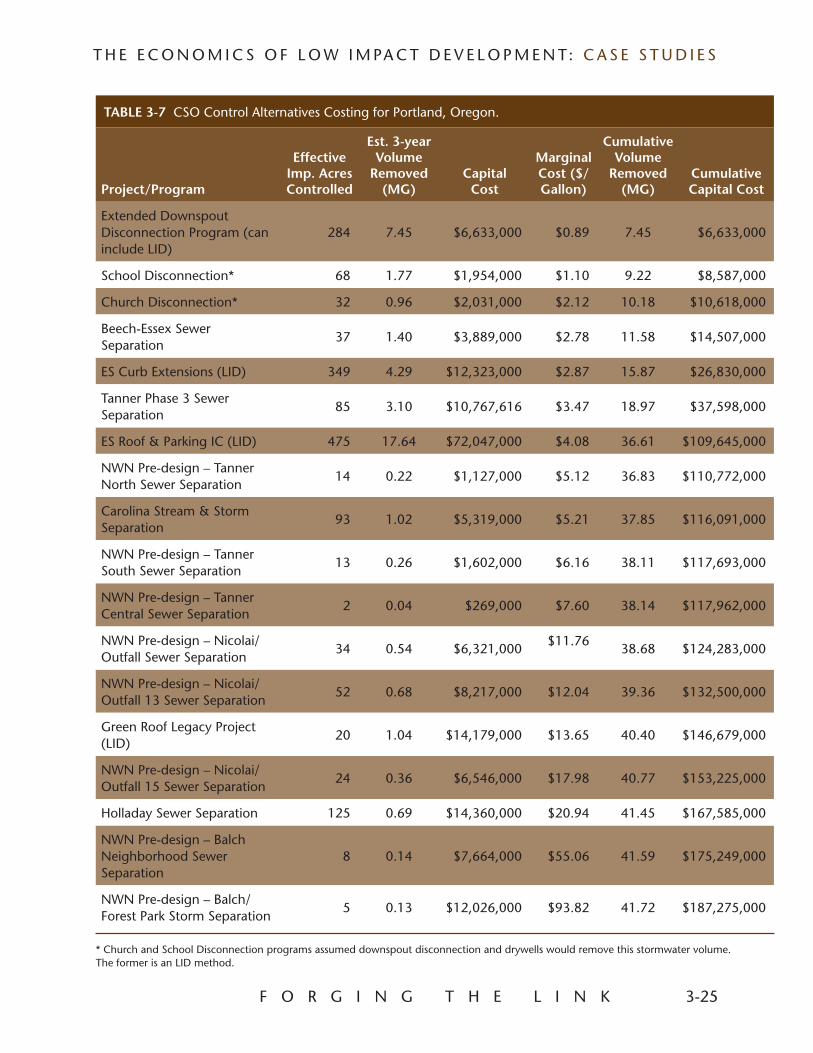
Table 3-6 shows all stormwater
separation and watershed health proj-
ects/programs considered by the City
of Portland. The projects/programs are
sorted by dollars per gallons of storm-
water that can be removed (marginal
cost). Project staff agreed that cost-effec-
tiveness was determined by an inflection
point, or knee-of-the-curve point, on a
graph that compared costs to stormwa-
ter volume that could be diverted from
the CSO system. This inflection point
was determined to be approximately
$4 per gallon removed the system.
Projects/programs costing at or below
$4 per gallon were the ones recom-
mended for further design and eventual
implementation for long-term CSO
control. These projects/programs are the
first seven listed in Table 3-7.
The projects/programs chosen on
the basis of cost-effectiveness included
the Eastside curb extension projects
(vegetated swales), the Eastside roof and
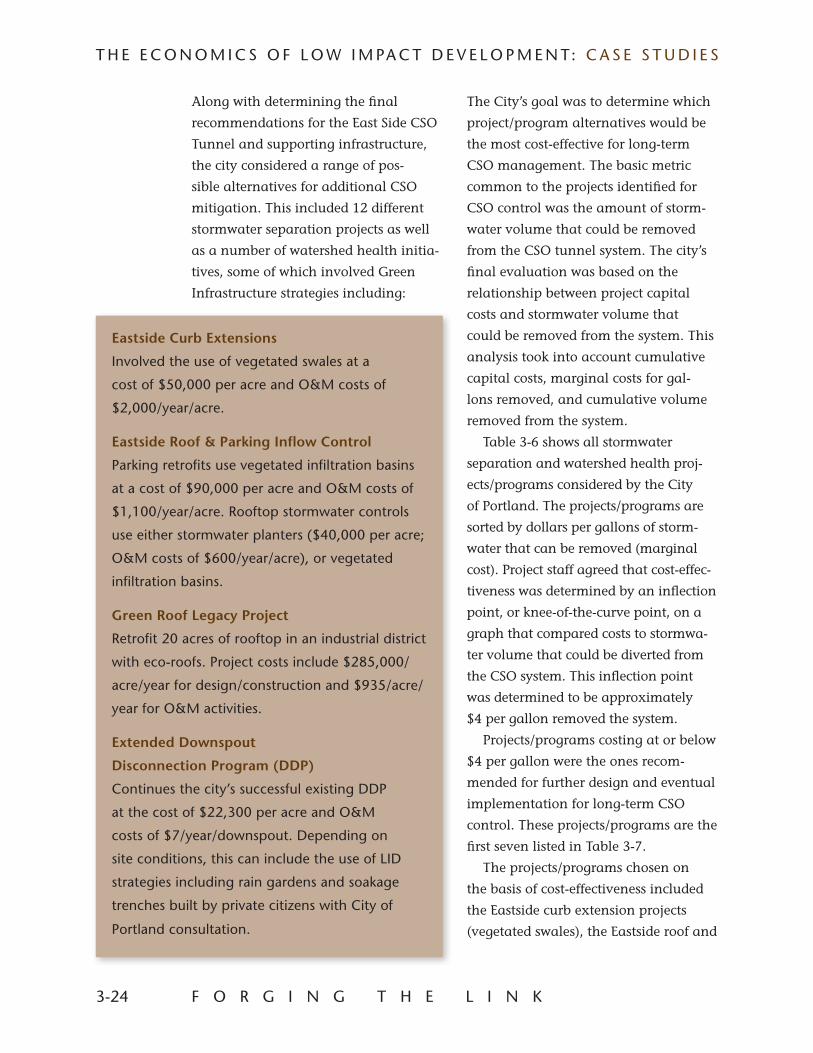
Along with determining the final
recommendations for the East Side CSO
Tunnel and supporting infrastructure,
the city considered a range of pos-
sible alternatives for additional CSO
mitigation. This included 12 different
stormwater separation projects as well
as a number of watershed health initia-
tives, some of which involved Green
Infrastructure strategies including:
Eastside Curb Extensions
Involved the use of vegetated swales at a
cost of $50,000 per acre and O&M costs of
$2,000/year/acre.
Eastside Roof & Parking Inflow Control
Parking retrofits use vegetated infiltration basins
at a cost of $90,000 per acre and O&M costs of
$1,100/year/acre. Rooftop stormwater controls
use either stormwater planters ($40,000 per acre;
O&M costs of $600/year/acre), or vegetated
infiltration basins.
Green Roof Legacy Project
Retrofit 20 acres of rooftop in an industrial district
with eco-roofs. Project costs include $285,000/
acre/year for design/construction and $935/acre/
year for O&M activities.
Extended Downspout
Disconnection Program (DDP)
Continues the city’s successful existing DDP
at the cost of $22,300 per acre and O&M
costs of $7/year/downspout. Depending on
site conditions, this can include the use of LID
strategies including rain gardens and soakage
trenches built by private citizens with City of
Portland consultation.
F O R G I N G T H E L I N K 3-25
T H E E C O N O M I C S O F L O W I M PA C T D E V E L O P M E N T: C A S E S T U D I E S
TABLE 3-7 CSO Control Alternatives Costing for Portland, Oregon.
Project/Program
Effective Imp. Acres Controlled
Est. 3-year Volume
Removed (MG)
Capital Cost
Marginal Cost ($/Gallon)
Cumulative Volume
Removed (MG)
Cumulative Capital Cost
Extended Downspout Disconnection Program (can include LID)
284 7.45 $6,633,000 $0.89 7.45 $6,633,000
School Disconnection* 68 1.77 $1,954,000 $1.10 9.22 $8,587,000
Church Disconnection* 32 0.96 $2,031,000 $2.12 10.18 $10,618,000
Beech-Essex Sewer Separation
37 1.40 $3,889,000 $2.78 11.58 $14,507,000
ES Curb Extensions (LID) 349 4.29 $12,323,000 $2.87 15.87 $26,830,000
Tanner Phase 3 Sewer Separation
85 3.10 $10,767,616 $3.47 18.97 $37,598,000
ES Roof & Parking IC (LID) 475 17.64 $72,047,000 $4.08 36.61 $109,645,000
NWN Pre-design – Tanner North Sewer Separation
14 0.22 $1,127,000 $5.12 36.83 $110,772,000
Carolina Stream & Storm Separation
93 1.02 $5,319,000 $5.21 37.85 $116,091,000
NWN Pre-design – Tanner South Sewer Separation
13 0.26 $1,602,000 $6.16 38.11 $117,693,000
NWN Pre-design – Tanner Central Sewer Separation
2 0.04 $269,000 $7.60 38.14 $117,962,000
NWN Pre-design – Nicolai/Outfall Sewer Separation
34 0.54 $6,321,000 $11.76 38.68 $124,283,000
NWN Pre-design – Nicolai/Outfall 13 Sewer Separation
52 0.68 $8,217,000 $12.04 39.36 $132,500,000
Green Roof Legacy Project (LID)
20 1.04 $14,179,000 $13.65 40.40 $146,679,000
NWN Pre-design – Nicolai/Outfall 15 Sewer Separation
24 0.36 $6,546,000 $17.98 40.77 $153,225,000
Holladay Sewer Separation 125 0.69 $14,360,000 $20.94 41.45 $167,585,000
NWN Pre-design – Balch Neighborhood Sewer Separation
8 0.14 $7,664,000 $55.06 41.59 $175,249,000
NWN Pre-design – Balch/Forest Park Storm Separation
5 0.13 $12,026,000 $93.82 41.72 $187,275,000
* Church and School Disconnection programs assumed downspout disconnection and drywells would remove this stormwater volume. The former is an LID method.
3-26 F O R G I N G T H E L I N K
T H E E C O N O M I C S O F L O W I M PA C T D E V E L O P M E N T: C A S E S T U D I E S
parking inflow control projects (veg-
etated infiltration basins & stormwater
planters), three disconnection programs
(which can include LID strategies) and
two stormwater separation projects.
LID AVOIDANCE COSTS
The City of Portland recognizes two
avoidance costs for incorporating LID
strategies with combined sewer systems.
One of these avoidance costs is
annual O&M costs to pump and
convey stormwater through the exist-
ing combined sewer system. The city
measures this by applying a rate of
$0.0001 per gallon treated and $0.0001
per gallon pumped. This equates to
an annual O&M avoidance cost of
$0.0002 per gallon.
Secondly, the City of Portland recog-
nizes an avoidance cost that benefits
the CSO system. This is based on the
relationship between project capital
costs and stormwater volume removed
from the CSO system, which was
described above. The cost-effectiveness
point for projects/programs that remove
stormwater volume from the CSO
system ($4 per gallon) is also considered
as the avoidance cost of constructing
a larger CSO tunnel. In life-cycle cost
analyses, this “savings” can reduce the
capital costs of other LID facilities that
the city builds for objectives other than
CSO control (e.g. water quality improve-
ments, basement flooding relief), but
still removes stormwater from entering
the CSO tunnels (Owen, 2009).
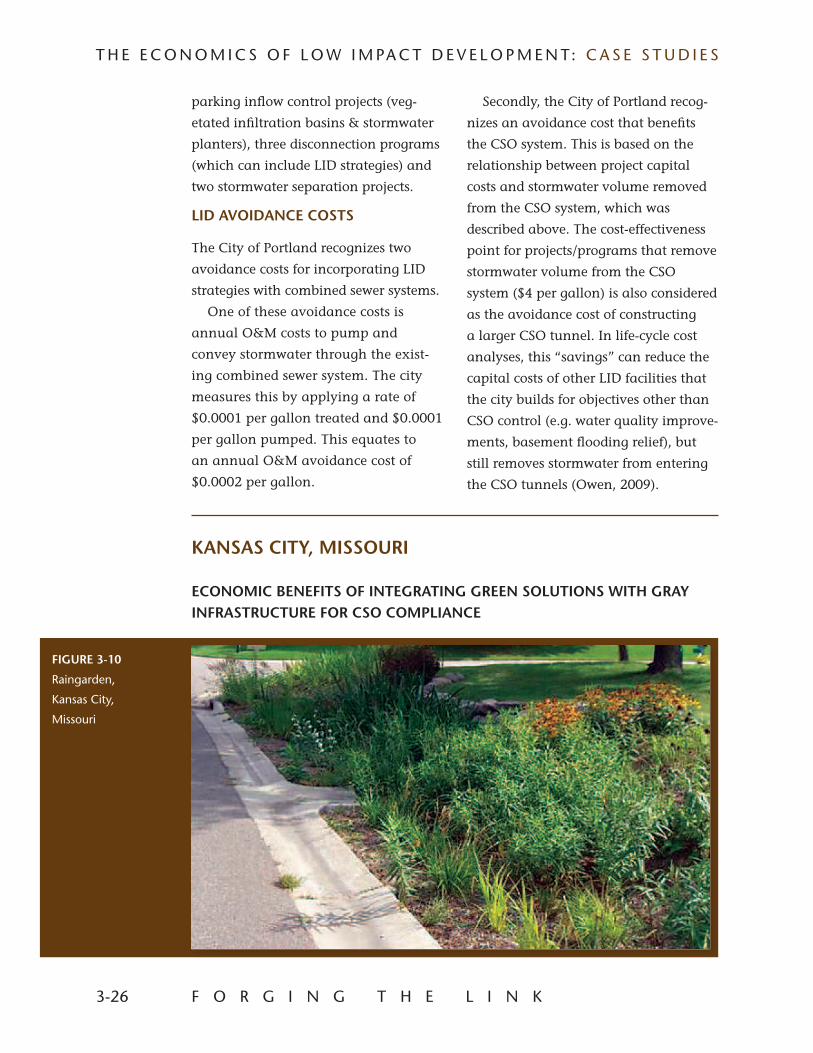
KANSAS CITY, MISSOURI
ECONOMIC BENEFITS OF INTEGRATING GREEN SOLUTIONS WITH GRAY INFRASTRUCTURE FOR CSO COMPLIANCE
FIGURE 3-10
Raingarden,
Kansas City,
Missouri
F O R G I N G T H E L I N K 3-27
T H E E C O N O M I C S O F L O W I M PA C T D E V E L O P M E N T: C A S E S T U D I E S
BACKGROUND
The City of Kansas City, Missouri has
committed to implementing a green
design initiative that will be considered
a community amenity and will work
to reduce the amount of water entering
the city’s combined system.
Under a USEPA mandate, the City
of Kansas City, Missouri is required to
update its network of aging sewer infra-
structure in order to address overflows
from its combined and separate sewer
systems. Kansas City’s 318-square mile
sewer system includes 58 square miles
of a combined system and 260 miles of
a separated system. The overall system
serves 668,000 people and includes 7
wastewater treatment plants with a
total capacity of 153 million gallons per
day (MGD).
Overflows in the combined system
amount to 6.4 billion gallons in a typi-
cal year, and on average, 12 rain events
per year are responsible for 67 percent
of this total overflow. This contributes to
the poor water quality of Kansas City’s
streams, urban lakes and rivers.
The original planned improvements
associated with upgrading the city’s
combined system include 310 MGD of
additional treatment capacity, 25 mil-
lion gallons (MG) of in-line storage, 10
separation areas, neighborhood sewer
rehabilitations, as well as pump sta-
tion and treatment plant modifications.
Three storage tunnels from 16 to 26 feet
in diameter are also proposed which
would run between 1.4 and 3.4 miles in
length and would be capable of stor-
ing 78 MG of overflow. The goals of the
improvements in the combined sewer
system are to capture 88 percent of flows,
reduce the frequency of overflow events
by 65 percent, and lower
the 6.4 billion gallons of
overflow per year down
to 1.4 billion gallons
(KCWSD(a), 2009).
The original esti-
mated capital costs asso-
ciated with overhauling
Kansas City’s total sewer
system is $2.4 billion
dollars, of which $1.4
billion would go towards
the combined system.
The yearly operations
and maintenance costs
(O&M) of this total upgrade are esti-
mated at $33 million per year.
GREEN SOLUTIONS
In developing a plan for the combined
sewer system upgrade, Kansas City
began exploring the possibility of incor-
porating Green Infrastructure strategies
in combination with gray infrastructure
improvements. The city formed a green
solutions subcommittee and later devel-
oped a green solutions position paper,
which eventually resulted in a city
council resolution directing city staff
to develop a plan to implement Green
Infrastructure strategies.
GREEN OVERFLOW CONTROL PLAN
In May of 2008 the Kansas City Water
Services Department proposed $30 mil-
lion in green solutions during the first
five years of the proposed $1.4 billion
overflow control plan. This plan included
Under a USEPA mandate,
the City of Kansas City,
Missouri is required to
update its network of aging
sewer infrastructure in order
to address overflows from
its combined and separate
sewer systems.
3-28 F O R G I N G T H E L I N K
T H E E C O N O M I C S O F L O W I M PA C T D E V E L O P M E N T: C A S E S T U D I E S
language to allow green solutions to
replace gray infrastructure. Upon review,
however, the city council determined
that additional Green Infrastructure
strategies were needed in the overflow
control plan and directed the water ser-
vices department to request a 6-month
extension for submittal
of the plan. The exten-
sion was granted by the
Missouri Department of
Natural Resources and
EPA Region 7.
The city moved ahead
in developing a more
green-orientated over-
flow control plan and
conducted reviews of
basins located within
the combined system in
order to identify areas
where green solutions could replace
gray infrastructure in whole or in-
part. High altitude desktop analyses
were performed in order to assess the
potential for shifting from gray storage
to green solutions for storage in three
major basins. The types of green solu-
tions considered included catch basin
retrofits, curb extension swales, pervious
pavement, street trees, green roofs and
stormwater planters.
Two principal assumptions were
included with these considerations.
Firstly, storage volume in green solutions
would replace an equal volume in con-
ventional storage facilities; and secondly,
each 1-MG of green storage would result
in 0.5 MGD reduction in capacity of
downstream pumping stations and treat-
ment facilities due to infiltration and
evaporation (KCWSD, 2009). Following
revisions, the city’s submitted a new plan
that proposed a total of $80 million in
green solutions programs.
ECONOMIC BENEFIT
Based on city analyses, it was deter-
mined that replacing gray infrastruc-
ture with green solutions would be
cost-effective in portions of the Middle
Blue River Basin (MBRB), a 744-acre
region with 34 percent impervious
surface. Based on calculations, the city
estimated that it should be possible to
completely replace two CSO storage
tanks with distributed green solutions
without increasing costs or reducing
CSO control performance (Leeds, 2009).
The original MBRB Plan was based
on a traditional gray infrastructure
design with controls capable of prov-
ing 3 MG of storage. The capital costs
associated with these upgrades were
estimated at $54 million, an average of
$18 per gallon, and would be capable
of reducing overflows in the MBRB to
less than 6 per year, on average.
The revised MBRB Plan is a non-
traditional design that includes gray
infrastructure projects as well as Green
Infrastructure strategies and will provide
distributed storage of at least 3.5 MG. The
revised plan would also eliminate the
need for storage tanks while still achiev-
ing the goal of reducing the amount
of overflows to less than 6 per year.
The projected costs associated with this
revised plan are $35 million, potentially
$19 million less than the original gray
infrastructure plan. However, because of
uncertainties, the green solutions project
The city estimated that
it should be possible to
completely replace two
CSO storage tanks with
distributed green solutions
without increasing costs
or reducing CSO control
performance.
F O R G I N G T H E L I N K 3-29
T H E E C O N O M I C S O F L O W I M PA C T D E V E L O P M E N T: C A S E S T U D I E S
budget has been set at $46 million. Note:
Construction uncertainties are a routine
consideration in the planning of any
construction budget. The uncertainties
will be reduced overtime as developers,
contractors, and practitioners become
more familiar with these practices.
MIDDLE BLUE RIVER BASIN GREEN SOLUTIONS PILOT PROJECT
A large-scale study was needed to test
the city’s key assumptions regarding
the performance of green solutions. As
such, the city initiated a pilot project
within a 100-acre area of the MBRB. The
MBRB Green Solutions Pilot Project will
help determine the effects of widespread
implementation of distributed storage
utilizing green solutions, infiltration, and
inflow rehabilitation on combined sewer
overflows and is potentially the larg-
est green solutions-based CSO control
project in the nation (KCWSD(b) 2009).
Green-based strategies in the pilot
area will be installed on both residential
and commercial areas and will need to
provide at least 0.5 MG of distributed
storage, replacing an equal amount
of stormwater stored in conventional
concrete tanks. Following implementa-
tion, post-construction monitoring will
be conducted to determine functionality
and performance.
GREEN SOLUTIONS UNIT COSTS
In developing unit costs for green
solutions, the city used a number of
assumptions including:
• Greenroofshaveincrementalcosts
above normal roof replacements with
3 to 4 inches of growth media provid-
ing 1 inch of storage. Incremental
capital costs associated with green
roofs are $14 per square foot.
• Deciduousstreettreeshaveinter-
ception storage of 0.032 inches, 20-foot
crown radius, with 25 gallons per tree.
• Porouspavementswouldprovide
effective storage for an area approxi-
mately 3 times its surface area.
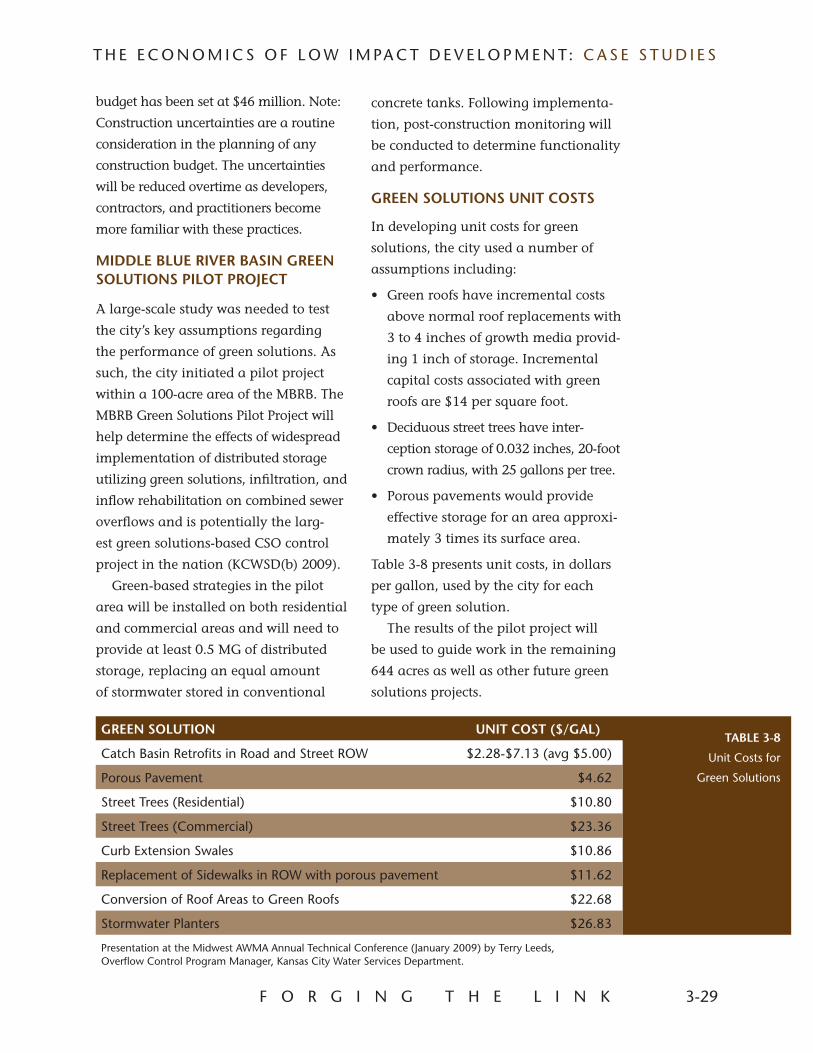
Table 3-8 presents unit costs, in dollars
per gallon, used by the city for each
type of green solution.
The results of the pilot project will
be used to guide work in the remaining
644 acres as well as other future green
solutions projects.
GREEN SOLUTION UNIT COST ($/GAL)TABLE 3-8
Unit Costs for
Green Solutions
Catch Basin Retrofits in Road and Street ROW $2.28-$7.13 (avg $5.00)
Porous Pavement $4.62
Street Trees (Residential) $10.80
Street Trees (Commercial) $23.36
Curb Extension Swales $10.86
Replacement of Sidewalks in ROW with porous pavement $11.62
Conversion of Roof Areas to Green Roofs $22.68
Stormwater Planters $26.83
Presentation at the Midwest AWMA Annual Technical Conference (January 2009) by Terry Leeds, Overflow Control Program Manager, Kansas City Water Services Department.
3-30 F O R G I N G T H E L I N K
T H E E C O N O M I C S O F L O W I M PA C T D E V E L O P M E N T: C A S E S T U D I E S
BACKGROUND
The City of Chicago has implemented
a number of innovative plans geared
towards building community resiliency
toward climate change, while promot-
ing sustainability and conservation and
is recognized as a worldwide leader in
terms of its environmental initiatives. In
addition to green building and energy
efficiency, Chicago has implemented
advanced city-wide programs that
address water quality, water efficiency,
and stormwater management.
As part of the Chicago Water
Agenda, the city is committed to man-
aging stormwater more sustainably and
encourages the use of BMPs that include
a range of Green Infrastructure designs
such as green roofs, permeable pav-
ing, filter strips, rain gardens, drainage
swales, naturalized detention basins,
as well as the use of rain barrels and
natural landscaping. These measures
are important strategies for facilitating
infiltration, improving water quality
and minimizing the potential for base-
ment flooding. BMP strategies which
divert water away from the combined
sewer system also reduce the energy
demands associated with pumping and
treating the combined sewage.
Chicago’s gravity based combined
collection system includes 4,400 miles of
sewer main lines that flow to interceptor
sewers that are owned and operated by
the Metropolitan Water Reclamation
District of Greater Chicago (MWRDGC).
The interceptor sewers are a pumped
system which conveys dry weather flow
to the MWRDGC’s treatment plants.
During storm events, excess flows are
diverted to the MWRDGC’s Tunnel and
CHICAGO, ILLINOIS
UTILIZING GREEN INFRASTRUCTURE FOR REDUCING CSS VOLUMES
Figure 3-11
City Hall,
Chicago, Illinois
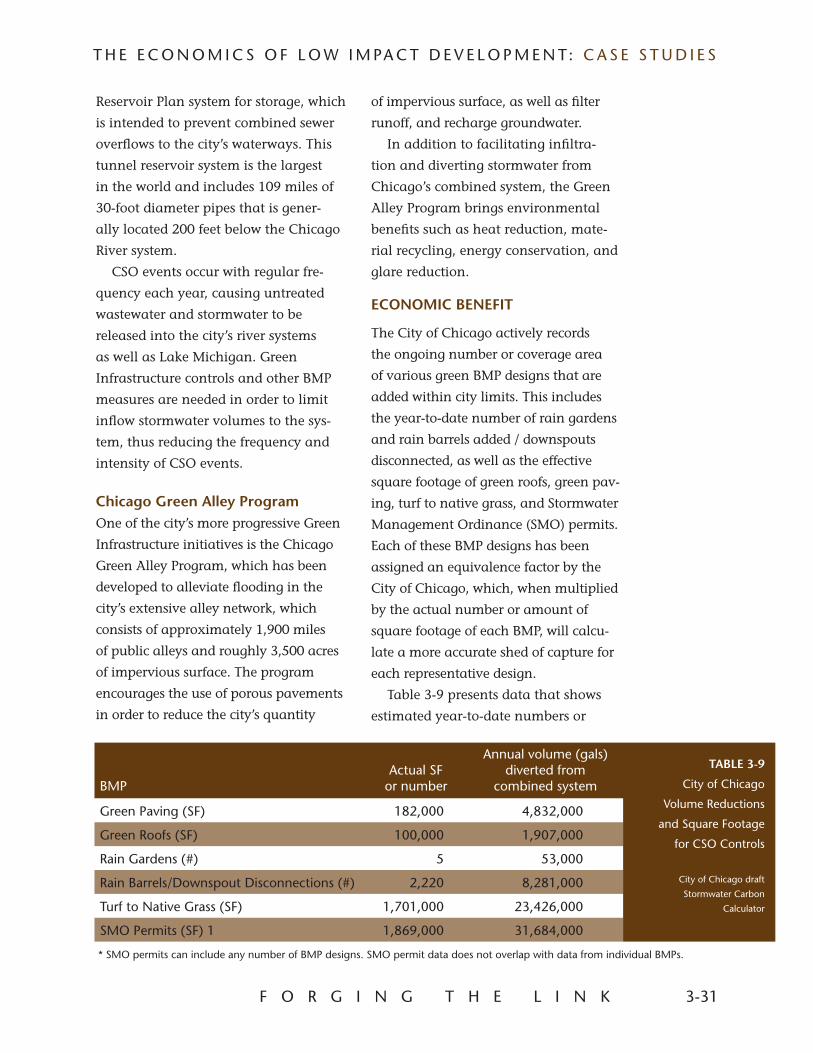
F O R G I N G T H E L I N K 3-31
T H E E C O N O M I C S O F L O W I M PA C T D E V E L O P M E N T: C A S E S T U D I E S
Reservoir Plan system for storage, which
is intended to prevent combined sewer
overflows to the city’s waterways. This
tunnel reservoir system is the largest
in the world and includes 109 miles of
30-foot diameter pipes that is gener-
ally located 200 feet below the Chicago
River system.
CSO events occur with regular fre-
quency each year, causing untreated
wastewater and stormwater to be
released into the city’s river systems
as well as Lake Michigan. Green
Infrastructure controls and other BMP
measures are needed in order to limit
inflow stormwater volumes to the sys-
tem, thus reducing the frequency and
intensity of CSO events.
Chicago Green Alley ProgramOne of the city’s more progressive Green
Infrastructure initiatives is the Chicago
Green Alley Program, which has been
developed to alleviate flooding in the
city’s extensive alley network, which
consists of approximately 1,900 miles
of public alleys and roughly 3,500 acres
of impervious surface. The program
encourages the use of porous pavements
in order to reduce the city’s quantity
of impervious surface, as well as filter
runoff, and recharge groundwater.
In addition to facilitating infiltra-
tion and diverting stormwater from
Chicago’s combined system, the Green
Alley Program brings environmental
benefits such as heat reduction, mate-
rial recycling, energy conservation, and
glare reduction.
ECONOMIC BENEFIT
The City of Chicago actively records
the ongoing number or coverage area
of various green BMP designs that are
added within city limits. This includes
the year-to-date number of rain gardens
and rain barrels added / downspouts
disconnected, as well as the effective
square footage of green roofs, green pav-
ing, turf to native grass, and Stormwater
Management Ordinance (SMO) permits.
Each of these BMP designs has been
assigned an equivalence factor by the
City of Chicago, which, when multiplied
by the actual number or amount of
square footage of each BMP, will calcu-
late a more accurate shed of capture for
each representative design.
Table 3-9 presents data that shows
estimated year-to-date numbers or
BMPActual SF
or number
Annual volume (gals) diverted from
combined system
TABLE 3-9
City of Chicago
Volume Reductions
and Square Footage
for CSO Controls
City of Chicago draft
Stormwater Carbon
Calculator
Green Paving (SF) 182,000 4,832,000
Green Roofs (SF) 100,000 1,907,000
Rain Gardens (#) 5 53,000
Rain Barrels/Downspout Disconnections (#) 2,220 8,281,000
Turf to Native Grass (SF) 1,701,000 23,426,000
SMO Permits (SF) 1 1,869,000 31,684,000
* SMO permits can include any number of BMP designs. SMO permit data does not overlap with data from individual BMPs.
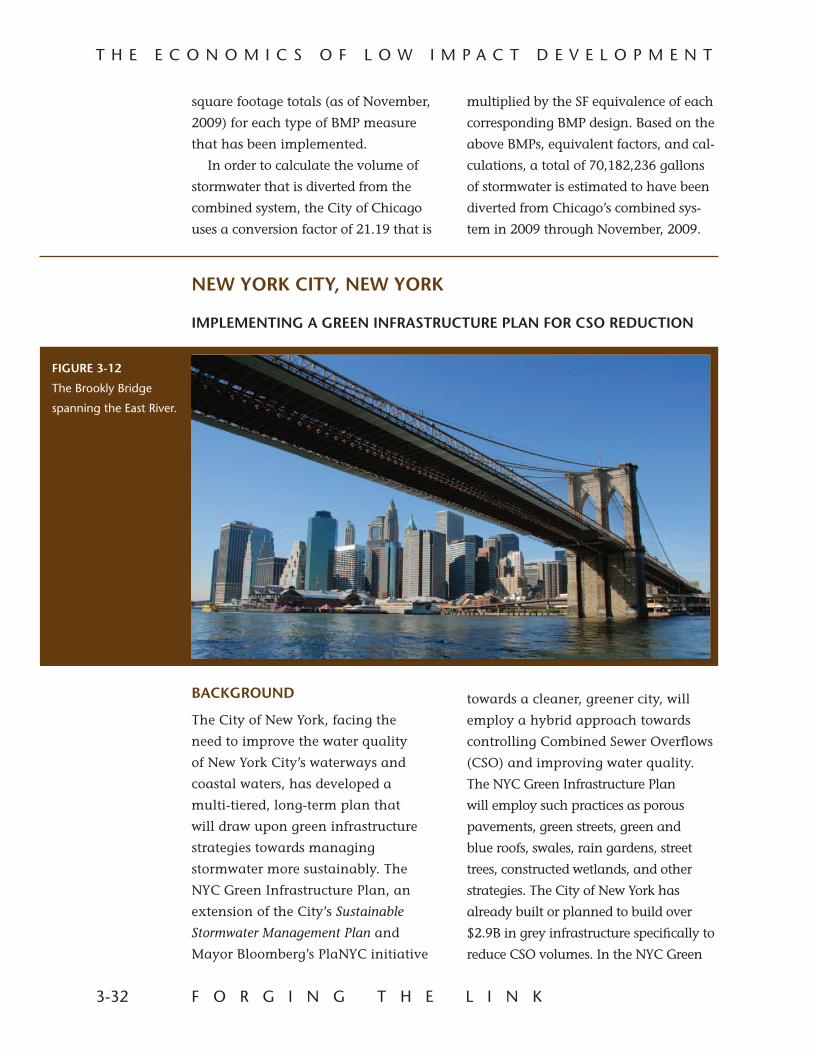
3-32 F O R G I N G T H E L I N K
T H E E C O N O M I C S O F L O W I M P A C T D E V E L O P M E N T
square footage totals (as of November,
2009) for each type of BMP measure
that has been implemented.
In order to calculate the volume of
stormwater that is diverted from the
combined system, the City of Chicago
uses a conversion factor of 21.19 that is
multiplied by the SF equivalence of each
corresponding BMP design. Based on the
above BMPs, equivalent factors, and cal-
culations, a total of 70,182,236 gallons
of stormwater is estimated to have been
diverted from Chicago’s combined sys-
tem in 2009 through November, 2009.
FIGURE 3-12
The Brookly Bridge
spanning the East River.
NEW YORK CITY, NEW YORK
IMPLEMENTING A GREEN INFRASTRUCTURE PLAN FOR CSO REDUCTION
towards a cleaner, greener city, will
employ a hybrid approach towards
controlling Combined Sewer Overflows
(CSO) and improving water quality.
The NYC Green Infrastructure Plan
will employ such practices as porous
pavements, green streets, green and
blue roofs, swales, rain gardens, street
trees, constructed wetlands, and other
strategies. The City of New York has
already built or planned to build over
$2.9B in grey infrastructure specifically to
reduce CSO volumes. In the NYC Green
BACKGROUND
The City of New York, facing the
need to improve the water quality
of New York City’s waterways and
coastal waters, has developed a
multi-tiered, long-term plan that
will draw upon green infrastructure
strategies towards managing
stormwater more sustainably. The
NYC Green Infrastructure Plan, an
extension of the City’s Sustainable
Stormwater Management Plan and
Mayor Bloomberg’s PlaNYC initiative
F O R G I N G T H E L I N K 3-33
T H E E C O N O M I C S O F L O W I M P A C T D E V E L O P M E N T
Infrastructure Plan, these are referred to
as the Cost-Effective Grey Infrastructure
Investments and are the most cost
beneficial practices to achieve their goal.
In addition, the City will also implement
measures to optimize the performance
of the existing system reduce CSO events
and reduce stormwater runoff volumes.
According to analyses by the New
York City Department of Environmental
Protection (DEP), which examined areas
of the New York Harbor where water
quality standards have not been met,
the biggest remaining challenge is to
further reduce CSOs. Since 2005, the
City has spent over $1.5 billion towards
CSO reduction including infrastructure
improvements and CSO storage facility
upgrades. A conventional approach
for CSO reduction would include the
construction of large piping networks
to store or separate stormwater and
wastewater. However, according
to the September 2010 NYC Green
Infrastructure Plan report, these types
of CSO reduction projects are very
expensive and do not provide the
sustainability benefits that New Yorkers
have come to expect from multi-
billion dollar public fund investments.
Furthermore, officials feel that while
meeting water quality goals is the
primary consideration for future DEP
investments, the long-range alternatives
it considers should also be consistent
with the City’s sustainability goals. CSO
reduction strategies, according to the
report, would be more valuable if they
incorporated a sustainable approach,
managing stormwater at its source
through the creation of vegetated
filtration (i.e. rain gardens, street
trees, constructed wetlands) and green
infrastructure.
Conclusions formulated in the City’s
Sustainable Stormwater Management Plan
found that green infrastructure could
be more cost-effective than certain large
infrastructure projects such as CSO
storage tunnels. DEP modeling efforts
demonstrated that the use of green
infrastructure in combination with
other strategies would be more effective
at controlling CSOs as compared to grey
strategies alone, but would also provide
the additional benefits of cooling
the city, reducing energy costs, and
increasing property values. Moreover,
green-based strategies would provide
further economic benefits in terms of
lower operations and maintenance
(O&M) costs, a greater distribution of
O&M costs towards jobs potentially
resulting in job creation, improved air
quality, and reducing CO2 emissions.
PERFORMANCE COMPARISONS BETWEEN GREEN AND GREY STRATEGIES
DEP evaluated and compared two
different infrastructure investment
plans for long-term CSO management
and reduction. These two plans
included a Green Strategy and a Grey
Strategy. The main components of each
respective strategy include:
Green Strategy
• GreenInfrastructure
• Cost-EffectiveGreyInfrastructure
Investments
• SystemOptimizationand
Reduced Flow
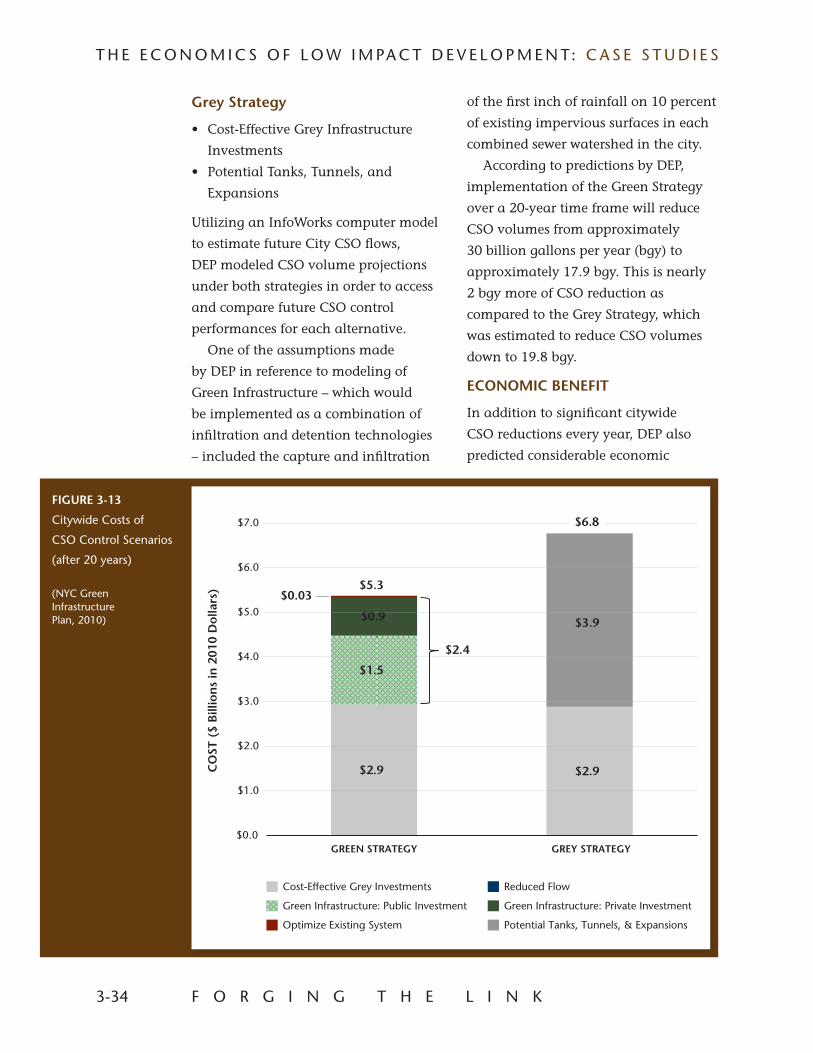
3-34 F O R G I N G T H E L I N K
T H E E C O N O M I C S O F L O W I M PA C T D E V E L O P M E N T: C A S E S T U D I E S
Grey Strategy
• Cost-EffectiveGreyInfrastructure
Investments
• PotentialTanks,Tunnels,and
Expansions
Utilizing an InfoWorks computer model
to estimate future City CSO flows,
DEP modeled CSO volume projections
under both strategies in order to access
and compare future CSO control
performances for each alternative.
One of the assumptions made
by DEP in reference to modeling of
Green Infrastructure – which would
be implemented as a combination of
infiltration and detention technologies
– included the capture and infiltration
of the first inch of rainfall on 10 percent
of existing impervious surfaces in each
combined sewer watershed in the city.
According to predictions by DEP,
implementation of the Green Strategy
over a 20-year time frame will reduce
CSO volumes from approximately
30 billion gallons per year (bgy) to
approximately 17.9 bgy. This is nearly
2 bgy more of CSO reduction as
compared to the Grey Strategy, which
was estimated to reduce CSO volumes
down to 19.8 bgy.
ECONOMIC BENEFIT
In addition to significant citywide
CSO reductions every year, DEP also
predicted considerable economic
FIGURE 3-13
Citywide Costs of
CSO Control Scenarios
(after 20 years)
(NYC Green Infrastructure Plan, 2010)
$0.0
Citywide Costs of CSO Control Scenarios (after 20 years)
$2.9 $2.9
$1.5
$0.9
$0.03
$3.9
$1.0
$2.0
$3.0
$4.0
$5.0
$6.0
$7.0
GREEN STRATEGY GREY STRATEGY
Cost-Effective Grey Investments Reduced Flow
Green Infrastructure: Public Investment Green Infrastructure: Private Investment
Optimize Existing System Potential Tanks, Tunnels, & Expansions
$6.8
$5.3
$2.4
CO
ST (
$ B
illio
ns
in 2
010
Dol
lars
)
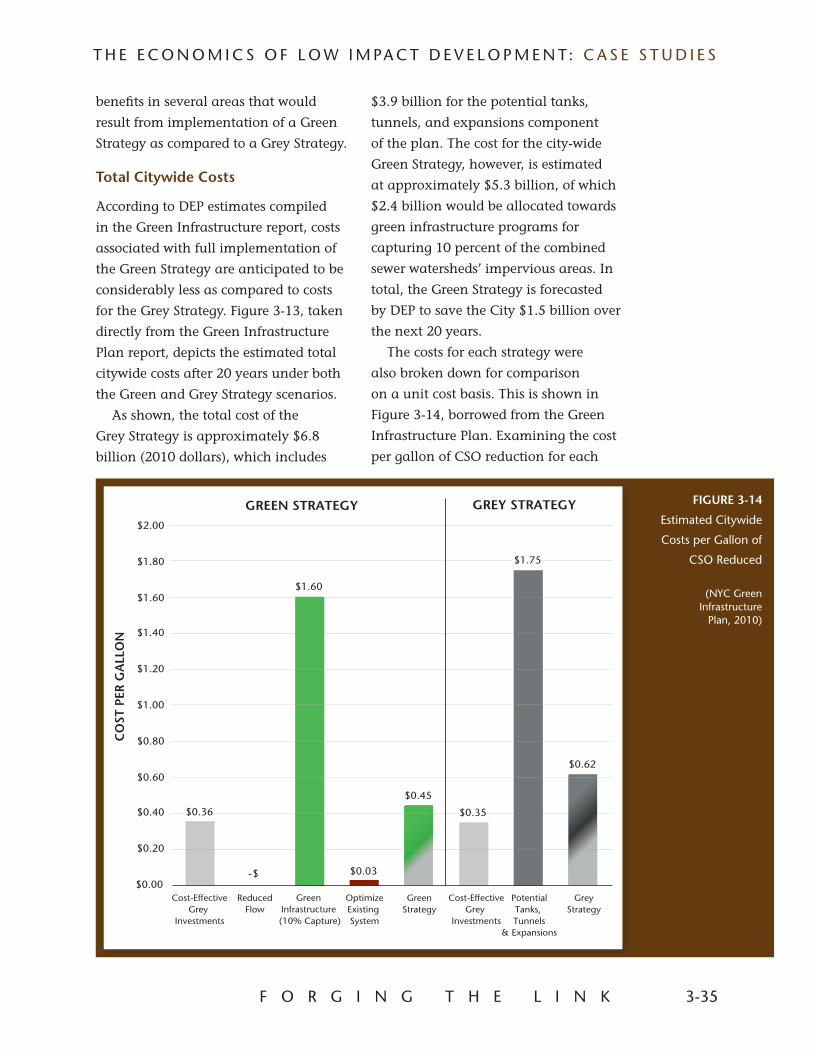
F O R G I N G T H E L I N K 3-35
T H E E C O N O M I C S O F L O W I M PA C T D E V E L O P M E N T: C A S E S T U D I E S
benefits in several areas that would
result from implementation of a Green
Strategy as compared to a Grey Strategy.
Total Citywide Costs
According to DEP estimates compiled
in the Green Infrastructure report, costs
associated with full implementation of
the Green Strategy are anticipated to be
considerably less as compared to costs
for the Grey Strategy. Figure 3-13, taken
directly from the Green Infrastructure
Plan report, depicts the estimated total
citywide costs after 20 years under both
the Green and Grey Strategy scenarios.
As shown, the total cost of the
Grey Strategy is approximately $6.8
billion (2010 dollars), which includes
$3.9 billion for the potential tanks,
tunnels, and expansions component
of the plan. The cost for the city-wide
Green Strategy, however, is estimated
at approximately $5.3 billion, of which
$2.4 billion would be allocated towards
green infrastructure programs for
capturing 10 percent of the combined
sewer watersheds’ impervious areas. In
total, the Green Strategy is forecasted
by DEP to save the City $1.5 billion over
the next 20 years.
The costs for each strategy were
also broken down for comparison
on a unit cost basis. This is shown in
Figure 3-14, borrowed from the Green
Infrastructure Plan. Examining the cost
per gallon of CSO reduction for each
FIGURE 3-14
Estimated Citywide
Costs per Gallon of
CSO Reduced
(NYC Green Infrastructure
Plan, 2010)
$0.36
$-
$1.60
$0.03
$0.45
$1.75
$0.62
$0.00
$0.20
$0.40
$0.60
$0.80
$1.00
$1.20
$1.40
$1.60
$1.80
$2.00
Cost-EffectiveGrey
Investments
Cost-EffectiveGrey
Investments
ReducedFlow
GreenInfrastructure
(10% Capture)
OptimizeExisting System
GreenStrategy
GreyStrategy
PotentialTanks, Tunnels
& Expansions
GREEN STRATEGY GREY STRATEGY
Figure 10: Estimated Citywide Costs per Gallon of CSO Reduced
CO
ST P
ER G
ALL
ON
$0.35
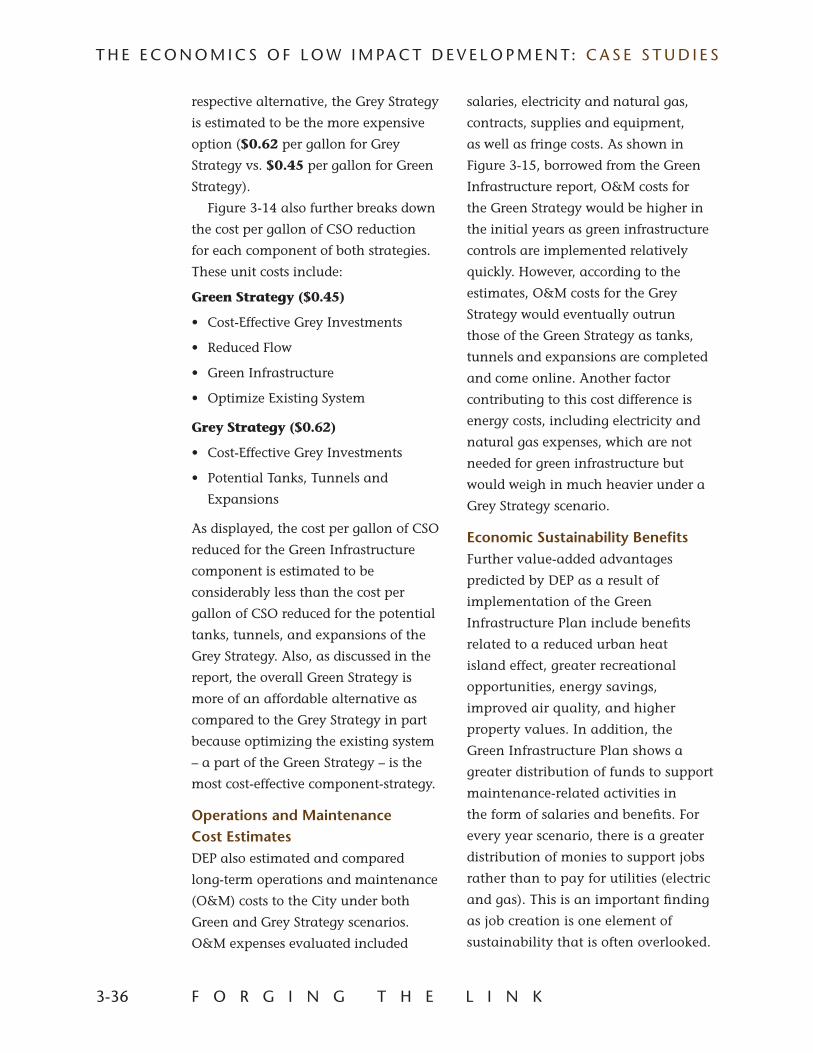
3-36 F O R G I N G T H E L I N K
T H E E C O N O M I C S O F L O W I M PA C T D E V E L O P M E N T: C A S E S T U D I E S
respective alternative, the Grey Strategy
is estimated to be the more expensive
option ($0.62 per gallon for Grey
Strategy vs. $0.45 per gallon for Green
Strategy).
Figure 3-14 also further breaks down
the cost per gallon of CSO reduction
for each component of both strategies.
These unit costs include:
Green Strategy ($0.45)
• Cost-EffectiveGreyInvestments
• ReducedFlow
• GreenInfrastructure
• OptimizeExistingSystem
Grey Strategy ($0.62)
• Cost-EffectiveGreyInvestments
• PotentialTanks,Tunnelsand
Expansions
As displayed, the cost per gallon of CSO
reduced for the Green Infrastructure
component is estimated to be
considerably less than the cost per
gallon of CSO reduced for the potential
tanks, tunnels, and expansions of the
Grey Strategy. Also, as discussed in the
report, the overall Green Strategy is
more of an affordable alternative as
compared to the Grey Strategy in part
because optimizing the existing system
– a part of the Green Strategy – is the
most cost-effective component-strategy.
Operations and Maintenance Cost EstimatesDEP also estimated and compared
long-term operations and maintenance
(O&M) costs to the City under both
Green and Grey Strategy scenarios.
O&M expenses evaluated included
salaries, electricity and natural gas,
contracts, supplies and equipment,
as well as fringe costs. As shown in
Figure 3-15, borrowed from the Green
Infrastructure report, O&M costs for
the Green Strategy would be higher in
the initial years as green infrastructure
controls are implemented relatively
quickly. However, according to the
estimates, O&M costs for the Grey
Strategy would eventually outrun
those of the Green Strategy as tanks,
tunnels and expansions are completed
and come online. Another factor
contributing to this cost difference is
energy costs, including electricity and
natural gas expenses, which are not
needed for green infrastructure but
would weigh in much heavier under a
Grey Strategy scenario.
Economic Sustainability BenefitsFurther value-added advantages
predicted by DEP as a result of
implementation of the Green
Infrastructure Plan include benefits
related to a reduced urban heat
island effect, greater recreational
opportunities, energy savings,
improved air quality, and higher
property values. In addition, the
Green Infrastructure Plan shows a
greater distribution of funds to support
maintenance-related activities in
the form of salaries and benefits. For
every year scenario, there is a greater
distribution of monies to support jobs
rather than to pay for utilities (electric
and gas). This is an important finding
as job creation is one element of
sustainability that is often overlooked.
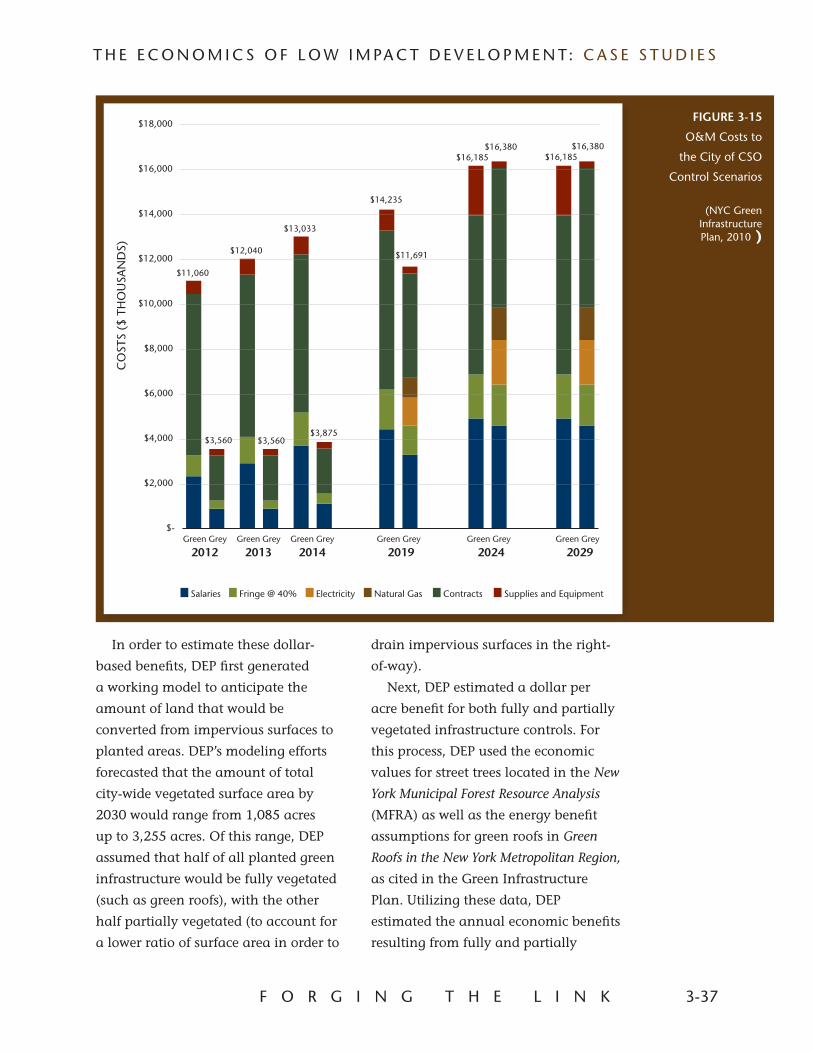
F O R G I N G T H E L I N K 3-37
T H E E C O N O M I C S O F L O W I M PA C T D E V E L O P M E N T: C A S E S T U D I E S
Figure 11: O&M Costs to the City of CSO Control Scenarios
$11,060
$12,040
$3,875
$13,033
$11,691
$14,235
$16,380$16,185 $16,185
$16,380
$-
$2,000
$4,000
$6,000
$8,000
$10,000
$12,000
$14,000
$16,000
$18,000
Green Grey Green Grey Green Grey Green Grey Green Grey Green Grey
2012 2013 2014 2019 2024 2029
Salaries Fringe @ 40% Electricity Natural Gas Contracts Supplies and Equipment
CO
STS
($ T
HO
USA
ND
S)
$3,560 $3,560
In order to estimate these dollar-
based benefits, DEP first generated
a working model to anticipate the
amount of land that would be
converted from impervious surfaces to
planted areas. DEP’s modeling efforts
forecasted that the amount of total
city-wide vegetated surface area by
2030 would range from 1,085 acres
up to 3,255 acres. Of this range, DEP
assumed that half of all planted green
infrastructure would be fully vegetated
(such as green roofs), with the other
half partially vegetated (to account for
a lower ratio of surface area in order to
drain impervious surfaces in the right-
of-way).
Next, DEP estimated a dollar per
acre benefit for both fully and partially
vegetated infrastructure controls. For
this process, DEP used the economic
values for street trees located in the New
York Municipal Forest Resource Analysis
(MFRA) as well as the energy benefit
assumptions for green roofs in Green
Roofs in the New York Metropolitan Region,
as cited in the Green Infrastructure
Plan. Utilizing these data, DEP
estimated the annual economic benefits
resulting from fully and partially
FIGURE 3-15
O&M Costs to
the City of CSO
Control Scenarios
(NYC Green Infrastructure Plan, 2010 )
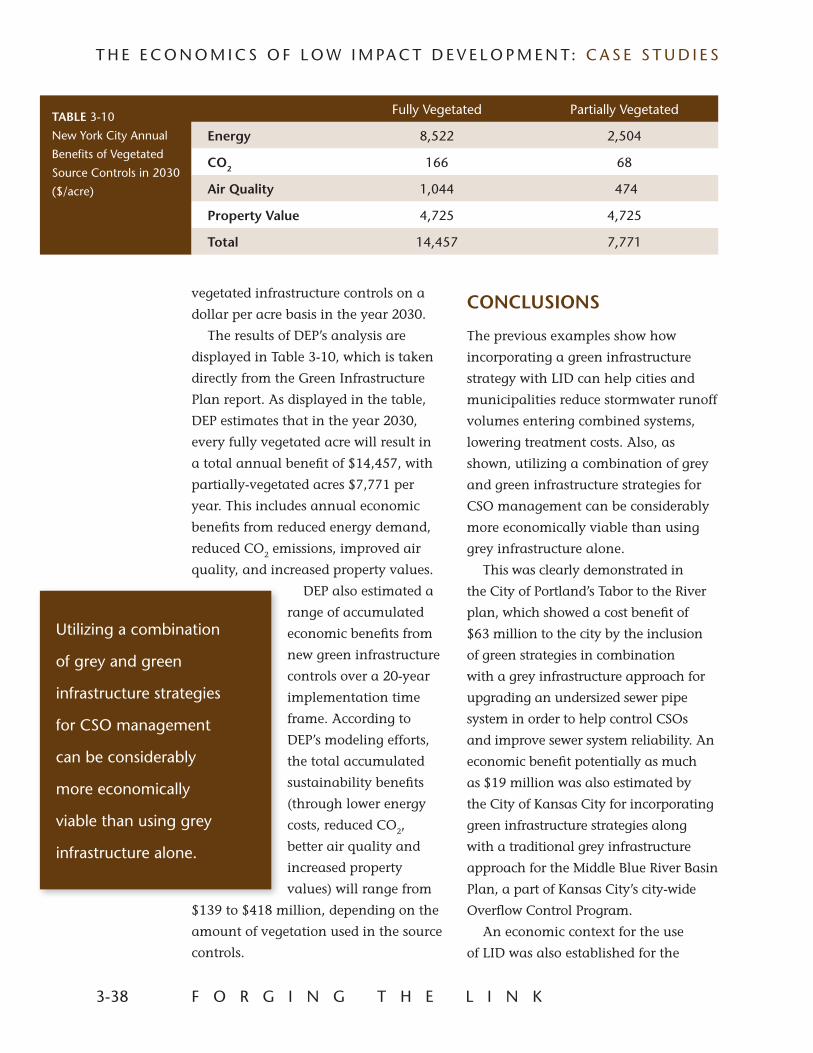
3-38 F O R G I N G T H E L I N K
T H E E C O N O M I C S O F L O W I M PA C T D E V E L O P M E N T: C A S E S T U D I E S
vegetated infrastructure controls on a
dollar per acre basis in the year 2030.
The results of DEP’s analysis are
displayed in Table 3-10, which is taken
directly from the Green Infrastructure
Plan report. As displayed in the table,
DEP estimates that in the year 2030,
every fully vegetated acre will result in
a total annual benefit of $14,457, with
partially-vegetated acres $7,771 per
year. This includes annual economic
benefits from reduced energy demand,
reduced CO2 emissions, improved air
quality, and increased property values.
DEP also estimated a
range of accumulated
economic benefits from
new green infrastructure
controls over a 20-year
implementation time
frame. According to
DEP’s modeling efforts,
the total accumulated
sustainability benefits
(through lower energy
costs, reduced CO2,
better air quality and
increased property
values) will range from
$139 to $418 million, depending on the
amount of vegetation used in the source
controls.
CONCLUSIONS
The previous examples show how
incorporating a green infrastructure
strategy with LID can help cities and
municipalities reduce stormwater runoff
volumes entering combined systems,
lowering treatment costs. Also, as
shown, utilizing a combination of grey
and green infrastructure strategies for
CSO management can be considerably
more economically viable than using
grey infrastructure alone.
This was clearly demonstrated in
the City of Portland’s Tabor to the River
plan, which showed a cost benefit of
$63 million to the city by the inclusion
of green strategies in combination
with a grey infrastructure approach for
upgrading an undersized sewer pipe
system in order to help control CSOs
and improve sewer system reliability. An
economic benefit potentially as much
as $19 million was also estimated by
the City of Kansas City for incorporating
green infrastructure strategies along
with a traditional grey infrastructure
approach for the Middle Blue River Basin
Plan, a part of Kansas City’s city-wide
Overflow Control Program.
An economic context for the use
of LID was also established for the
Utilizing a combination
of grey and green
infrastructure strategies
for CSO management
can be considerably
more economically
viable than using grey
infrastructure alone.
TABLE 3-10
New York City Annual
Benefits of Vegetated
Source Controls in 2030
($/acre)
Fully Vegetated Partially Vegetated
Energy 8,522 2,504
CO2 166 68
Air Quality 1,044 474
Property Value 4,725 4,725
Total 14,457 7,771
F O R G I N G T H E L I N K 3-39
T H E E C O N O M I C S O F L O W I M PA C T D E V E L O P M E N T: C A S E S T U D I E S
City of Portland’s overall approach
for CSO management. The City of
Portland determined that watershed
health initiatives, which included LID
and green infrastructure strategies,
were cost-effective project alternatives
for the city to implement as part
of its approach for long-term CSO
management.
Chicago’s initiatives demonstrate
the city’s commitment to using green
infrastructure for the purpose of CSO
control. Although economically-based
information depicting the future cost
of construction for CSO separation was
not available, the City of Chicago has
shown a major reduction of stormwater
volume to its combined system as a
result of LID.
Additionally, New York City
forecasted long-term performance and
economic benefits by incorporating
a CSO reduction plan that includes
green infrastructure in combination
with cost-effective grey infrastructure
investments. New York City’s estimates
also included future economic
sustainability benefits in the form of
lower energy costs, reduced emissions,
improved air quality, increased property
values, as well as a greater distribution
of operations and maintenance costs
leading to the potential for more
employment opportunities.
The projects and plans presented
in this article establish an economical
and performance-based benefit for LID
and green infrastructure. Shown in
the context of actual project designs,
incorporating these strategies alongside
grey infrastructure improvements can
result in significant cost savings for
cities pursuing and implementing CSO
management. This article demonstrates
the beneficial economic context for the
implementation of green infrastructure
and LID design for future CSO
compliance projects.
REFERENCESBrueckner, T. (2009). J. Gunderson, ed.,
Engineering Manager, Narragansett
Bay Commission.
Center for Watershed Protection (CWP)
and VA Department of Conservation
(2001). “The Economic Benefits of
Protecting Virginia’s Streams, Lakes and
Wetlands and the Economic Benefits
of Better Site Design in Virginia”
City of Chicago draft Stormwater
Carbon Calculator
Clar, M. (2003). “Case Study: Pembrook
Woods LID Development Residential
Subdivision.” Ecosite, Inc.
Dobson, L. (2008). J. Gunderson, ed.,
Program Manager For Sustainable
Stormwater Management. Portland
Bureau of Environmental Services.
KCWSD (a) (2009). “Kansas City’s
Overflow Control Program Overview.”
Kansas City Water Services
Department, Kansas City, Missouri.
KCWSD (b) (2009). Middle Blue River
Basin Green Solutions Pilot Project:
Meeting the O&M Challenges of
Sustaining Green Infrastructure. Kansas
City Water Services Department.
Knack, Stephen and Keefer, Philip (1997).
Does Social Capital Have an Economic
Payoff? A Cross-Country Investigation.
The Quarterly Journal of Economics,
Vol 112, No. 4, pp 1251-1288
3-40 F O R G I N G T H E L I N K
T H E E C O N O M I C S O F L O W I M PA C T D E V E L O P M E N T: C A S E S T U D I E S
Leeds, Terry (2009). Overflow Control
Program Presentation at the Midwest
AWMA Annual Technical Conference.
MacMullan, E. (2007). “Economics of
LID.” EcoNorthwest, Eugene, OR.
MacMullan, Ed (2010). Using Incentives
to Promote Green Stormwater
Practices. ECONorthwest. 2010
ACWA Conference.
Mohamed, R. (2006). “Economics of
Conservation Subdivisions.” Urban
Affairs, Review 41 No. 3.
NYC Green Infrastructure Plan (2010)
City of New York.
Owen, B. (2009). “Interview.” J.
Gunderson, ed., Engineering Services
with the City of Portland, Bureau of
Environmental Services.
Portland (2005). “CSO Sizing and
Flow Management Final Predesign
Report.” Portland Bureau of
Environmental Services.
Portland (2007). “Green Street
Policy.” Portland Bureau
of Environmental Services,
Portland, OR.
Portland (2009). “Brooklyn Creek
Basin: Project Objects.” Portland
Bureau of Environmental Services.
USEPA (2007). Reducing Stormwater
Costs through Low Impact
Development (LID) Strategies and
Practices.
Zuba, J. (2009). J. Gunderson, ed.,
Permits Manager, Narragansett
Bay Commission.