Embed Size (px)
Citation preview
Linear vs. Rotational Skin Friction
C r a i g I n g h a m
2 0 0 8 3 8 3 7 1
5 t h Y e a r M E n g S p o r t s E n g i n e e r i n g
5 6 5 0 1 – R e s e a r c h S t u d i e s
S u p e r v i s o r – M u h a m m a d A m i r
1 2 / 3 / 2 0 1 3
“A deductive evaluation of the Securisport
tests suitability for the analysis of skin
friction on football turf.”

Craig Ingham 1
Statement of Academic Honesty I declare that this submission is entirely my own original work.
I declare that, except where fully referenced direct quotations have been included, no aspect of this
submission has been copied from any other source.
I declare that all other works cited in this submission have been appropriately referenced.
I understand that any act of Academic Dishonesty such as plagiarism or collusion may result in the
non-award of my degree.
Signed …………………….…………………...
Dated …….…………………………………….
Craig Ingham 2
Acknowledgements There are a number of people who made this research possible and allowed me to carry out the
necessary work. Firstly, I would like to thank Niall MacPhee from Sports Labs Ltd who provided the
research topic and helped immensely along the way to carry out the work by providing equipment,
guidance and information. Thanks go to my supervisor, Muhammad Amir, for his academic support
and guidance throughout the project. I would also like to thank my family and friends, who have
been a continual source of comfort and support when motivation was lacking. Thanks must go to
Powerleague Townhead, Glasgow, who waived the fee to utilise their facilities and carry out my
observations Last, but not least, I would like to thank the participants in my data collection study,
without whom, the research would not have been possible.
Craig Ingham 3
Abstract This research aimed to either validate or invalidate the current FIFA procedure for analysing the
frictional properties between human skin and artificial turf. A review of literature indicated that skin
friction is a widespread problem with artificial turf and that the current procedure of testing is
inadequate at truly representing the interaction between the skin and turf in real life. No literature
was available that documented the characteristics of a sliding tackle and therefore structured
observations were carried out to evaluate the characteristics of a sliding tackle. Five participants
took part and the research suggests that the current testing procedure does not simulate human
motion with regards to the sliding challenge and therefore the test cannot be accurate. The research
suggests that the testing procedure used should utilise a linear motion of exposure to the turf at a
speed of 7m/s.
Key words - friction, skin, artificial turf
Word Count – 14,037(excluding; abstract, acknowledgements, tables, references, bibliography, and
appendices)
Craig Ingham 4
Journal Selection This research has been written for submission to the Journal of Sports Sciences as it falls within the
remit of this particular journal. As the research covers a wide variety of areas and disciplines, a
number of journals were considered for submission. It was felt that the journal of sports sciences
was the most appropriate as it covers areas such as the evaluation of sporting equipment in addition
to its emphasis of human science applications to the sporting world. The journal had an impact
factor of 1.93 in 2011 and requests the manuscript to be prepared in adherence to the following
guidelines;
Double line spacing
Include an abstract of 200 words or less
The inclusion of three to six keywords
Direct quotations using double quotation marks
Sequentially numbered sections
Craig Ingham 5
Contents Statement of Academic Honesty ............................................................................................................ 1
Acknowledgements ................................................................................................................................. 2
Abstract ................................................................................................................................................... 3
Journal Selection ..................................................................................................................................... 4
List of Figures .......................................................................................................................................... 7
List of Tables ........................................................................................................................................... 8
1.0 Context of Project ............................................................................................................................. 9
2.0 Introduction .................................................................................................................................... 10
2.1 Aim and Objectives ..................................................................................................................... 11
3.0 General Project Approach ............................................................................................................... 11
3.1 Research Philosophy ................................................................................................................... 11
3.2 Research Approach ..................................................................................................................... 13
3.3 Research Methodology ............................................................................................................... 14
4.0 Literature Review ............................................................................................................................ 15
4.1 Current State of Artificial Turf ..................................................................................................... 15
4.2 Review of Laboratory Testing Procedure .................................................................................... 17
4.2.1 Disadvantages of Testing Procedure .................................................................................... 20
4.3 Player Perceptions ...................................................................................................................... 22
4.4 Injuries ........................................................................................................................................ 24
4.5 Friction ........................................................................................................................................ 26
4.6 Anatomy of the Skin .................................................................................................................... 29
Craig Ingham 6
4.7 Skin Friction and Injuries ............................................................................................................. 31
4.8 Previous Work on the Test .......................................................................................................... 33
4.9 Summary of Literature Review ................................................................................................... 35
5.0 Knowledge Gap ............................................................................................................................... 37
6.0 Hypotheses ..................................................................................................................................... 38
7.0 Research Methodology ................................................................................................................... 38
7.1 Data Collection Method .............................................................................................................. 39
8.0 Observational Design ...................................................................................................................... 39
8.1 Observational Method ................................................................................................................ 40
8.1.1 Setup .................................................................................................................................... 40
8.1.2 Data Acquisition Method ..................................................................................................... 43
8.1.2 Pilot Study ............................................................................................................................ 43
8.1.3 Participants .......................................................................................................................... 44
8.1.4 Procedure ............................................................................................................................. 44
9.0 Results ............................................................................................................................................. 45
9.1 Speed Results .............................................................................................................................. 45
9.2 Direction Results ......................................................................................................................... 46
9.3 Slide Time Results ....................................................................................................................... 48
10.0 Discussion...................................................................................................................................... 48
10.1 Results Discussion ..................................................................................................................... 49
10.2 Research Discussion .................................................................................................................. 51
10.3 Limitations of Research Conducted .......................................................................................... 53
Craig Ingham 7
10.4 Future work ............................................................................................................................... 55
10.5 Recommendations for Adaptations to Testing Procedure ....................................................... 56
11.0 Conclusions ................................................................................................................................... 57
12.0 References .................................................................................................................................... 58
13.0 Bibliography .................................................................................................................................. 60
14.0 Appendices .................................................................................................................................... 61
14.1 Appendix 1 - FIFA Skin Friction Testing Guidelines ................................................................... 61
14.2 Appendix 2 - Participant Information Sheet ............................................................................. 65
14.3 Appendix 3 - Consent Form....................................................................................................... 68
List of Figures Figure 1 - Research 'onion' (Saunders, Lewis, and Thornhill, 2012) ..................................................... 12
Figure 2 - Research Methodology (Thomas et al. 2005) ....................................................................... 14
Figure 3 - Cross Section of Third Generation Turf ................................................................................ 16
Figure 4 - Securisport Testing Equipment ............................................................................................. 17
Figure 5 - Results From Securisport Test .............................................................................................. 19
Figure 6 - Mean Score of Artificial Turf for Various Weather Condition(adapted from Zanetti, 2009) 23
Figure 7 - Coefficient of Friction Equations .......................................................................................... 27
Figure 8 - Skin Anatomy (Hawaii dermatology, 2012) .......................................................................... 30
Figure 9 - Blister .................................................................................................................................... 32
Figure 10 - Abrasion .............................................................................................................................. 33
Figure 11 - Simplified Version of the Research Methodology (Thomas et al. 205) .............................. 38
Figure 12 - Birdseye View of Observational Setup ................................................................................ 41
Figure 13 - Camera Positions ................................................................................................................ 42
Craig Ingham 8
Figure 14 - Speed Calculation Utilised in Data Acquisition ................................................................... 43
Figure 15 - Example start and End Points of the Speed Calculations ................................................... 45
Figure 16- Direction of Sliding ............................................................................................................... 47
Figure 17 - Images of Marks left by Sliding Tackles .............................................................................. 47
Figure 18 - Marks Left on the Pitch Following a Slide Tackle and the Securisport Test ....................... 53
List of Tables Table 1 - Factors Influencing Frictional Behaviour (adapted from Blau, 2001) .................................... 27
Table 2- Speed Data From the Observations ........................................................................................ 46
Table 3- Slide Times from Observations ............................................................................................... 48
List of Equations Equation 1 - Linear Speed of Friction Test ............................................................................................ 21

Craig Ingham 9
1.0 Context of Project This research has been done in conjunction with Sports Labs Ltd, a sports surface consultancy and
testing firm located in Livingston. The firm conduct a range of tests on a variety of different sports
surfaces in line with the handbooks of test methods governing bodies of sports such as football and
rugby. The company has asked for one of their tests, the Securisport to be validated or invalidated as
there have been concerns within the firm and further afield as to the suitability of the test.

Craig Ingham 10
2.0 Introduction With the rapid growth of artificial football pitches, there are an increasing number of manufacturers
vying to have their product installed in stadiums and community based facilities around the world. In
order to ensure that only the highest quality turf is used, the sport’s governing body, FIFA, has a
stringent testing procedure that is uses to test the turf (FIFA, 2012). Surfaces are first tested for
many facets of the game within registered laboratories and if the surface successfully negotiates
these tests, it is then installed before a final round of testing takes place to ensure that the
installation of the turf has been done to a high standard. The tests allow a pitch to be certified by
FIFA to stipulate the level of football that can be played on the pitch, ranging from community up to
international level (Zanetti, 2009).
One of the most crucial tests is the Skin Friction and Abrasion test, as the propensity for artificial turf
to cause friction induced heat damage to the skin during sliding has long been disputed (Meyers &
Barnhill, 2004). Currently FIFA utilise a machine called the Securisport II in order to carry out the skin
friction test followed by a simple abrasion test to analyse the effect the turf has on the skin. The
current test utilises a 360° rotational motion of a test foot, covered with a silicon skin (replicating
human skin) sliding against the turf at a set speed with the coefficient of friction measured between
the turf and skin to ensure it is below a level stipulated by FIFA.
This test has been used for a number of years to analyse the frictional properties between artificial
turf and human skin; however there has been little work done on analysing the effectiveness of the
test and the suitability of the current testing protocol. This study analyses the literature surrounding
the testing procedure and associated areas to identify a gap in knowledge. From this a focus was put
on the lack of biofidelity (the ability of the test to replicate true human motion) within the current
test, in particular the direction and speeds at which the friction occurs. Following this,
recommendations have been made on how the current testing procedure could be improved upon
based on the results of this study.
Craig Ingham 11
2.1 Aim and Objectives The aim of this research is to validate or invalidate the current Securisport test protocol and
methodology to give support for future tests or to provide ideas for future development of the
testing procedure.
In order to achieve the overall aim of the research, a number of objectives have been set that need
to be fulfilled in order to meet this aim.
Investigate the current testing procedure and protocol
Identify a knowledge gap in the literature surrounding the test that can be filled to impact
upon the testing procedure
Create a hypothesis to predict how this information will impact on the testing procedure
Design and carry out an experiment to validate on invalidate the current testing protocol
Analyse and discuss the results, linking them back to the literature
3.0 General Project Approach In order to ensure that a knowledge gap is filled with reliable information, it is important to adopt an
approach to carrying out the project. When carrying out research, one of the main challenges is
making sense of the vast quantity and diversity of the literature available and the adoption of a
structured approach will enable the outcomes of the project to be valid and dependable (White,
2000). The approach taken for the project encompasses a philosophy in addition to an approach that
will be adopted for the research. The following sections detail the philosophy, research approach
and the methodology chosen for the project along with the rationale behind the selection of these.
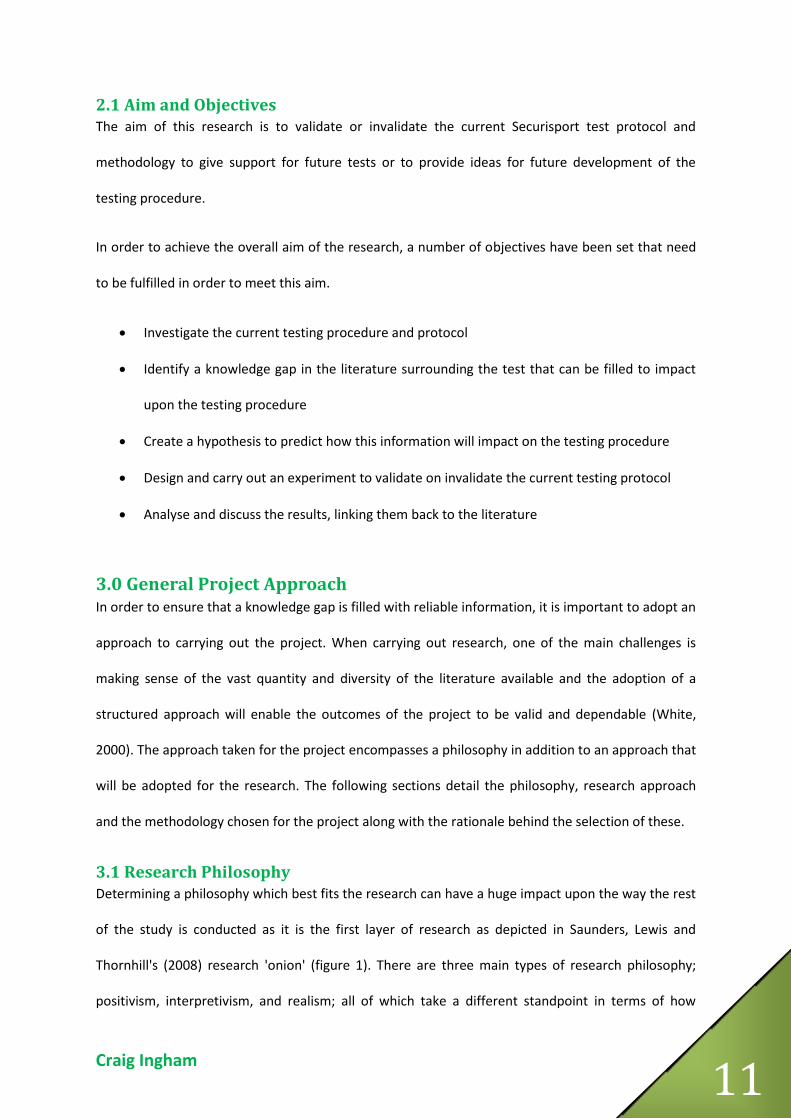
3.1 Research Philosophy Determining a philosophy which best fits the research can have a huge impact upon the way the rest
of the study is conducted as it is the first layer of research as depicted in Saunders, Lewis and
Thornhill's (2008) research 'onion' (figure 1). There are three main types of research philosophy;
positivism, interpretivism, and realism; all of which take a different standpoint in terms of how
Craig Ingham 12
research should be viewed and carried out. The choice of a research philosophy helps to enable the
rationale behind choices in the research further down the line such as data collection methods
which are located at the centre of the 'onion'.
Figure 1 - Research 'onion' (Saunders, Lewis, and Thornhill, 2012)
Positivism is a scientific approach to research that is generally based on quantitative data and
assumes that "only that which can be scientifically verified or which is capable of logical or
mathematical proof..." (Oxford, 2012) can be recognised. On the contrary, interpretivists argue that
the social world "is far too complex to lend itself to theorising by definite 'laws' in the same way as
physical sciences" (Saunders, et al., 2012). Thus the interpretivist philosophy utilises a qualitative
approach to collecting data by gaining the insights of people. The realism approach agrees with the
positivist approach in that it uses a scientific approach to collect data, however it also recognises
Craig Ingham 13
that intepretivism can be used to understand the results; essentially creating a middle ground
between the positivism and interpretivism philosophies.
For this study, where the current Securisport test will be validated or invalidated, a positivist
approach will be taken as the research will be driven by observed results that will be analysed to
evaluate the current testing protocol.
3.2 Research Approach Within the research philosophy that has been selected, a research approach has also been adopted
for the project. Thomas et al. (2005), highlighted two main approaches to research; deductive and
inductive reasoning. Deductive reasoning is associated with the positivist philosophy and starts with
a theory to explain events before a hypothesis is created that is then tested against reality to analyse
if the hypothesis is correct. The inductive approach on the other hand, uses collected data to form
hypotheses and theories. This approach is associated with the interpretivism philosophy and often
utilises small groups of people to collect qualitative data for analysis.
A deductive approach will be adopted to coincide with the positivist philosophy of the project. This
approach is most suited to the research as quantifiable results are required in order to evaluate the
current Securisport equipment and testing procedure effectively.
Craig Ingham 14
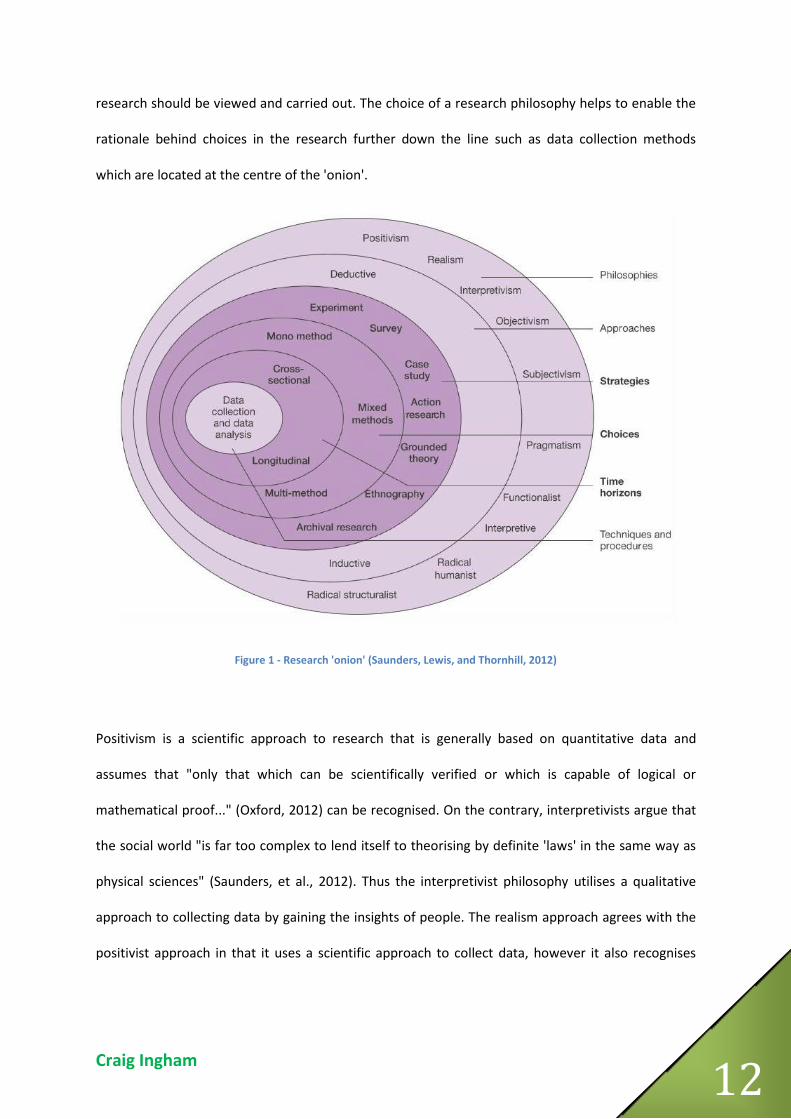
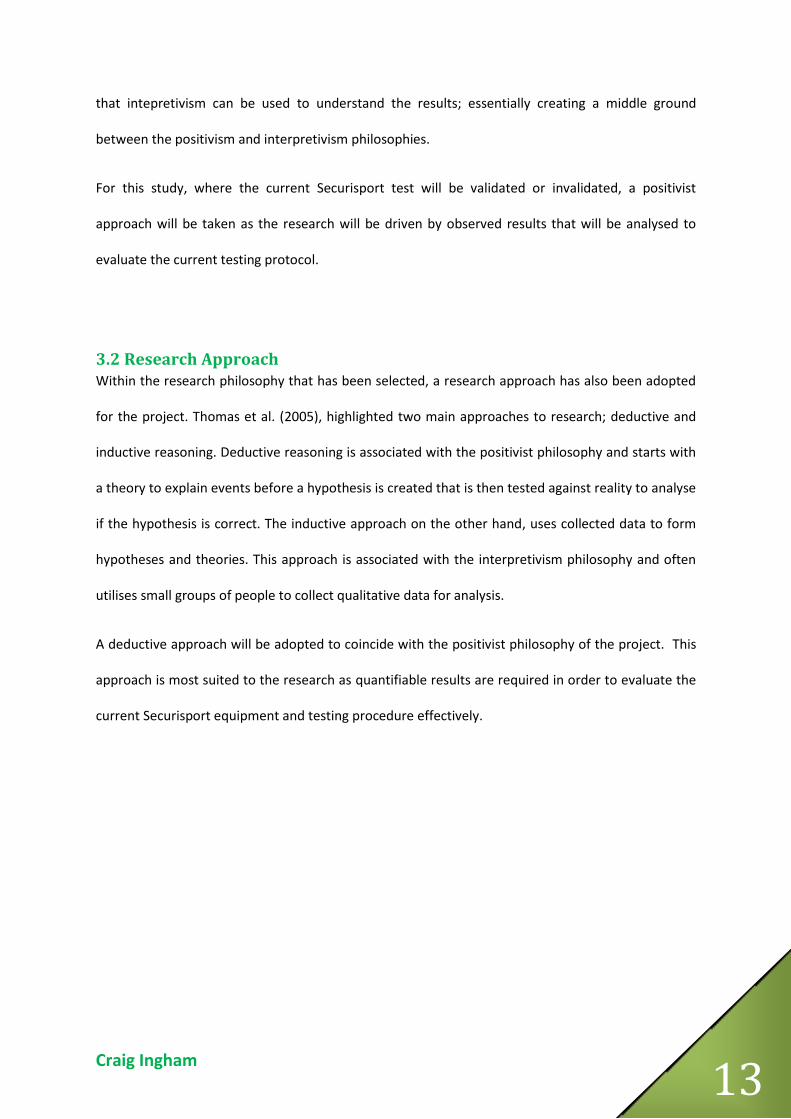
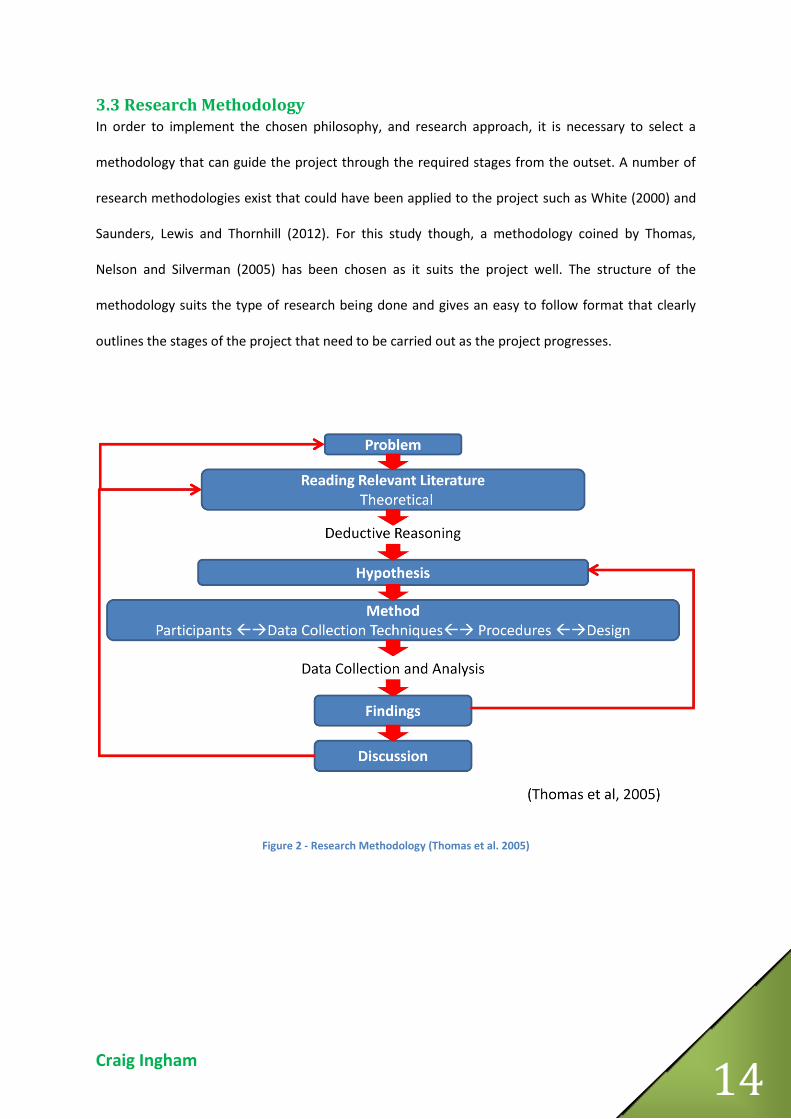
3.3 Research Methodology In order to implement the chosen philosophy, and research approach, it is necessary to select a
methodology that can guide the project through the required stages from the outset. A number of
research methodologies exist that could have been applied to the project such as White (2000) and
Saunders, Lewis and Thornhill (2012). For this study though, a methodology coined by Thomas,
Nelson and Silverman (2005) has been chosen as it suits the project well. The structure of the
methodology suits the type of research being done and gives an easy to follow format that clearly
outlines the stages of the project that need to be carried out as the project progresses.
Figure 2 - Research Methodology (Thomas et al. 2005)
Craig Ingham 15
4.0 Literature Review The literature review was mainly conducted at the start of the project however it carried on
throughout the research to ensure that no new literature had been omitted from the study. The
review initially focussed on artificial turf and the current testing procedure before looking at the
problem of skin friction in general in terms of injury rates and player perceptions. Following this,
more detail was sought on the frictional properties of the skin, turf and the creation of injuries
through frictional loading. The review utilised a range of literature from empirical papers, books and
conference proceedings to gain as much insight as possible. The literature reviewed was kept as
recent as possible (i.e. within the last 12 years) however this was not always possible and some of
the literature sourced dates back to the 1970's.
4.1 Current State of Artificial Turf To fully understand the testing procedure and the issues associated with it, along with the
surrounding literature, it is vital to explore the artificial turf that is tested by the Securisport
machine. This section will briefly outline the structure of artificial turf and how it is constructed.
There are many different types of artificial turf manufactured currently for different sports such as
hockey, football and rugby. For the purposes of this research, the focus will be placed on third
generation artificial turf as this is the type of turf that is used within football and the majority of
testing is done on this type of turf.
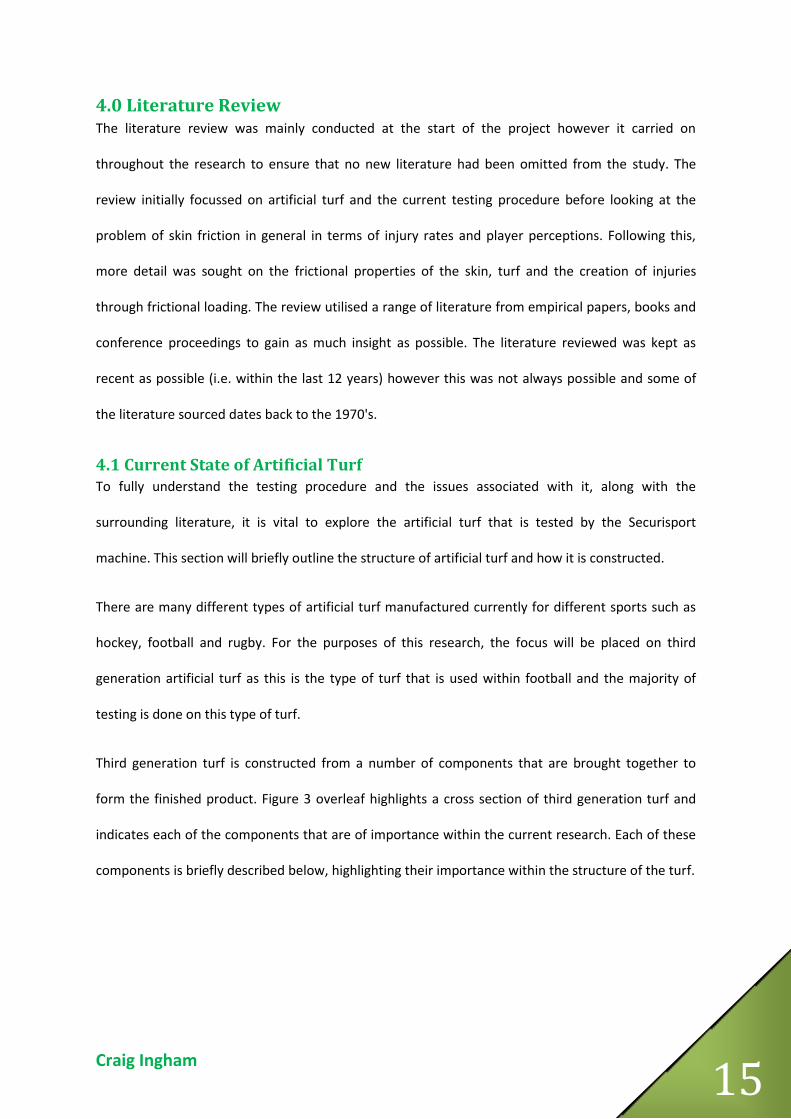
Third generation turf is constructed from a number of components that are brought together to
form the finished product. Figure 3 overleaf highlights a cross section of third generation turf and
indicates each of the components that are of importance within the current research. Each of these
components is briefly described below, highlighting their importance within the structure of the turf.
Craig Ingham 16
The pile of the turf is generally manufactured from Polyethylene (PE), Polypropylene (PP), or
Polyamide (PA) (Mclaren, et al., 2012) (Kolitzus, 2007) and can come in a monofilament or fibrillated
structure. Generally, artificial turf for use within sports utilise a PE monofilament structure as this
type is widely regarded as the strongest and most resilient pile type due to the manufacturing
process the yarn goes through. In addition to this increased performance, cost also plays a large role
in the selection of PE for the pile of the turf. Each fibre is extruded from the desired material
individually which allows the cross section of the fibres to be designed in terms of thickness or shape
which can have a large effect on the strength of the fibres (Kolitzus, 2007). Colour pigments and UV
stabilisers are also impregnated into the fibres during this process to aid performance and aesthetics
of the turf.
In order to stabilise the surface, sand is used as in an infill material to prevent the surface wrinkling
as it is used (Mclaren, et al., 2012). In addition to this layer of sand, a rubber infill is used which gives
the surface is playing characteristics such as providing the bounce of the ball. The rubber infill is
manufactured from ground down car and truck tyres to create small pellets of Styrene Butadiene
Rubber (SBR) (Alcantara, et al., 2009). It is crucial to the performance of the turf that the sand and
rubber remain in two separate layers and do not mix as this can compromise the performance of the
rubber granules (Thiolon, 2005). It may also be suggested that if the rubber and sand mix, the
granules of sand may rise to the surface of the turf and in turn increase the risk of abrasions due to
the rough nature of the sand. Under the carpet, dependent on the design, shock-pads are
Pile
Rubber Infill
Sand
Figure 3 - Cross Section of Third Generation Turf
Craig Ingham 17
occasionally utilised to give a long term and performance enhancing system. Shock-pads come in
many different materials and forms with some turfs manufactured with a shock-pad already
attached while others are installed in-situ.
4.2 Review of Laboratory Testing Procedure Now that the structure of the turf has been analysed, it is necessary to outline the equipment and
testing procedure that is currently used to test the turf for its frictional properties against skin. An
initial analysis of the test and the protocol followed has highlighted some potential issues with the
test that may make it unsuitable for the analysis of sliding tackles and the friction generated during
this motion.
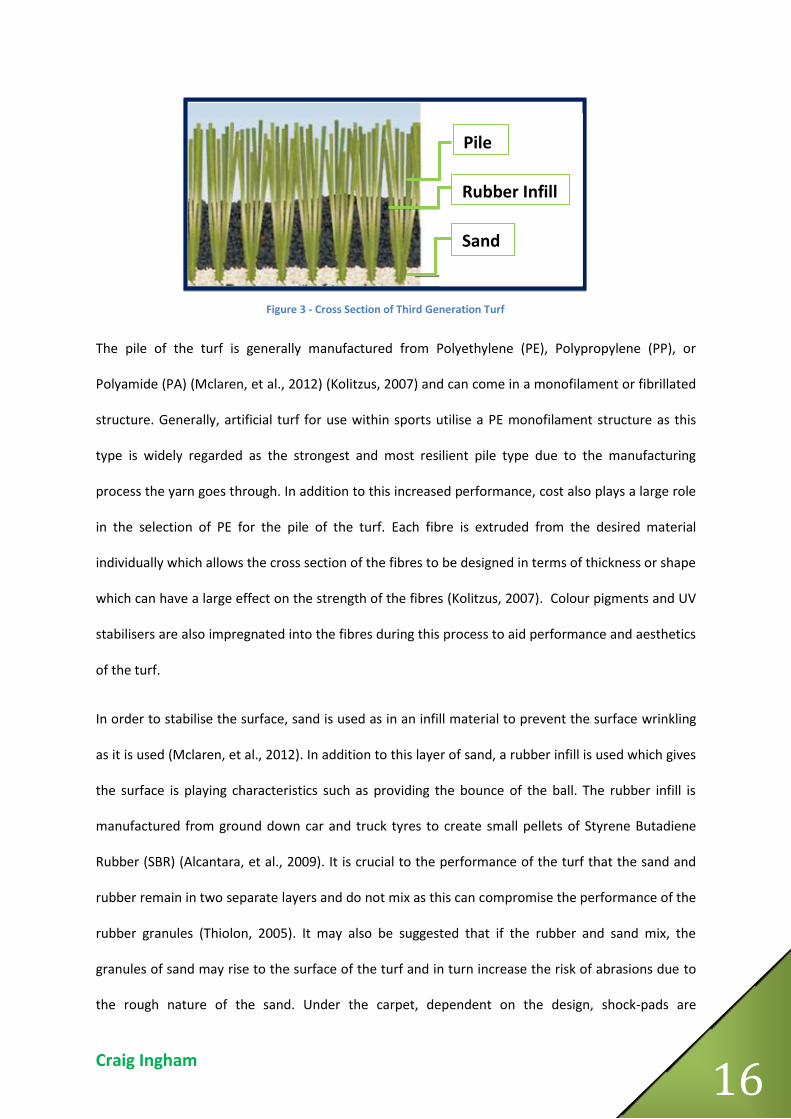
The Securisport III (figure 4) is a piece of equipment manufactured by Wassing Messtechnik GmbH
from Holland which is used to research the frictional properties of floors. The apparatus’s main
principle is to move a sliding body in a continual circular motion over the surface for a prescribed
amount of time. This motion allows the measurement of the interaction between the floor and the
sliding body with the results recorded on a PC for further analysis (GmbH, 2008).
Figure 4 - Securisport Testing Equipment
The equipment was first developed for the analysis of surfaces such as indoor tennis courts and
sports halls that have a perfectly flat and uniformed surface, but it has since been adopted by FIFA
Craig Ingham 18
for use in the testing of skin friction with football turf. In order to standardise the testing among the
registered testing laboratories, FIFA have produced a document (FIFA, 2012) that details the exact
testing procedures that are to be used when analysing a piece of turf. An outline of the testing
protocol for the skin friction/abrasion test (test method 08/09) is described below with the full test
specification listed in appendix 1.
The following information has been sourced from (FIFA, 2012)
The testing procedure specifies the use of a silicone skin produced by Maag Technic AG from
Switzerland for use within the test to replicate the human skin.
Before the friction test is conducted, the silicone skin is analysed to calculate the force required to
pull it over a polished steel test plate (this is done again after the friction test to analyse the damage
or abrasion caused to the skin as a result of friction with the turf).
Following the analysis on the skin, it is then attached to a test foot (dimensions in appendix 1) on the
Securisport machine, the test foot is mechanically pressed into the turf through an actuator with a
force of 100N ± 10N and then rotated on the turf at a speed of 40 ± 1rev/min. Data is then recorded
onto the PC at a sampling rate of 40Hz measuring the co-efficient of friction between the skin and
the turf sample. Within the recordings that are taken, FIFA stipulate that any initial peaks in the
value of the friction coefficient are to be ignored and following this a mean value for the coefficient
of friction is to be calculated. This procedure is then repeated three times with a new silicon skin for
each test and any infill is to be replaced that has been dislodged from the turf sample. An example of
the results from the Securisport test can be seen below in figure 5.
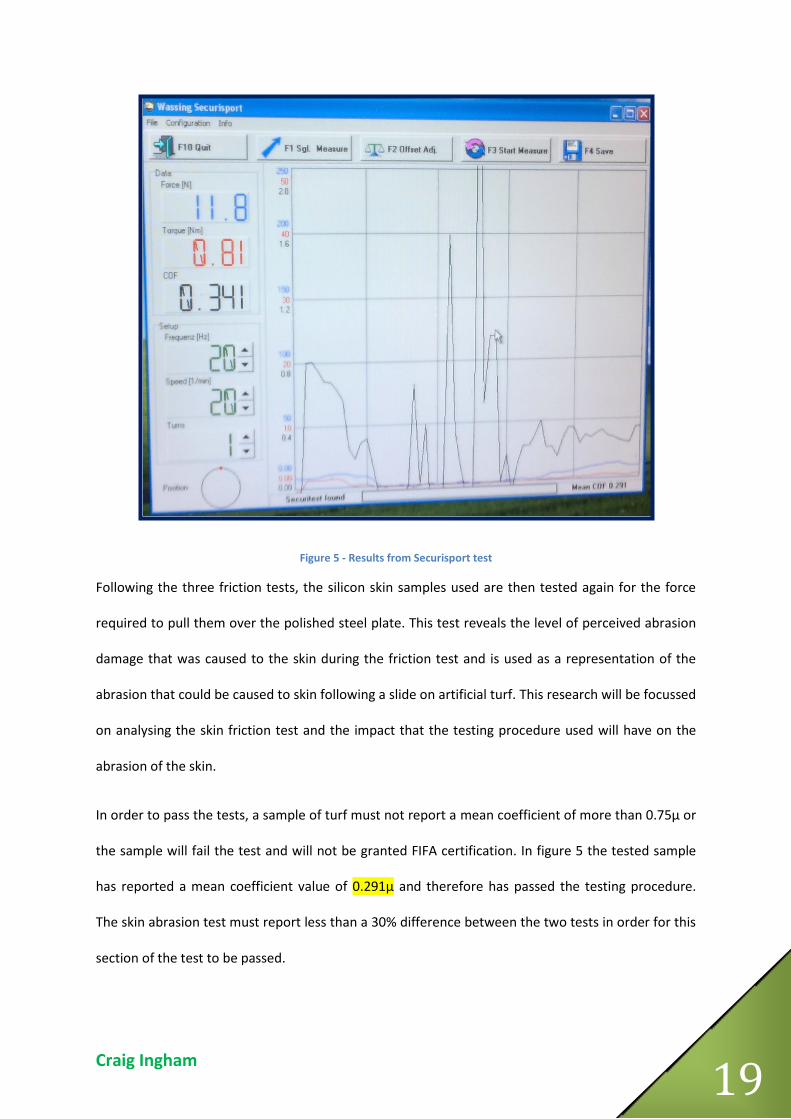
Craig Ingham 19
Figure 5 - Results from Securisport test
Following the three friction tests, the silicon skin samples used are then tested again for the force
required to pull them over the polished steel plate. This test reveals the level of perceived abrasion
damage that was caused to the skin during the friction test and is used as a representation of the
abrasion that could be caused to skin following a slide on artificial turf. This research will be focussed
on analysing the skin friction test and the impact that the testing procedure used will have on the
abrasion of the skin.
In order to pass the tests, a sample of turf must not report a mean coefficient of more than 0.75µ or
the sample will fail the test and will not be granted FIFA certification. In figure 5 the tested sample
has reported a mean coefficient value of 0.291µ and therefore has passed the testing procedure.
The skin abrasion test must report less than a 30% difference between the two tests in order for this
section of the test to be passed.

Craig Ingham 20
4.2.1 Disadvantages of Testing Procedure From the evaluation of the current testing protocol given by FIFA, there appears to be a number of
disadvantages with the test that may need to be addressed in order to make it better at analysing
sliding tackles and falls. The possible disadvantages are outlined below;
The equipment was initially developed for flat, smooth surfaces that will exert an even
pressure over the silicone foot for the duration of the test whereas the artificial turf is not an
even surface. The loose rubber infill will have peaks and troughs in its structure that will
affect the readings of friction from the equipment.
The force applied between the silicone skin and the turf is 100N or approximately 10kg
which appears to be far less than the force that will be exerted on the turf by a player during
a sliding tackle.
The motion of the current test is in a circular motion and it is thought that a sliding tackle is
generally in a linear motion and the circular motion is not representative of this. In addition,
the motion covers the same section of turf a number of times which may affect the friction
results gained.
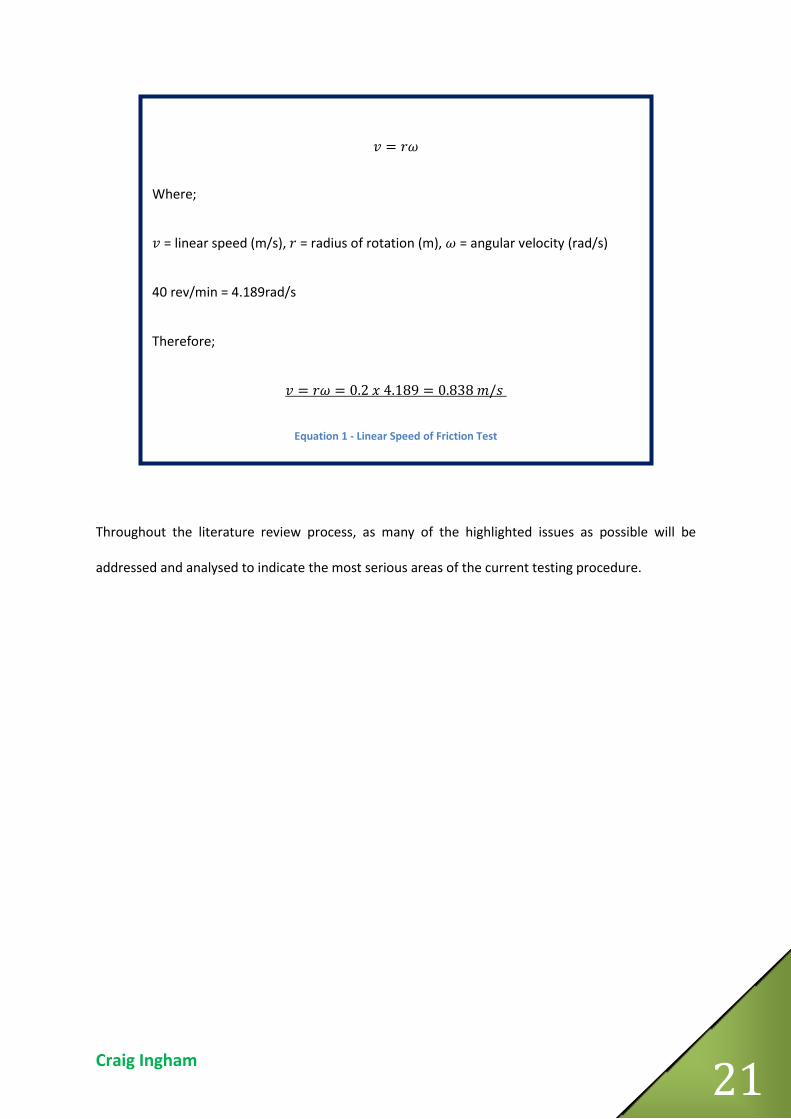
The test currently runs at a current speed of 40 rev/min which equates to a tangential linear
speed of 0.838m/s (equation 1). This speed is far slower than the speed that a player will run
at and therefore will not represent a tackle effectively.
Temperature is not measured in the test and this could play a big part in the generation of
heat and injury when sliding over the turf.
Craig Ingham 21
Throughout the literature review process, as many of the highlighted issues as possible will be
addressed and analysed to indicate the most serious areas of the current testing procedure.
𝑣 = 𝑟𝜔
𝑣 = 𝑟𝜔 = 0.2 𝑥 4.189 = 0.838 𝑚/𝑠
Where;
𝑣 = linear speed (m/s), 𝑟 = radius of rotation (m), 𝜔 = angular velocity (rad/s)
40 rev/min = 4.189rad/s
Therefore;
Equation 1 - Linear Speed of Friction Test
Craig Ingham 22
4.3 Player Perceptions To understand the importance of the testing procedure, it is important to consider the perceptions
and views of the people that use artificial turf on a regular basis. Studies have been done to try and
gain a better understanding of how the players feel that artificial turf rates in comparison to natural
turf in a number of different areas such as how it plays, how safe it is and the features it possesses
(Andersson, et al., 2008) (Foster, 2007). Two of the most prominent studies conducted utilised pre-
piloted questionnaires in order to gain the insights of amateur footballers (Zanetti, 2009), coaches
and referees (Burillo, et al., 2012). The artificial turfs evaluated were all third generation turfs but
none had been certified by FIFA's certification system.
In general the artificial turf was shown to rate extremely well in comparison to natural turf apart
from the risk of abrasions during sliding tackles which consistently scored lowest of all the facets of
measured. Zanetti (2009) showed that weather also has a big influence on the players’ perception of
the turf performance with players generally favouring to play in warm or cold conditions (figure 6).
The figure however highlights the poor rating of abrasion in all of the conditions bar rainy, in which
tiredness and ball rebound were rated to be worse. This higher rating of abrasion can be put down
to the influence that the rain will have on the pitch as it will lubricate the surface and in turn reduce
the friction generated, thus creating less abrasion during sliding. Another critical factor to consider,
is that in general the pitch did not rate well in hot weather which relates to other studies such as
Meyers & Barnhill (2004) who found that the incidence of injury on artificial turf in hot weather was
greater (this will be discussed in more detail in the next section of the report). In addition to this,
Williams & Pulley (2002) found that players had raised concerns over playing in hot conditions as the
surface often became very high in temperature as it absorbed heat from the sun. This may also have
a large impact on the generation of friction burn and abrasions on the surface when sliding. In
general, the study highlighted that the risk of abrasions is one of the worst facets of artificial turf and
this insinuates that this is an area of the turf that needs to be developed in order to increase the
perceptions of players.

Craig Ingham 23
Figure 6 - Mean score of artificial turf for various weather conditions (adapted from Zanetti, 2009)
The study by Burillo et al. (2012) was in agreement with Zanetti (2009) as the players all rated the
safety aspects of artificial turf to be its poorest traits, in particular abrasion during sliding which
received a mean score of 2.9 on a Likert scale. The study also highlighted that players were far more
dissatisfied with artificial turf than coaches or referees which can be put down the increased amount
of sliding done by players in comparison to coaches and referees. Even with the low score for
abrasion, the consensus from the study was that artificial turf is in general a very good surface and
was rated higher than natural turf by 75% of the subjects.
These two studies conducted show that the risk of abrasion is a severe issue with artificial turf and is
one that needs to be addressed to ensure that the turf is of the highest quality and is appreciated by
the people who interact with it on a regular basis.
6
6.2
6.4
6.6
6.8
7
7.2
7.4
7.6
7.8
8
warm hot rainy cold
Mea
n SC
ore
Pitch facets vs weather conditions
Ball roll
Abrasion
Ball speed
Ball rebound
Tiredness
Turf hardness
Direction change
Dribbling
Tackle
Craig Ingham 24
4.4 Injuries With football being the most popular team sport in the world (Giulianotti, 1999), it follows that a
very high percentage of the total sporting injuries will be caused while playing the sport. Fleming
(2011) stated that a 2007 EU report highlighted that of the 2,500,000 sporting injuries recorded,
football was responsible for 36% of these injuries. This however accounts for football injuries
received on all surfaces and does not differentiate between injuries received on natural turf or an
artificial turf. A further complication of reviewing injury studies conducted in the past is that there
are large discrepancies between studies in terms of the classification and categorisation of injuries,
thus making it nearly impossible to compare studies. With this in mind, a consensus statement was
created by Fuller et al (2006) in which an injury was defined as a physical complaint that a player
sustains resulting from football in a match or training. This consensus statement has led to many
papers since 2006 being standardised in their classification of injuries and as such, only papers since
this time have been analysed in this research (Fleming, 2011).
A variety of methods have been used in order to analyse injuries sustained on artificial turf. Akkaya
et al (2011) retrospectively analysed injuries reported to hospital that had occurred on an artificial
turf surface and found that the most likely type of injury reported was soft tissue injuries such as
contusions, abrasions, and hematomas. These injuries were however all as a result of other injuries
occurring and were not the sole reason for the admission to hospital. This can be understood as the
likelihood of a person being admitted to hospital for treatment of a friction burn is extremely
unlikely as they are not serious injuries (Agrawal, et al., 2008). This and other studies (Yamaner, et
al., 2009) (Ekstrand, et al., 2006) found that the most common area of injury was in the lower
extremities, in particular the ankle and also showed that the most commonly occurring injury was
the ankle sprain on artificial turf. This data is questionable however as all of the studies were
retrospectively done in hospitals or through questionnaire in which abrasions would either not be
reported by the subjects or had been omitted by the authors as they usually do not lead to the
subject missing playing time as a result of the injury.
Craig Ingham 25
Throughout the years, artificial turf has been thought to cause more injuries to players than natural
turf due to the increased traction that can be achieved between the studs of boots and the turf,
altering the forces that the muscles have to cope with (Aoki, et al., 2012). This had been shown to be
incorrect however as it has been exposed that there is no higher incidence of injuries on artificial
turf in comparison to natural turf (Ekstrand, et al., 2006) (Meyers & Barnhill, 2004). It has however
been shown that the types of injuries received on these surfaces differ greatly, with a far higher
percentage of minor soft tissue injures occurring on artificial turf than natural turf. These results
would insinuate that the higher incidence of soft tissue injuries is caused by the propensity for
friction burn to occur on the artificial surfaces. Meyers & Barnhill (2004) also highlighted that the
weather had a large effect on the number of injuries received as there were significantly more
injuries reported in the hot weather. This can be explained in terms of friction burns and abrasions;
the rubber infill used in the pitches absorbs a lot of heat from the sun and as such the surface of the
pitch can sometimes reach very high temperatures. With this increase in temperature of the surface,
the chance of receiving a friction burn is increased due to the large role that heat plays in friction.
It can clearly be seen from the previous research that artificial turf does not cause more injuries than
natural turf and it may be argued that it is in actual fact a safer surface to play on as the injuries
received are not as serious as those suffered on natural turf. It is still apparent however, that the
minor injuries suffered on artificial turf are very large in number which highlights the problem of
friction between the skin and the surface being very high. None of the previous works stipulate if the
pitches had been certified by FIFA and throughout the literature review process, no literature could
be sourced that directly compared injuries on turf certified by FIFA and turf that has not been
certified. This means that it is hard to gauge how effective the skin friction test is at ensuring the
friction coefficient is reduced on the certified pitches.
Craig Ingham 26
4.5 Friction The understanding of general friction principles is critical to fully comprehend what is happening at
the skin and turf interface during a sliding tackle. It is also crucial to understand what exactly is being
measured by the Securisport machine during the testing procedure to understand what the values
mean in scientific terms.
Friction itself can be defined as " the resistance that one surface or object encounters when moving
over another" (Oxford, 2012) and is the source of the conversion of mechanical energy at the sliding
interface into heat or other properties through mechanisms which consume energy (Suh, et al.,
1994). The coefficient of friction, which is measured in the Securisport test, is depicted as "the ratio
of two forces acting, respectively, perpendicular and parallel to an interface between two bodies
under relative motion or impending relative motion" (Blau, 2001). This quote hints that there are
two separate coefficients of friction and this is true with both a static and dynamic coefficient of
friction measured in many tests. The static friction coefficient is the force that opposes the initiation
of imminent motion with the dynamic coefficient being the force that acts to stop motion which has
already started (Blau, 2001). If we think back to the sliding tackle situation, there is no static
coefficient of friction present within the motion as a player does not initiate a sliding tackle from a
static position, therefore there will only be a dynamic coefficient of friction present which is
opposing the motion of the slide. This accounts for the static friction coefficient not being measured
in the current testing procedure.
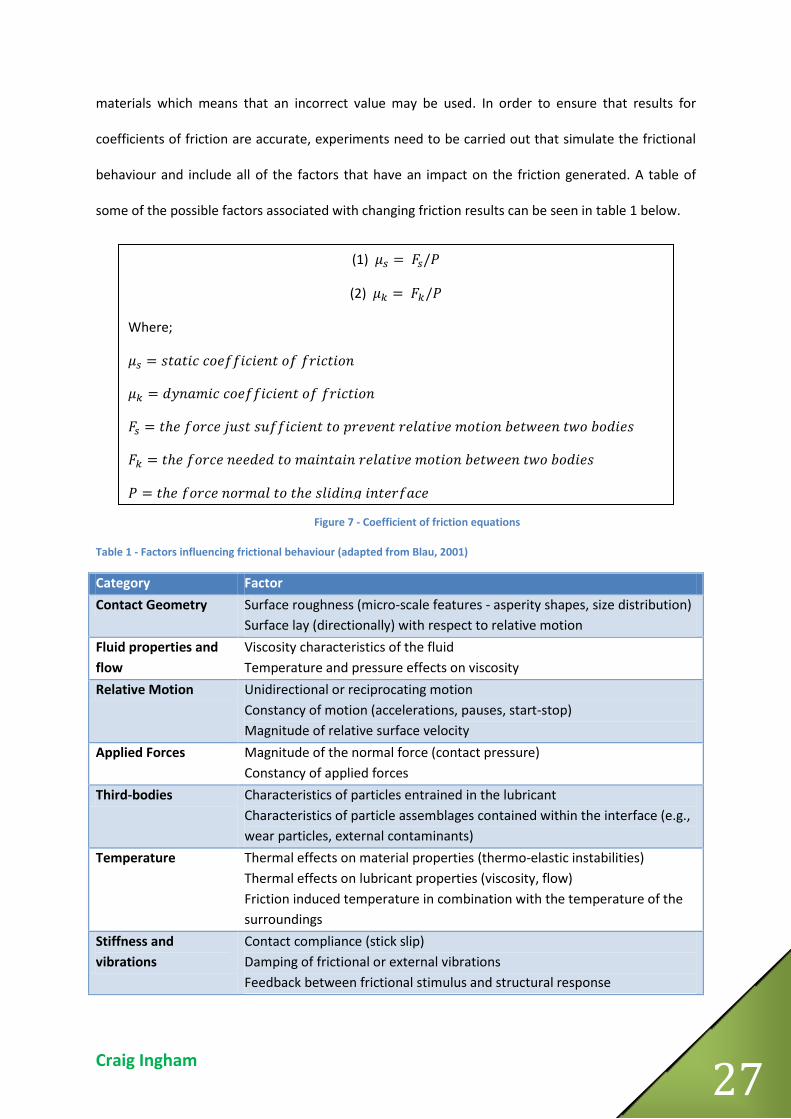
The two coefficients of friction, when analysing a solid-to-solid interface can be expressed simply
through the use of two laws (figure 7). The values calculated from these two equations, have long
been tabulated to form lists of values for coefficients of friction for differing systems and scenarios.
The issue with this however is that many people assume that in order to solve friction problems, the
answer can readily be looked up and found in a table of coefficients (Blau, 2001). This however is
often not the case, as each system will be different which will in turn change the values for the
coefficients. In addition to this, values often differ between tables of data for the 'same' sliding
Craig Ingham 27
materials which means that an incorrect value may be used. In order to ensure that results for
coefficients of friction are accurate, experiments need to be carried out that simulate the frictional
behaviour and include all of the factors that have an impact on the friction generated. A table of
some of the possible factors associated with changing friction results can be seen in table 1 below.
Table 1 - Factors influencing frictional behaviour (adapted from Blau, 2001)
Category Factor Contact Geometry Surface roughness (micro-scale features - asperity shapes, size distribution)
Surface lay (directionally) with respect to relative motion
Fluid properties and flow
Viscosity characteristics of the fluid
Temperature and pressure effects on viscosity
Relative Motion Unidirectional or reciprocating motion
Constancy of motion (accelerations, pauses, start-stop)
Magnitude of relative surface velocity
Applied Forces Magnitude of the normal force (contact pressure)
Constancy of applied forces
Third-bodies Characteristics of particles entrained in the lubricant
Characteristics of particle assemblages contained within the interface (e.g.,
wear particles, external contaminants)
Temperature Thermal effects on material properties (thermo-elastic instabilities)
Thermal effects on lubricant properties (viscosity, flow)
Friction induced temperature in combination with the temperature of the
surroundings
Stiffness and vibrations
Contact compliance (stick slip)
Damping of frictional or external vibrations
Feedback between frictional stimulus and structural response
Figure 7 - Coefficient of friction equations
𝜇 = 𝑠𝑡𝑎𝑡𝑖𝑐 𝑐𝑜𝑒𝑓𝑓𝑖𝑐𝑖𝑒𝑛𝑡 𝑜𝑓 𝑓𝑟𝑖𝑐𝑡𝑖𝑜𝑛
𝜇 = 𝑑𝑦𝑛𝑎𝑚𝑖𝑐 𝑐𝑜𝑒𝑓𝑓𝑖𝑐𝑖𝑒𝑛𝑡 𝑜𝑓 𝑓𝑟𝑖𝑐𝑡𝑖𝑜𝑛
𝐹 = 𝑡ℎ𝑒 𝑓𝑜𝑟𝑐𝑒 𝑗𝑢𝑠𝑡 𝑠𝑢𝑓𝑓𝑖𝑐𝑖𝑒𝑛𝑡 𝑡𝑜 𝑝𝑟𝑒𝑣𝑒𝑛𝑡 𝑟𝑒𝑙𝑎𝑡𝑖𝑣𝑒 𝑚𝑜𝑡𝑖𝑜𝑛 𝑏𝑒𝑡𝑤𝑒𝑒𝑛 𝑡𝑤𝑜 𝑏𝑜𝑑𝑖𝑒𝑠
𝐹 = 𝑡ℎ𝑒 𝑓𝑜𝑟𝑐𝑒 𝑛𝑒𝑒𝑑𝑒𝑑 𝑡𝑜 𝑚𝑎𝑖𝑛𝑡𝑎𝑖𝑛 𝑟𝑒𝑙𝑎𝑡𝑖𝑣𝑒 𝑚𝑜𝑡𝑖𝑜𝑛 𝑏𝑒𝑡𝑤𝑒𝑒𝑛 𝑡𝑤𝑜 𝑏𝑜𝑑𝑖𝑒𝑠
𝑃 = 𝑡ℎ𝑒 𝑓𝑜𝑟𝑐𝑒 𝑛𝑜𝑟𝑚𝑎𝑙 𝑡𝑜 𝑡ℎ𝑒 𝑠𝑙𝑖𝑑𝑖𝑛𝑔 𝑖𝑛𝑡𝑒𝑟𝑓𝑎𝑐𝑒
(1) 𝜇 = 𝐹 /𝑃
(2) 𝜇 = 𝐹 /𝑃
Where;

Craig Ingham 28
In order to try and understand the friction generated at the interface of the skin and the surface of
the turf during a sliding tackle it is important to understand the structure of the turf and how this
affects the friction (the skins frictional properties will be analysed in section 4.7). The structure of
the turf is far more complex than that of a solid due to it being constructed out of a number of
different components that all interact with each other during a slide. On top of this, the turf may
also be lubricated with precipitation to differing levels depending on the conditions which may
reduce the friction created during a slide. All of these factors combined will affect the way in which
the mechanical energy is converted during a slide as it may be converted to heat, to the creation of
new surfaces or wear depending on the circumstance (Blau, 2001).
The pile of the turf can be manufactured from different materials which will all have different
surface abrasion values associated with them and in addition to this; the pile will interact with the
turfs infill. This interaction is extremely difficult to predict, however if we look at the infill on its own
we can start to understand how it will react under frictional loading. The particles of rubber can be
related to research carried out by Uesugi et al (1988) who analysed what happened to particles of
sand at a sand-steel interface. The research showed that the sand particles showed a small amount
of sliding over the steel before the peak in frictional resistance occurred during the tests. From this,
it can be extrapolated that the rubber infill will slip and roll during the sliding motion but it is still
unclear as to how the infill will interact with the pile of the turf during a slide. Throughout the
literature review process, no literature could be found that described or analysed the interaction
between the pile and the infill.
The review of general frictional principles has highlighted the different factors that can affect the
friction generated between the skin and the surface of the turf by analysing the different properties
that may affect the frictional properties of the surface. It can also be seen from table 1 that
temperature plays a large role in the generation of friction which suggests that the Securisport
machine should also measure temperature in the testing protocol to analyse the effects of this.

Craig Ingham 29
4.6 Anatomy of the Skin Having a basic understanding of the anatomy of the skin will help to enable a better understanding
of the injuries that are caused by sliding on artificial turf and how the skin is affected by these
injuries. This section will describe the anatomy of the skin and this will be followed by a section (4.7)
describing the frictional properties of the skin and the types of injuries suffered as a result of friction
to give a comprehensive overview of the skin and how it reacts when subjected to a frictional force.
The skin is a multifunctional organ consisting of many specialised cells that are all adapted to
perform different functions (Powell, 2006) and is considered to be the largest organ in the body,
making up to 16% of the body's total mass (Venus, et al., 2011). On average the thickness of the skin
is between 2mm and 3mm thick (Kusuma, et al., 2010) although the thickness varies greatly
between body areas. Skin, also has some interesting biomechanical properties as it shows the elastic
properties of solids and also the viscosity of fluids, such as stretch in response to deformation
(Venus, et al., 2011). The stretch principles of the skin are not regulated however, and are
dependent on the direction of stretch as the skin is anisotropic in nature.
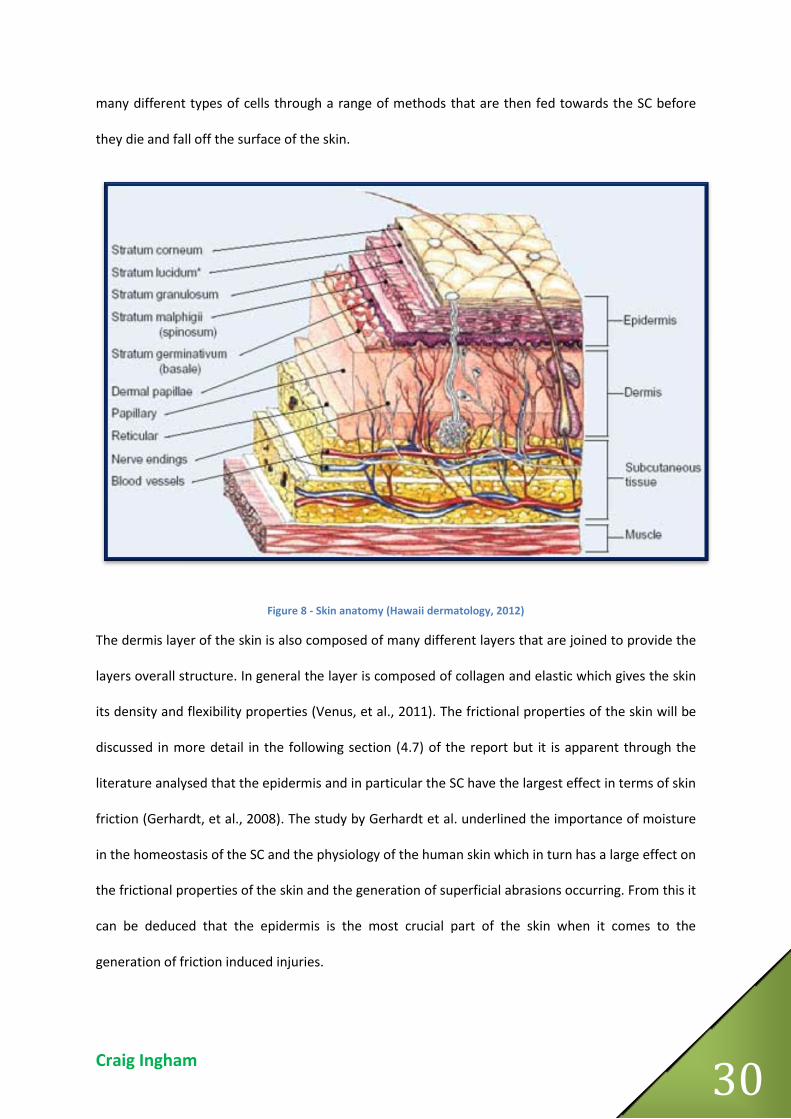
The skin is made up of two main layers, the dermis and the epidermis. The epidermis is the
outermost layer of the skin and is the primary defence against external organic elements such as
parasites and viruses (Kusuma, et al., 2010). If the epidermis is analysed in more detail, it becomes
clear that it is made up of multiple layers. From the most superficial point, the layers are; the
stratum corneum, the stratum lucidum, the stratum granulosum, the stratum spinosum, and the
stratum germinativum (Venus, et al., 2011) (figure 8). The stratum corneum (SC), is mostly
composed of dead skin cells that have no nuclei and are linked together to form a lattice type
structure and is the body’s primary method of stopping water escaping uncontrollably (Powell,
2006). The thickness of this layer varies considerably across different body parts, with areas that
receive more wear such as the palms of the hands having a very thick SC in comparison to areas such
as the shin (Kusuma, et al., 2010). The deeper layers of the epidermis layers continually generate
Craig Ingham 30
many different types of cells through a range of methods that are then fed towards the SC before
they die and fall off the surface of the skin.
Figure 8 - Skin anatomy (Hawaii dermatology, 2012)
The dermis layer of the skin is also composed of many different layers that are joined to provide the
layers overall structure. In general the layer is composed of collagen and elastic which gives the skin
its density and flexibility properties (Venus, et al., 2011). The frictional properties of the skin will be
discussed in more detail in the following section (4.7) of the report but it is apparent through the
literature analysed that the epidermis and in particular the SC have the largest effect in terms of skin
friction (Gerhardt, et al., 2008). The study by Gerhardt et al. underlined the importance of moisture
in the homeostasis of the SC and the physiology of the human skin which in turn has a large effect on
the frictional properties of the skin and the generation of superficial abrasions occurring. From this it
can be deduced that the epidermis is the most crucial part of the skin when it comes to the
generation of friction induced injuries.
Craig Ingham 31
4.7 Skin Friction and Injuries Whereas tribology (explained in section 4.5) is the "study of friction, wear and lubrication, and the
science and technology of interacting surfaces in relative motion" (Jost, 1966), biotribology takes
these principles and applies them to a biological system such as skin. The investigation of the skins
frictional properties is imperative to understand friction-induced injuries in terms of why and how
they occur (Sulzberger, et al., 1966) (Dalton, 1982). There have been many studies conducted that
analyse the frictional properties of the skin in different situations. An overview of the literature
analysed is given below to highlight the key points in skin friction and the injuries received as a result
of friction. At the end of the section comparisons will also be drawn between the construction of
human skin and the suitability of the silicone skin used in the test.
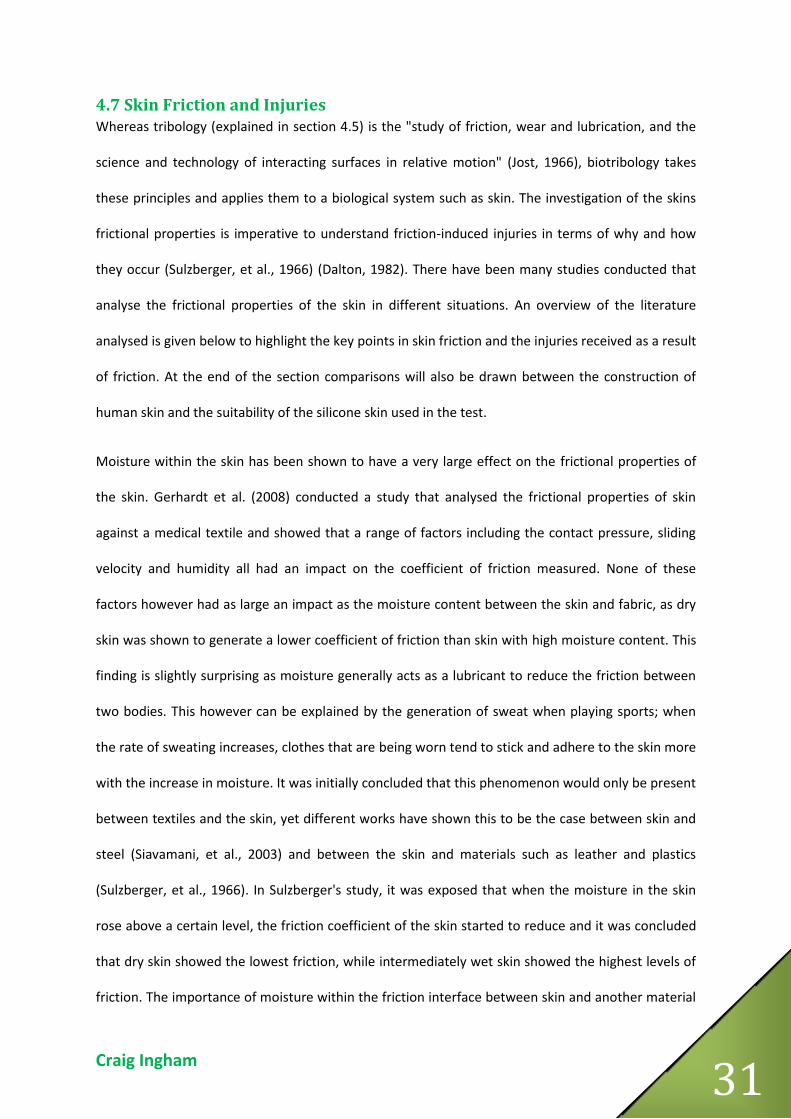
Moisture within the skin has been shown to have a very large effect on the frictional properties of
the skin. Gerhardt et al. (2008) conducted a study that analysed the frictional properties of skin
against a medical textile and showed that a range of factors including the contact pressure, sliding
velocity and humidity all had an impact on the coefficient of friction measured. None of these
factors however had as large an impact as the moisture content between the skin and fabric, as dry
skin was shown to generate a lower coefficient of friction than skin with high moisture content. This
finding is slightly surprising as moisture generally acts as a lubricant to reduce the friction between
two bodies. This however can be explained by the generation of sweat when playing sports; when
the rate of sweating increases, clothes that are being worn tend to stick and adhere to the skin more
with the increase in moisture. It was initially concluded that this phenomenon would only be present
between textiles and the skin, yet different works have shown this to be the case between skin and
steel (Siavamani, et al., 2003) and between the skin and materials such as leather and plastics
(Sulzberger, et al., 1966). In Sulzberger's study, it was exposed that when the moisture in the skin
rose above a certain level, the friction coefficient of the skin started to reduce and it was concluded
that dry skin showed the lowest friction, while intermediately wet skin showed the highest levels of
friction. The importance of moisture within the friction interface between skin and another material
Craig Ingham 32
demonstrates the impact that sweating and precipitation can have on the amount of friction
generated during a slide.
In the previous section (4.5) it was highlighted that the thickness of skin can change with anatomical
location of the body and in particular the thickness of the stratum corneum changes dependant on
the amount of wear the location receives. A range of materials were tested on different anatomical
locations (Zhang & Mak, 1999) and found that the legs had the lowest frictional properties although
no reason was given for this. This finding was confirmed by Smalls, et al., (2006) who also found that
the calf had significantly lower frictional properties than the shoulder and thigh as the skin was
significantly stiffer than the other locations. Another reason for the legs having lower frictional
properties could be the amount of hair that is present on the leg in comparison to the shoulder and
other locations. The study also highlighted that side of the body that was tested had an effect which
was put down to an increase in muscle mass on the stronger side of the body, equating to stiffer skin
and a reduction in friction.
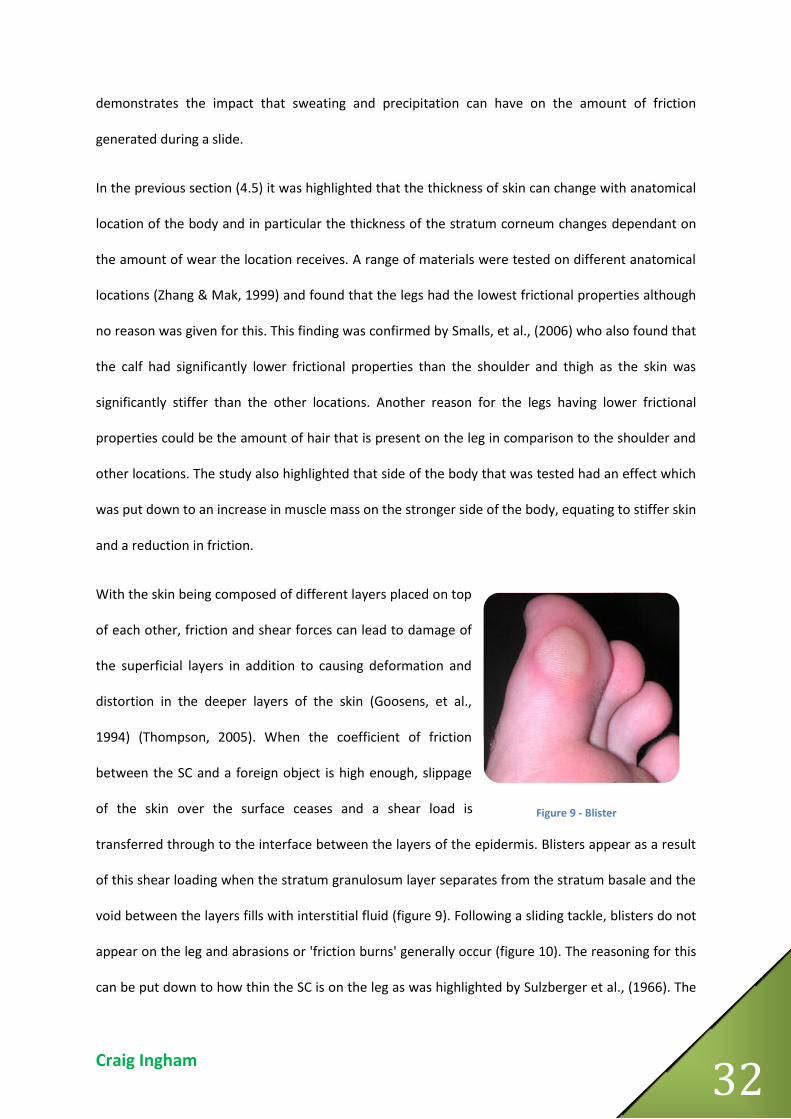
With the skin being composed of different layers placed on top
of each other, friction and shear forces can lead to damage of
the superficial layers in addition to causing deformation and
distortion in the deeper layers of the skin (Goosens, et al.,
1994) (Thompson, 2005). When the coefficient of friction
between the SC and a foreign object is high enough, slippage
of the skin over the surface ceases and a shear load is
transferred through to the interface between the layers of the epidermis. Blisters appear as a result
of this shear loading when the stratum granulosum layer separates from the stratum basale and the
void between the layers fills with interstitial fluid (figure 9). Following a sliding tackle, blisters do not
appear on the leg and abrasions or 'friction burns' generally occur (figure 10). The reasoning for this
can be put down to how thin the SC is on the leg as was highlighted by Sulzberger et al., (1966). The
Figure 9 - Blister
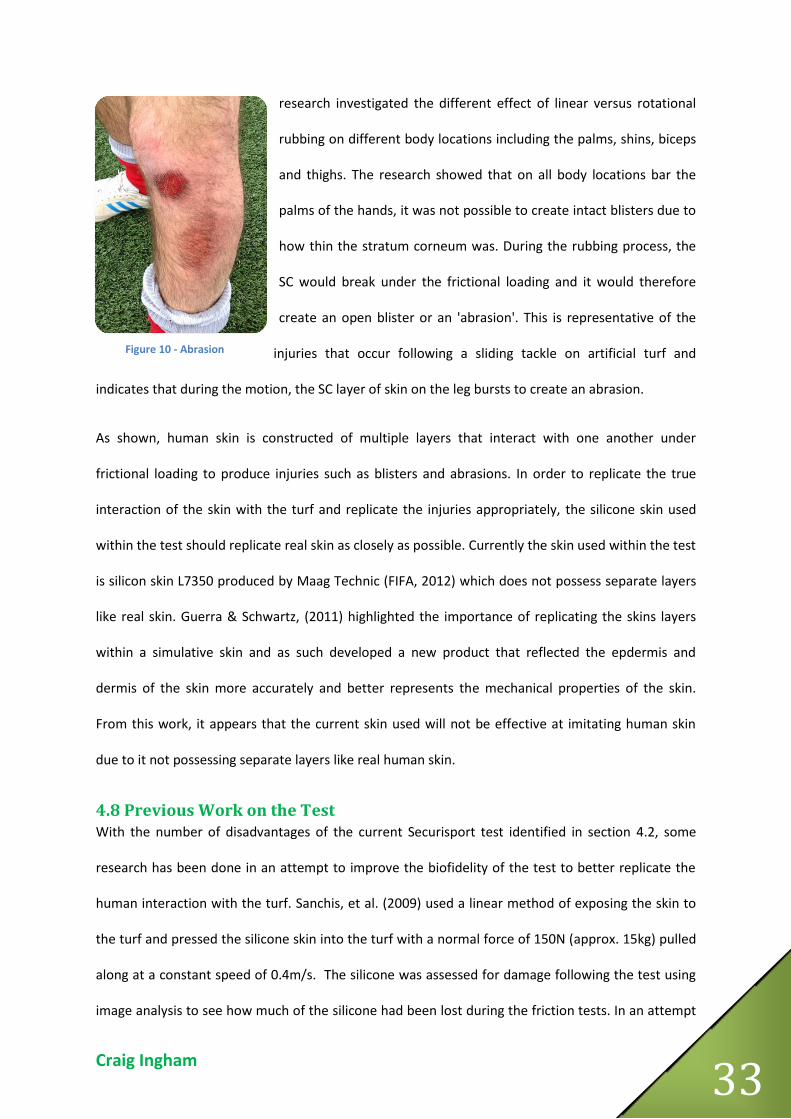
Craig Ingham 33
research investigated the different effect of linear versus rotational
rubbing on different body locations including the palms, shins, biceps
and thighs. The research showed that on all body locations bar the
palms of the hands, it was not possible to create intact blisters due to
how thin the stratum corneum was. During the rubbing process, the
SC would break under the frictional loading and it would therefore
create an open blister or an 'abrasion'. This is representative of the
injuries that occur following a sliding tackle on artificial turf and
indicates that during the motion, the SC layer of skin on the leg bursts to create an abrasion.
As shown, human skin is constructed of multiple layers that interact with one another under
frictional loading to produce injuries such as blisters and abrasions. In order to replicate the true
interaction of the skin with the turf and replicate the injuries appropriately, the silicone skin used
within the test should replicate real skin as closely as possible. Currently the skin used within the test
is silicon skin L7350 produced by Maag Technic (FIFA, 2012) which does not possess separate layers
like real skin. Guerra & Schwartz, (2011) highlighted the importance of replicating the skins layers
within a simulative skin and as such developed a new product that reflected the epdermis and
dermis of the skin more accurately and better represents the mechanical properties of the skin.
From this work, it appears that the current skin used will not be effective at imitating human skin
due to it not possessing separate layers like real human skin.
4.8 Previous Work on the Test With the number of disadvantages of the current Securisport test identified in section 4.2, some
research has been done in an attempt to improve the biofidelity of the test to better replicate the
human interaction with the turf. Sanchis, et al. (2009) used a linear method of exposing the skin to
the turf and pressed the silicone skin into the turf with a normal force of 150N (approx. 15kg) pulled
along at a constant speed of 0.4m/s. The silicone was assessed for damage following the test using
image analysis to see how much of the silicone had been lost during the friction tests. In an attempt
Figure 10 - Abrasion
Craig Ingham 34
to quantify the abrasion results with the perceived roughness of the turf, the researchers asked 5
subjects to run their arm over the turf and rate it on a scale for roughness. The subjective study
showed good correlations with the roughness of each turf sample analysed with the new testing rig
created.
Although the work claims to make the test more biofidelic, this cannot be proven as the values of
force and speed used within the test have not been taken from previous literature or any testing
that can be seen in the work. It would appear that the mass and speeds used in this test are smaller
than what will happen in real life interactions with the turf, thus rendering the testing procedure no
better than the Securisport test other that its direction of motion. In addition to this, the subjective
study asked the subjects to rub their arm against the turf and just roughness as opposed to their leg
where the majority of friction burns will occur. This change in anatomical location will likely have an
effect on the friction properties of the skin and may change the perception of roughness of the
subjects.
The second piece of work done on improving the test, introduced a temperature measurement
device into a linear machine and tested three different types of turf in wet and dry conditions
(Verhelst, et al., 2009). A mass of between 15kg and 30kg was released from the top of a ramp at
speeds up to 6.1m/s and slid along the turf sample. The results indicated that the temperature
increased rapidly and then reduced over the time of the slide. The research showed that the rise in
temperature was significantly lower when the turf was wet and confirmed that there will be less
abrasion injuries in wet weather due to the reduction in temperature. The findings agree with earlier
studies highlighted (Zanetti, 2009), who showed that players perceive injuries to occur more often in
the hot weather and Meyers & Barnhill, (2004) who demonstrated that the amount of injuries on
artificial turf does increase in the hot weather.
The work by Verhelst, et al. (2009) uses a far higher mass and speed during their linear testing which
may better represent a sliding tackle; however the values used have not been justified in the work,
Craig Ingham 35
with no clue as to where the masses and speeds were derived from. As with the previous work and
the Securisport test, this insinuates that the test has not been built around hard data and evidence
surrounding the human and turf interactions during a sliding tackle.
Overall it is clear that these pieces of work have attempted to make the skin friction test more
realistic but they have not however shown any data that backs up their use of masses, weights and
even confirmation that the sliding tackle is indeed in a linear motion. Throughout the literature
review process, no literature was available that provided data surrounding the sliding tackle in terms
of its, speed, direction or the ground reaction forces involved in the movement.
4.9 Summary of Literature Review Artificial turf has long been associated with the five-a-side version of football, but recently the
surface has been employed increasingly in the eleven-a-side version of the game. Within this version
of the game sliding tackles play a larger role than in small-sided games and successful completion of
sliding tackles has been shown to improve overall team performance (Sekine, et al., 2009). With this
increased importance of sliding tackles in football, and the use of artificial turf now coming into
rugby through the governing bodies (BBC, 2013), it is crucial that the interaction of human skin with
the turf is analysed effectively to indicate the risk of friction burns and abrasions occurring.
It has been shown that players (Andersson, et al., 2008) (Zanetti, 2009) rate artificial turf well against
the natural surfaces that they play on however artificial turf does not fare well when it comes to the
risk of abrasions. This risk has been shown to be justified as injury studies have highlighted that
artificial turf causes more minor soft tissue injuries such as abrasions, contusions and hematomas
(Akkaya, et al., 2011) however the surface does not cause more injuries overall than natural turf
surfaces (Meyers & Barnhill, 2004). The perception studies conducted also agree with the injury
studies in that the risk of receiving a skin injury is increased greatly in the hot weather as the infill of
the pitch absorbs a lot of heat. This increase in temperature causes more skin abrasions as heat
Craig Ingham 36
plays a large role in the generation of friction between two bodies (Blau, 2001) amongst many other
factors.
Understanding the frictional properties of the turf surface is an incredibly complex process due to
the combination of all the components within the turf and how they interact with one another
under frictional loading (Blau, 2001). It is easier however to examine the skin and its frictional
properties under loading to better understand the generation of frictional injuries. The layers of skin,
especially within the epidermis are important in understanding the friction properties of the body's
largest organ (Guerra & Schwartz, 2011). Surprisingly, increases in the moisture content of the
stratum corneum was shown to increase the frictional properties of the skin against textiles and
other materials such as steel and leather (Gerhardt, et al., 2008) (Siavamani, et al., 2003). The
generation of injuries and the types of injury depends largely on the anatomical location of the
frictional loading as the thickness of the skins layers change. On the legs, the skin is thin and
therefore abrasions are far more likely to occur as the layers burst before a blister can be formed,
unlike the palms and soles of the feet (Zhang & Mak, 1999).
The current testing equipment for analysis of skin friction, the Securisport machine, was initially
developed for use with indoor sports surfaces but has been adopted by FIFA as one of their tests for
certification of pitches. The procedure followed has many apparent flaws that limit its ability to
simulate the athletic movement of the players and therefore may not give accurate results of the
friction levels of turf. With this in mind, works have been done (Sanchis, et al., 2009) (Verhelst, et al.,
2009) that aim to better simulate the skin and surface interaction in an attempt to produce more
accurate results of the skin friction. However, these pieces of work do not gather information on the
sliding tackle and the skin-surface interaction in order to use these figures in their amendments of
the testing procedure and therefore the test may still not simulate the interaction adequately.

Craig Ingham 37
5.0 Knowledge Gap There is a wealth of literature available that surrounds the skin friction test and its associated areas
such as the perceptions of players, injury rates on artificial turf, the skin anatomy, and the skins
frictional properties. All of these investigated areas highlight the importance of the test as it is clear
that skin friction is still an issue, even with modern day artificial turf that claims to have eradicated
the problem in its construction and materials. Analysis of the test has identified a number of issues
that may render the test inaccurate in its simulation of the skin-surface interaction such as the
speed, direction and forces of the test in addition to its probable unsuitability to analyse artificial
turf in the first instance. With this in mind, it is surprising that there have only been two pieces of
work done that attempt to improve the current testing procedure to make it more biofidelic and
accurate in its simulation of the skin-surface interaction.
Examination of these pieces of work has highlighted that there currently appears to be no available
data on the sliding tackle and the interaction in this movement between the turf and the skin. This
scarcity of literature and available data makes it nearly impossible for the test or any of the work
done that attempts to improve the test to be biofidelic in its nature. It is therefore clear that there is
a gap in the knowledge surrounding the characteristic of a sliding tackle that could have a large
impact on validating or invalidating the current testing procedure implemented by FIFA using the
Securisport machine.
There also appears to be issues with the test in more technical areas such as the suitability of the
silicone skin used in its replication of human skin, and the ability for the test to accurately measure
the frictional properties of the turf due to the uneven nature of the infill. The focus of this research
will however be validate or invalidate the principle of the test in terms of its replication of realistic
human motion during a sliding tackle and will focus on identifying the characteristics of the sliding
tackle motion and compare these to the current testing protocol.
Craig Ingham 38
6.0 Hypotheses The identified knowledge gap enabled hypotheses to be drawn that would predict the performance
of the test in comparison to the real skin-surface interaction during a sliding tackle.
H1: The current testing procedure will not replicate the speed of a sliding tackle effectively.
H2: The current testing procedure will not replicate the direction of the skin-surface interaction
realistically.
H3: The applied force in the current testing procedure will not be reflective of the ground reaction
forces experienced between the skin and turf during a sliding tackle.
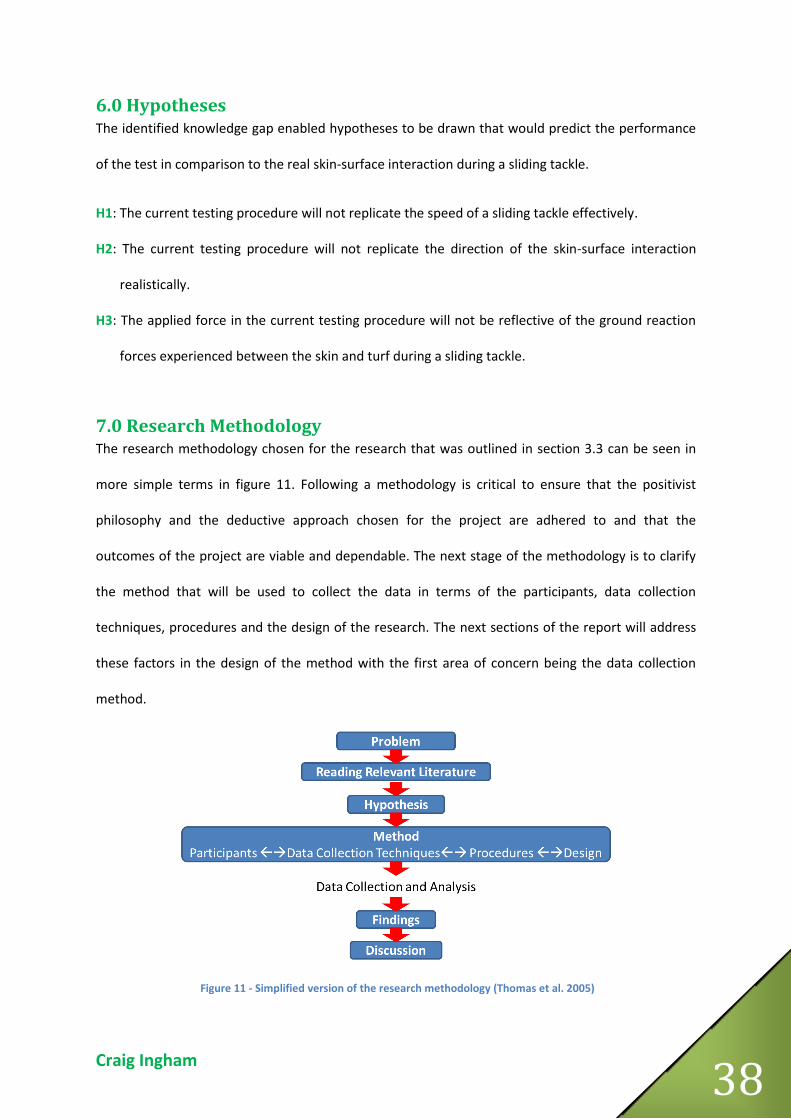
7.0 Research Methodology The research methodology chosen for the research that was outlined in section 3.3 can be seen in
more simple terms in figure 11. Following a methodology is critical to ensure that the positivist
philosophy and the deductive approach chosen for the project are adhered to and that the
outcomes of the project are viable and dependable. The next stage of the methodology is to clarify
the method that will be used to collect the data in terms of the participants, data collection
techniques, procedures and the design of the research. The next sections of the report will address
these factors in the design of the method with the first area of concern being the data collection
method.
Figure 11 - Simplified version of the research methodology (Thomas et al. 2005)
Craig Ingham 39
7.1 Data Collection Method If we look back to the research ‘onion’ outlined in section 3.1, we have effectively peeled back the
first two layers of the onion and now a strategy for the collection of data needs to be decided. As a
positivist philosophy has been chosen, which is associated with quantitative research, the generally
accepted method of data collection is to conduct an experiment (Saunders, et al., 2012). For this
research however, where the characteristics of the sliding tackle are being investigated, an
experiment is technically not the correct way to describe the data collection as no variables will be
changed to analyse the effect this has. It is therefore necessary to find another method of data
collection that better suits the research.
In its nature, the research will take an observational role as sliding tackles will be observed and then
retrospectively analysed. The best method of data collection sourced is to conduct structured or
systematic observational research (Sapsford & Jupp, 2006). This method of data collection still falls
within the positivist philosophy as it aims to produce precise quantitative data on pre-specified
interactions or behaviours. The method can take place in an open setting where subjects are simply
observed and analysis is conducted on their actions and behaviours. Alternatively, structured
research can take a more experimental feel where the environment is controlled somewhat and
observations are made on a particular action or behaviour that is performed within that setting.
For the purpose of this study an experiment oriented structured observational method of data
collection will be conducted.
8.0 Observational Design At the outset of the observational design, the intention was to utilise the biomechanics laboratory
within the university as the setting for the observations as it contains all of the facilities that would
be required to analyse the speed, direction and the forces involved within the sliding tackle. The
motion analysis system could be used to track the motion and speeds of the sliding tackles through
the use of markers placed on subjects. The forces could also have been recorded through the use of
Craig Ingham 40
the force plates within the laboratory; however analysis of the force plates highlighted that they
would not be large enough to measure the forces throughout the duration of the slide. In addition to
this, access to the laboratory and equipment could not be guaranteed within the desired timescale
and due to this it was decided that the laboratory would not be used as the setting for the
observations. This meant that hypothesis three would not be able to be tested in this research and
the focus would be placed on testing hypotheses one and two (i.e. the speed and direction of the
sliding tackle).
8.1 Observational Method As no studies had been conducted previously to analyse the sliding tackle, there were no
methodologies for designing the method in which to capture the data. Therefore the observations
had to be designed from scratch and were designed in an attempt to keep the motion as realistic as
possible while keeping the participants safe.
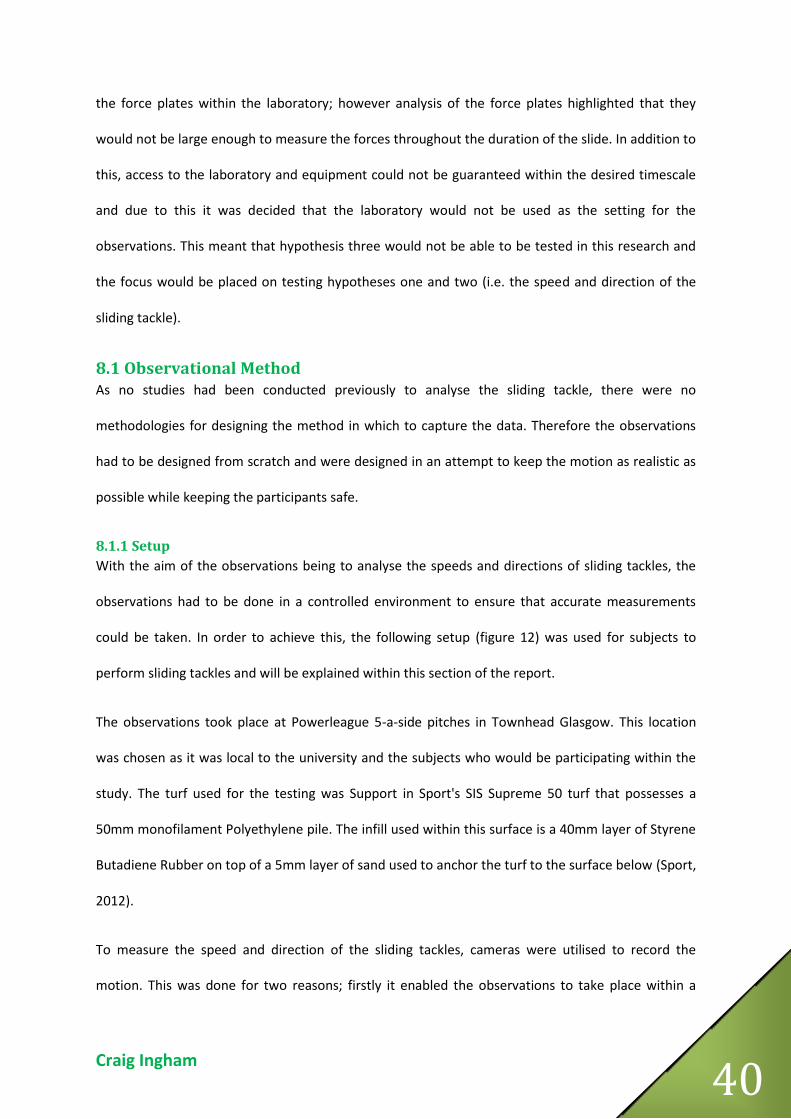
8.1.1 Setup With the aim of the observations being to analyse the speeds and directions of sliding tackles, the
observations had to be done in a controlled environment to ensure that accurate measurements
could be taken. In order to achieve this, the following setup (figure 12) was used for subjects to
perform sliding tackles and will be explained within this section of the report.
The observations took place at Powerleague 5-a-side pitches in Townhead Glasgow. This location
was chosen as it was local to the university and the subjects who would be participating within the
study. The turf used for the testing was Support in Sport's SIS Supreme 50 turf that possesses a
50mm monofilament Polyethylene pile. The infill used within this surface is a 40mm layer of Styrene
Butadiene Rubber on top of a 5mm layer of sand used to anchor the turf to the surface below (Sport,
2012).
To measure the speed and direction of the sliding tackles, cameras were utilised to record the
motion. This was done for two reasons; firstly it enabled the observations to take place within a
Craig Ingham 41
short space of time as all of the analysis on the motions would take place after the trials had taken
place. Secondly, the use of videos allowed accurate timing of the subjects to be conducted through a
third party program that was able to split the video down into separate frames (a full description of
the analysis will be in section 8.1.2). The cameras used for the test were Canon Legria FS 306 SD
video cameras that had an image resolution of 1910 x 1080 pixels to give a clear picture for the
analysis.
Figure 12 - Birdseye view of observational setup
In order to record the speeds of the subjects during the trials using videos, it was important to mark
out a set distance so that the speed could be calculated from the time taken to cover the specific
distance. This was done through the creation of a 'track' in which the subjects were asked to run
through prior to performing their slide. The subjects would start their run at the beginning of this
track and would then be asked to initiate their sliding tackle at the second set of cones towards a
ball that had been placed 2m past the end of the track. A ball was used to give the sliding tackle a
Craig Ingham 42
focal point as performing a sliding tackle without having anything to tackle would not produce slides
that would be realistic. The track length was set to 6m as this length of track would give more
accurate results of the speed than using a shorter track of one or two metres long. Ideally an
instantaneous speed at the moment of the sliding tackle initiation would have been calculated,
however this was not possible by using cameras and as such an average speed over the 6m
preceding the tackle was used to indicate the speeds of the subject upon the initiation of the tackle
motion.
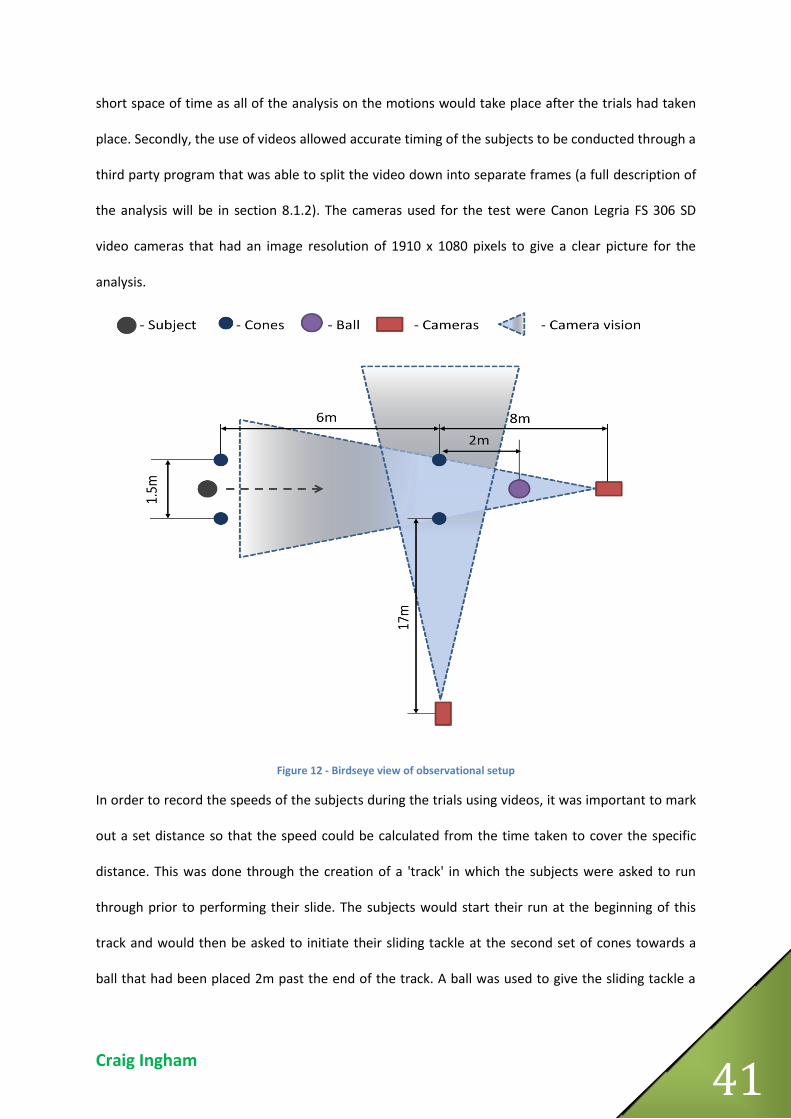
Following the creation of the track, the cameras were positioned strategically to capture the
appropriate data. One camera was placed exactly perpendicular to the cones depicting the end of
the track as this would capture the subjects running between the cones to calculate the speed and in
addition to this the duration of the slide would also be recorded. The second camera was placed
parallel to the created track and this camera would be utilised to evaluate the direction of the
contact between the body and the surface. Images of the camera locations in respect to the cones
can be seen in figure 13.
Figure 13 - Camera positions
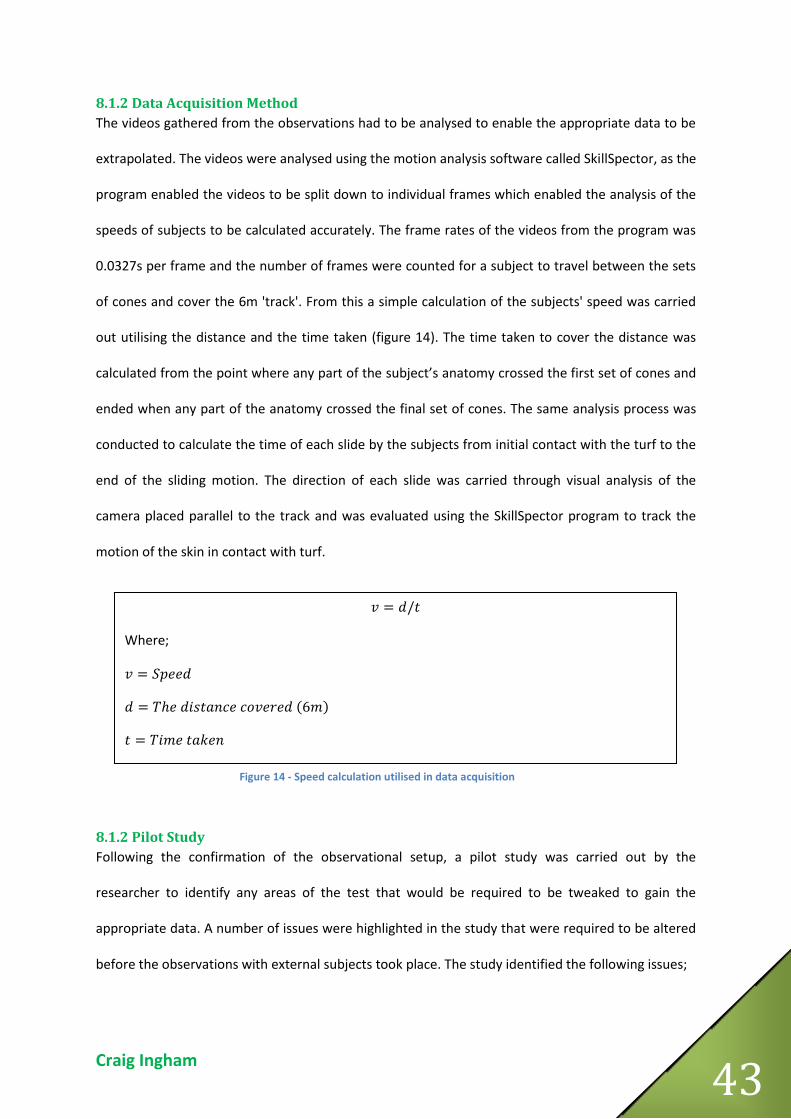
Craig Ingham 43
8.1.2 Data Acquisition Method The videos gathered from the observations had to be analysed to enable the appropriate data to be
extrapolated. The videos were analysed using the motion analysis software called SkillSpector, as the
program enabled the videos to be split down to individual frames which enabled the analysis of the
speeds of subjects to be calculated accurately. The frame rates of the videos from the program was
0.0327s per frame and the number of frames were counted for a subject to travel between the sets
of cones and cover the 6m 'track'. From this a simple calculation of the subjects' speed was carried
out utilising the distance and the time taken (figure 14). The time taken to cover the distance was
calculated from the point where any part of the subject’s anatomy crossed the first set of cones and
ended when any part of the anatomy crossed the final set of cones. The same analysis process was
conducted to calculate the time of each slide by the subjects from initial contact with the turf to the
end of the sliding motion. The direction of each slide was carried through visual analysis of the
camera placed parallel to the track and was evaluated using the SkillSpector program to track the
motion of the skin in contact with turf.
8.1.2 Pilot Study Following the confirmation of the observational setup, a pilot study was carried out by the
researcher to identify any areas of the test that would be required to be tweaked to gain the
appropriate data. A number of issues were highlighted in the study that were required to be altered
before the observations with external subjects took place. The study identified the following issues;
𝑣 = 𝑑/𝑡
𝑣 = 𝑆𝑝𝑒𝑒𝑑
𝑑 = 𝑇ℎ𝑒 𝑑𝑖𝑠𝑡𝑎𝑛𝑐𝑒 𝑐𝑜𝑣𝑒𝑟𝑒𝑑 (6𝑚)
𝑡 = 𝑇𝑖𝑚𝑒 𝑡𝑎𝑘𝑒𝑛
Where;
Figure 14 - Speed calculation utilised in data acquisition
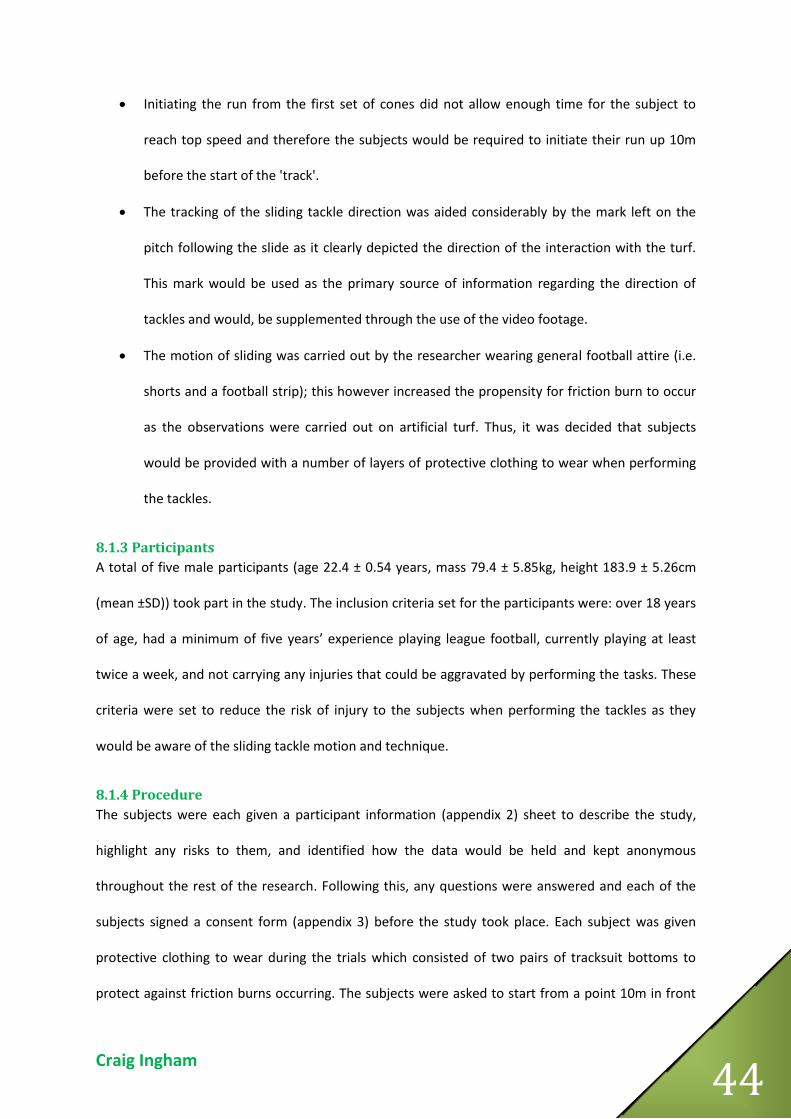
Craig Ingham 44
Initiating the run from the first set of cones did not allow enough time for the subject to
reach top speed and therefore the subjects would be required to initiate their run up 10m
before the start of the 'track'.
The tracking of the sliding tackle direction was aided considerably by the mark left on the
pitch following the slide as it clearly depicted the direction of the interaction with the turf.
This mark would be used as the primary source of information regarding the direction of
tackles and would, be supplemented through the use of the video footage.
The motion of sliding was carried out by the researcher wearing general football attire (i.e.
shorts and a football strip); this however increased the propensity for friction burn to occur
as the observations were carried out on artificial turf. Thus, it was decided that subjects
would be provided with a number of layers of protective clothing to wear when performing
the tackles.
8.1.3 Participants A total of five male participants (age 22.4 ± 0.54 years, mass 79.4 ± 5.85kg, height 183.9 ± 5.26cm
(mean ±SD)) took part in the study. The inclusion criteria set for the participants were: over 18 years
of age, had a minimum of five years’ experience playing league football, currently playing at least
twice a week, and not carrying any injuries that could be aggravated by performing the tasks. These
criteria were set to reduce the risk of injury to the subjects when performing the tackles as they
would be aware of the sliding tackle motion and technique.
8.1.4 Procedure The subjects were each given a participant information (appendix 2) sheet to describe the study,
highlight any risks to them, and identified how the data would be held and kept anonymous
throughout the rest of the research. Following this, any questions were answered and each of the
subjects signed a consent form (appendix 3) before the study took place. Each subject was given
protective clothing to wear during the trials which consisted of two pairs of tracksuit bottoms to
protect against friction burns occurring. The subjects were asked to start from a point 10m in front
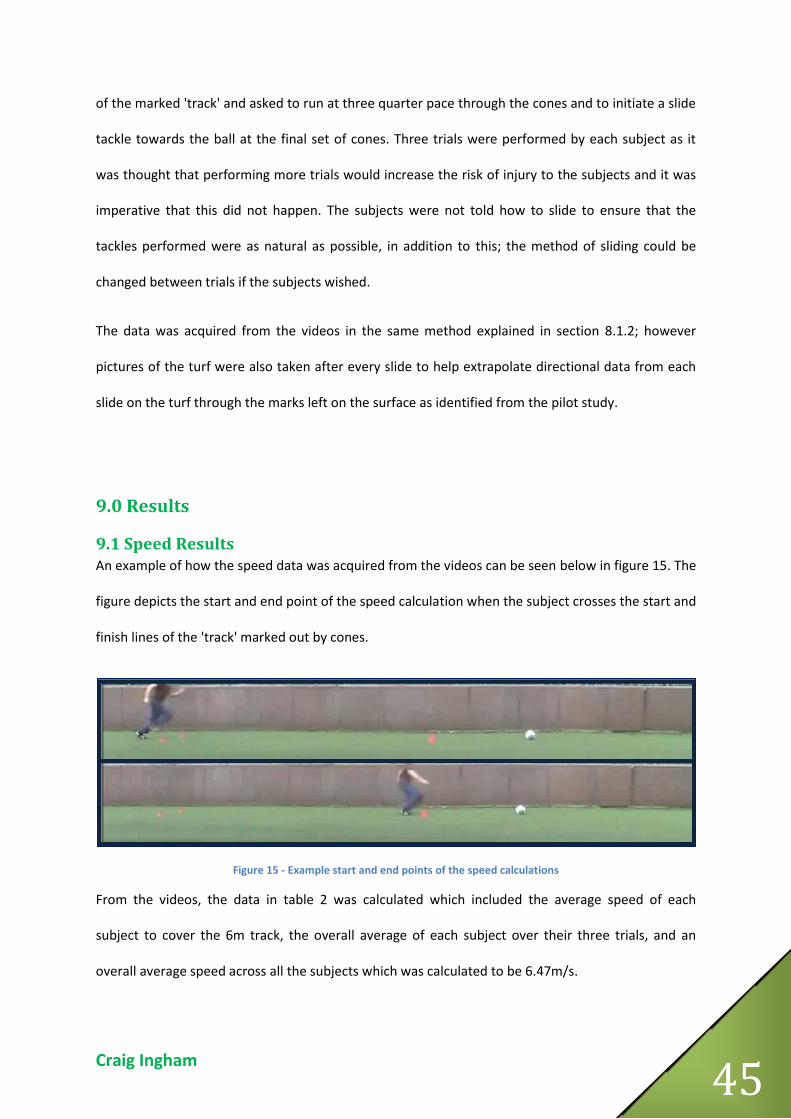
Craig Ingham 45
of the marked 'track' and asked to run at three quarter pace through the cones and to initiate a slide
tackle towards the ball at the final set of cones. Three trials were performed by each subject as it
was thought that performing more trials would increase the risk of injury to the subjects and it was
imperative that this did not happen. The subjects were not told how to slide to ensure that the
tackles performed were as natural as possible, in addition to this; the method of sliding could be
changed between trials if the subjects wished.
The data was acquired from the videos in the same method explained in section 8.1.2; however
pictures of the turf were also taken after every slide to help extrapolate directional data from each
slide on the turf through the marks left on the surface as identified from the pilot study.
9.0 Results
9.1 Speed Results An example of how the speed data was acquired from the videos can be seen below in figure 15. The
figure depicts the start and end point of the speed calculation when the subject crosses the start and
finish lines of the 'track' marked out by cones.
Figure 15 - Example start and end points of the speed calculations
From the videos, the data in table 2 was calculated which included the average speed of each
subject to cover the 6m track, the overall average of each subject over their three trials, and an
overall average speed across all the subjects which was calculated to be 6.47m/s.
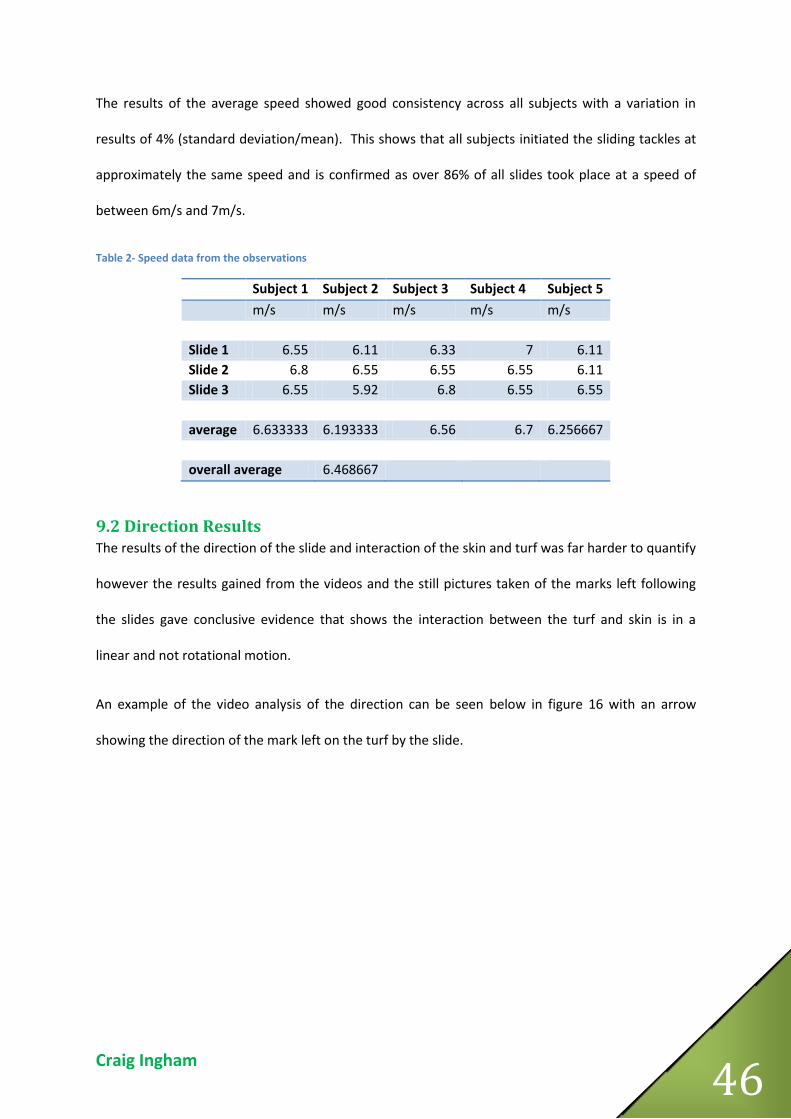
Craig Ingham 46
The results of the average speed showed good consistency across all subjects with a variation in
results of 4% (standard deviation/mean). This shows that all subjects initiated the sliding tackles at
approximately the same speed and is confirmed as over 86% of all slides took place at a speed of
between 6m/s and 7m/s.
Table 2- Speed data from the observations
Subject 1 Subject 2 Subject 3 Subject 4 Subject 5 m/s m/s m/s m/s m/s Slide 1 6.55 6.11 6.33 7 6.11 Slide 2 6.8 6.55 6.55 6.55 6.11 Slide 3 6.55 5.92 6.8 6.55 6.55 average 6.633333 6.193333 6.56 6.7 6.256667 overall average 6.468667
9.2 Direction Results The results of the direction of the slide and interaction of the skin and turf was far harder to quantify
however the results gained from the videos and the still pictures taken of the marks left following
the slides gave conclusive evidence that shows the interaction between the turf and skin is in a
linear and not rotational motion.
An example of the video analysis of the direction can be seen below in figure 16 with an arrow
showing the direction of the mark left on the turf by the slide.
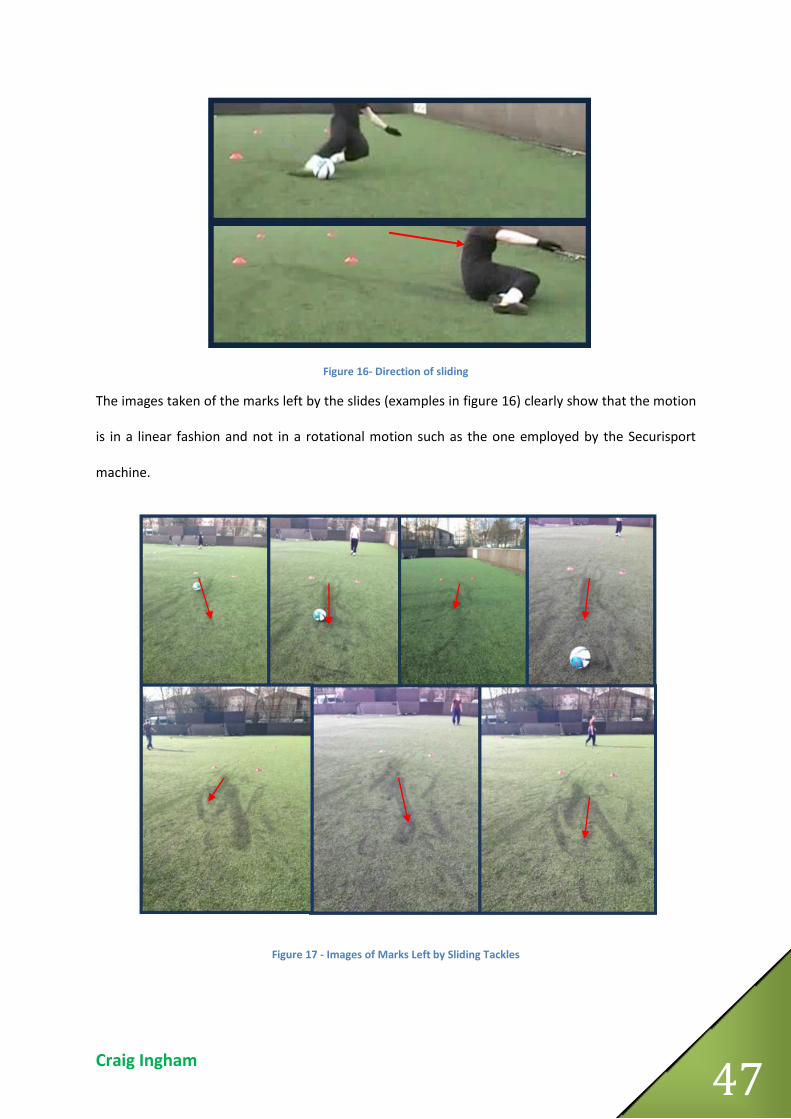
Craig Ingham 47
Figure 16- Direction of sliding
The images taken of the marks left by the slides (examples in figure 16) clearly show that the motion
is in a linear fashion and not in a rotational motion such as the one employed by the Securisport
machine.
Figure 17 - Images of Marks Left by Sliding Tackles

Craig Ingham 48
9.3 Slide Time Results The time of slide was also calculated from the videos to analyse how long the skin would be in
contact with the turf during a slide. The method used to do this was the same method used to
calculate the speed of the subjects with the frames counted from the moment that the skin would
be in contact with the turf to when the motion of the slide had ceased. The results from this can be
seen below in table 3.
Table 3- Slide times from observations
Subject 1 Subject 2 Subject 3 Subject 4 Subject 5 s s s s s Slide 1 0.46 0.75 0.65 0.85 0.62 Slide 2 0.39 0.88 0.75 0.62 0.52 Slide 3 0.72 0.72 0.75 0.69 0.59 average 0.523333 0.783333 0.716667 0.72 0.576667 overall average 0.664
Further analysis of the slide times showed that the variation in results was far greater (20%) than
that of the slide entry speed. It was thought that the time of slide would be directly related to the
speed at which the slide took place. This was investigated through the use of a Pearson correlation
coefficient calculation that would show if the two sets of results were in fact correlated and that the
speed had an effect on the time of the slide. In this analysis, the closer the coefficient value is to 1,
the more correlated the two sets of data are. The analysis showed that there was almost no
correlation (0.08) between the speed of the subject upon initiating the slide tackle and the time of
the slide.
10.0 Discussion Now that the appropriate data has been acquired from the videos and the required analysis has
been performed, the results will be discussed in the following sections. The first section (10.1) will
discuss the results and attempt to rationalise why certain things happened within the observations.
Craig Ingham 49
Following this, section 10.2 will put the findings into the context of the research and evaluate the
findings against the hypotheses drawn prior to the observations and the initial aims of the project.
Following this, the limitations of the research will be outlined with recommendations for future work
considered and recommended adaptations to the testing procedure proposed.
10.1 Results Discussion The results of the subjects’ speeds over the trials highlighted that all of the subjects ran between the
cones at approximately the same speed. The consistency of results was surprising as it would be
expected that the subjects would approach the sliding tackle at different speeds due to individual
preferences and running speeds. It appears that the subjects felt it was the most appropriate speed
at which to approach the stationary ball that was used for the observations as the motivation of a
real game scenario was not present. In a real game situation, a sliding tackle is generally performed
when a standing tackle cannot be performed as the ball is out of reach and is often performed as a
last resort to tackle an opponent. In the study, opponents were not used in order to reduce the risk
of injury to the subjects and injury prevention may have been another reason that the subjects
chose to approach the tackles at this speed.
The direction of the sliding tackles was shown to be in a linear direction as opposed to the rotational
motion utilised in the Securisport test which was hypothesised prior to the observations taking
place. Within the observations many different methods of sliding tackle were employed by the
subjects, some tackles performed attacked the ball straight on where as others slid towards the ball
and attacked it from the side to clear it. Even with this variation in slide types and the variation
between subjects in terms of style and technique, all of the tackles were shown to have a linear
interaction between the body and turf. The quantification of the slide directions was hard to
achieve, however the results clearly showed that the interaction between the turf and the subjects
was in a linear and not rotational motion.
Craig Ingham 50
The time of interaction with the turf was consistently less than one second with 86% of the tackles
having a slide time of 0.75s or less. This value is considerably less than the current interaction time
used by the Securisport test which keeps the silicone skin in contact with the turf for over 3 seconds
during the test. The slide times also showed a far higher variation (20%) than that of the approach
speed to the tackles and also confirmed that there was no correlation between the speed and the
slide time. The reasoning for this can be accredited to a number of potential factors; the different
styles of tackle employed by the subjects affected the amount of the body in contact with turf. The
size of the area in contact with the turf will affect the frictional coefficient between the body and the
turf. If the slide took place with only one knee in contact with the turf for instance, then the slide
would be shorter as more force would be pressing down into the turf than if the slide was
performed on the whole leg as the pressure would be distributed across the whole area in contact
with the turf. Thus, slides with a smaller area of contact in theory will have ended quicker than slides
which had a larger contact area between the body and the turf.
A number of subjects also attempted to get up from the slide before it had stopped naturally where
as other participants waited until the friction had stopped the slide before getting to their feet. In
addition to this, if a subject’s boot caught the ground as they jumped into the slide, the speed of the
tackle would reduce and thus decrease the time of slide without affecting the speed measurement
taken prior to the slide. Another factor that may have affected the time of slide was that the
subjects wore protective tracksuit bottoms on their legs to protect against friction burn. This may
have affected the slide time due the difference in surface roughness of the fabric in comparison to
human skin. The surface roughness was shown by Blau (2001) to be a factor that can change the
frictional properties between two bodies and if the roughness of the fabric was higher than that of
the skin the frictional coefficient would have increased which in turn would have reduced the time
of the slide. This however was not something that could have been protected against during the
observations as the subjects had to be protected from injury as much as possible.
Craig Ingham 51
10.2 Research Discussion The aim of the research was to either validate or invalidate the current Securisport testing
procedure for the measurement of skin friction on artificial turf. Following the literature review
process, the focus of the research was placed on validating or invalidating the principal of the test in
terms of how the silicone skin interacts with the turf and its ability to replicate the true skin and
surface interaction. The purpose of the observations conducted was to test the proposed
hypotheses developed from the gaps in knowledge identified from the literature review process. The
hypotheses tested were;
H1: The current testing procedure will not replicate the speed of a sliding tackle effectively.
H2: The current testing procedure will not replicate the direction of the skin-surface interaction
realistically.
The discussion will focus on each of these hypotheses and the impact that the results have on either
validating or invalidating the testing procedure currently followed by FIFA.
Throughout the literature review it was clear that skin friction is currently the biggest problem with
artificial turf in the eyes of the people who interact with it on a regular basis (Burillo, et al., 2012)
(Zanetti, 2009) and this was clarified in the injury studies analysed that showed artificial turf causes
more skin injuries and abrasions than natural turf (Meyers & Barnhill, 2004). With this in mind, the
testing of artificial turf for the frictional properties between it and skin is one of the most important
tests that is run by FIFA as it is concerned with the safety of the players. In order for the procedure
to be an effective way of testing the friction coefficients between skin and turf it is required to
replicate the human motion and loading effectively or the results may be invalid in the way in which
they are interpreted (Fleming, 2011).
The research conducted showed that the speed of the subjects before the initiation of the tackle was
on average 6.47m/s with the maximum speed measured being 7m/s. This maximum value is
Craig Ingham 52
important as it represents the worst case scenario of the testing and this should be the method used
when testing factors that can affect player safety. In reality it is expected that the speed of sliding
tackles will in fact be higher than the measured values due to the increased motivation and
aggression when playing a game in real time. The speeds measured are however considerably
greater than the speeds currently used within the testing procedure. The speed used currently
within the test is 0.84m/s (as shown in section 4.2) which in comparison to the maximum speed
measured in the observations is a 72% reduction. This difference supports hypothesis one and
shows that the testing procedure used by FIFA does not replicate the speed of the skin and surface
interaction realistically.
Replicating the speed of a true interaction is important in order to gain a true value of the friction
between the skin and the surface. Blau (2001) highlighted that the speed of the relative bodies plays
a part in the frictional properties between the two bodies (table 1). Although speed is not one of the
main factors in the generation of friction, it plays a large role in generating heat during the motion as
more of the mechanical energy is converted to heat with an increase in speed. This increase in heat
has been associated with 'burn' type injuries from artificial turf (Sanchis, et al., 2009) and this may
be the reason why the abrasion injuries received from sliding on artificial turf are often referred to
as 'friction burns'. To ensure that the test is effective it is therefore crucial that the true speed of the
interaction between the skin and turf is replicated within the test.
The focus of hypothesis two was concerned with the direction of interaction between the skin and
turf. The results from the observations proved that the interaction takes place in a linear motion and
not in a rotational motion such as the one used in the current testing protocol. Figure 18 below
depicts the marks left on the artificial turf following one of the slides performed in the observations
(left) and following the testing from the Securisport machine (right). It can clearly be seen that the
motion used by the Securisport machine does not replicate that of the true interaction between the
skin and turf during a sliding tackle, thus proving hypothesis two to be correct. The effect of the test
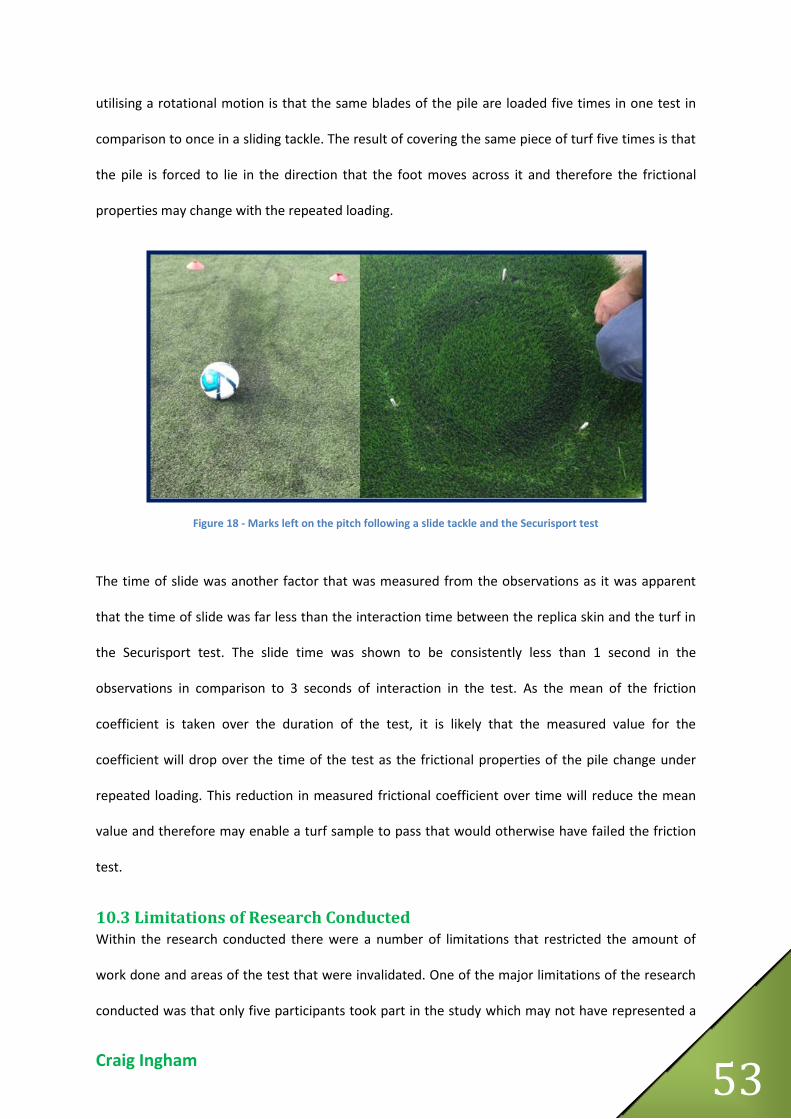
Craig Ingham 53
utilising a rotational motion is that the same blades of the pile are loaded five times in one test in
comparison to once in a sliding tackle. The result of covering the same piece of turf five times is that
the pile is forced to lie in the direction that the foot moves across it and therefore the frictional
properties may change with the repeated loading.
Figure 18 - Marks left on the pitch following a slide tackle and the Securisport test
The time of slide was another factor that was measured from the observations as it was apparent
that the time of slide was far less than the interaction time between the replica skin and the turf in
the Securisport test. The slide time was shown to be consistently less than 1 second in the
observations in comparison to 3 seconds of interaction in the test. As the mean of the friction
coefficient is taken over the duration of the test, it is likely that the measured value for the
coefficient will drop over the time of the test as the frictional properties of the pile change under
repeated loading. This reduction in measured frictional coefficient over time will reduce the mean
value and therefore may enable a turf sample to pass that would otherwise have failed the friction
test.
10.3 Limitations of Research Conducted Within the research conducted there were a number of limitations that restricted the amount of
work done and areas of the test that were invalidated. One of the major limitations of the research
conducted was that only five participants took part in the study which may not have represented a
Craig Ingham 54
larger population adequately. Due to the time constraints of the research more subjects could not
be recruited and as such only five were able to participate. From these five subjects, fifteen trials
were recorded which gave a good range of data however more trials could not be performed by the
subjects to reduce the risk of injury when performing the sliding tackles. A larger range of subjects
including a wider variation in skill levels would beneficial to better represent the larger population
and give more accurate data. Essentially the study can be thought of a pilot study on which future
studies into the aspects of the sliding tackle can be based.
Within the observations performed, it was difficult to quantify the direction of the sliding tackles
took however it was clear that the direction was far more linear than the motion used in the current
testing setup. One potential method to measure this would be to place a bird's eye view camera
directly above the area of the tackles to enable this to be better recorded and quantified in terms of
the linearity of the motion.
The research utilised a stationary ball for the subjects to perform their sliding tackles and as such the
speeds and directions may not be wholly representative of sliding tackles in a game situation as the
motivation will change with chasing an opponent and trying to recover the ball for their team. This
could not be accounted for within the research as the safety of the subjects was of paramount
importance and it was felt that this would have been an unnecessary risk to take.
Finally, within the research conducted the speeds recorded were average speeds over the six metre
track that was marked out on the turf and were not a record of the instantaneous speeds over the
time of the sliding tackle. This would be beneficial to record as the average speed may not give
exactly accurate data of the speed of tackle as subjects may have slowed slightly before sliding or
may have caught their boot in the turf before the slide commenced.
Craig Ingham 55
10.4 Future work The research conducted shows that the current test does not replicate the interaction between the
skin and turf in a number of ways, namely speed, direction, and time of slide. There is however more
work that can be done to further develop the skin friction test and improve its validity.
The research conducted did not analyse the forces involved during the sliding tackle and this is an
area that requires research due to the large impact that the normal force can have on the
generation of friction between two bodies (Blau, 2001). This analysis of force could be done utilising
force plates in a biomechanics laboratory however large force plates would be required to evaluate
the forces across the entirety of the slide. In addition to this, covering the force plates with artificial
turf or another material to absorb the impact of the tackles could be problematic to achieve while
retaining the validity of the results. If these problems could be overcome the testing would be very
beneficial as it would enable accurate analysis to be performed on the sliding tackle mechanics.
Overall the research was limited to addressing the principal of the testing procedure in terms of how
the silicon skin interacts with the turf and was not able to address a number of the technical areas of
the test that may require further work and research. The areas identified that could be further
researched and amended include the suitability of the silicone skin at representing human skin upon
its interaction with the turf. In addition to this, the interaction between the pile and infill of the turf
is an area that requires further analysis to identify the impact that this has on the frictional
coefficients between the skin and turf.
Craig Ingham 56
10.5 Recommendations for Adaptations to Testing Procedure The current testing procedure clearly does not represent the true motion of the sliding tackle as
proved by the research conducted. It is therefore necessary to recommend a method for the
improvement of the skin friction test that will enable it to be more biofidelic in its nature. From the
results of the research, it is recommended that the silicone skin is exposed to the turf in a linear
motion, with a speed of 7m/s, and a slide time of one second to represent the worst case scenario.
Within the literature review process work conducted by Verhelst, et al. (2009) was analysed as it
highlighted a method of analysing the turf in a linear fashion however it utilised speeds that
appeared not to be derived from any particular source. The research conducted reinforces that this
work presents a more realistic simulation of the skin-surface interaction however the speeds should
be altered to align with the results of this research.
Craig Ingham 57
11.0 Conclusions The aim of the research was to validate or invalidate the method of testing artificial turf for its
frictional interaction with human skin used by FIFA through the Securisport machine. A positivist
research philosophy along with a deductive approach was chosen to direct the research before the
literature review process began. The process of reviewing literature highlighted a number of areas
surrounding the test that could be improved including a clear gap in knowledge surrounding the true
interaction between the skin and turf during a sliding tackle which is responsible for many of the
frictional injuries suffered on artificial turf. From the identified knowledge gap, a number of
hypotheses were formed that aimed to fill this gap in the knowledge.
Structured observations were taken as the data collection method to identify the characteristics of
the sliding tackle in terms of the speed, direction, and time of interaction between the skin and turf.
The study showed that the speed of sliding tackles is on average 6.47m/s with a linear direction and
a slide time of on average 0.66s. This supported the hypotheses that the current testing procedure
does not realistically simulate the human interaction with the turf in a sliding tackle situation. From
this recommendations have been made that echo the results of the observations.
Ultimately the research has achieved the aims and objectives outlined at the start of the project
through the use of a structured methodology that enabled a contribution to knowledge to be made
effectively. The results of the research can be used to redesign the current FIFA testing procedure
for skin friction and make it a more biofidelic and realistic motion that will ultimately achieve more
realistic results of friction coefficients and abrasion levels from samples of artificial turf. This it is
hoped, will lead to safer playing surfaces for footballers across the globe and increased levels of
satisfaction with artificial turf surfaces.
Craig Ingham 58
12.0 References Agrawal, A., Raibagkar, S. C. & Vora, H. J., 2008. Friction Burns: Epidemiology and Prevention. Annals of Burns and Fire Disasters, 21(1), pp. 3 - 6.
Akkaya, S. et al., 2011. Football injuries on synthetic turf fields. Joint diseases and related surgery, 22(3), pp. 155 - 159.
Alcantara, E., Gamez, J., Rosa, D. & Sanchis, M., 2009. Analysis of the influence of rubber infill
morphology on the mechanical performance of artificial turf surfaces for soccer. Journal of sports engineering and technology, pp. 1 - 9.
Andersson, E., Ekblom, B. & Krustrup, P., 2008. Elite footballer on artificial turf versus natural grass:
movement patterns, technical standards, and player impressions. Journal of sports sciences, pp. 113
- 122.
Aoki, H. et al., 2012. Incidence of injury among adolescent soccer players: a comparitive study of
artificial and natural grass. Clinical journal of sports medicine, pp. 1 - 7.
BBC, 2013. Saracens train on artifical pitch at Allianz park. [Online]
Available at: http://www.bbc.co.uk/sport/0/rugby-union/20899266
[Accessed 4 January 2013].
Blau, P., 2001. Experimental aspects of friction research on the macroscale.. In: B. Bhushnan, ed.
Fundamentals of and bridging the gap between macro- and micro-/nanosclae tribology. Dordrecht:
Kluwer.
Blau, P. J., 2001. The significance and use of the friction coefficient. Tribology international, Volume
34, pp. 585 - 591.
Burillo, P., Gallardo, L., Felipe, J. L. & Gallardo, A. M., 2012. Artificial turf surface: Perception of
safety, sporting feature, satisfaction and preference of football users. European Journal of Sport Science, pp. 1 - 11.
Dalton, B., 1982. Friction, intermitted or otherwise, the exciting cause of corns and callous.
Chiropodist, Volume 37, pp. 372 - 380.
Ekstrand, J., Timpka, T. & Hagglund, M., 2006. Risk of injury in elite football played on artificial turf
versus natural grass: a prospective two-cohort study. British journal of sports medicine, Volume 40,
pp. 975 - 980.
FIFA, 2009. FIFA quality concept - handbook of test methods for football turf, s.l.: FIFA.
Fleming, P., 2011. Artificial turf systems for sport surfaces: current knowledge and research needs.
Journal of Sports Engineering and Technology, Volume 225, pp. 43 - 64.
Foster, J. B., 2007. Newer artificial turf appears safer for soccer players. Biomechanics, pp. 9 - 10.
Gerhardt, L. et al., 2008. Influence of epidermal hydration on the friction of human skin. Journal of the royal society, Volume 5, pp. 1317 - 1328.
Craig Ingham 59
Giulianotti, R., 1999. Football: A sociology of the Global Game. 2 ed. s.l.:Polity Press.
GmbH, W. M., 2008. Securisport III: User Manual, Onasbruck: s.n.
Goosens, R. H., Zegers, R., Hoek van Dijke, G. A. & Snijders, C. J., 1994. Influence of shear on shear on
skin oxygen tension. Clinical Physiology, Volume 14, pp. 111 - 118.
Guerra, C. & Schwartz, C. J., 2011. Development of a synthetic skin simulant platform for the
investigation of dermal blistering mechanics. Tribology letter, Volume 44, pp. 223 - 228.
Jost, H. P., 1966. Lubrication (tribology) education and research. A report on the present position and the industry's needs., London: Department of Education and Science, Her Majesty's Stationary Office
(HMSO).
Kolitzus, H. J., 2007. Artificial Turf Surface for Soccer, Ebnat-Kappel: United States Sports Surfacing
Laboratory.
Kusuma, S., Vuthoori, R. K., Piliang, M. & Zins, J. E., 2010. Skin Anatomy and Physiology. In: M. Z.
Siemionow & M. Eisenmann-Klein, eds. Plastic and Reconstructive Surgery. London: Springer, pp. 161
- 171.
Mclaren, N., Fleming, P. & Forrester, S., 2012. Artifical grass: A conceptual model for degradation in performance. Loughborough, Elsevier Ltd..
Meyers, M. C. & Barnhill, B. S., 2004. Incidence, Causes, and Severity of High School Football Injuries
on FieldTurf Versus Natural Turf. American Journal of Sports Medicine, pp. 1626-1638.
Oxford, 2012. Paperback Oxford English Dictionary. s.l.:OUP Oxford.
Powell, J., 2006. Skin physiology. Surgery, 24(3), pp. 1 - 4.
Sanchis, M. et al., 2009. Development of a new technique to evaluate abrasiveness artificial turf. In:
M. Estivalet & P. Brisson, eds. The engineering of sport 7. s.l.:Springer, pp. 149 - 156.
Sapsford, R. & Jupp, V., 2006. Data Colection and Analysis. 2nd ed. London: Sage.
Saunders, M., Lewis, P. & Thornhill, A., 2012. Research Methods for Business Students. Harrow:
Pearson.
Sekine, S., Ogawa, K. & Nakatsuka, Y., 2009. The influence of sliding tackles on italian national team
defence - game analysis on italian national team in the second round of the 2006 FIFA world cup.
Football science, Volume 6, pp. 24 - 33.
Siavamani, R., Goodman, J., Gitis, N. V. & Maibach, H. I., 2003. Friction coefficient of skin in real-
time. Skin research and technology, Volume 9, pp. 235 - 239.
Suh, N. P., Mosleh, M. & Howard, P. S., 1994. Control of friction. Wear, Volume 175, pp. 151 - 158.
Sulzberger, M. B., Cartese, T., Fishman, L. & Wiley, H., 1966. Studies on blisters produced by friction.
Journal of investigative dermatology, Volume 47, pp. 456 - 465.
Craig Ingham 60
Sport, S. i., 2012. Synthetic Soccer Turf - Artificial Football Pitches. [Online]
Available at: http://www.supportinsport.com/synthetic-soccer.html
[Accessed 14 January 2013].
Thiolon, 2005. Ten Cate Thiolon Product Advisory, s.l.: Ten Cate.
Thompson, D., 2005. A critical review of the literature on pressure ulcer aetiology. Journal of Wound Care, Volume 14, pp. 87 - 90.
Venus, M., Waterman, J. & McNab, I., 2011. Basic Physiology of the skin. Surgery, 29(10), pp. 471 -
474.
Verhelst, R., Rambour, S., Verleysen, P. & Degrieck, J., 2009. Temperature development during sliding on different types of artificial turf for hockey. s.l., European Cooperation in Science and Technology.
White, B., 2000. Dissertation Skills for Business and Management Students. London: Continuum.
Yamaner, F. et al., 2009. Amator ve profesyonel futbolcularin alt ekstremite yaralanmalarinin
arastirmasi. Genel Tip Derg, pp. 105 - 112.
Zanetti, E. M., 2009. Amateur football game on artificial turf: Players perceptions. Applied Ergonomics, pp. 485-490.
Zhang, M. & Mak, A., 1999. In vivo friction properties of human skin. Prosthetics and orthotics international, Volume 23, pp. 135 - 141.
13.0 Bibliography
Fleming, P. et al., 2005. Human perceptions of artificial surfaces for field hockey. Sports Engineering, Volume 8, pp. 121 - 136.
Fuller, C. W. et al., 2006. Consensus statement on injury definitions and data collection procedures
in studies of football (soccer) injuries. British Journal of Sports Medicine, pp. 193 - 201.
McNitt, A. S., Landschoot, P. J. & Petrukak, D. M., 2004. Evaluation of the playing surface hardness of an infilled synthetic turf system. Wisconsin, International society for horticultural science
Moore, D. F., 1972. Elastomeric friction. In: D. F. Moore, ed. The friction and lubrication of elastomers. Oxford: Pergamon, pp. 21 - 23.
Smalls, L. K., Wickett, R. R. & Visscher, M. O., 2006. Effect of dermal thickness, tissue composition,
and body site on skin biomechanical properties. Skin research and technology, Volume 12, pp. 43 -
49.
Thomas, J. R., Nelson, J. K. & Silverman, S. J., 2005. Research Methods in Physical Activity. Illionois:
Human Kinetics.
Uesugi, M., Kishida, H. & Tsubakihara, Y., 1988. Behaviour of sand particles in sand-steel friction.
Soild and foundations, 28(1), pp. 107 - 118.

Craig Ingham 61
14.0 Appendices
14.1 Appendix 1 - FIFA Skin Friction Testing Guidelines

Craig Ingham 62
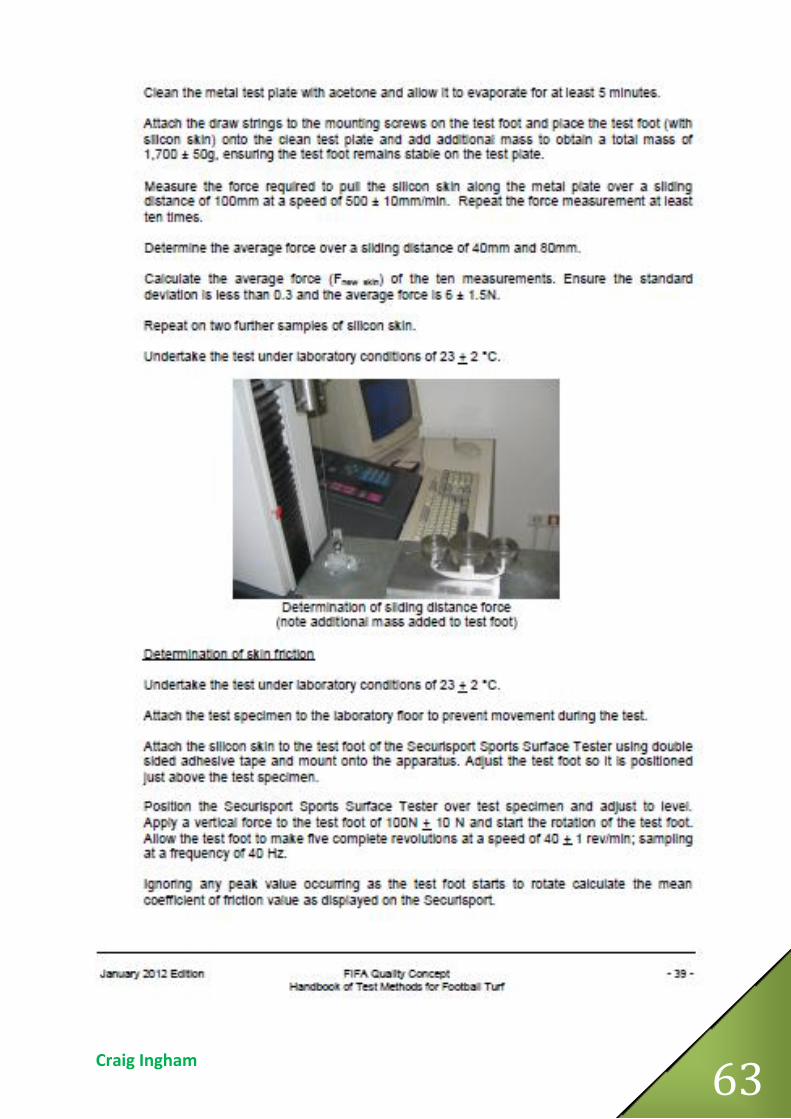
Craig Ingham 63
Craig Ingham 64
Craig Ingham 65
14.2 Appendix 2 - Participant Information Sheet
Participant Information Sheet Name of department: Department of Design, Manufacture and Engineering Management Title of the study: Investigation into the characteristics of a soccer sliding tackle
Introduction My name is Craig Ingham and I am an undergraduate student at the University of Strathclyde
studying for my Masters degree in sports engineering. Part of the year is to complete a dissertation
for which I am required to carry out this research. My contact details are highlighted below.
Name - Craig Ingham
Email - [email protected]
Phone number - 07810848810
What is the purpose of this investigation? There presently is no literature and analysis on the sliding tackle and the biomechanics involved in
this movement. This investigation aims to identify the characteristics of the sliding tackle motion, in
particular the speed and direction of the slide.
This data is required to analyse the accuracy of a FIFA testing procedure which is aimed at identifying
the friction between the human skin and an artificial turf pitch. The arrangement of the current test
has not been designed around true real life data taken from footballers and as such may not truly
replicate the sliding tackle. Having this data will allow the test to be highlighted as a suitable or
unsuitable test of friction and recommendations for upgrading the test can then be made.
Do you have to take part?
If you choose to participate, you will be asked to attend a testing day for one hour between 11 am
and 41pm at the Powerleague 5-a-side football pitches in Townhead during the month of February
2013. The testing will consist of you being asked to perform a number of sliding tackles on the pitch
with videos taken of the slides to analyse the motion. Specific details of the test can be found below.
It is important to notice that you will be free to withdraw yourself or your data from the
investigation at any time should you wish to do so. Participation or declining to take part will not
affect your standing in the University in any way.
What will you do in the project? Each subject will be asked to start at one end of the pitch and when informed, they will be required
to run at near full pace between a set of cones on the ground. Upon reaching the second set of
cones, they will be required to initiate a sliding tackle motion towards a ball placed on the turf. The
number of slides taken will depend on the number of subjects for the test; however it will not be
more than a total of five slides. The subjects will not be told how to slide in order to vary the types of

Craig Ingham 66
sliding tackles analysed, with the only instruction being to perform the slide at near full speed and
the initiation of the slide should occur at the markers on the turf. Subjects will be provided with a
pair of jogging bottoms to wear to prevent friction burn occurring on the turf and will be asked to
wear football boots during the trials.
From the videos taken, analysis will be conducted on the speed of the subject as the slide initiates
and the direction of the slide over the turf.
Why have you been invited to take part? One group of subjects has been asked to take part in the study who are all footballers that have
played for a number of years and are familiar with the sliding tackle motion. This is to ensure that
each participant can perform a sliding tackle easily and safely while providing the data required for
the project. The specific criteria for each participant can be seen below;
Must be over 18 years of age
Must have participated in football for a minimum of five years
Must currently participate in football for at least two hours a week
Must be free from injuries that will limit your ability to safely perform the test
Unfortunately, if you fail to meet any of the above criteria you cannot perform the testing.
What are the potential risks to you in taking part? The risks within the test have been considered and minimised where possible to reduce the risk to
you during the testing procedure. The potential risks are;
Receiving friction burn during the sliding motion
Injuring yourself by not performing the tackle appropriately
Tripping over when running
These risks have been combated in the following ways to reduce the risks associated with the test;
All participants will wear clothing on their lower body to eliminate the risk of friction burn
occurring
All participants are aware of the sliding tackle and how to perform this motion, thus
negating the risk of injury from incorrect technique
What happens to the information in the project? The University of Strathclyde is registered with the Information Commissioner's office who
implements the Data Protection Act 1998. All of the personal data on participants will be processed
in accordance with the Data Protection Act 1998.
The data collected from the videos will be analysed and the results will be given a random number
which will be associated with the videos of the subject in a different document. This will allow for
the anonymity of the subjects to be retained following the trials while still allowing for the data to be

Craig Ingham 67
removed from the study if requested by a subject. The results of the testing will be included in the
final report of the project but the names of participants will not be included.
The data will be stored on University computers with a back-up copy on the H drive. A copy will also
be stored on a personal USB drive in an encrypted folder to prevent any wrongful access to the data.
Some staff members involved in the investigation may have access to the data, but it will be stored
on password protected computers.
What happens next? If you agree to participate in the study you will be asked to sign the attached consent form to
confirm this.
There will be no detriment to you if you choose not to participate in the study and similarly you may
withdraw from the investigation at any time if you wish.
If you have any questions at any time after the study, feel free to contact myself (details at the top of
the sheet)
Researcher Contact Details: Name - Craig Ingham
Telephone - 0781848810
Email - [email protected]
Chief Investigator Details: Name - Muhammad Amir
Telephone - 0141 548 3007
Email - [email protected]
If you have any questions/concerns, during or after the investigation, or wish to contact an independent person to whom any questions may be directed or further information may be sought from, please contact:
Secretary to the University Ethics Committee Research & Knowledge Exchange Services University of Strathclyde Graham Hills Building 50 George Street Glasgow G1 1QE
Telephone: 0141 548 3707 Email: [email protected]

Craig Ingham 68
14.3 Appendix 3 - Consent Form
Consent Form Name of department: Department of Design, Manufacture and Engineering Management Title of the study: Investigation into the biomechanics of a soccer sliding tackle
I confirm that I have read and understood the information sheet for the above project and the researcher has answered any queries to my satisfaction.
I understand that my participation is voluntary and that I am free to withdraw from the project at any time, without having to give a reason and without any consequences.
I understand that I can withdraw my data from the study at any time. I understand that any information recorded in the investigation will remain confidential
and no information that identifies me will be made publicly available. I am aware that withdrawing from the study will not affect my standing in the
university in any way. I confirm that I meet the inclusion/exclusion criteria outlines in the participation
information sheet. I consent to being recorded by video during the trials. I consent to being a participant in the project.
(PRINT NAME)
Hereby agree to take part in the above project
Signature of Participant: